
Effect of UV-C Radiation, Ultra-Sonication Electromagnetic Field and Microwaves on Changes in Polyphenolic Compounds in Chokeberry (Aronia melanocarpa)


Abstract
:1. Introduction
2. Results
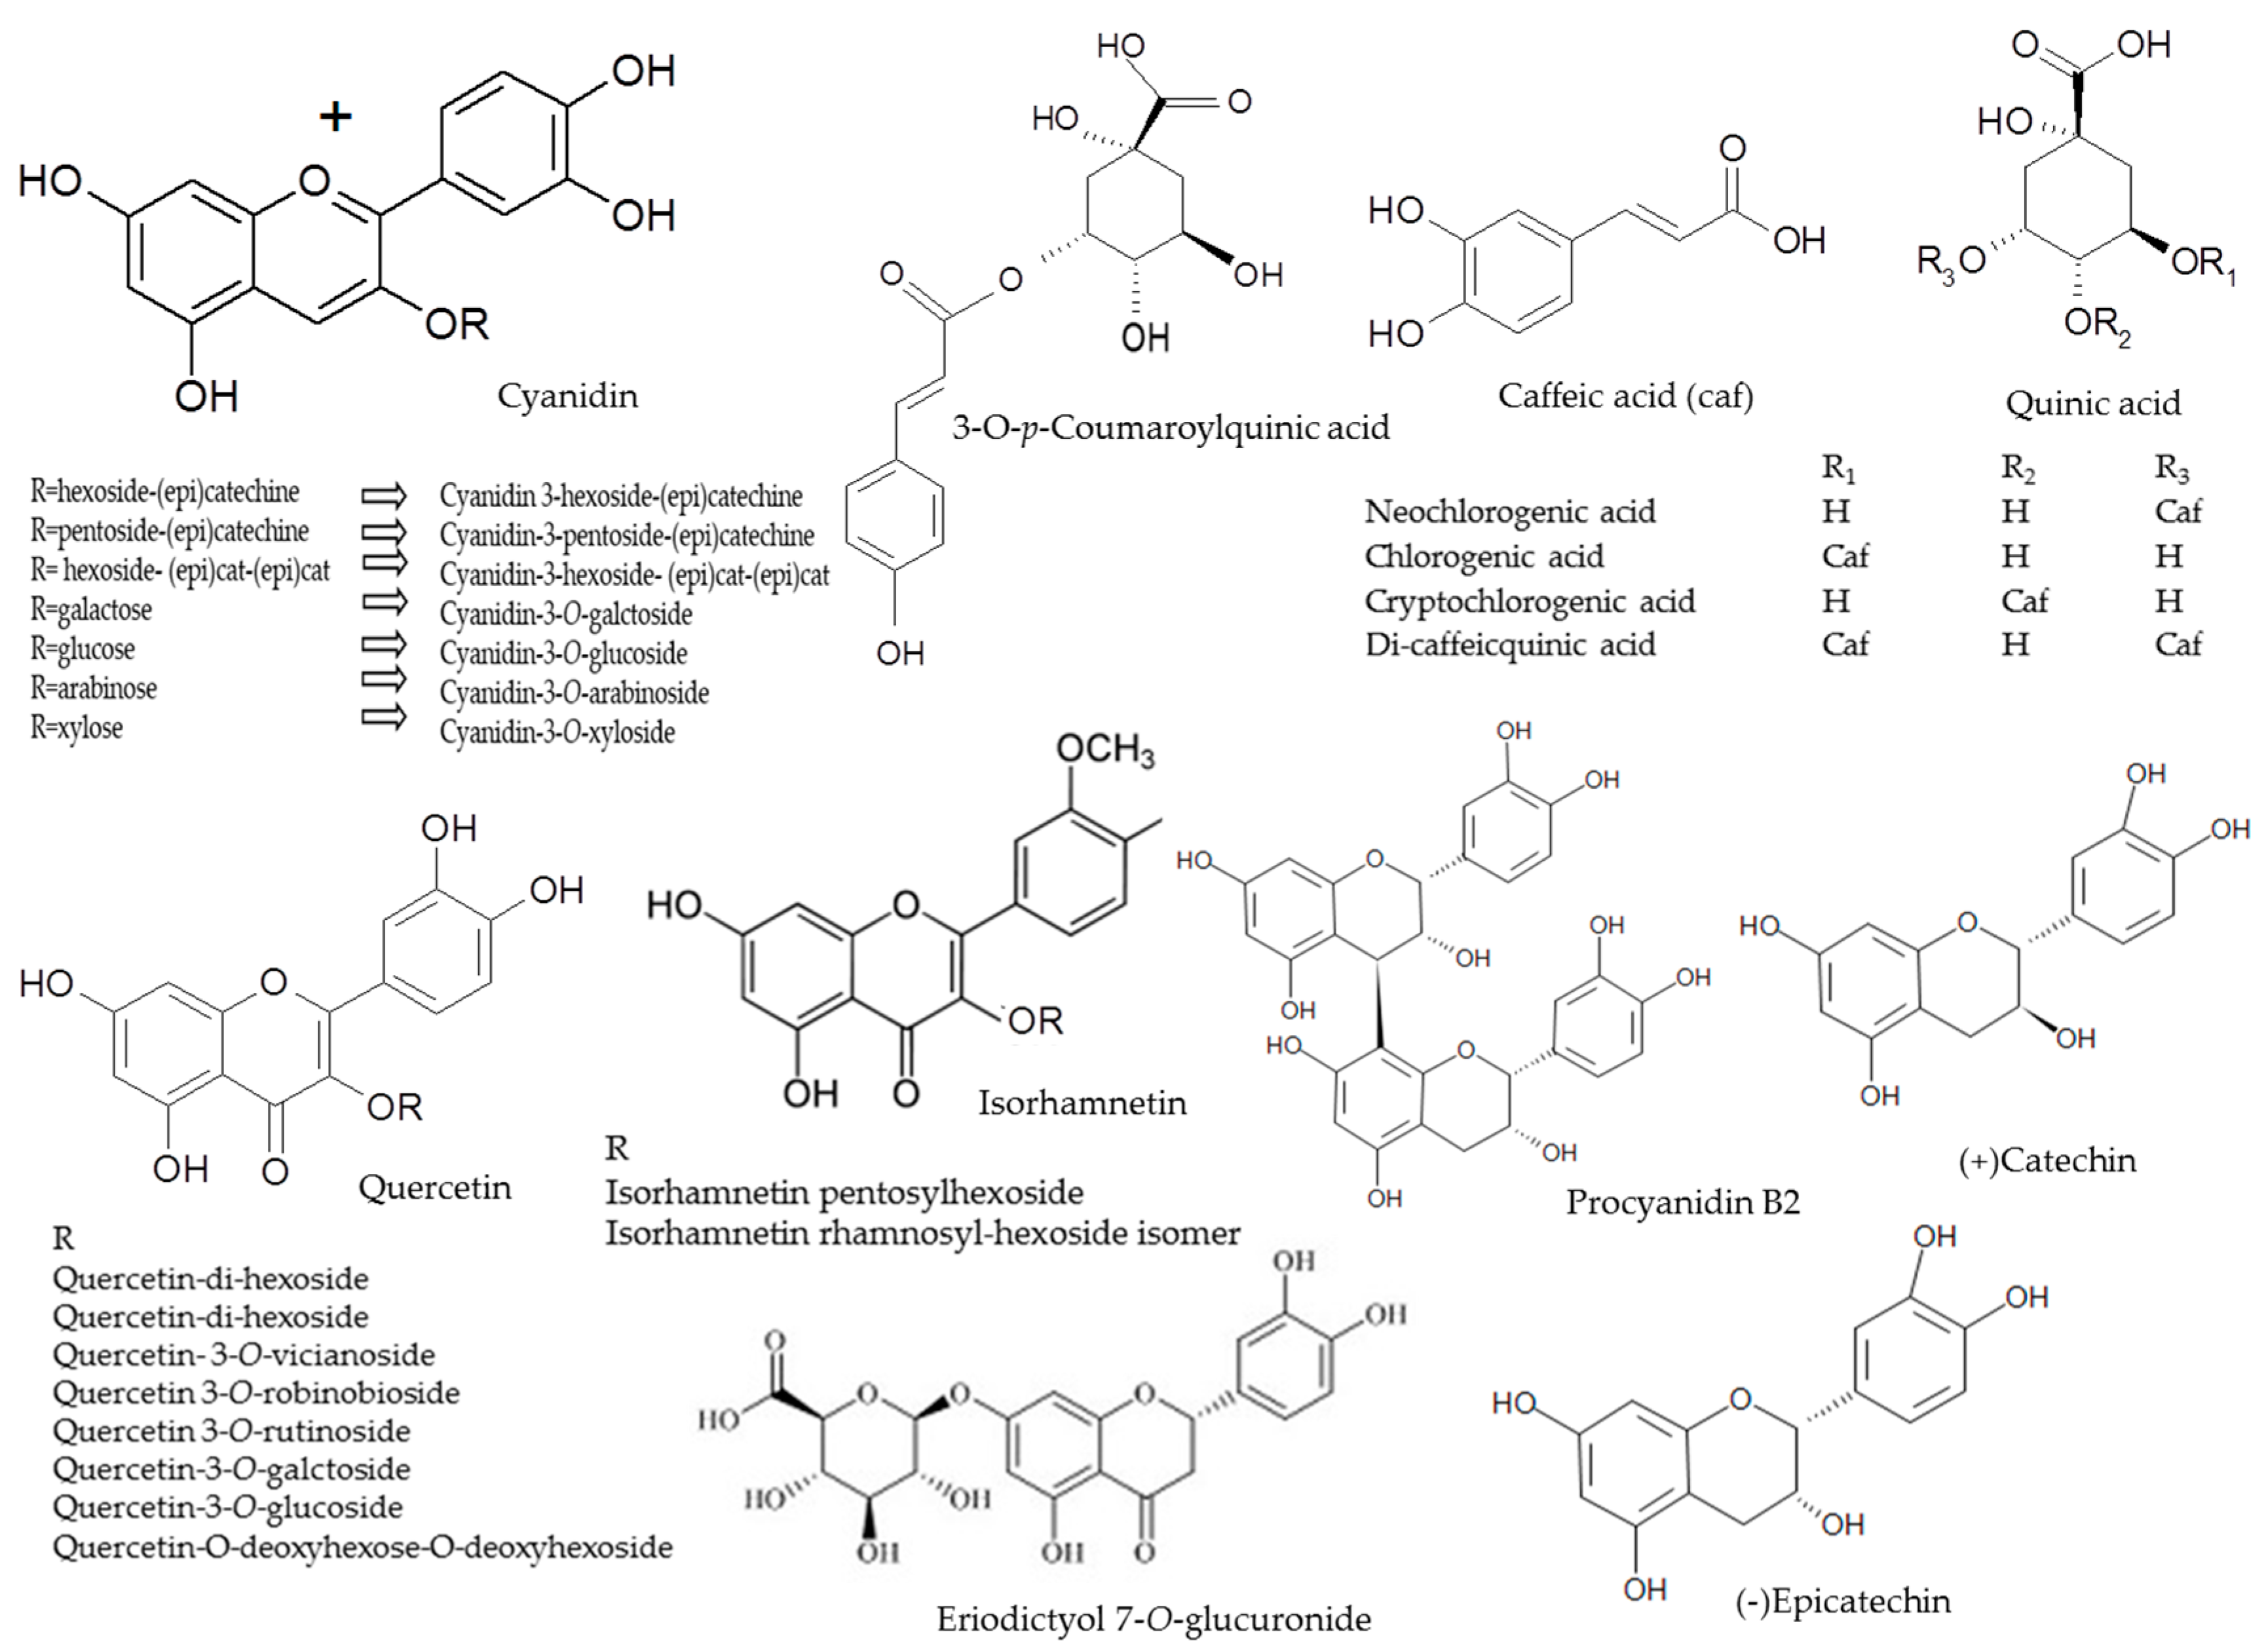
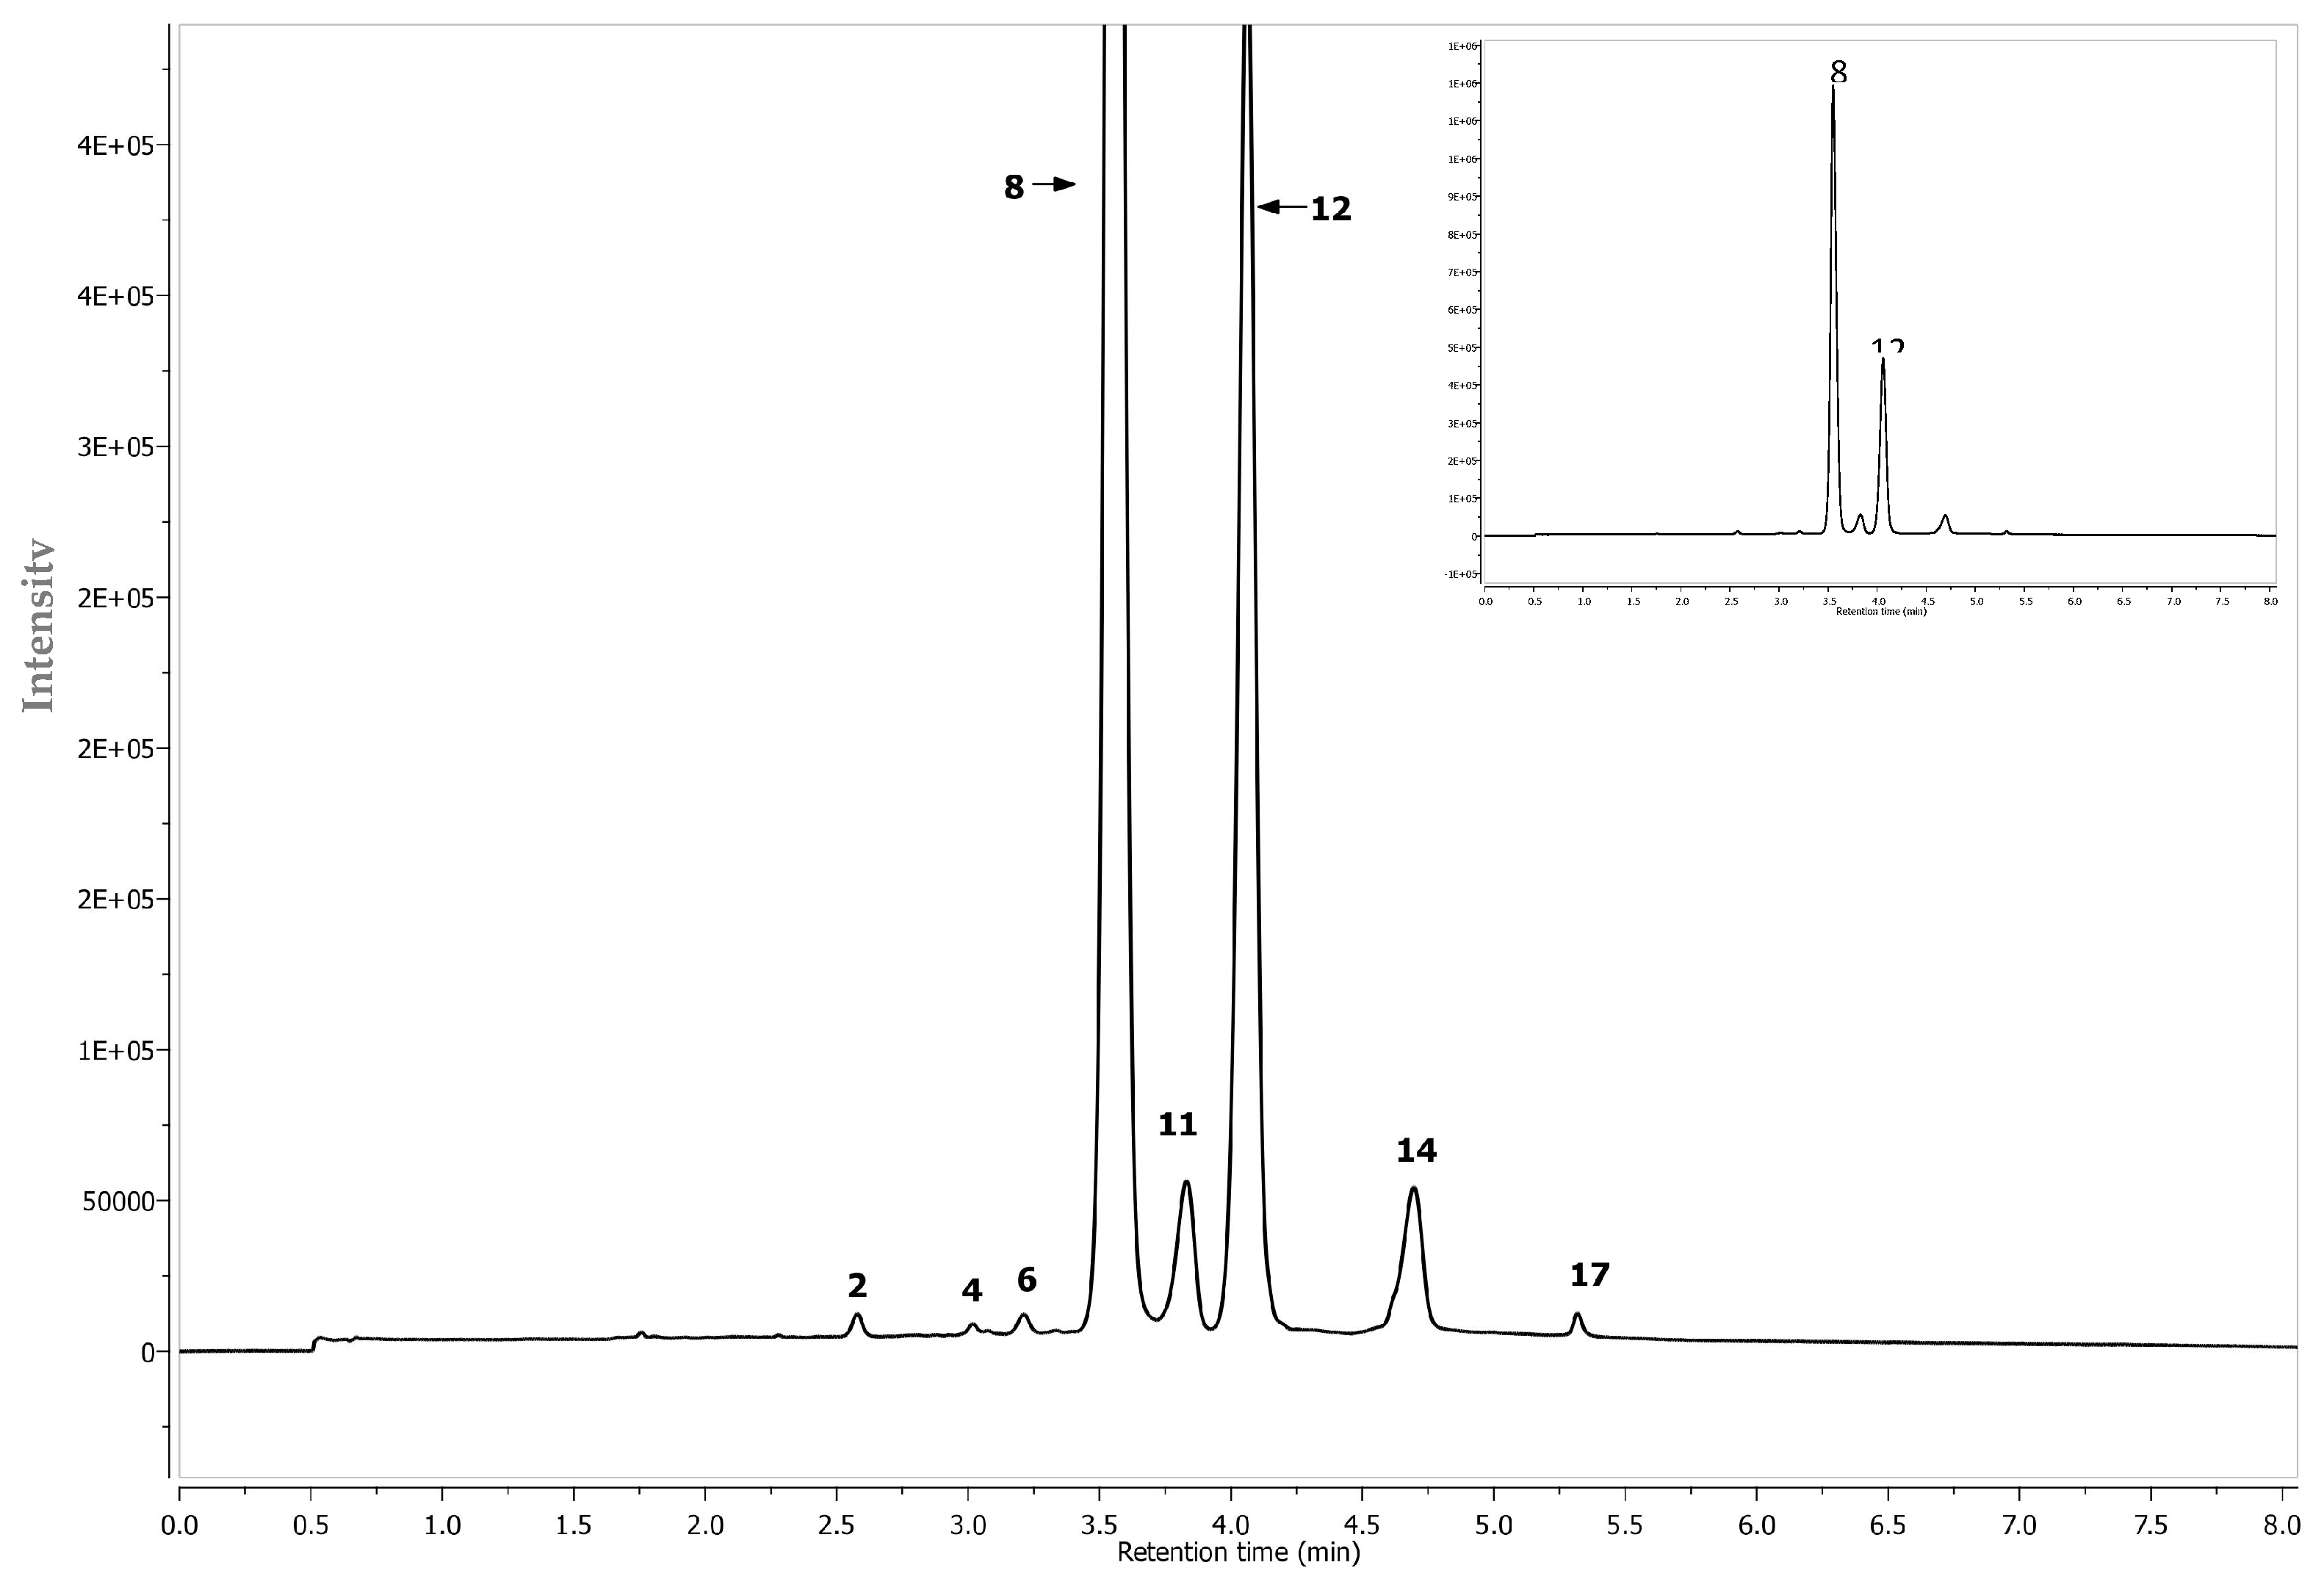
2.1. Anthocyanins
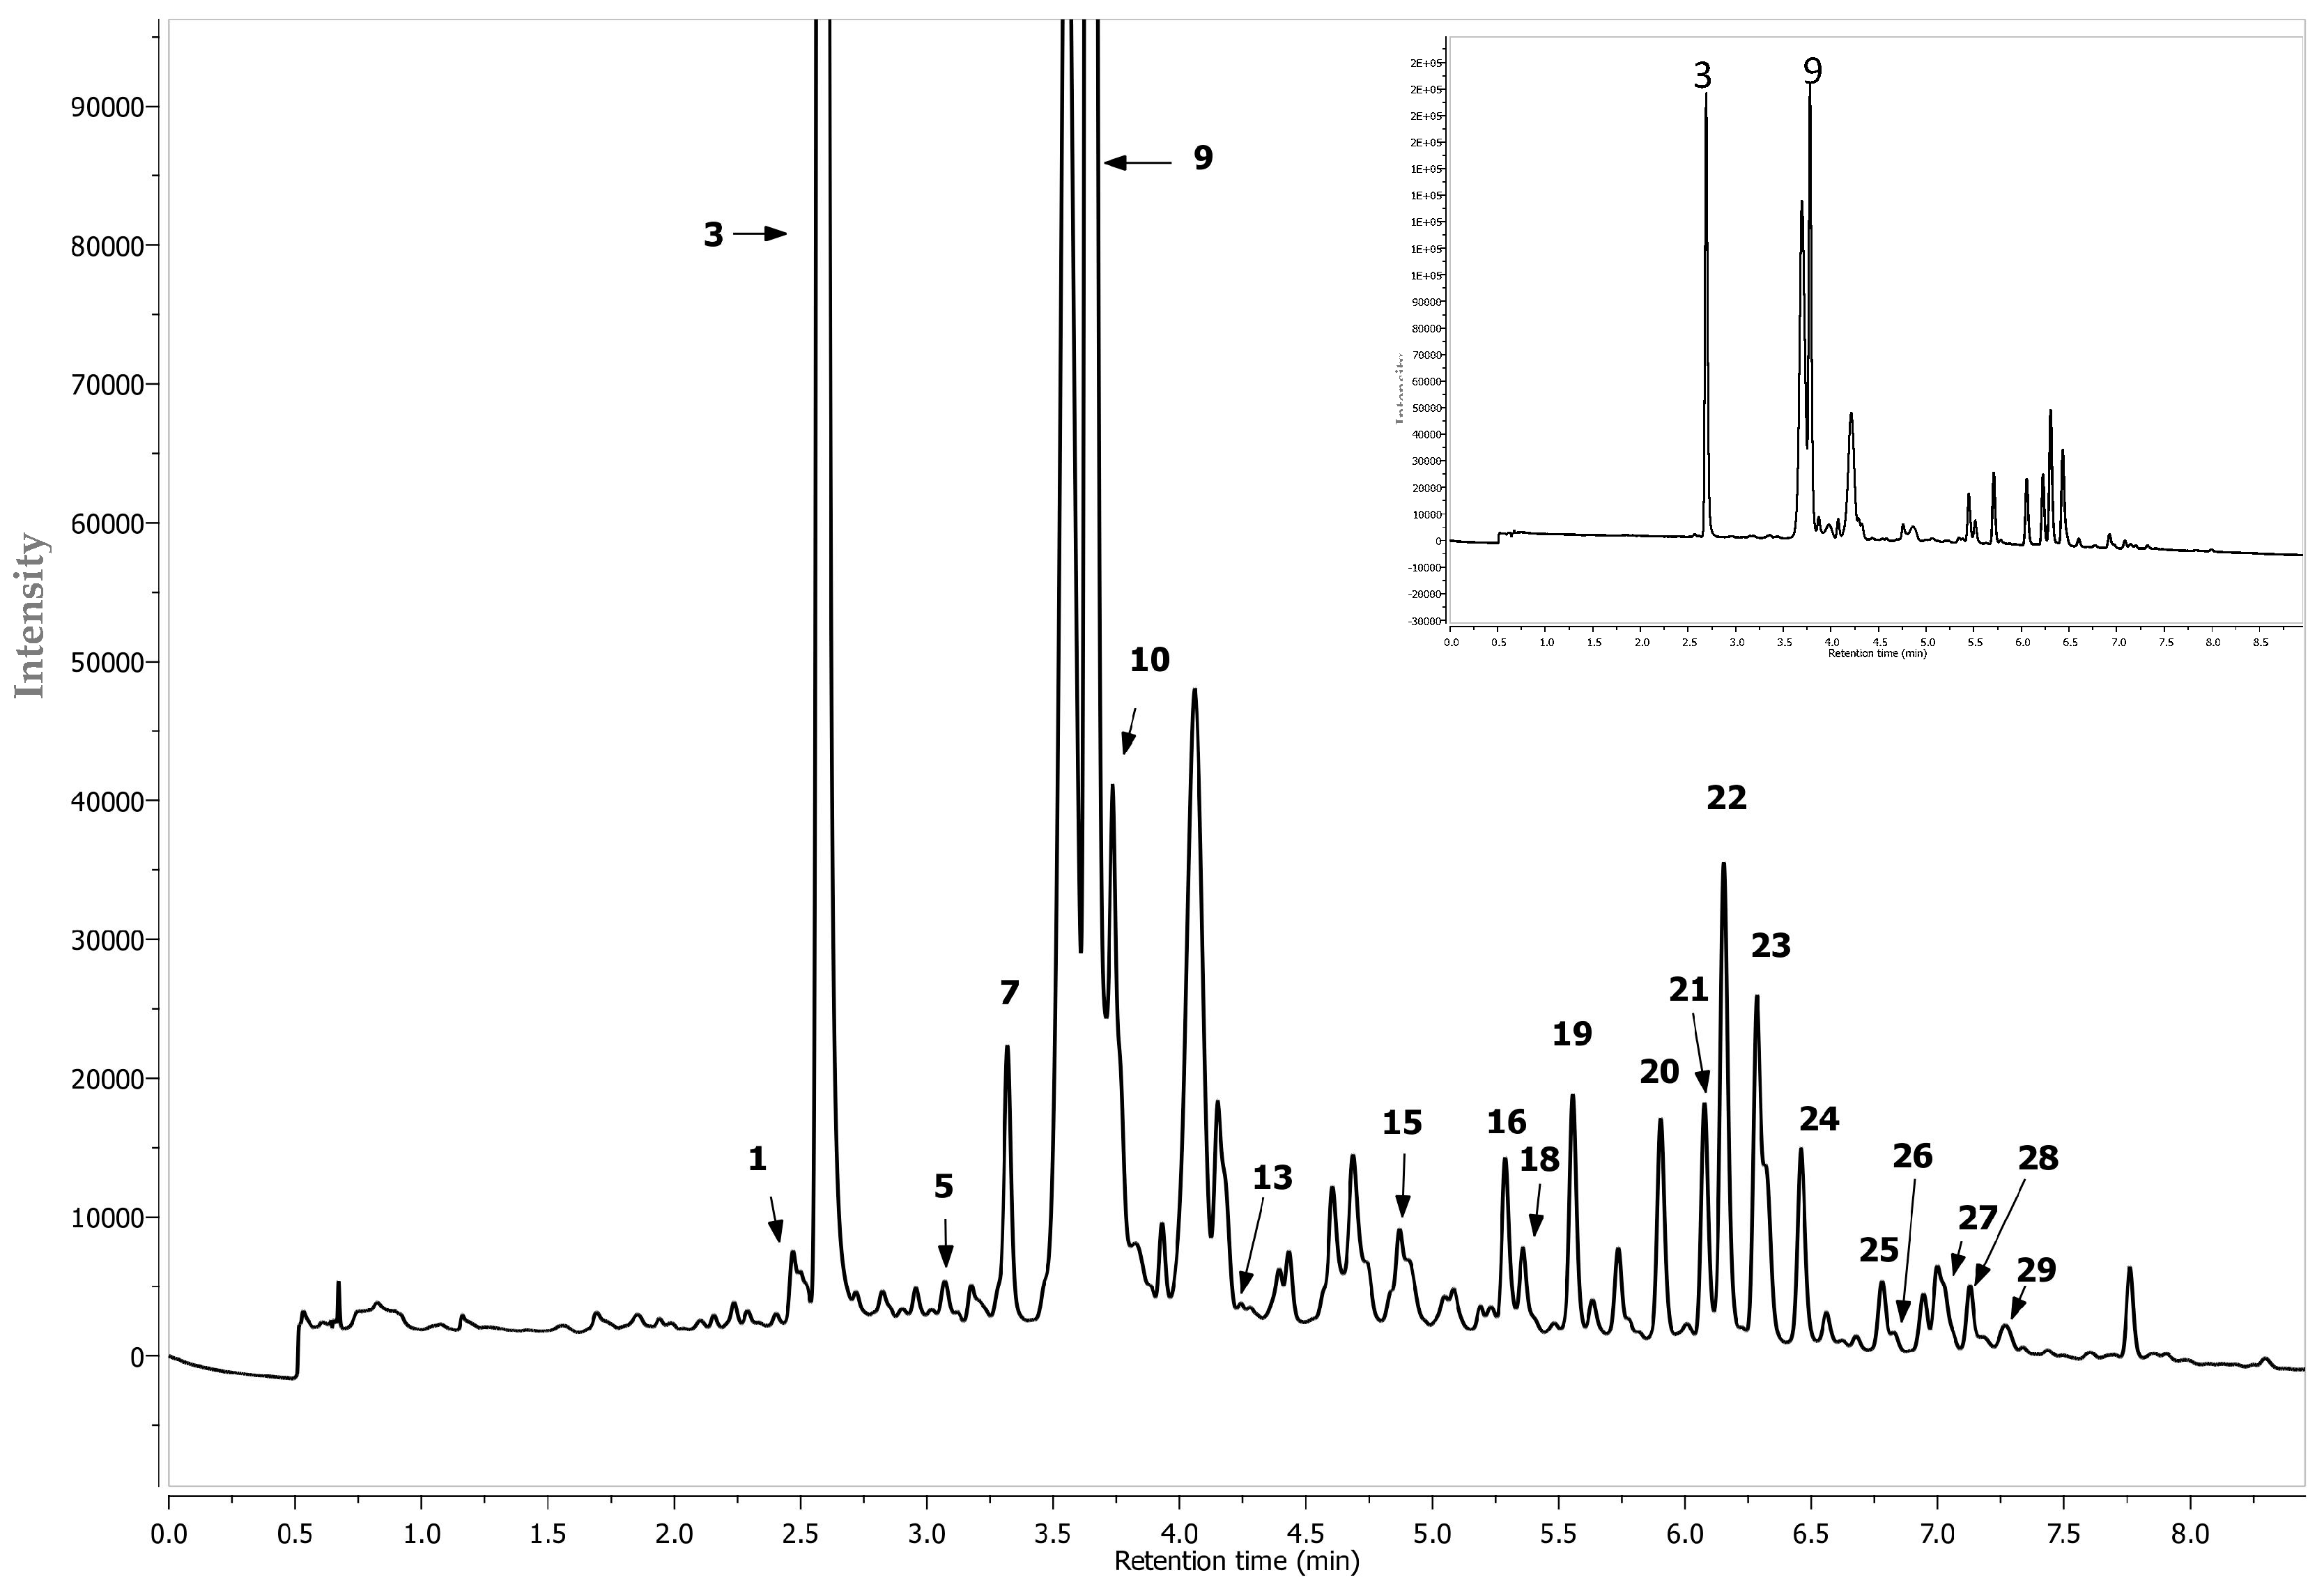
2.2. Phenolic Acids
2.3. Flavonols
2.4. Flavan-3-ols
3. Discussion
4. Materials and Methods
4.1. Reagents and Standards
4.2. The Experimental Material
- CP—for a control sample;
- UV—for UV-C irradiation by for 20 min;
- UV—for UV-C irradiation for 40 min;
- UV—for UV-C irradiation for 60 min;
- MFL—for an electromagnetic field (150 μT, 100 Hz, 30 min);
- MFL—for an electromagnetic field (150 μT, 100 Hz, 60 min);
- MFH—for an electromagnetic field (40 mT, 50 Hz, 0.5 min);
- MFH—for an electromagnetic field (40 mT, 50 Hz, 2 min);
- MFH—for an electromagnetic field (40 mT, 50 Hz, 5 min);
- MW—for microwaves (100 W, 1 min);
- MW—for microwaves (100 W, 2 min);
- MW—for microwaves (180 W, 1 min);
- US—for ultrasonication (800 W, 40 Hz, 2 min);
- US—for ultrasonication (800 W, 40 Hz, 4 min);
- US—for ultrasonication (800 W, 40 Hz, 8 min).
4.3. Extraction
4.4. Identification and Quantification of Polyphenols by the UPLC-PDA-MS Method
4.5. Statistical Analysis
5. Conclusions
Acknowledgments
Author Contributions
Conflicts of Interest
References
- Šnebergrová, J.; Čížková, H.; Neradová, E.; Kapci, B.; Rajchl, A.; Voldřich, M. Variability of Characteristic Components of Aronia. Czech J. Food Sci. 2014, 32, 25–30. [Google Scholar]
- Kulling, S.E.; Rawel, H.M. Chokeberry (Aronia melanocarpa)—A Review on the Characteristic Components and Potential Health Effects. Planta Med. 2008, 74, 1625–1634. [Google Scholar] [CrossRef] [PubMed]
- Oszmiański, J.; Wojdyło, A. Aronia melanocarpa phenolics and their antioxidant activity. Eur. Food Res. Technol. 2005, 221, 809–813. [Google Scholar] [CrossRef]
- Park, S.; Kim, J.I.; Lee, I.; Lee, S.; Hwang, M.W.; Bae, J.Y.; Heo, J.; Kim, D.; Han, S.Z.; Park, M.S. Aronia melanocarpa and its components demonstrate antiviral activity against influenza viruses. Biochem. Biophys. Res. Commun. 2013, 440, 14–19. [Google Scholar] [CrossRef] [PubMed]
- Kokotkiewicz, A.; Jaremicz, Z.; Luczkiewicz, M. Aronia Plants: A Review of Traditional Use. Biological Activities. And Perspectives for Modern Medicine. J. Med. Food 2010, 13, 255–269. [Google Scholar] [CrossRef] [PubMed]
- Ho, G.T.T.; Bräunlich, M.; Austarheim, I.; Wangensteen, H.; Malterud, K.E.; Slimestad, R.; Barsett, H. Immunomodulating Activity of Aronia melanocarpa Polyphenols. Int. J. Mol. Sci. 2014, 15, 11626–11636. [Google Scholar] [CrossRef] [PubMed]
- Fang, J. Classification of fruits based on anthocyanin types and relevance to their health effects. Nutrition 2015, 31, 1301–1306. [Google Scholar] [CrossRef] [PubMed]
- Quinlan, C.L.; Perevoshchikova, I.V.; Hey-Mogensen, M.; Orr, A.L.; Brand, M.D. Sites of reactive oxygen species generation by mitochondria oxidizing different substrates. Redox Biol. 2013, 1, 304–312. [Google Scholar] [CrossRef] [PubMed]
- Yao, L.H.; Jiang, Y.M.; Shi, J.; Tomas-Barber, F.A.; Datta, N.; Singanusong, R.; Chen, S.S. Flavonoids in Food and Their Health Benefits. Plant Foods Hum. Nutr. 2004, 59, 113–122. [Google Scholar] [CrossRef] [PubMed]
- Lachowicz, S.; Oszmiański, J.; Pluta, S. The composition of bioactive compounds and antioxidant activity of Saskatoon berry (Amelanchier alnifolia Nutt.) genotypes grown in central Poland. Food Chem. 2017, 235, 234–243. [Google Scholar] [CrossRef] [PubMed]
- Bochkov, D.V.; Sysolyatin, S.V.; Kalashnikov, A.I.; Surmacheva, I.A. Shikimic acid: Review of its analytical, isolation, and purification techniques from plant and microbial sources. J. Chem. Biol. 2012, 5, 5–17. [Google Scholar] [CrossRef] [PubMed]
- Kováčik, J.; Klejdu, B.; Bačkor, M.; Repčak, M. Phenylalanine ammonia-lyase activity and phenolic compounds accumulation in nitrogen-deficient Matricaria chamomilla leaf rosettes. Plant Sci. 2007, 172, 393–399. [Google Scholar] [CrossRef]
- Gill, S.S.; Tuteja, N. Reactive oxygen species and antioxidant machinery in abiotic stress tolerance in crop plants. Plant Physiol. Biochem. 2010, 48, 909–930. [Google Scholar] [CrossRef] [PubMed]
- Ke, D.; Saltveit, M.E. Plant Hormone Interaction and Phenolic Metabolism in the Regulation of Russet Spotting in Iceberg Lettuce. Plant Physiol. 1988, 88, 1136–1140. [Google Scholar] [CrossRef] [PubMed]
- Hasanuzzaman, M.; Hossain, M.A.; Teixeira da Silva, J.A.; Fujita, M. Plant Response and Tolerance to Abiotic Oxidative Stress: Antioxidant Defense Is a Key Factor. Crop Stress Manag. Perspect. Strateg. 2012, 8, 262–315. [Google Scholar]
- Yu, J.; Engeseth, N.J.; Feng, H. High Intensity Ultrasound as an Abiotic Elicitor—Effects on Antioxidant Capacity and Overall Quality of Romaine Lettuce. Food Bioprocess Technol. 2016, 9, 262–273. [Google Scholar] [CrossRef]
- Mittler, R. Oxidative stress. Antioxidants and stress tolerance. Trends Plant Sci. 2002, 7, 405–410. [Google Scholar] [CrossRef]
- Mirouze, M.; Paszkowski, J. Epigenetic contribution to stress adaptation in plants. Curr. Opin. Plant Biol. 2011, 14, 267–274. [Google Scholar] [CrossRef] [PubMed]
- Kosová, K.; Vítámvása, P.; Prášila, I.T.; Renautb, J. Plant proteome changes under abiotic stress—Contribution of proteomics studies to understanding plant stress response. J. Proteom. 2011, 7, 1301–1322. [Google Scholar] [CrossRef] [PubMed]
- Slavin, J.L.; Lloyd, B. Health Benefits of Fruits and Vegetables. Adv. Nutr. 2012, 3, 506–516. [Google Scholar] [CrossRef] [PubMed]
- Liu, C.; Cai, L.Y.; Lu, X.Y.; Han, X.X.; Ying, T.J. Effect of Postharvest UV-C Irradiation on Phenolic Compound Content and Antioxidant Activity of Tomato Fruit During Storage. J. Integr. Agric. 2012, 11, 159–165. [Google Scholar] [CrossRef]
- Kwiatkowska, B.; Bennett, J.; Akunna, J.; Walker, G.M.; Bremner, D.H. Stimulation of bioprocesses by ultrasound. Biotechnol. Adv. 2011, 29, 768–780. [Google Scholar] [CrossRef] [PubMed]
- Wu, J.; Lin, L. Ultrasound-Induced Stress Responses of Panax ginseng Cells: Enzymatic Browning and Phenolics Production. Biotechnol. Prog. 2002, 18, 862–866. [Google Scholar] [CrossRef] [PubMed]
- Santos, J.G.; Fernandes, F.A.N.; Oliveira, L.S.; Miranda, M.R.A. Influence of Ultrasound on Fresh-Cut Mango Quality through evaluation of enzymatic and oxidative metabolism. Food Bioprocess Technol. 2015, 8, 1532–1542. [Google Scholar] [CrossRef]
- Randhir, R.; Shetty, K. Microwave-induced stimulation of l-DOPA, phenolics and antioxidant activity in fava bean (Vicia faba) for Parkinson’s diet. Process Biochem. 2004, 39, 1775–1784. [Google Scholar] [CrossRef]
- Sales, J.M.; Resurreccion, A.V.A. Phenolic profile, antioxidants and sensory acceptance of bioactive-enhanced peanuts using ultrasound and UV. Food Chem. 2010, 122, 795–803. [Google Scholar] [CrossRef]
- Alothman, M.; Bhat, R.; Karim, A.A. UV radiation-induced changes of antioxidant capacity of fresh-cut tropical fruits. Innov. Food Sci. Emerg. 2009, 10, 512–516. [Google Scholar] [CrossRef]
- Shabrangi, A.; Majd, A. Efect of Magnetic Fields on Growth and Antioxidant Systems in Agricultural Plants. PIERS Proc. 2009, 23-27, 1142–1147. [Google Scholar]
- Belyavskaya, N.A. Biological effects due to weak magnetic field on plants. Adv. Space. Res. 2004, 34, 1566–1574. [Google Scholar] [CrossRef] [PubMed]
- Nabizadeh, S.; Majd, A.; Arbabiyan, S.; Mirzai, M.; Sharifnia, F. Assessment of the Effect of Electromagnetic Fields on Biochemical and Antioxidant Parameter Changes of Cucurbita maxima Duchesne. Adv. Environ. Biol. 2014, 8, 185–193. [Google Scholar]
- Lachowicz, S.; Oszmiański, J.; Seliga, Ł.; Pluta, S. Phytochemical Composition and Antioxidant Capacity of Seven Saskatoon Berry (Amelanchier alnifolia Nutt.) Genotypes Grown in Poland. Molecules 2017, 22, 853. [Google Scholar] [CrossRef] [PubMed]
- Lee, J.E.; Kim, G.S.; Park, S.; Kim, Y.H.; Kim, M.B.; Lee, W.S.; Jeong, S.W.; Lee, S.J.; Sung, J.J.; Shin, S. ChDetermination of chokeberry (Aronia melanocarpa) polyphenol components using liquid chromatography–tandem mass spectrometry: Overall contribution to antioxidant activity. Food Chem. 2014, 146, 1–5. [Google Scholar] [CrossRef] [PubMed]
- Mikulic-Petkovsek, M.; Slatnar, A.; Stampar, F.; Veberic, R. HPLC–MS identification and quantification of flavonol glycosides in 28 wild and cultivated berry species. Food Chem. 2012, 135, 2138–2146. [Google Scholar] [CrossRef] [PubMed]
- Oszmiański, J.; Lachowicz, S. Effect of the production of dried fruits and juice from chokeberry (Aronia melanocarpa L.) on the content and antioxidative activity of bioactive compounds. Molecules 2016, 21, 1098. [Google Scholar] [CrossRef] [PubMed]
Sample Availability: Samples of the compounds are not available from the authors. |


| Abiotic Stress Factors | |||||||||||||||
|---|---|---|---|---|---|---|---|---|---|---|---|---|---|---|---|
| CP | UV | MFL | MFH | MW | US | ||||||||||
| Control | 20 | 40 | 60 | 30 | 60 | 0.5 | 2 | 5 | 1 | 2 | 0.5 | 2 | 4 | 8 | |
| Anthocyanins | |||||||||||||||
| Cyanidin-3-hexoside-(epi)catechin | 11.70 ** | 13.90 * | 12.90 * | 16.10 * | 9.10 * | 12.50 | 12.60 * | 12.00 | 5.99 * | 15.40 * | 14.10 * | 12.80 * | 12.30 | 16.90 * | 15.70 * |
| Cyanidin-3-pentoside-(epi)catechin | 8.78 ** | 8.08 | 9.19 | 10.30 * | 6.03 * | 8.33 | 9.82 | 8.84 | 4.09 * | 10.30 | 9.81 | 8.96 | 8.13 | 11.30 * | 10.20 * |
| Cyanidin-3-hexoside- (epi)cat-(epi)cat | 14.90 ** | 15.40 | 13.80 | 18.20 * | 9.95 * | 13.50 | 16.30 | 14.10 | 4.30 * | 10.30 * | 18.20 * | 15.80 | 13.00 * | 19.40 * | 17.50 * |
| Cyanidin-3-O-galactoside | 3367 ** | 3607 | 3637 | 3394 | 2322 * | 2945 * | 3405 | 3311 | 2608 * | 3717 | 3678 | 3266 | 3050 | 3797 * | 4033 * |
| Cyanidin-3-O-glucoside | 149 ** | 164 | 158 | 155 | 108 * | 152 | 164 | 159.5 | 119 * | 164 | 173 * | 155 | 133 | 170 * | 188 * |
| Cyanidin-3-O-arabinoside | 1454 ** | 1579 | 1584 | 1501 | 1002 * | 1309 | 1516 | 1462 | 1119 * | 1596 | 1617 | 1391 | 1314 | 1635 * | 1826 * |
| Cyanidin-3-O-xyloside | 165 ** | 171 | 181 | 164 | 127 * | 168 | 176 | 174 | 129 * | 174 | 185 | 174 | 145 * | 186 * | 219 * |
| Cyanidin | 2.68 ** | 4.32 * | 3.48 * | 2.58 | 1.89 * | 1.95 | 4.91 * | 4.69 * | 2.54 | 4.71 * | 2.92 | 5.13 * | 3.32 * | 2.00 * | 6.25 * |
| Phenolic acids | |||||||||||||||
| Neochlorogenic acid | 1250 ** | 1276 | 1087 * | 1242 | 858 * | 1372 | 1396 | 1367 | 997 * | 1225 | 1380 | 1180 | 1167 | 1418 * | 1340 |
| 3-O-p-coumaroylquinic acid | 10.7 ** | 11.3 | 9.71 | 11.2 | 7.63 * | 12.7 * | 12.6 * | 12.3 * | 8.7 * | 11.2 | 13.0 * | 10.9 | 10.7 | 12.4 * | 12.1 * |
| Chlorogenic acid | 740 ** | 862 * | 806 | 831 * | 592 * | 913 * | 884 | 886 * | 729 | 847 * | 970 * | 868 * | 793 | 976 * | 894 * |
| Cryptochlorogenic acid | 25.5 ** | 27.9 | 36.4 * | 29.3 * | 19.2 * | 33.6 * | 31.0 * | 29.9 * | 27.1 | 28.6 | 33.2 * | 27.0 | 26.3 | 31.9 * | 31.4 * |
| Di-caffeic quinic acid I | 3.76 ** | 3.83 | 3.37 | 3.92 | 2.48 * | 3.77 | 4.14 | 4.16 | 3.17 * | 3.73 | 4.17 | 3.88 | 3.61 | 4.47 * | 3.99 |
| Di-caffeic quinic acid II | 0.86 ** | 0.28 * | 0.56 * | 0.51 * | 0.54 * | 0.94 | 0.96 | 1.05 * | 0.78 | 1.21 * | 0.85 | 0.72 * | 0.73 * | 1.09 * | 1.5 * |
| Flavonols | |||||||||||||||
| Quercetin-dihexoside | 10.90 ** | 13.40 * | 11.80 | 14.10 * | 9.24 * | 16.50 * | 15.50 * | 14.80 * | 11.60 | 14.90 * | 16.10 * | 15.70 * | 12.80 * | 17.30 * | 14.50 * |
| Quercetin-dihexoside | 5.63 ** | 6.71 * | 6.15 | 6.58 * | 4.37 * | 8.16 * | 7.79 * | 6.92 * | 5.64 | 7.23 * | 8.01 * | 7.00 * | 6.33 * | 8.25 * | 7.34 * |
| Quercetin-3-O-vicianoside | 14.20 ** | 16.20 * | 14.30 | 18.60 * | 11.90 * | 22.00 * | 21.20 * | 19.30 * | 15.70 | 19.60 * | 21.30 * | 21.10 * | 17.20 * | 22.10 * | 18.80 * |
| Quercetin-3-O-robinobioside | 22.50 ** | 24.90 | 24.30 | 26.20 * | 16.10 * | 25.20 | 26.30 * | 23.80 | 18.70 * | 27.40 * | 28.20 * | 23.40 * | 20.90 | 28.50 * | 27.60 * |
| Quercetin-3-O-rutinoside | 31.70 ** | 36.20 * | 33.30 | 38.60 * | 24.30 * | 40.10 * | 40.60 * | 36.00 * | 28.90 | 39.80 * | 42.00 * | 36.40 * | 32.60 | 44.70 * | 39.40 * |
| Quercetin-3-O-galctoside | 39.90 ** | 48.50 * | 44.20 | 51.60 * | 33.00 * | 52.10 * | 56.00 * | 47.00 * | 39.40 | 57.90 * | 54.90 * | 46.10 * | 45.50 * | 60.20 * | 54.60 * |
| Quercetin-3-O-glucoside | 33.20 ** | 39.10 * | 36.40 | 40.30 * | 25.80 * | 40.90 * | 43.00 * | 36.50 | 31.40 | 44.00 * | 44.30 * | 35.40 * | 35.50 | 46.20 * | 43.80 * |
| Isorhamnetin pentosylhexoside | 1.62 ** | 1.57 | 1.59 | 1.74 | 1.17 * | 1.39 * | 1.77 | 1.72 | 1.27 * | 1.90 * | 2.28 * | 1.73 | 1.54 | 2.00 * | 2.12 * |
| Quercetin-O-deoxyhexose-O-deoxyhexoside | 6.91 ** | 8.29 * | 8.33 * | 8.41 * | 5.37 * | 8.84 * | 8.94 * | 8.72 * | 6.96 | 9.43 * | 9.78 * | 8.42 * | 7.23 | 9.77 * | 9.32 * |
| Isorhamnetin rhamnosylhexosideisomer | 1.13 ** | 1.36 * | 1.39 * | 1.41 * | 0.96 * | 1.77 * | 1.65 * | 1.64 * | 1.07 | 1.35 * | 1.84 * | 1.41 * | 1.23 | 2.12 * | 1.37 * |
| Isorhamnetin rhamnosylhexosideisomer | 1.04 ** | 1.05 | 1.86 * | 1.06 | 1.00 | 1.02 | 1.00 | 1.96 * | 1.69 * | 1.37 * | 1.34 * | 1.56 * | 1.23 | 1.42 * | 1.24 * |
| Flavan-3-ols | |||||||||||||||
| Procyanidin B2 | 66.6 ** | 55.6 * | 66.4 | 77.9 * | 46.1 * | 86.0 * | 80.1 * | 78.3 * | 48.8 | 70.3 | 77.7 * | 68.8 | 65.1 | 92.0 * | 81.6 * |
| (+)Catechin | 71.4 ** | 79.9 | 36.5 * | 80.7 * | 56.3 * | 101.8 * | 86.1 * | 79.7 | 35.9 * | 82.0 * | 93.6 * | 78.5 | 70.3 | 93.9 * | 88.6 * |
| Procyanidin B2 | 25.7 ** | 23.5 | 21.2 * | 23.8 | 17.4 * | 30.7 * | 24.8 | 32.2 * | 11.7 * | 22.8 * | 26.8 | 20.1 * | 24.6 | 29.0 * | 27.3 |
| (−)Epicatechin | 62.0 ** | 63.6 | 57.6 | 64.3 | 41.0 * | 75.3 * | 69.1 | 70.1 * | 40.2 * | 65.6 | 72.9 * | 58.5 | 59.3 | 79.7 * | 67.9 |
| Flawanones | |||||||||||||||
| Eriodictyol 7-O-glucuronide | 58.0 ** | 67.30 * | 58.60 | 63.00 | 42.60 * | 65.20 * | 41.20 | 64.10 | 54.70 | 67.00 * | 71.60 * | 58.40 | 60.80 | 74.90 * | 73.30 |
| ΣPC | 7125 | 7659,00 | 7453 | 7287 | 5009 | 6859 | 7541 | 7200 | 5701 | 7723 | 8003 | 7034 | 6602 | 8182 | 8500 |
| Peak | Assigned Identity | RT | [M − H]+ | Fragment Ions | Absorbance Maxima |
|---|---|---|---|---|---|
| No. | (min) | (m/z) | (m/z) | (nm) | |
| 1 | Procyanidin B2 2 | 2.46 | 577 | 425, 289 | 280 |
| 2 | Cyanidin-3-hexoside-(epi)catechin 2 | 2.55 | 737 + | 575, 423, 287 | 242, 520 |
| 3 | Neochlorogenic acid 1 | 2.56 | 353 | 191 179 | 322 |
| 4 | Cyanidin-3-pentoside-(epi)catechin 2 | 2.99 | 707 + | 557, 329, 287 | 283, 524 |
| 5 | (+) Catechin 1 | 3.04 | 289 | - | 283 |
| 6 | Cyanidin-3-hexoside- (epi)cat-(epi)cat 2 | 3.17 | 1025 + | 575, 409, 287 | 283, 519 |
| 7 | 3-O-p-Coumaroylquinic acid 2 | 3.3 | 337 | 191 | 310 |
| 8 | Cyanidin-3-O-galctoside 1 | 3.51 | 449 + | 287 | 279, 514 |
| 9 | Chlorogenic acid 1 | 3.62 | 353 | 191, 179 | 322 |
| 10 | Cryptochlorogenic acid 1 | 3.71 | 353 | 191, 179 | 318 |
| 11 | Cyanidin-3-O-glucoside 1 | 3.81 | 449 + | 287 | 279, 514 |
| 12 | Cyanidin-3-O-arabinoside 1 | 4.03 | 419 + | 287 | 279, 514 |
| 13 | Procyanidin B2 1 | 4.21 | 577 | 425, 289 | 280 |
| 14 | (−)Epicatechin 1 | 4.89 | 289 | - | 277 |
| 15 | Cyanidin-3-O-xyloside 1 | 4.68 | 419 + | 287 | 279, 514 |
| 16 | Quercetin-di-hexoside 2 | 5.26 | 625 | 445, 301 | 255, 353 |
| 17 | Cyanidin 2 | 5.29 | 287 + | 287 | 280, 514 |
| 18 | Quercetin-di-hexoside 2 | 5.33 | 625 | 445,301 | 263, 355 |
| 19 | Quercetin-3-O-vicianoside (or Quercetin-6-O-arabinopyranosyl-d-glucopyranose (3-O-vicianoside) 2 | 5.52 | 595 | 432, 301 | 255, 353 |
| 20 | Quercetin-3-O-robinobioside (or Quercetin 6-O-(6-deoxy-α-L-manno pyranosyl)-β-d-galactopyranose (3-O-robinobioside)) 2 | 5.87 | 609 | 463, 301 | 231, 323 |
| 21 | Quercetin-3-O-rutinoside (or Quercetin 6-O-alpha-l-rhamnopyranosyl-d-glucopyranose (3-O-rutinoside)) 1 | 6.04 | 609 | 463, 301 | 255, 352 |
| 22 | Quercetin-3-O-galctoside 1 | 6.12 | 463 | 301 | 255, 352 |
| 23 | Quercetin-3-O-glucoside 1 | 6.25 | 463 | 301 | 255, 352 |
| 24 | Eriodictyol 7-O-glucuronide | 6.33 | 280 | 463 | 287 |
| 25 | Isorhamnetin pentosylhexoside 2 | 6.59 | 609 | 477, 315 | 264, 352 |
| 26 | Quercetin-O-deoxyhexose-O-deoxyhexoside 2 | 6.75 | 593 | 433, 301 | 256, 352 |
| 27 | Isorhamnetin rhamnosyl-hexoside isomer 2 | 6.79 | 623 | 463, 315 | 264, 345 |
| 28 | Di-caffeic quinic acid 1 | 7.10 | 515 | 353, 191 | 312 |
| 29 | Isorhamnetin rhamnosyl-hexoside isomer 2 | 7.15 | 623 | 421, 315 | 264, 345 |
| 30 | Di-caffeic quinic acid 1 | 7.25 | 515 | 353, 179 | 308 |
© 2017 by the authors. Licensee MDPI, Basel, Switzerland. This article is an open access article distributed under the terms and conditions of the Creative Commons Attribution (CC BY) license (http://creativecommons.org/licenses/by/4.0/).
Share and Cite
Cebulak, T.; Oszmiański, J.; Kapusta, I.; Lachowicz, S. Effect of UV-C Radiation, Ultra-Sonication Electromagnetic Field and Microwaves on Changes in Polyphenolic Compounds in Chokeberry (Aronia melanocarpa). Molecules 2017, 22, 1161. https://doi.org/10.3390/molecules22071161
Cebulak T, Oszmiański J, Kapusta I, Lachowicz S. Effect of UV-C Radiation, Ultra-Sonication Electromagnetic Field and Microwaves on Changes in Polyphenolic Compounds in Chokeberry (Aronia melanocarpa). Molecules. 2017; 22(7):1161. https://doi.org/10.3390/molecules22071161
Chicago/Turabian StyleCebulak, Tomasz, Jan Oszmiański, Ireneusz Kapusta, and Sabina Lachowicz. 2017. "Effect of UV-C Radiation, Ultra-Sonication Electromagnetic Field and Microwaves on Changes in Polyphenolic Compounds in Chokeberry (Aronia melanocarpa)" Molecules 22, no. 7: 1161. https://doi.org/10.3390/molecules22071161
APA StyleCebulak, T., Oszmiański, J., Kapusta, I., & Lachowicz, S. (2017). Effect of UV-C Radiation, Ultra-Sonication Electromagnetic Field and Microwaves on Changes in Polyphenolic Compounds in Chokeberry (Aronia melanocarpa). Molecules, 22(7), 1161. https://doi.org/10.3390/molecules22071161