
Biopharmaceutical Characterization and Bioavailability Study of a Tetrazole Analog of Clofibric Acid in Rat


 , ,
, ,
Abstract
:1. Introduction
1.1. Type 2 Diabetes (DMT2)
1.2. Pharmacological Activity of Fibrates
2. Materials and Methods
2.1. Physicochemical Evaluations
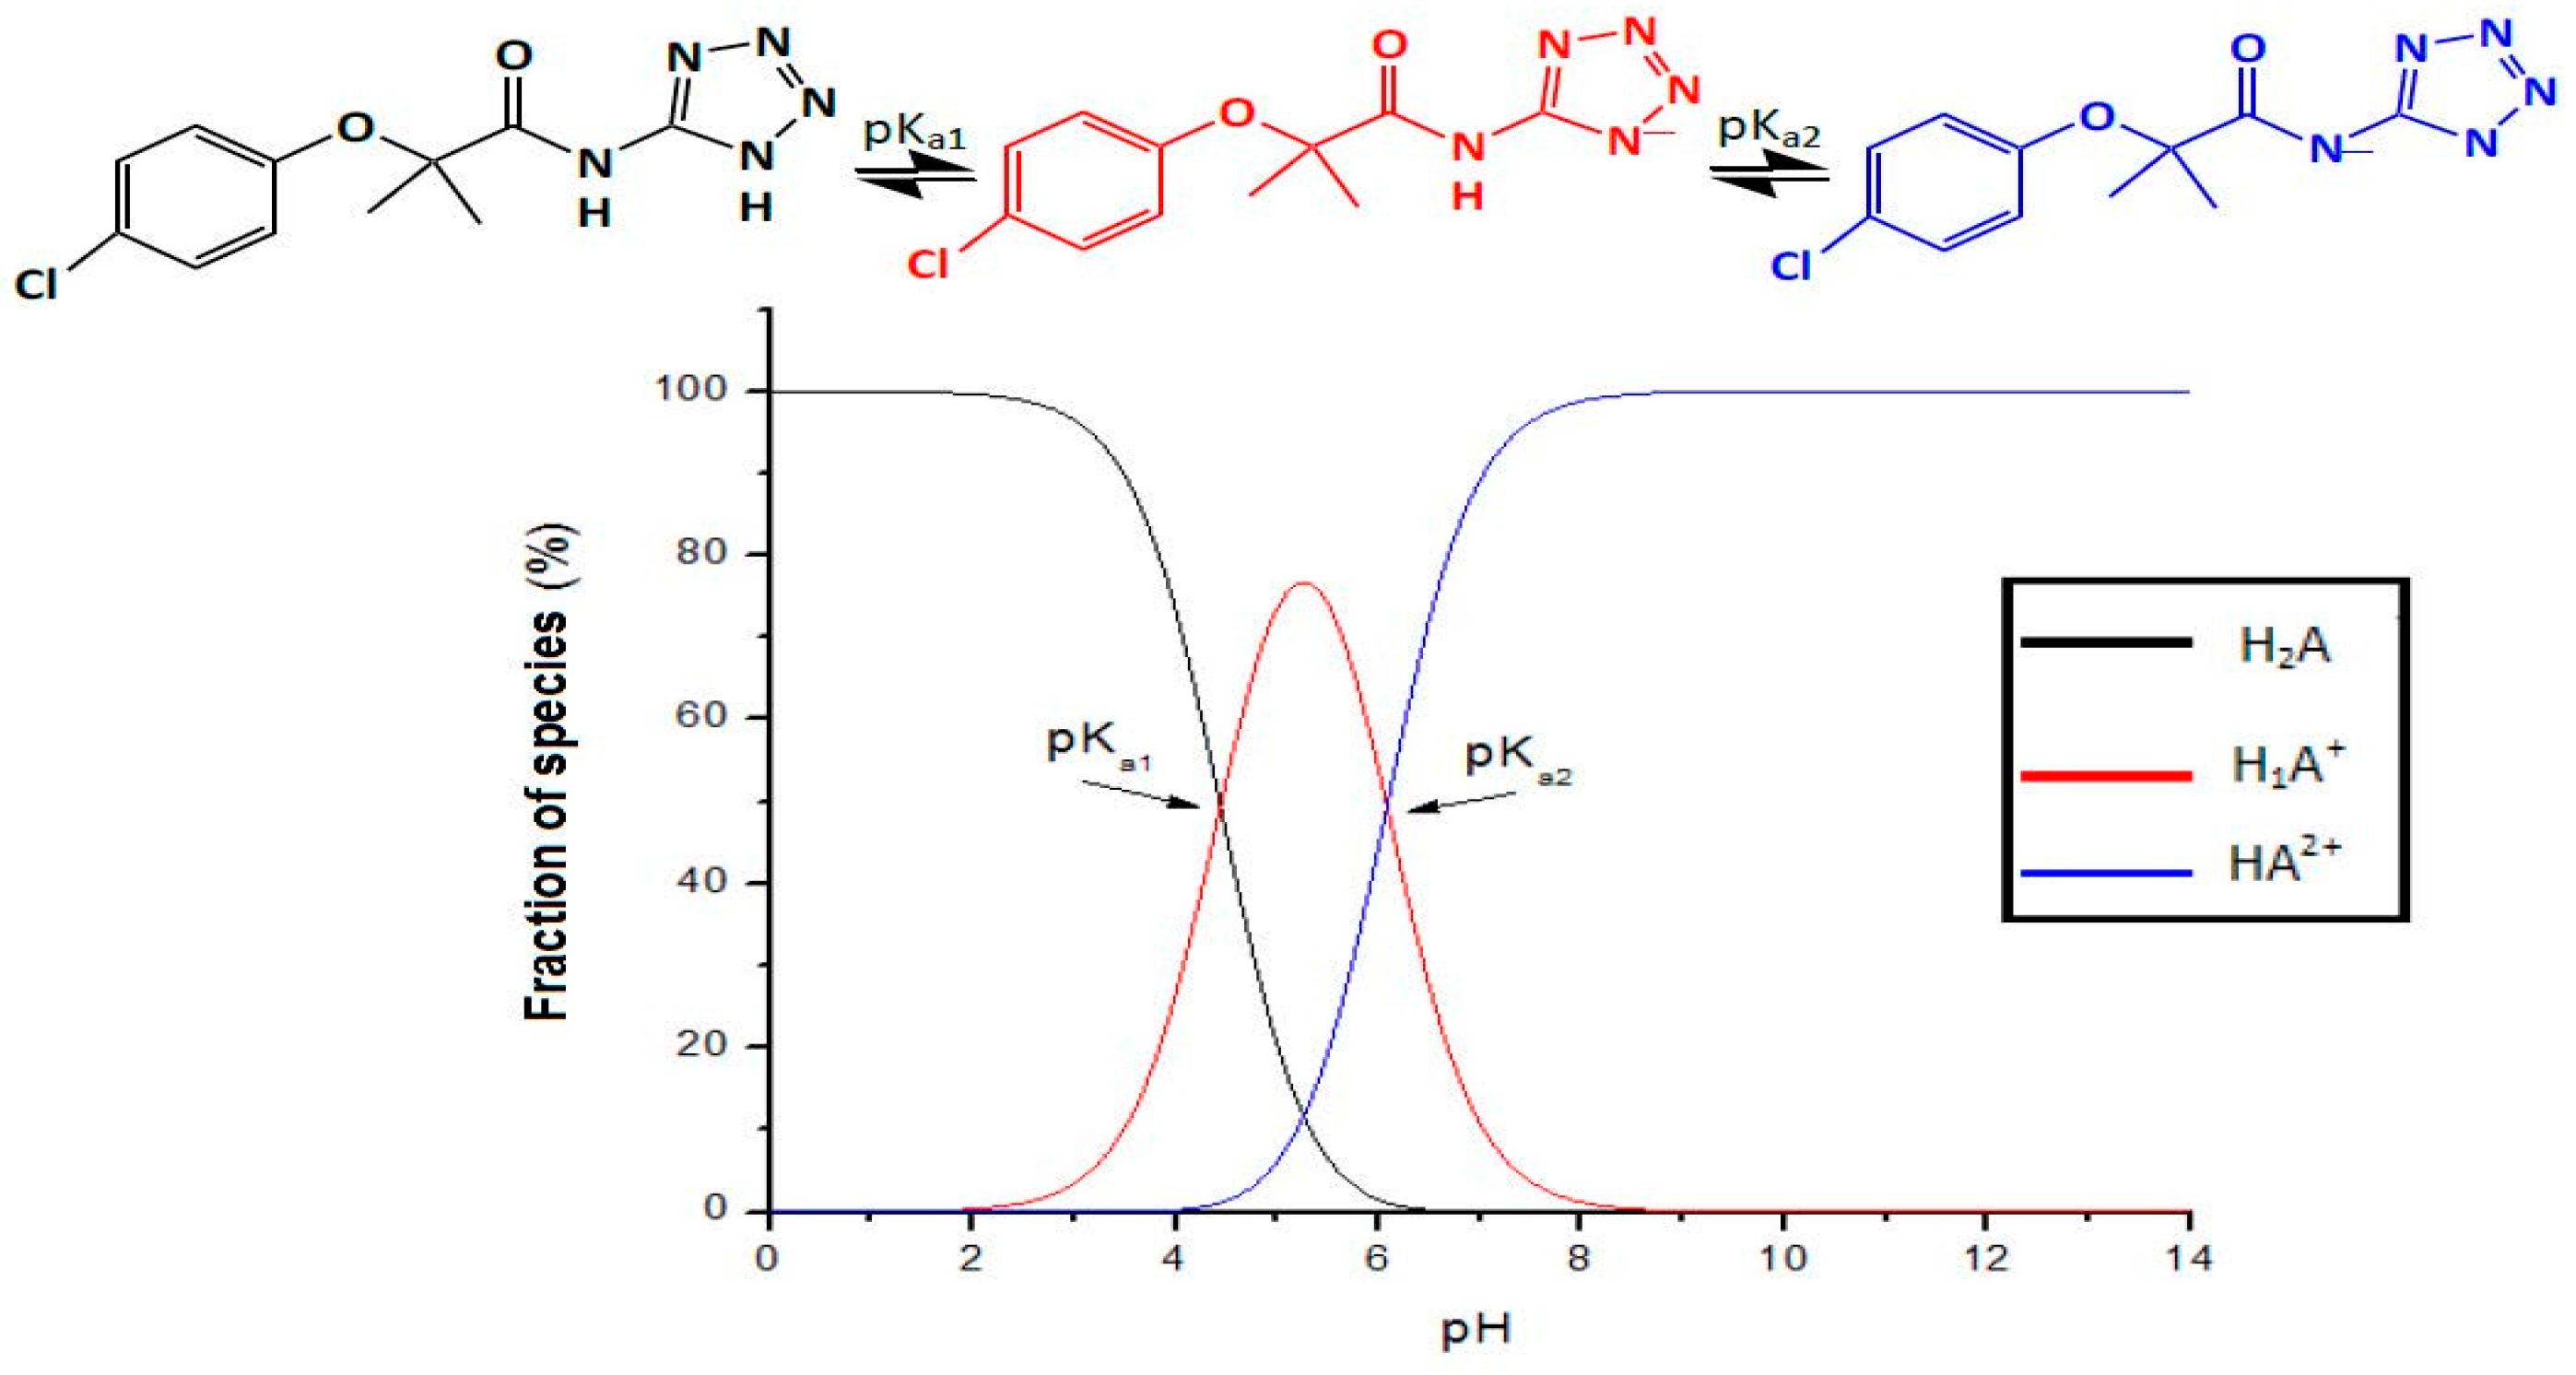
2.1.1. pKa Determination via Potentiometric Analysis
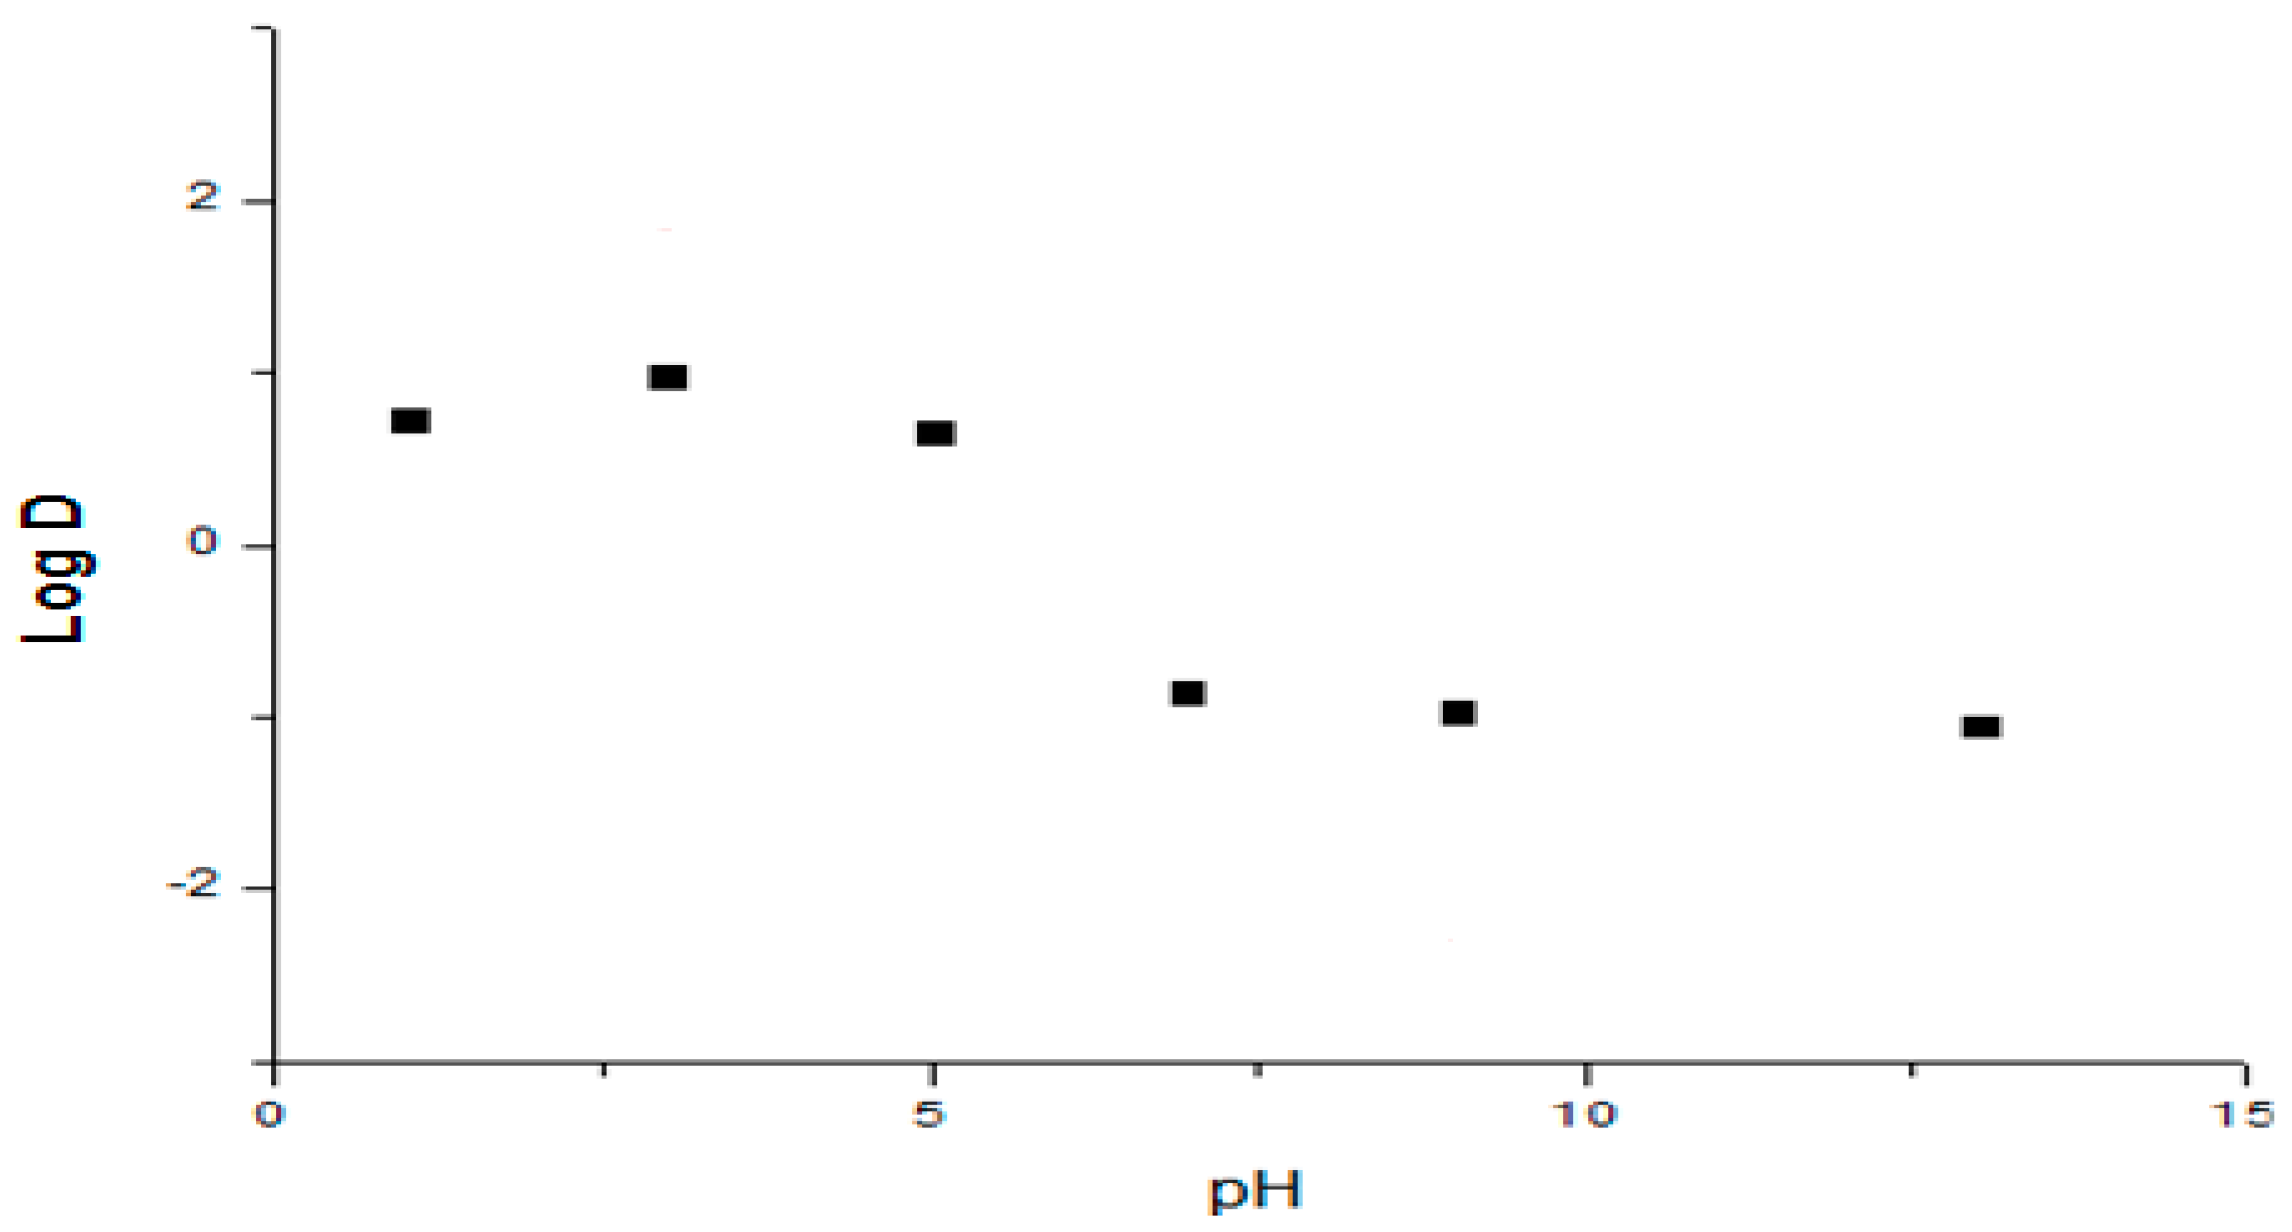
2.1.2. Apparent Partition Coefficient
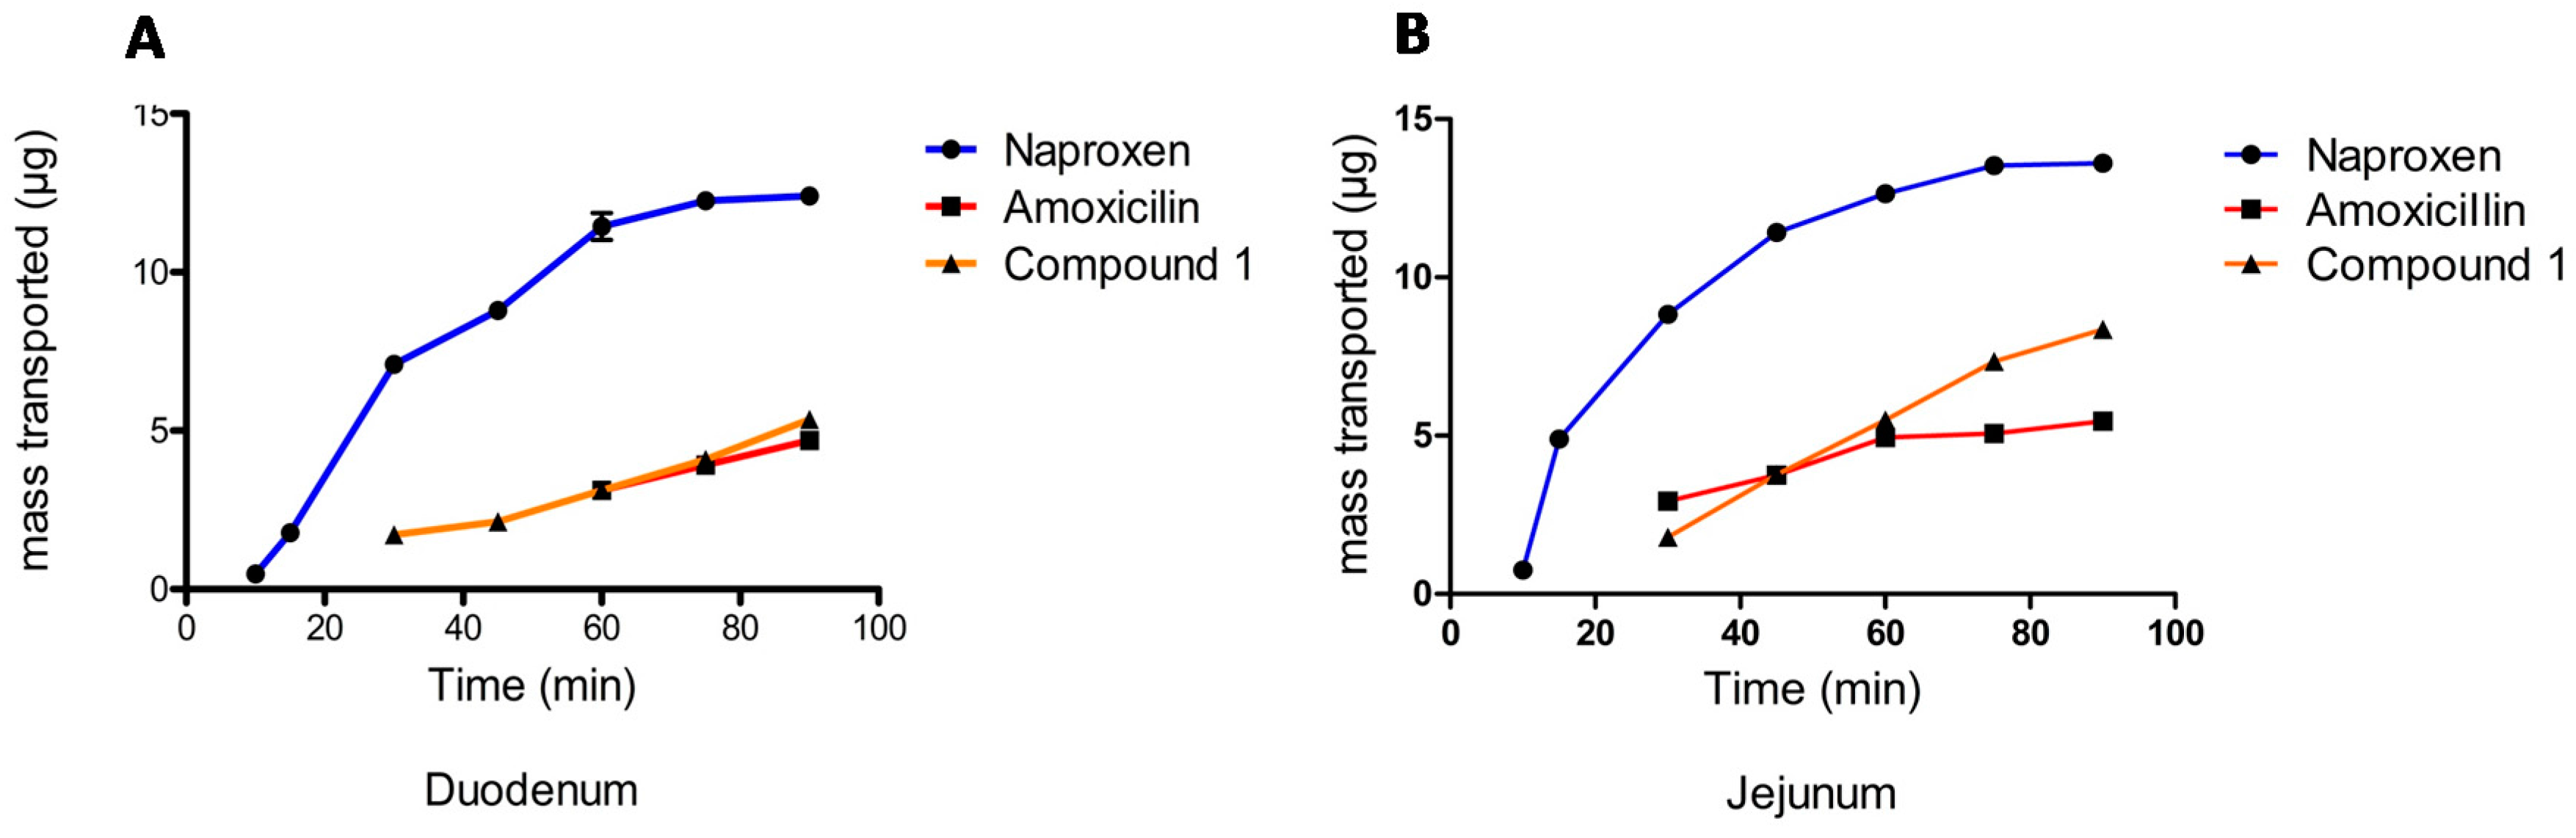
2.1.3. Permeability Assay
2.2. Chromatographic Conditions
2.2.1. Calibration Curve
2.2.2. Sample Preparation
2.3. Analytical Method Validation
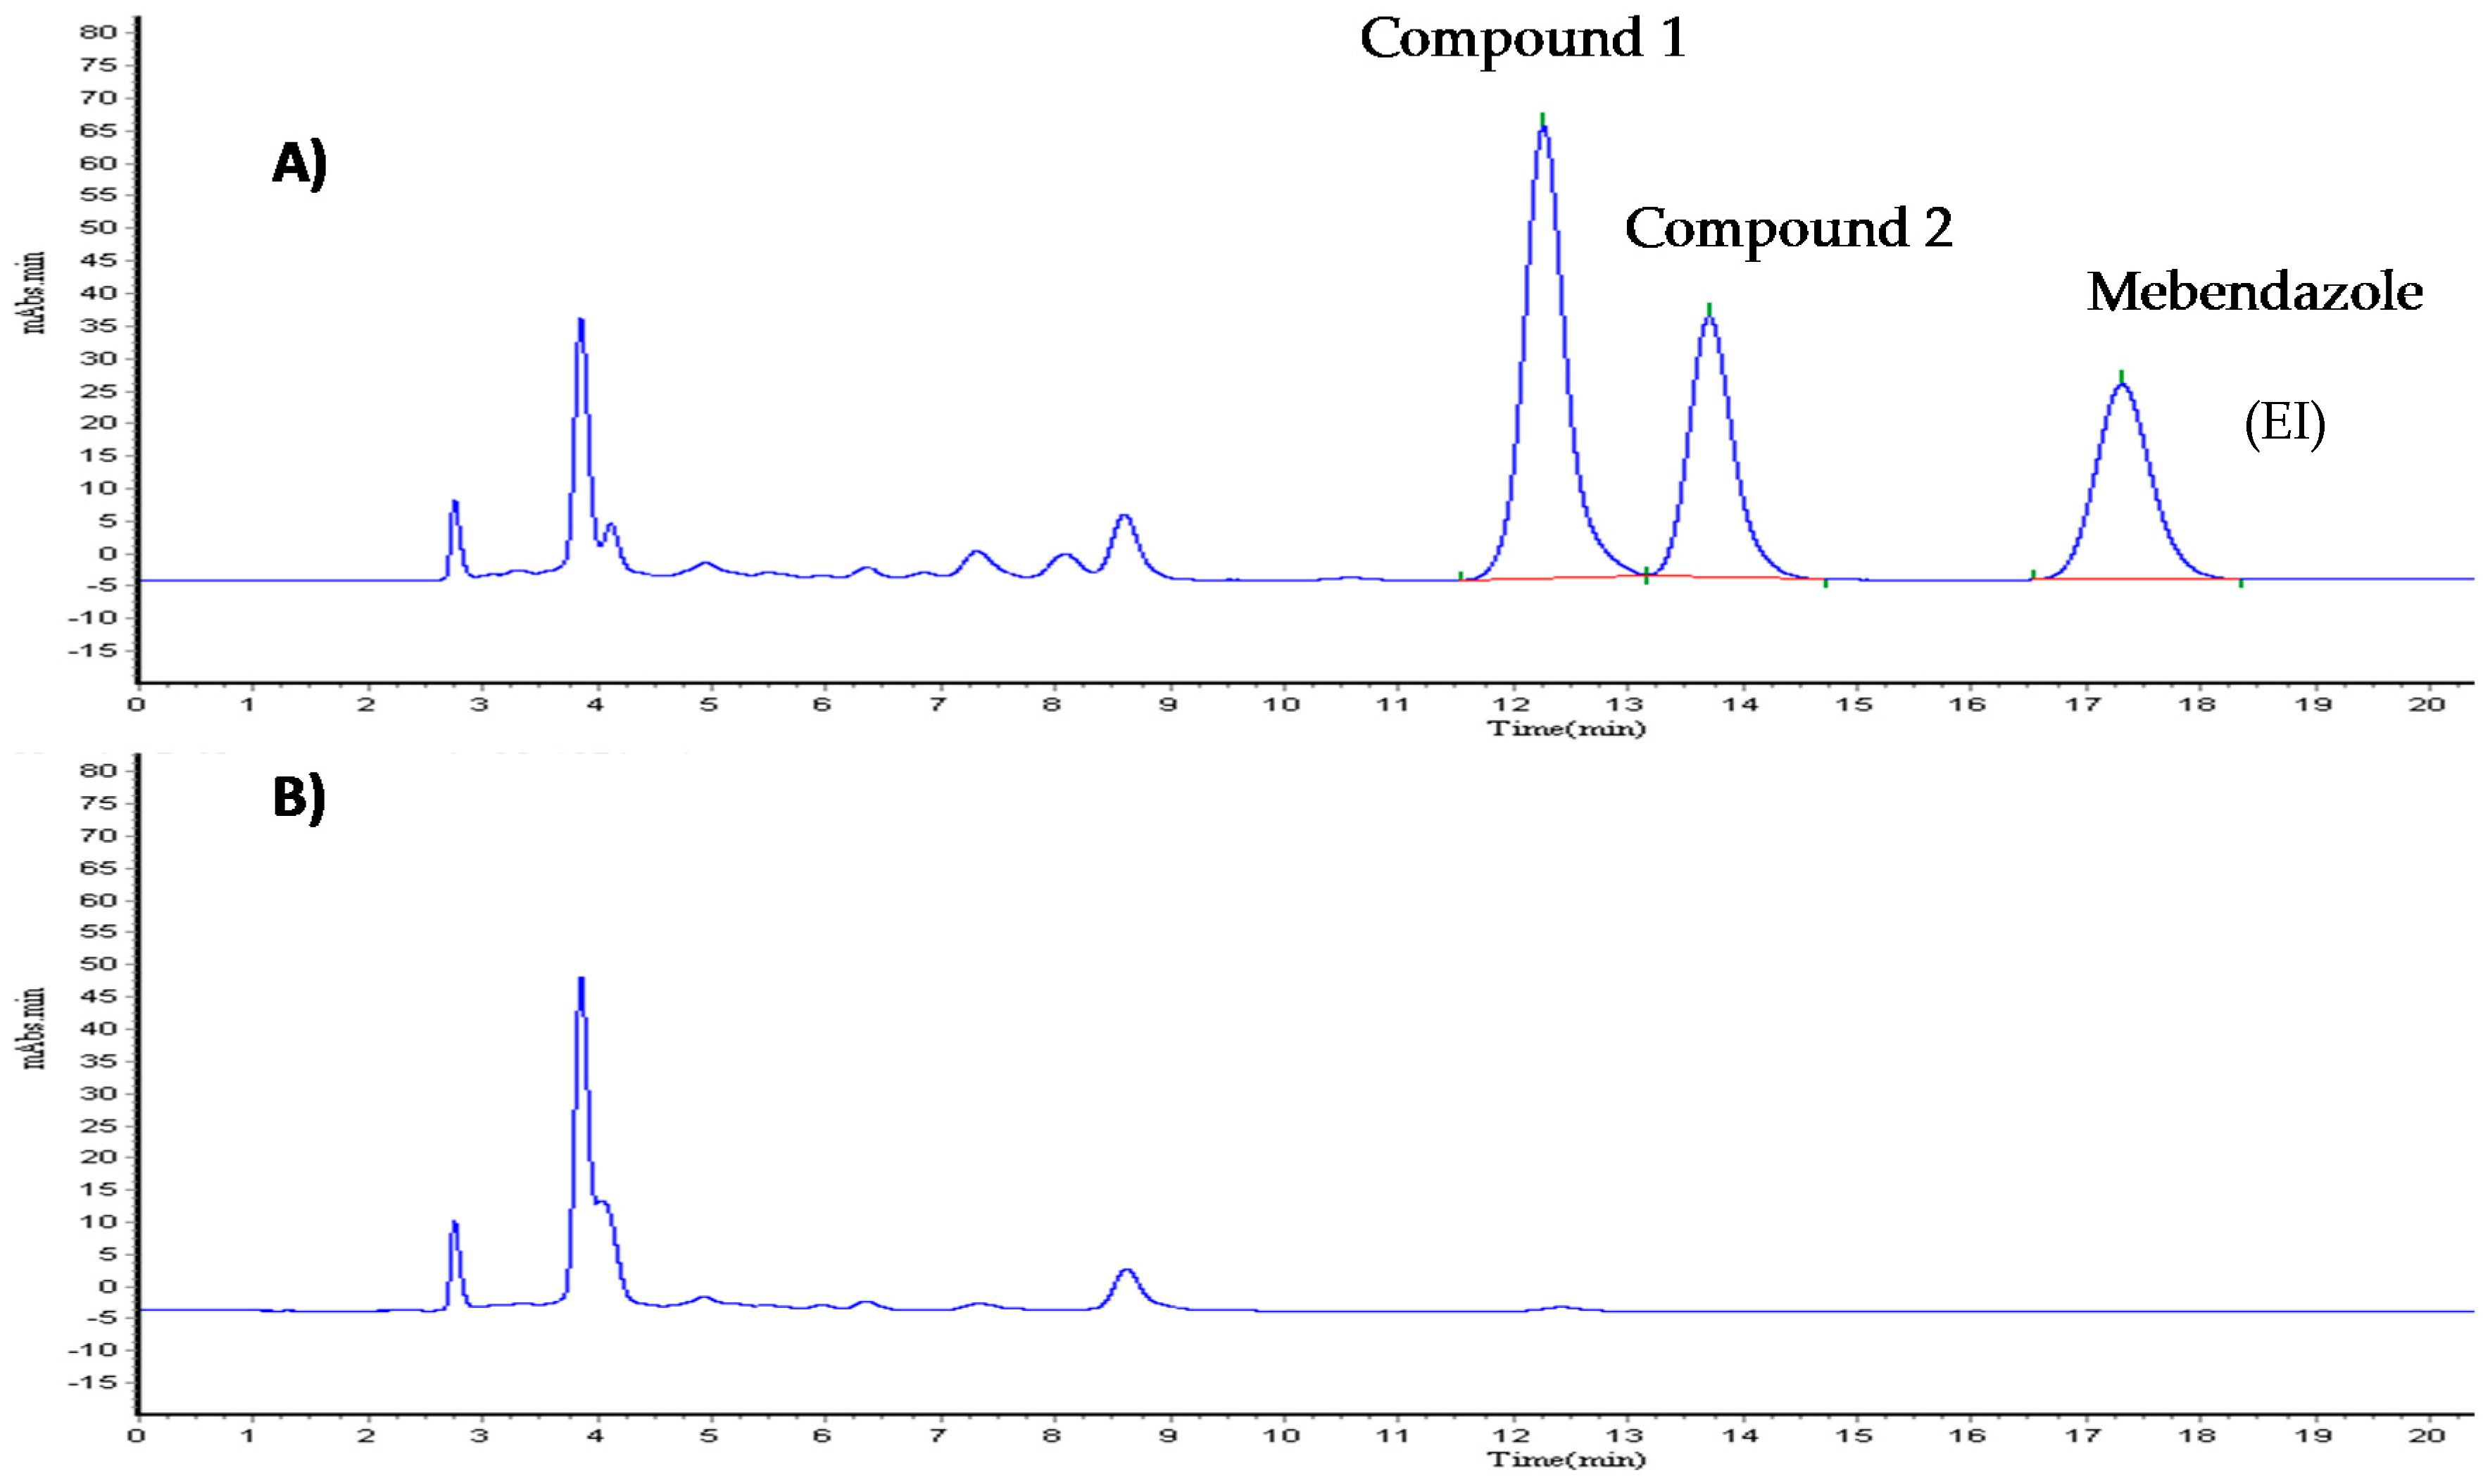
2.3.1. Selectivity
2.3.2. Linearity
2.3.3. Precision and Accuracy
2.3.4. Extraction Efficiency
2.3.5. Limit of Quantification (LOQ) and Limit of Detection (LOD)
3. Bioavailability Study
3.1. Animals
3.2. Cannulation
3.3. Administration
3.4. Sample Collection
4. Pharmacokinetic Analysis
5. Bioethics Policies
6. Results and Discussion
6.1. Biopharmaceutical Properties
6.2. Validation of Analytical Method for Quantifying Compound 1
Chromatographic Conditions
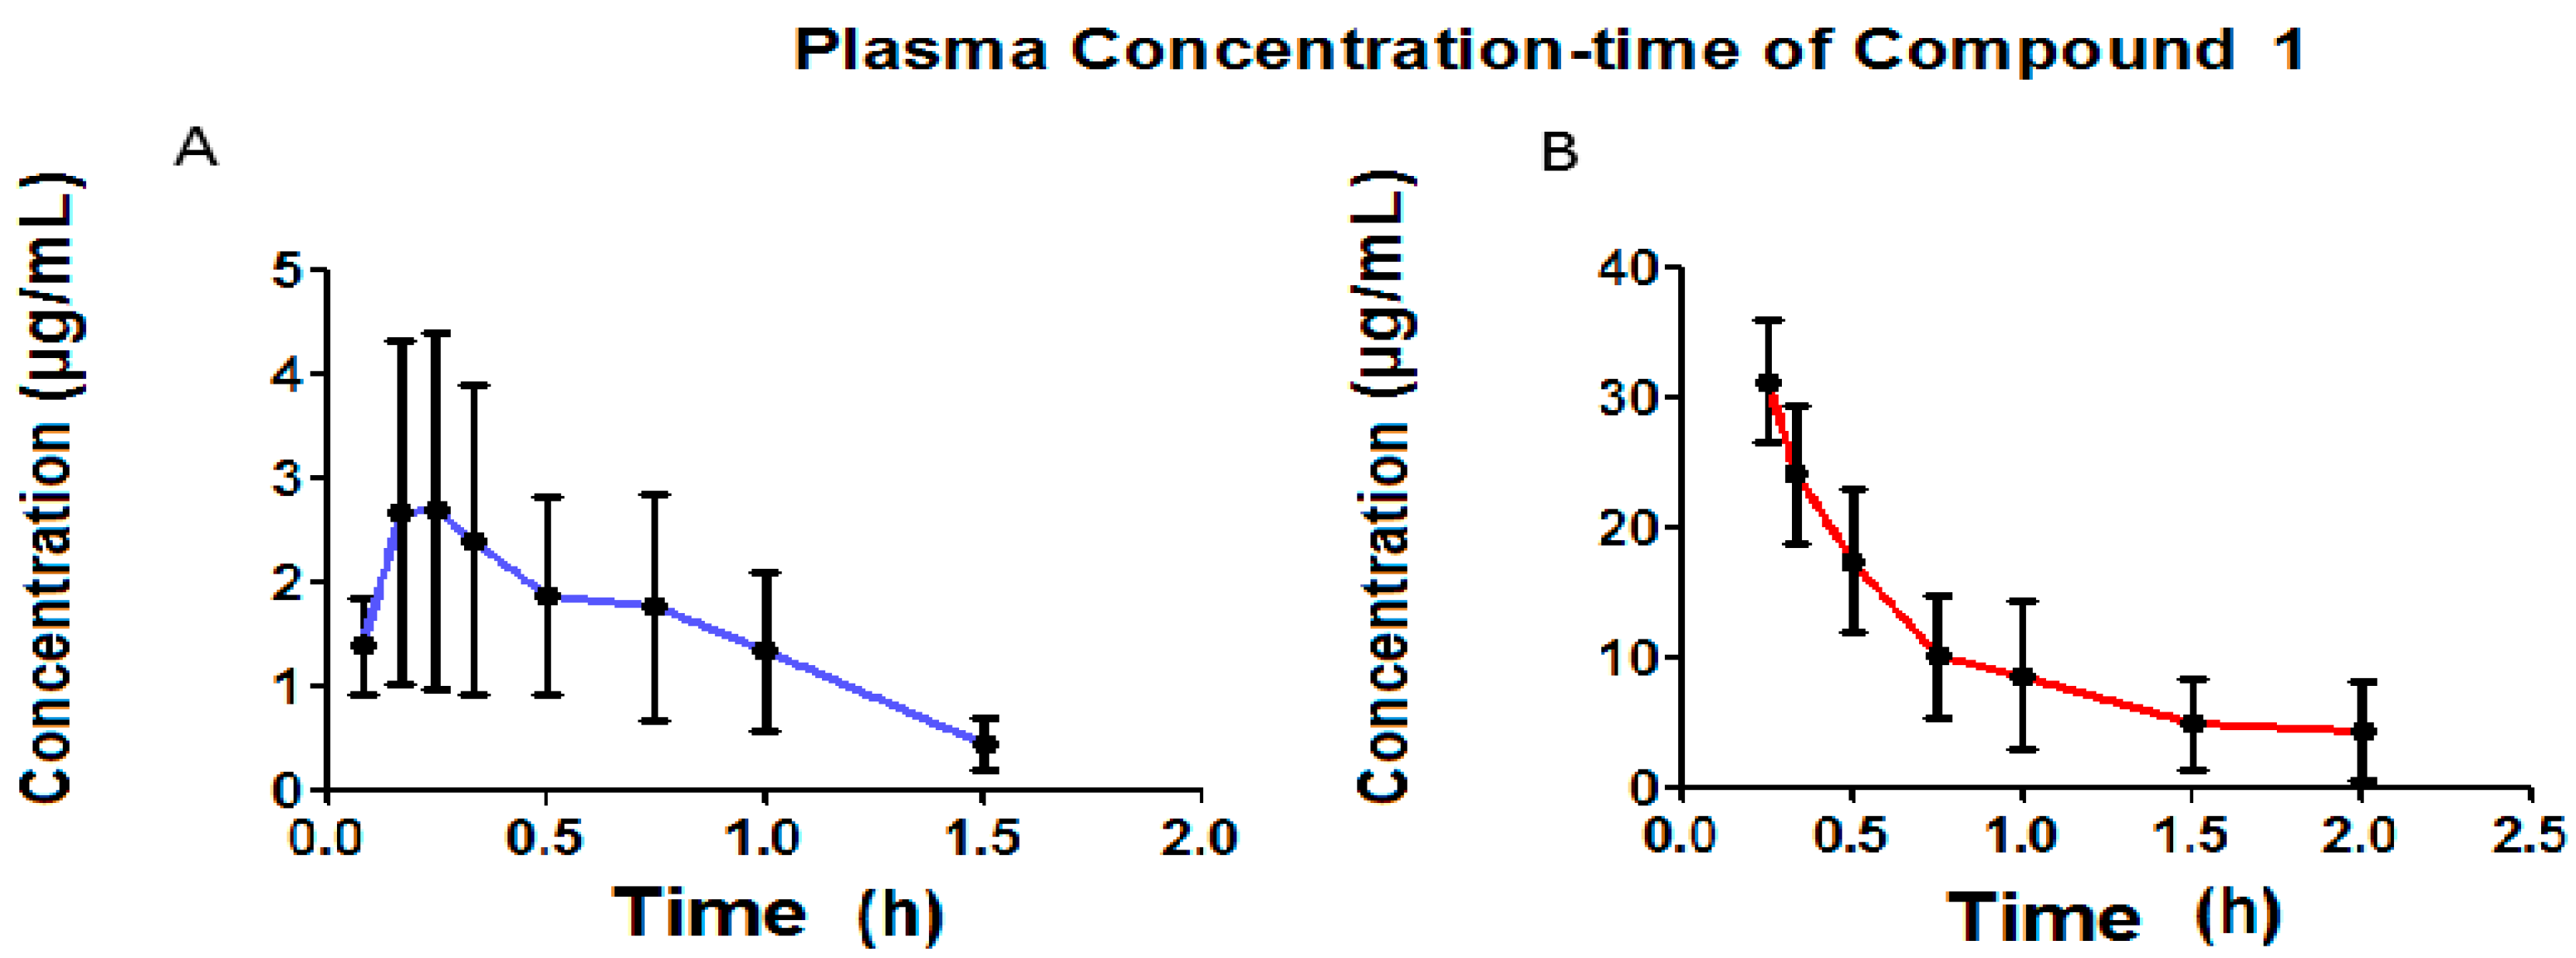
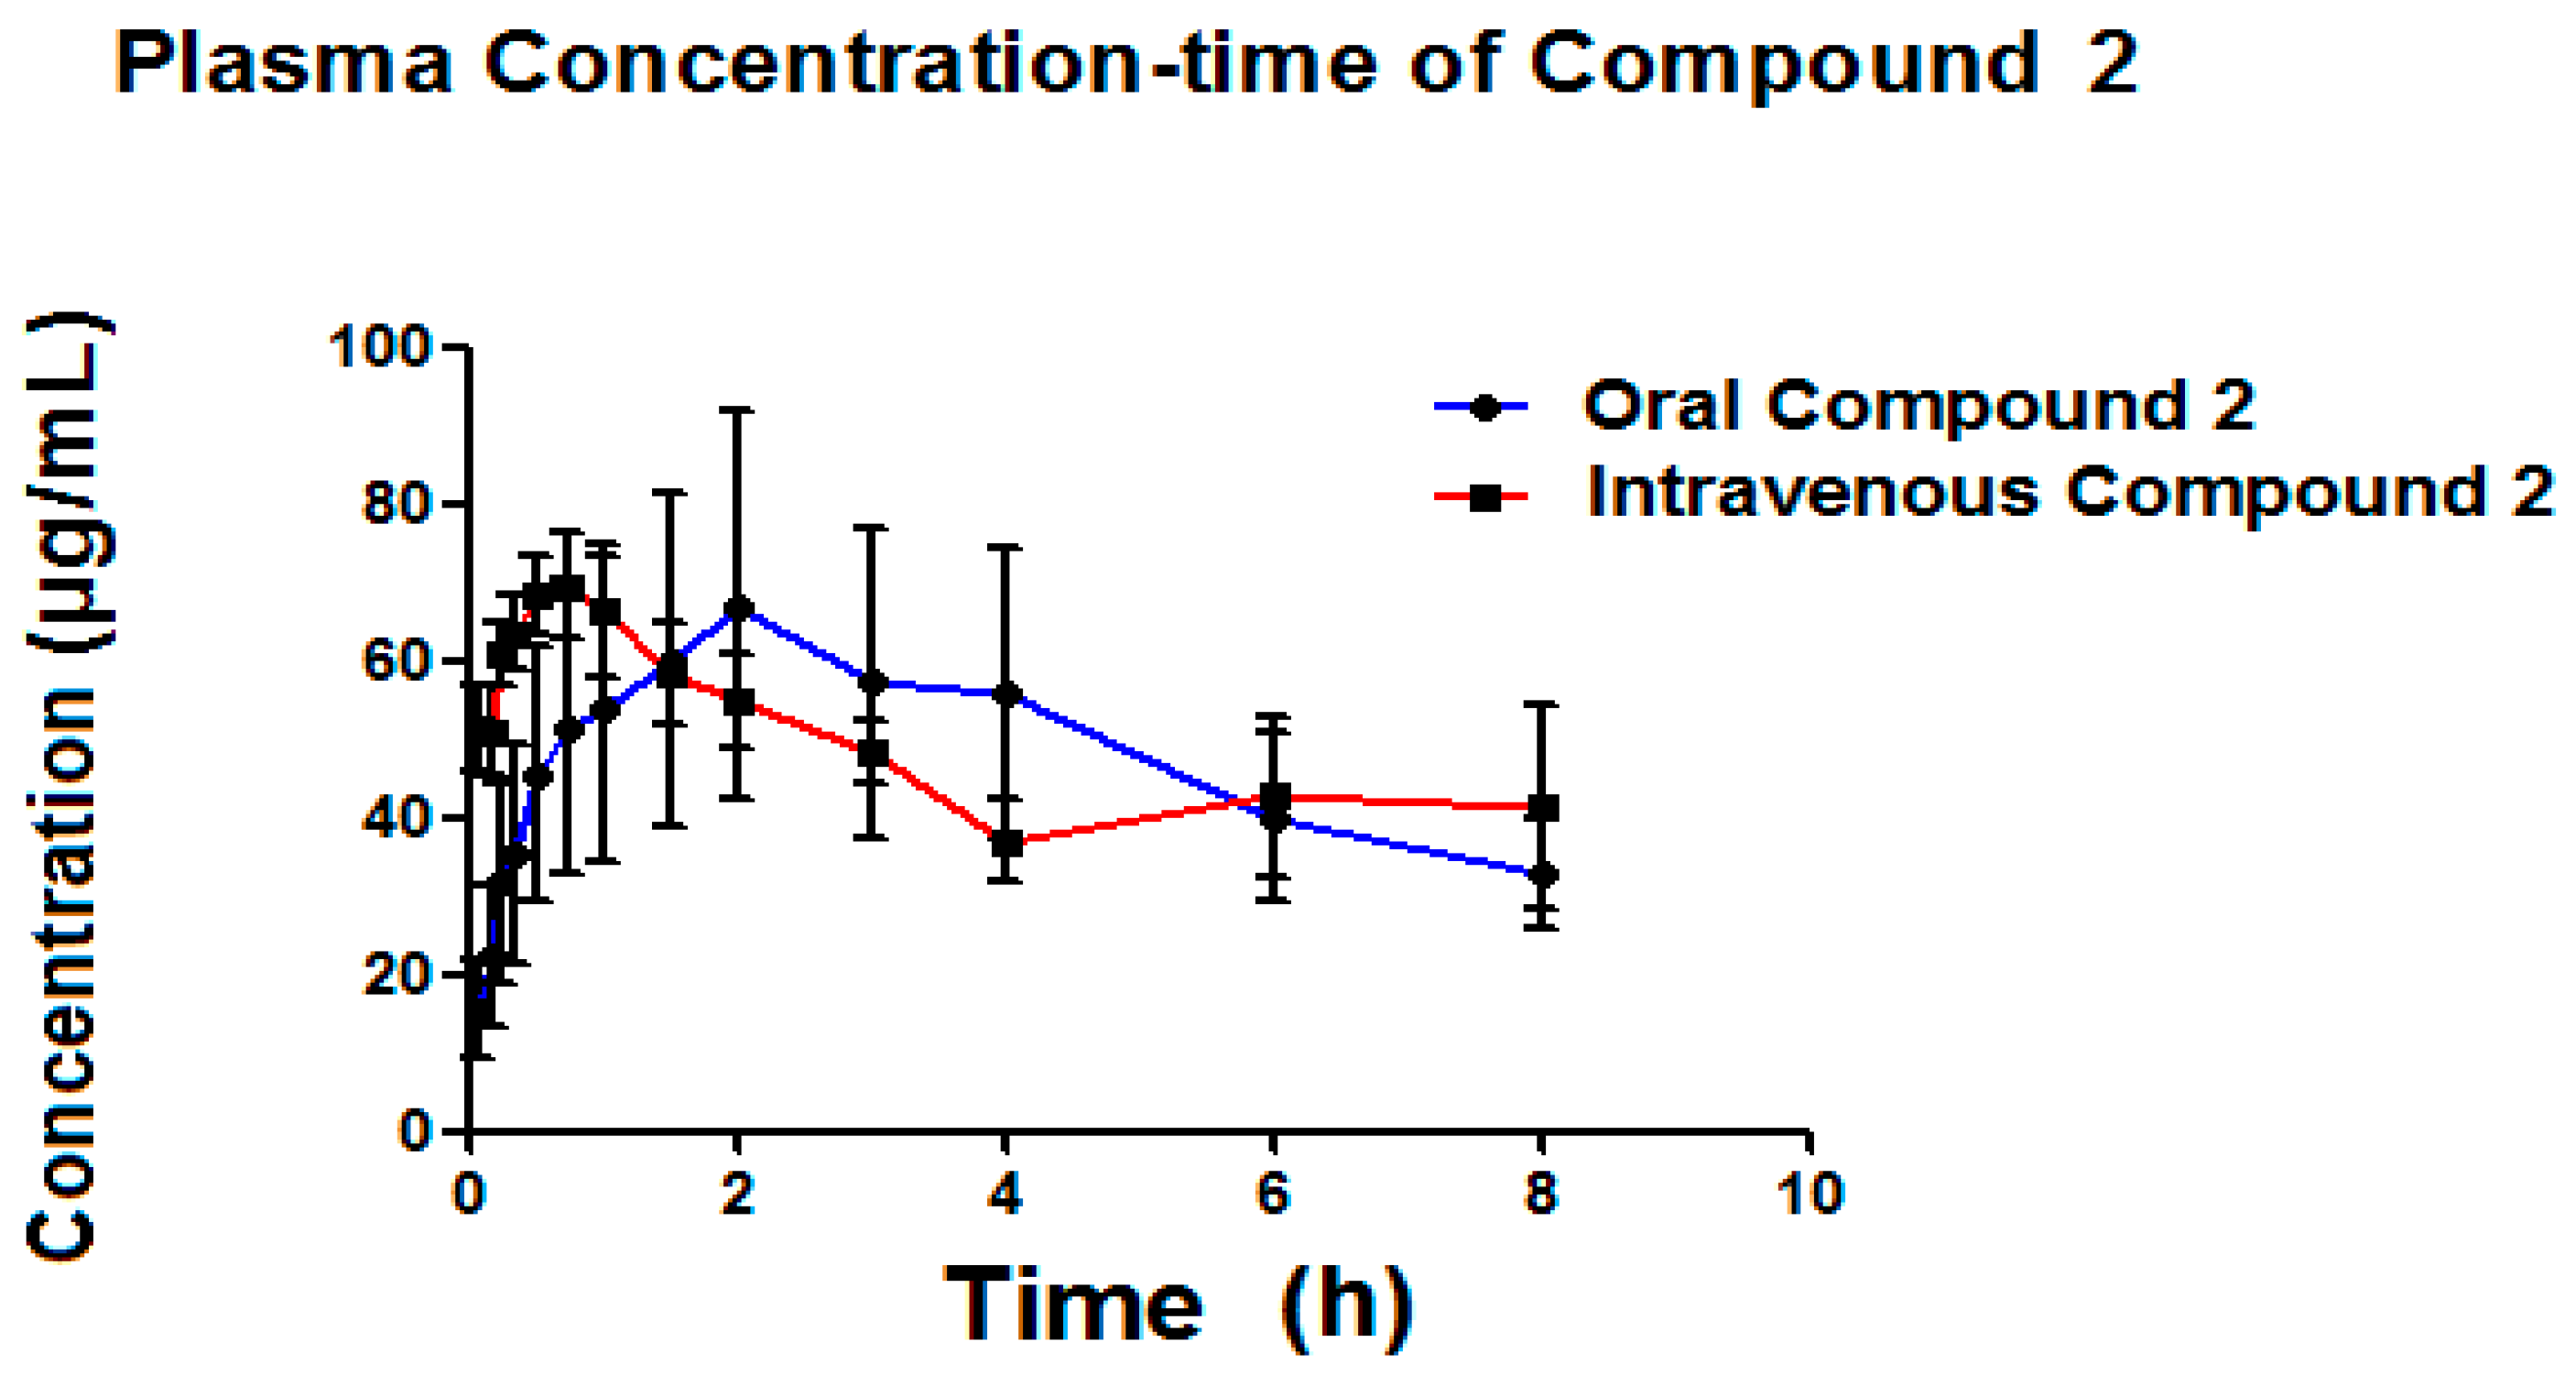
7. Bioavailability Evaluation
8. Conclusions
Acknowledgments
Author Contributions
Conflicts of interest
References
- Mbanya, J.C. Plan Mundial Contra la Diabetes 2011–2021; International Diabetes Federation: Bruselas, Bélgica, 2011; pp. 1–27. [Google Scholar]
- Instituto Nacional de Salud Pública. Encuesta Nacional de Salud y Nutrición 2012. Resultados Nacionales, 1st ed.; Secretaría de Salud: Cuernavaca, CUE, Mexico, 2012; pp. 1–200. [Google Scholar]
- Cefalu, W.T. Standards of medical care in diabetes-2016. Am. Diabetes Assoc. 2016, 39, S4–S5. [Google Scholar]
- Defronzo, R.A.; Eldor, R.; Abdul-Ghani, M. Pathophysiologic approach to therapy in patients with newly diagnosed type 2 diabetes. Diabetes Care 2013, 36, 127–238. [Google Scholar] [CrossRef] [PubMed]
- Torres-Arreola, L.; Gil-Velázquez, L.E.; Sil-Acosta, M.J.; Domínguez-Sánchez, E.R.; Parrilla-Ortiz, J.I.; Santillana-Hernández, S. Guía de practica clinica GPC diabetes mellitus tipo 2 en el primer nivel de atención evidencias y recomendaciones catalogo maestro de guias de practica clinica: IMSS-718-14 tratamiento de la diabetes mellitus tipo 2 en el primer nivel de atención. Inst. Mex. del Seguro Soc. 2014, 1, 1–136. [Google Scholar]
- Gil-Vazquez, L.E.; Sil-Acosta, M.J.; Dominguez-Sanchez, E.R.; del Torres-Arreola, L.; Medina-Chavez, J.H. Guia de practica clinica. Diagnóstico y tratamiento de la diabetes mellitus tipo 2. Rev. Med. Inst. Mex. Seguro Soc. 2013, 51, 1–16. [Google Scholar]
- Ros, E.; Laguna, J.C. Treatment of hypertriglyceridemia: Fibrates versus omega-3 fatty acids. Rev. Española Cardiol. 2006, 6, 52–61. [Google Scholar] [CrossRef]
- Hormigo-Pozo, A.; Mancera-Romero, J.; Perez-Unanua, M.P.; Alonso-Fernandez, M.; Lopez-Simarro, F.; Mediavilla-Bravo, J.J. Recomendaciones de buena practica en el tratamiento de la dislipemia en la diabetes. Semergen 2015, 41, 89–98. [Google Scholar] [CrossRef] [PubMed]
- Tachibana, K.; Anzai, N.; Ueda, C.; Katayama, T.; Kirino, T.; Takahashi, R.; Yamasaki, D.; Ishimoto, K.; Tanaka, T.; Hamakubo, T.; et al. Analysis of PPAR alpha function in human kidney cell line using siRNA. Nucleic Acids Symp. Ser. 2006, 50, 257–258. [Google Scholar] [CrossRef] [PubMed]
- Litherland, N.B.; Bionaz, M.; Wallace, R.L.; Loor, J.J.; Drackley, J.K. Effects of the peroxisome proliferator-activated receptor-α agonists clofibrate and fish oil on hepatic fatty acid metabolism in weaned dairy calves 1. J. Dairy Sci. 2010, 93, 2404–2418. [Google Scholar] [CrossRef] [PubMed]
- Kim, C.H.; Ramu, R.; Ahn, J.H.; Bae, M.A.; Cho, Y.S. Fenofibrate but not fenofibric acid inhibits 11beta-hydroxysteroid dehydrogenase 1 in C2C12 myotubes. Mol. Cell Biochem. 2010, 344, 91–98. [Google Scholar] [CrossRef] [PubMed]
- Alberts, P.1.; Engblom, L.; Edling, N.; Forsgren, M.; Klingström, G.; Larsson, C.; Rönquist-Nii, Y.; Ohman, B.; Abrahmsén, L. Selective inhibition of 11β-hydroxysteroid dehydrogenase type 1 decreases blood glucose concentrations in hyperglycaemic mice. Diabetologia 2002, 45, 1528–1532. [Google Scholar] [PubMed]
- Anderson, A.; Walker, B.R. 11β-HSD1 inhibitors for the treatment of type 2 diabetes and cardiovascular disease. Drugs 2013, 73, 1385–1393. [Google Scholar] [CrossRef] [PubMed]
- Shetty, S.R.; Kumar, S.; Mathur, R.P.; Sharma, K.H.; Jaiswal, A.D. Observational study to evaluate the safety and efficacy of saroglitazar in Indian diabetic dyslipidemia patients. Indian Heart J. 2015, 67, 23–26. [Google Scholar] [CrossRef] [PubMed]
- He, B.K.; Ning, Z.Q.; Li, Z.B.; Shan, S.; Pan, D.S.; Ko, B.C.; Li, P.P.; Shen, Z.F.; Dou, G.F.; Zhang, B.L.; et al. In vitro and in vivo characterizations of chiglitazar, a newly identified PPAR pan-agonist. PPAR Res. 2012, 2012, 546548. [Google Scholar] [CrossRef] [PubMed]
- Ballatore, C.; Huryn, D.M.; Smith, A.B. Carboxylic Acid (Bio)Isosteres in Drug Design. ChemMedChem 2013, 8, 385–395. [Google Scholar] [CrossRef] [PubMed]
- Alaniz-Palacios, A. Diseño, Sintesis y Caracterización Mediante Difracción de Rayos-X de amidas Azaheterociclicas Derivadas del Acido Clofibrico Como Inhibidores de la Enzima 11β-HSD1, Bachelor; Facultad de Farmacia, Universidad Autónoma del Estado de Morelos: Cuernavaca, Morelos, Mexico, 2011. [Google Scholar]
- Navarrete-Vázquez, G.; Alaniz-Palacios, A.; Hidalgo-Figueroa, S.; González-Acevedo, C.; Ávila-Villarreal, G.; Estrada-Soto, S.; Webster, S.P.; Medina-Franco, J.L.; López-Vallejo, F.; Guerrero-Álvarez, J.; et al. Discovery, synthesis and in combo studies of a tetrazole analog of clofibric acid as a potent hypoglycemic agent. Bioorg. Med. Chem. Lett. 2013, 23, 3244–3247. [Google Scholar] [CrossRef] [PubMed]
- Ramírez-Espinosa, J.J.; García-Jiménez, S.; Rios, M.Y.; Medina-Franco, J.L.; López-Vallejo, F.; Webster, S.P.; Binnie, M.; Ibarra-Barajas, M.; Ortiz-Andrade, R.; Estrada-Soto, S. Antihyperglycemic and sub-chronic antidiabetic actions of morolic and moronic acids, in vitro and in silico inhibition of 11β-HSD 1. Phytomedicine 2013, 20, 571–576. [Google Scholar] [CrossRef] [PubMed]
- Babić, S.; Horvat, A.J.M.; Mutavdžić Pavlović, D.; Kaštelan-Macan, M. Determination of pKa values of active pharmaceutical ingredients. Trends Anal. Chem. 2007, 26, 1043–1061. [Google Scholar] [CrossRef]
- Clarlk College. Potentiometric Titrationofa Weak Acid. Chemistry. Available online: http://web.clark.edu/nfattaleh/classes/135/Sp05/Labs/PotTitrSp05.pdf (accessed on 9 february 2017).
- Scott, D.C.; Clymer, C.J. Stimation of distribution coefficients from the partition coefficient and pKa. Pharm. Tecnol. 2002, 26, 30–40. [Google Scholar]
- Shawahna, R.; Rahman, N.U. Evaluation of the use of partition coefficients and molecular surface properties as predictors of drug absorption: A provisional biopharmaceutical classification of the list of national essential medicines of Pakistan. DARU 2011, 19, 83–98. [Google Scholar] [PubMed]
- Takacs-Novak, K.; Avdeef, A. Interlaboratory study of log P determination by shake-flask and potentiometric methods. J. Pharm. Biomed. Anal. 1996, 14, 1405–1413. [Google Scholar] [CrossRef]
- Krimsky, M.; Dagan, A.; Aptekar, L.; Ligumsky, M.; Yedgar, S. Assessment of intestinal permeability in rats by permeation of inulin-fluorescein. J. Basic Clin. Physiol. Pharmacol. 2000, 11, 143–153. [Google Scholar] [CrossRef] [PubMed]
- Ashimura, J.K.; Agai, Y.N. Inhibitory effect of palatinose on glucose absorption in everted rat gut. J. Nutr. Sci. Vitaminol. 2007, 53, 87–89. [Google Scholar] [CrossRef]
- Secretaria de Salud. Norma Oficial Mexicana NOM-177-SSA1-2013, Que Establece las Pruebas y Procedimientos Para Demostrar que un Medicamento es Intercambiable. Requisitos a que Deben Sujetarse los Terceros Autorizados queRealicenlasPruebasdeIntercambiabilidad. Available online: http://www.dof.gob.mx/nota_detalle.php?codigo=5314833&fecha=20/09/2013 (accessed on 9 February 2017).
- Balla, D.Z.; Schwarz, S.; Wiesner, H.M.; Hennige, A.M.; Pohmann, R. Monitoring the stress-level of rats with different types of anesthesia: A tail-artery cannulation protocol. J. Pharmacol. Toxicol. Methods 2014, 70, 35–39. [Google Scholar] [CrossRef] [PubMed]
- Rowland, M.; Tozer, T.N.; Derendorf, H.; Hochhaus, G. Clinical Pharmacokinetics and Pharmacodynamics Concepts and Applications, 4th ed.; Lippincott Williams & Wilkins: Philadelphia, PA, USA, 2011; pp. 1–20. [Google Scholar]
- Doménech, B.J.; Martínez-Lanao, J.; Plá Delfina, J.M. Biofarmacia y Farmacocinética, 1st ed.; Síntesis, S.A., Ed.; Universidad Autónoma de Madrid: Madrid, Spain, 2001; Volume 1, pp. 322–420. [Google Scholar]
- Nordisk, N. Directive 2010/63/EU on Protection of Animals Used for Scientific Purposes, Caring for Animals Aiming for Better Science. Off. J. Eur. Union. 2010, 1–158. [Google Scholar]
- Secretaria de Agricultura, Ganaderia, Desarrollo Rural, Pesca y Alimentación. Norma Oficial Mexicana NOM-062-ZOO-1999, Especificaciones Técnicas Para la Producción, Cuidado y uso de los Animales de Laboratorio. Available online: http://www.ibt.unam.mx/computo/pdfs/bioterio.NOM-062.pdf (accessed on 9 february 2017).
- Karelson, M.; Karelson, G.; Tamm, T.; Tulp, I.; Jänes, J.; Tämm, K.; Lomaka, A.; Savchenko, D.; Dobchev, D. QSAR study of pharmacological permeabilities. Arkivoc 2009, 2, 218–238. [Google Scholar]
- Diehl, K.H.; Hull, R.; Morton, D.; Pfister, R.; Rabemampianina, Y.; Smith, D.; Vidal, J.M.; van de Vorstenbosch, C.; European Federation of Pharmaceutical Industries Association and European Centre for the Validation of Alternative Methods. A good practice guide to the administration of substances and removal of blood, including routes and volumes. J. Appl. Toxicol. 2001, 21, 15–23. [Google Scholar] [CrossRef] [PubMed]
- Elmore, C.L. Center for Drugs Evaluation and Research. In Pharmacology/Toxycology and Evaluation; Departament of Health and Human Services Public Health Service Food and Drug Administration: Philadelphia, PA, USA, 2009; pp. 1–74. [Google Scholar]
- Crouthamel, W.G.; Cenedella, R.J. Clofibrate pharmacokinetics: Effect of elevation of plasma-free fatty acids. Pharmacology 1975, 13, 465–473. [Google Scholar] [CrossRef] [PubMed]
- Drugbank. Drugcard of Clofibrate. Available online: http://www.drugbank.ca/drugs/DB00636 (accessed on 9 February 2017).
- Sample Availability: Sample of the compound 1 is available from the authors.


| Mean (±S.D.) |
|---|
| pKa1 4.43 ± 0.10 |
| Ka2 6.08 ± 0.14 |
| Compound | Papp (cm/s) | |
|---|---|---|
| Duodenum | Jejunum | |
| Naproxen | 3.02 × 10⁻⁵ | 3.98 × 10⁻⁵ |
| Amoxicillin | 8.52 × 10⁻⁶ | 1.00 × 10⁻⁵ |
| ATAC | 8.73 × 10⁻⁶ | 1.62 × 10⁻⁵ |
| Compound | Validation Parameters | |||||
|---|---|---|---|---|---|---|
| Compound 1 | Compound 2 | |||||
| Concentration (μg/mL) | (1.5) | (18 ) | (24) | (1.5) | (18) | (24) |
| Within-day-one variability (RSD%) | 5.73 | 14.72 | 5.06 | 8.16 | 3.26 | 1.52 |
| Within-day-two variability (RSD%) | 13.14 | 2.41 | 7.01 | 8.08 | 2.96 | 5.76 |
| Between-day variability | 10.21 | 10.42 | 6.27 | 7.76 | 7.89 | 4.53 |
| Accuracy (%) | 13.59 | 7.41 | 5.56 | 6.14 | 8.42 | 12.03 |
| Absolute Recovery | 109.4 | 95.01 | 95.23 | 105.3 | 106.5 | 108.9 |
| Linearity | ||||||
|---|---|---|---|---|---|---|
| Compound 1 Confidence Intervals (α0.05) | Compound 2 Confidence Intervals (α0.05) | |||||
| Mean Value (n = 4) | Lower | Upper | Mean Value (n = 4) | Lower | Upper | |
| m | 0.044 | 0.04279 | 0.05027 | 0.0273 | 0.02450 | 0.02903 |
| b | −0.0087 | −0.01881 | 0.01626 | −0.0124 | −0.05143 | 0.05516 |
| r | 0.9997 | 0.9989 | ||||
| LOQ LOD | 0.46 μg/mL 0.30 μg/mL | |||||
| Parameter | Oral Administration | Intravenous Administration | ||
|---|---|---|---|---|
| Mean | S.D. | Mean | S.D. | |
| Kel (h−1) | 1.81 | 0.09 | 1.21 | 0.59 |
| Ka (h−1) | 3.05 | 1.07 | ||
| T1/2el (h) | 0.38 | 0.02 | 0.71 | 0.38 |
| T1/2abs (h) | 0.25 | 0.09 | ||
| Cmax (μg/mL) | 3.57 | 2.39 | ||
| Tmax (h) | 0.33 | 0.28 | ||
| ABC0–t (μg/mL·h) | 2.37 | 1.80 | 30.5 | 9.8 |
| ABC0–α (μg/mL·h) | 2.58 | 1.97 | 38.8 | 19.2 |
| Bioavailability (%) | 10.4 | 0.04 | ||
| Cl (mL/h) | 751.2 | 242.6 | 484.5 | 282.2 |
| Vd (mL) | 419.4 | 148.6 | 399.6 | 93.9 |
| Vd (L/kg) | 1.43 | 0.61 | 1.30 | 0.18 |
| Dose (mg) | 15.11 | 1.92 | 15.23 | 1.88 |
| Parameter | Oral Pathway | Intravenous Pathway | ||
|---|---|---|---|---|
| Mean | S.D. | Mean | S.D. | |
| kelm (h−1) | 0.10 | 0.06 | 0.11 | 0.07 |
| T1/2 elm (h) | 9.24 | 5.5 | 9.00 | 5.72 |
| Tmax (h) | 2 | 0.71 | 0.75 | 0.29 |
| Cmax (μg/mL) | 69.64 | 47.83 | 70.58 | 12.5 |
| ABC0–t (μ/mL·h) | 340.94 | 135.77 | 386.98 | 243.57 |
| ABC0–α (μ/mL·h) | 956.54 | 661.02 | 747.81 | 185.69 |
© 2017 by the authors. Licensee MDPI, Basel, Switzerland. This article is an open access article distributed under the terms and conditions of the Creative Commons Attribution (CC BY) license ( http://creativecommons.org/licenses/by/4.0/).
Share and Cite
Vara-Gama, N.; Valladares-Méndez, A.; Navarrete-Vazquez, G.; Estrada-Soto, S.; Orozco-Castellanos, L.M.; Rivera-Leyva, J.C. Biopharmaceutical Characterization and Bioavailability Study of a Tetrazole Analog of Clofibric Acid in Rat. Molecules 2017, 22, 282. https://doi.org/10.3390/molecules22020282
Vara-Gama N, Valladares-Méndez A, Navarrete-Vazquez G, Estrada-Soto S, Orozco-Castellanos LM, Rivera-Leyva JC. Biopharmaceutical Characterization and Bioavailability Study of a Tetrazole Analog of Clofibric Acid in Rat. Molecules. 2017; 22(2):282. https://doi.org/10.3390/molecules22020282
Chicago/Turabian StyleVara-Gama, Nancy, Adriana Valladares-Méndez, Gabriel Navarrete-Vazquez, Samuel Estrada-Soto, Luis Manuel. Orozco-Castellanos, and Julio César Rivera-Leyva. 2017. "Biopharmaceutical Characterization and Bioavailability Study of a Tetrazole Analog of Clofibric Acid in Rat" Molecules 22, no. 2: 282. https://doi.org/10.3390/molecules22020282
APA StyleVara-Gama, N., Valladares-Méndez, A., Navarrete-Vazquez, G., Estrada-Soto, S., Orozco-Castellanos, L. M., & Rivera-Leyva, J. C. (2017). Biopharmaceutical Characterization and Bioavailability Study of a Tetrazole Analog of Clofibric Acid in Rat. Molecules, 22(2), 282. https://doi.org/10.3390/molecules22020282