
Application of Ultrasound in a Closed System: Optimum Condition for Antioxidants Extraction of Blackberry (Rubus fructicosus) Residues

 ,
,
Abstract
:
1. Introduction
2. Results and Discussion
2.1. Modeling of the Extraction Process
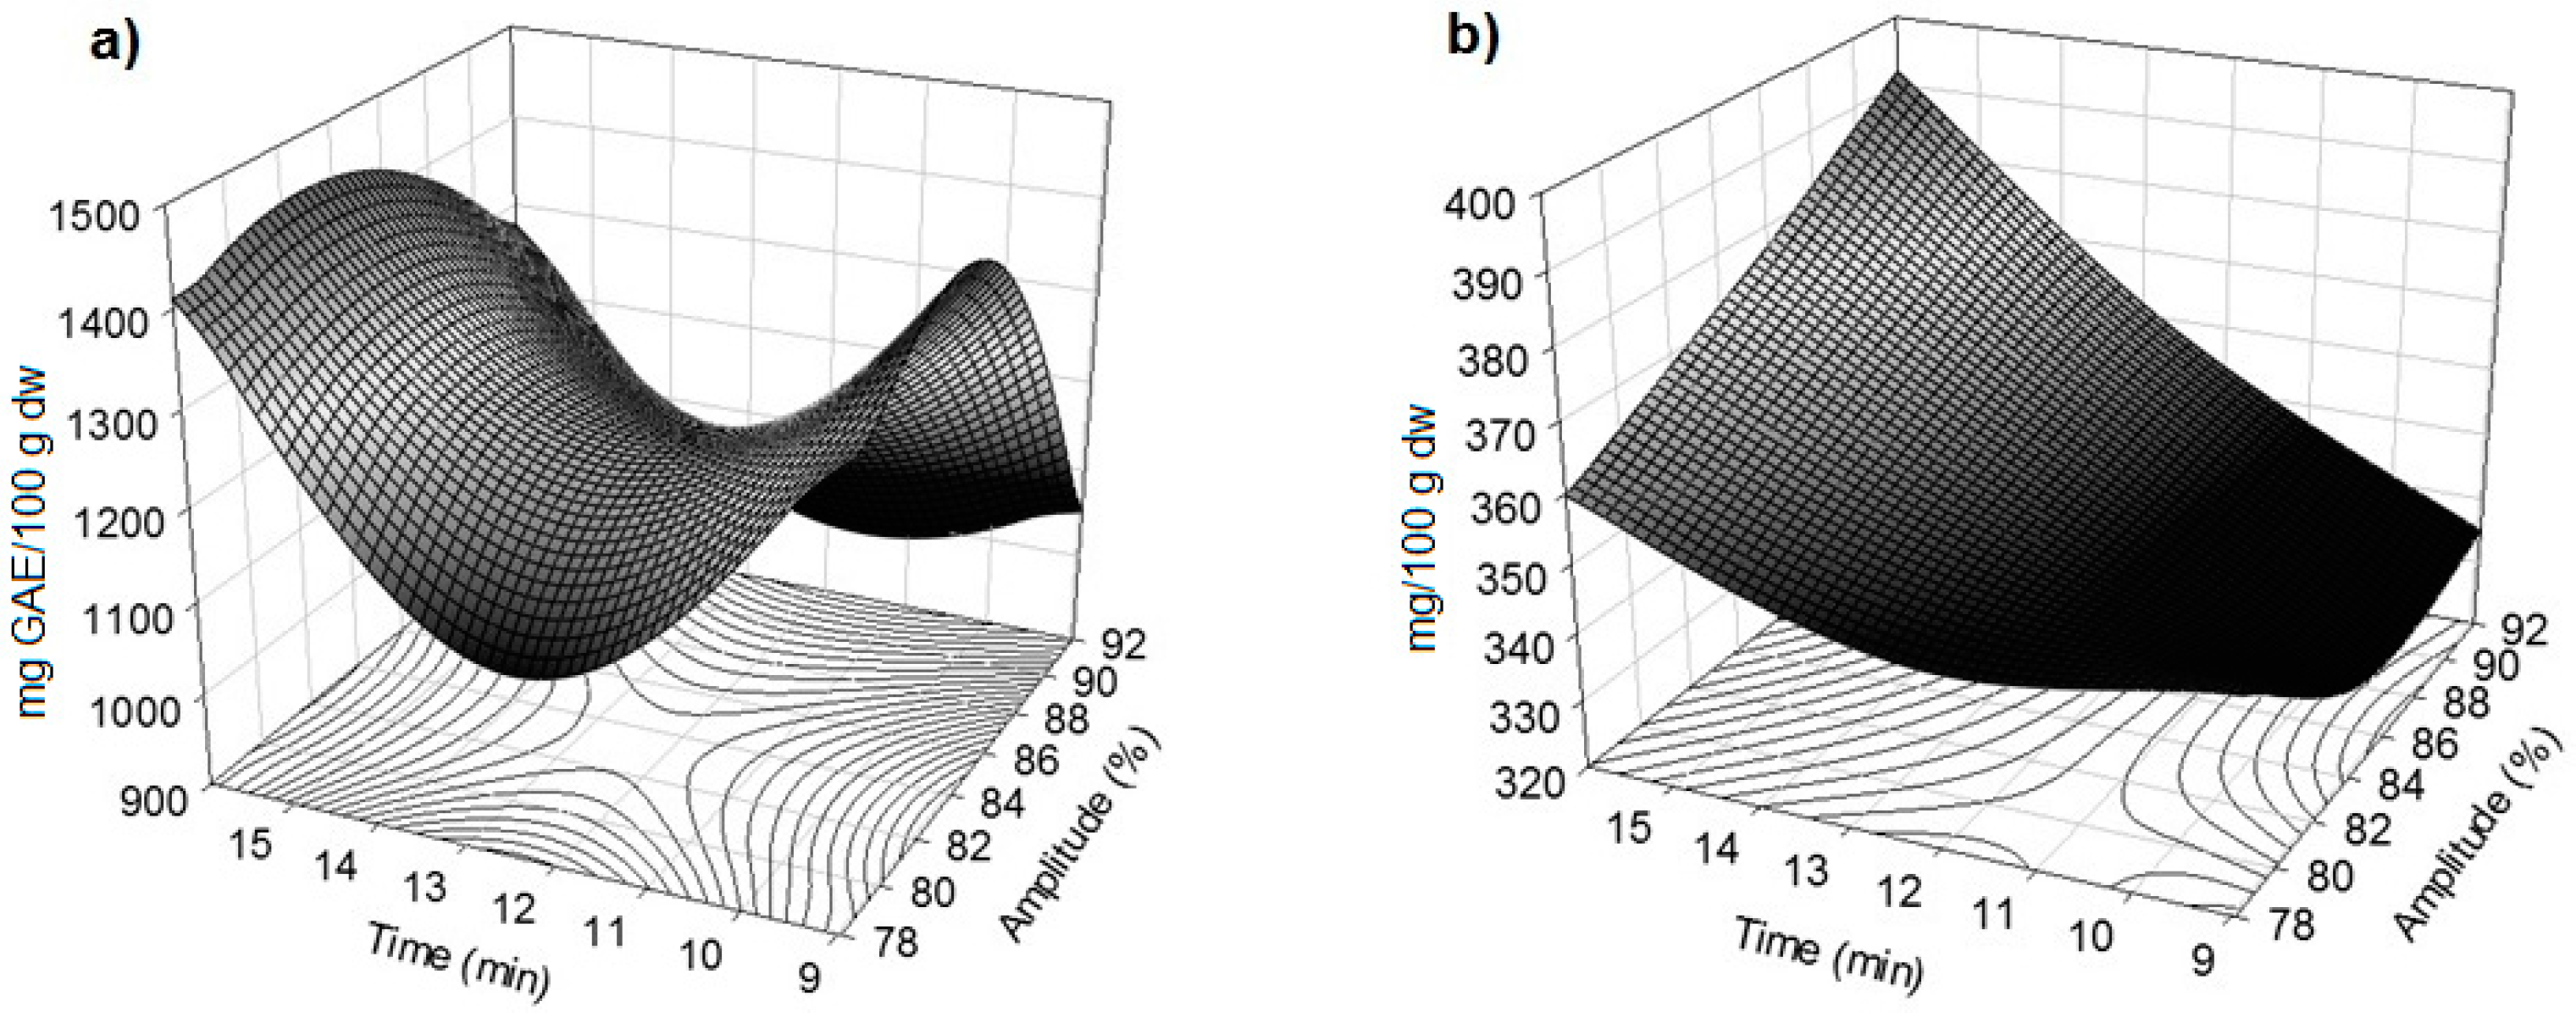
2.2. Effect of Amplitude and Time on Total Phenolic Content and Anthocyanins
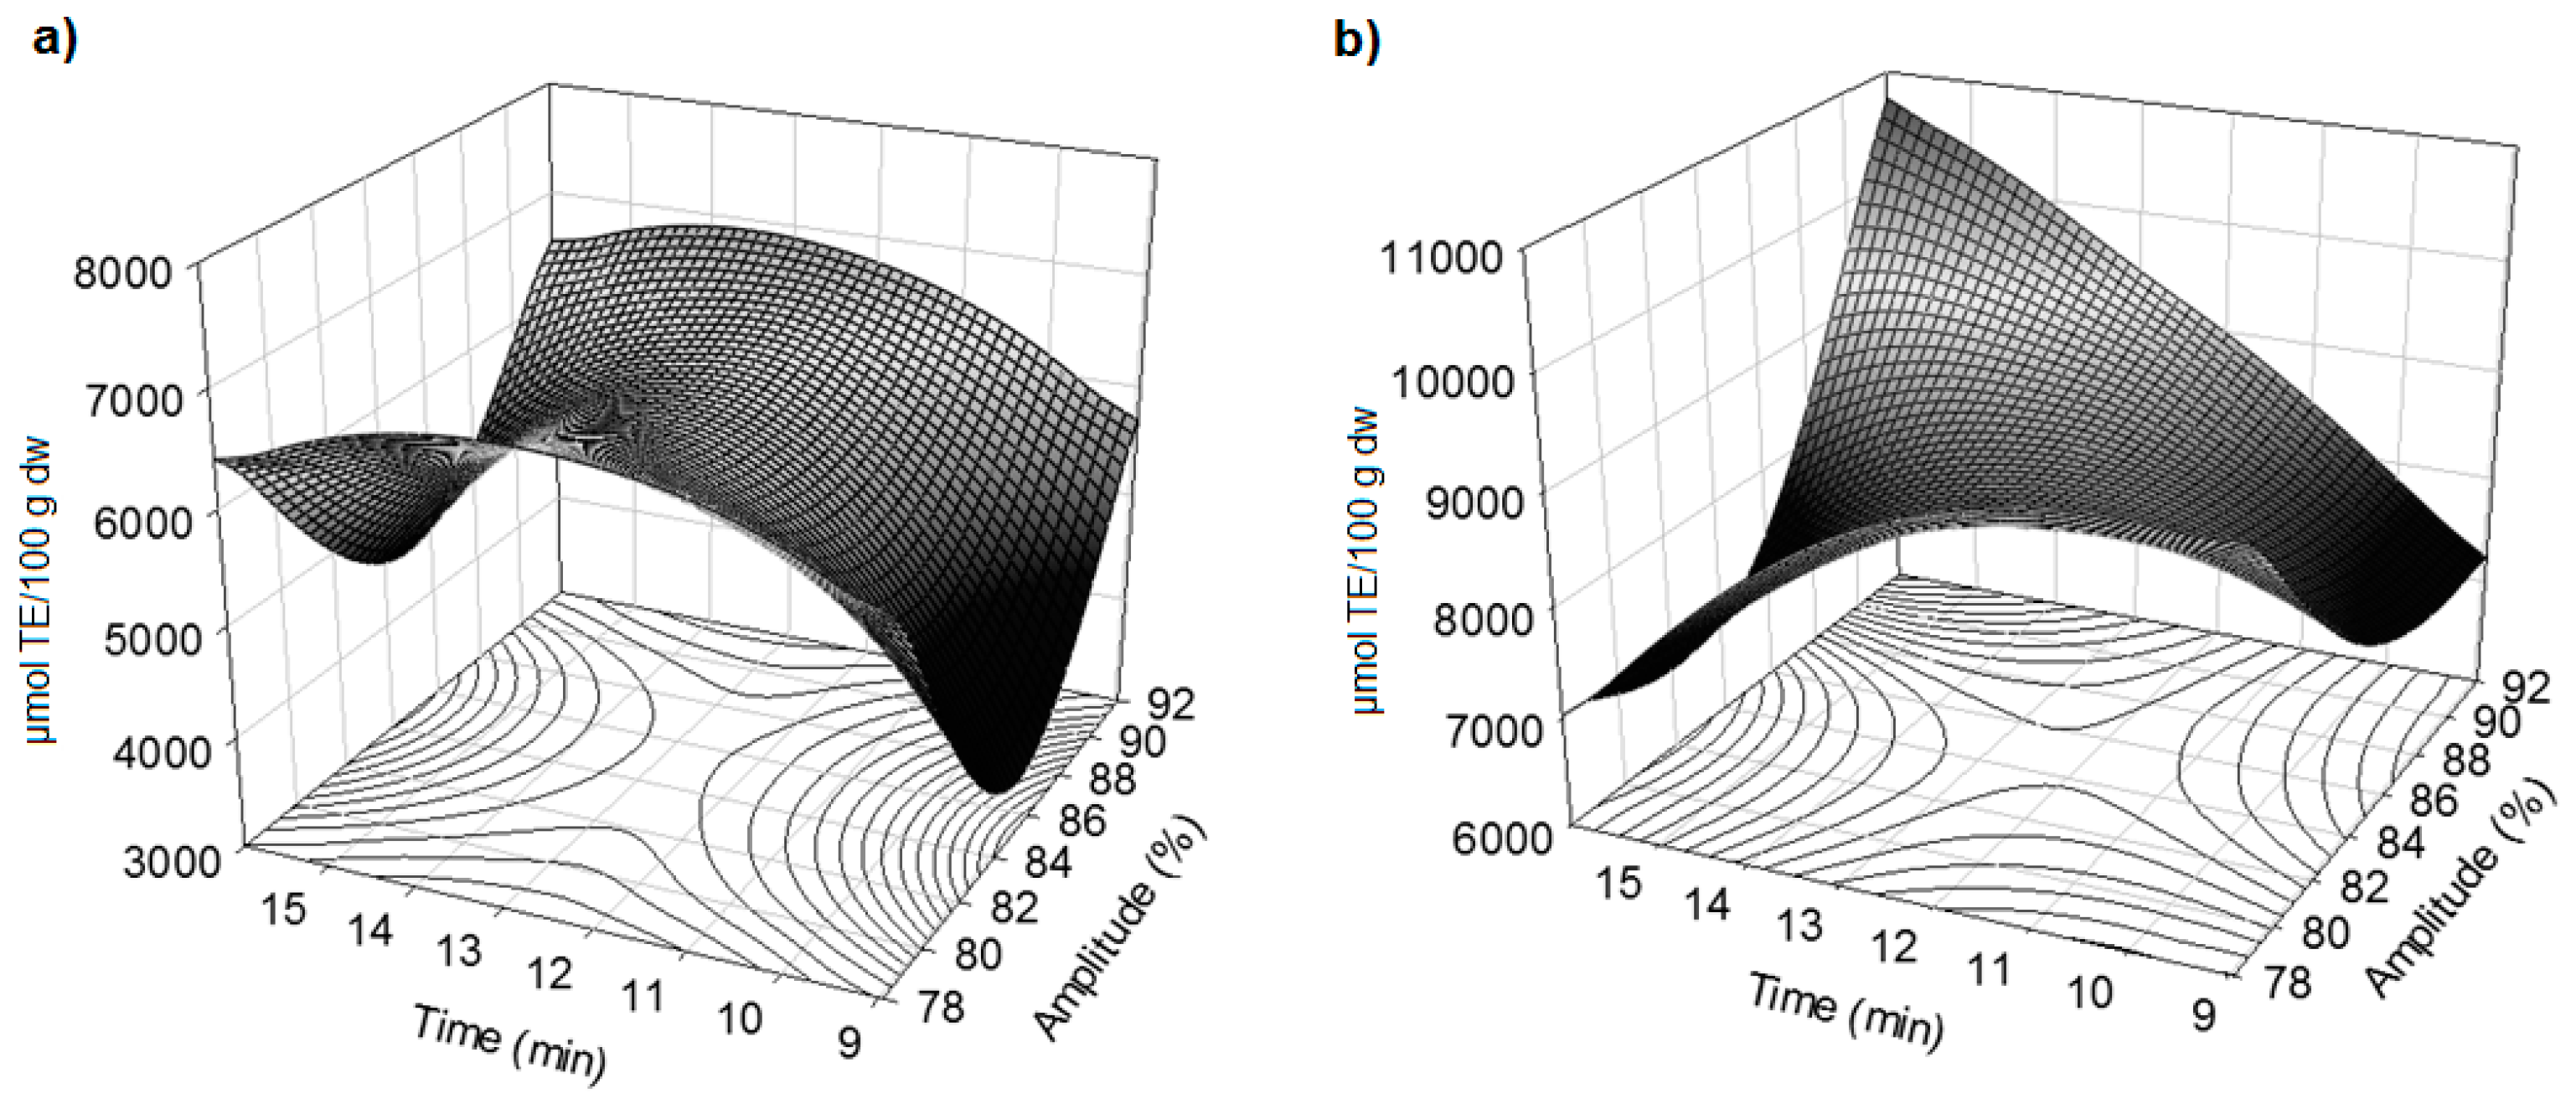
2.3. Effect of Amplitude and Time on the Antioxidant Activity
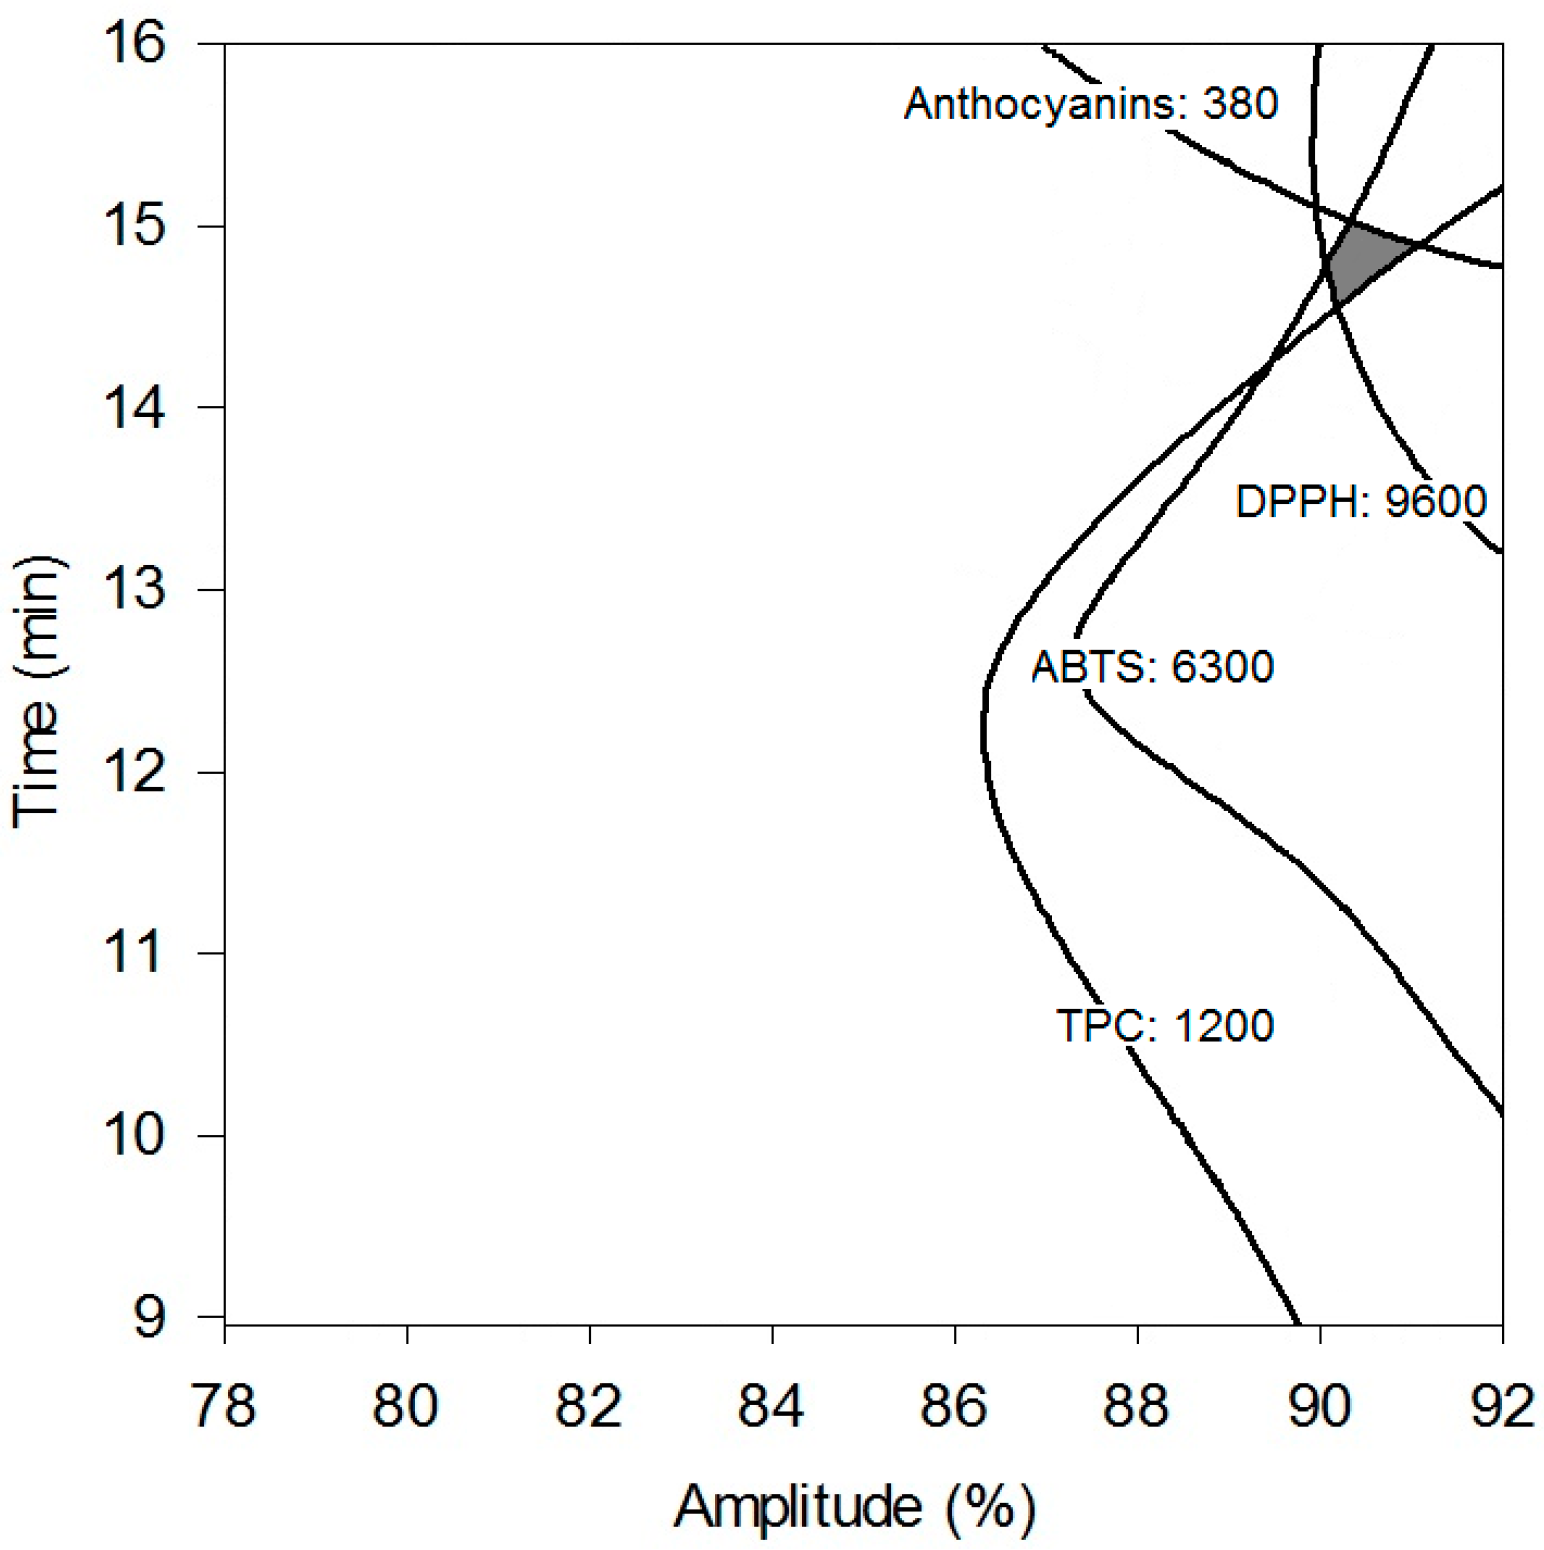
2.4. Optimization of Ultrasound Extraction Conditions and Model Validation
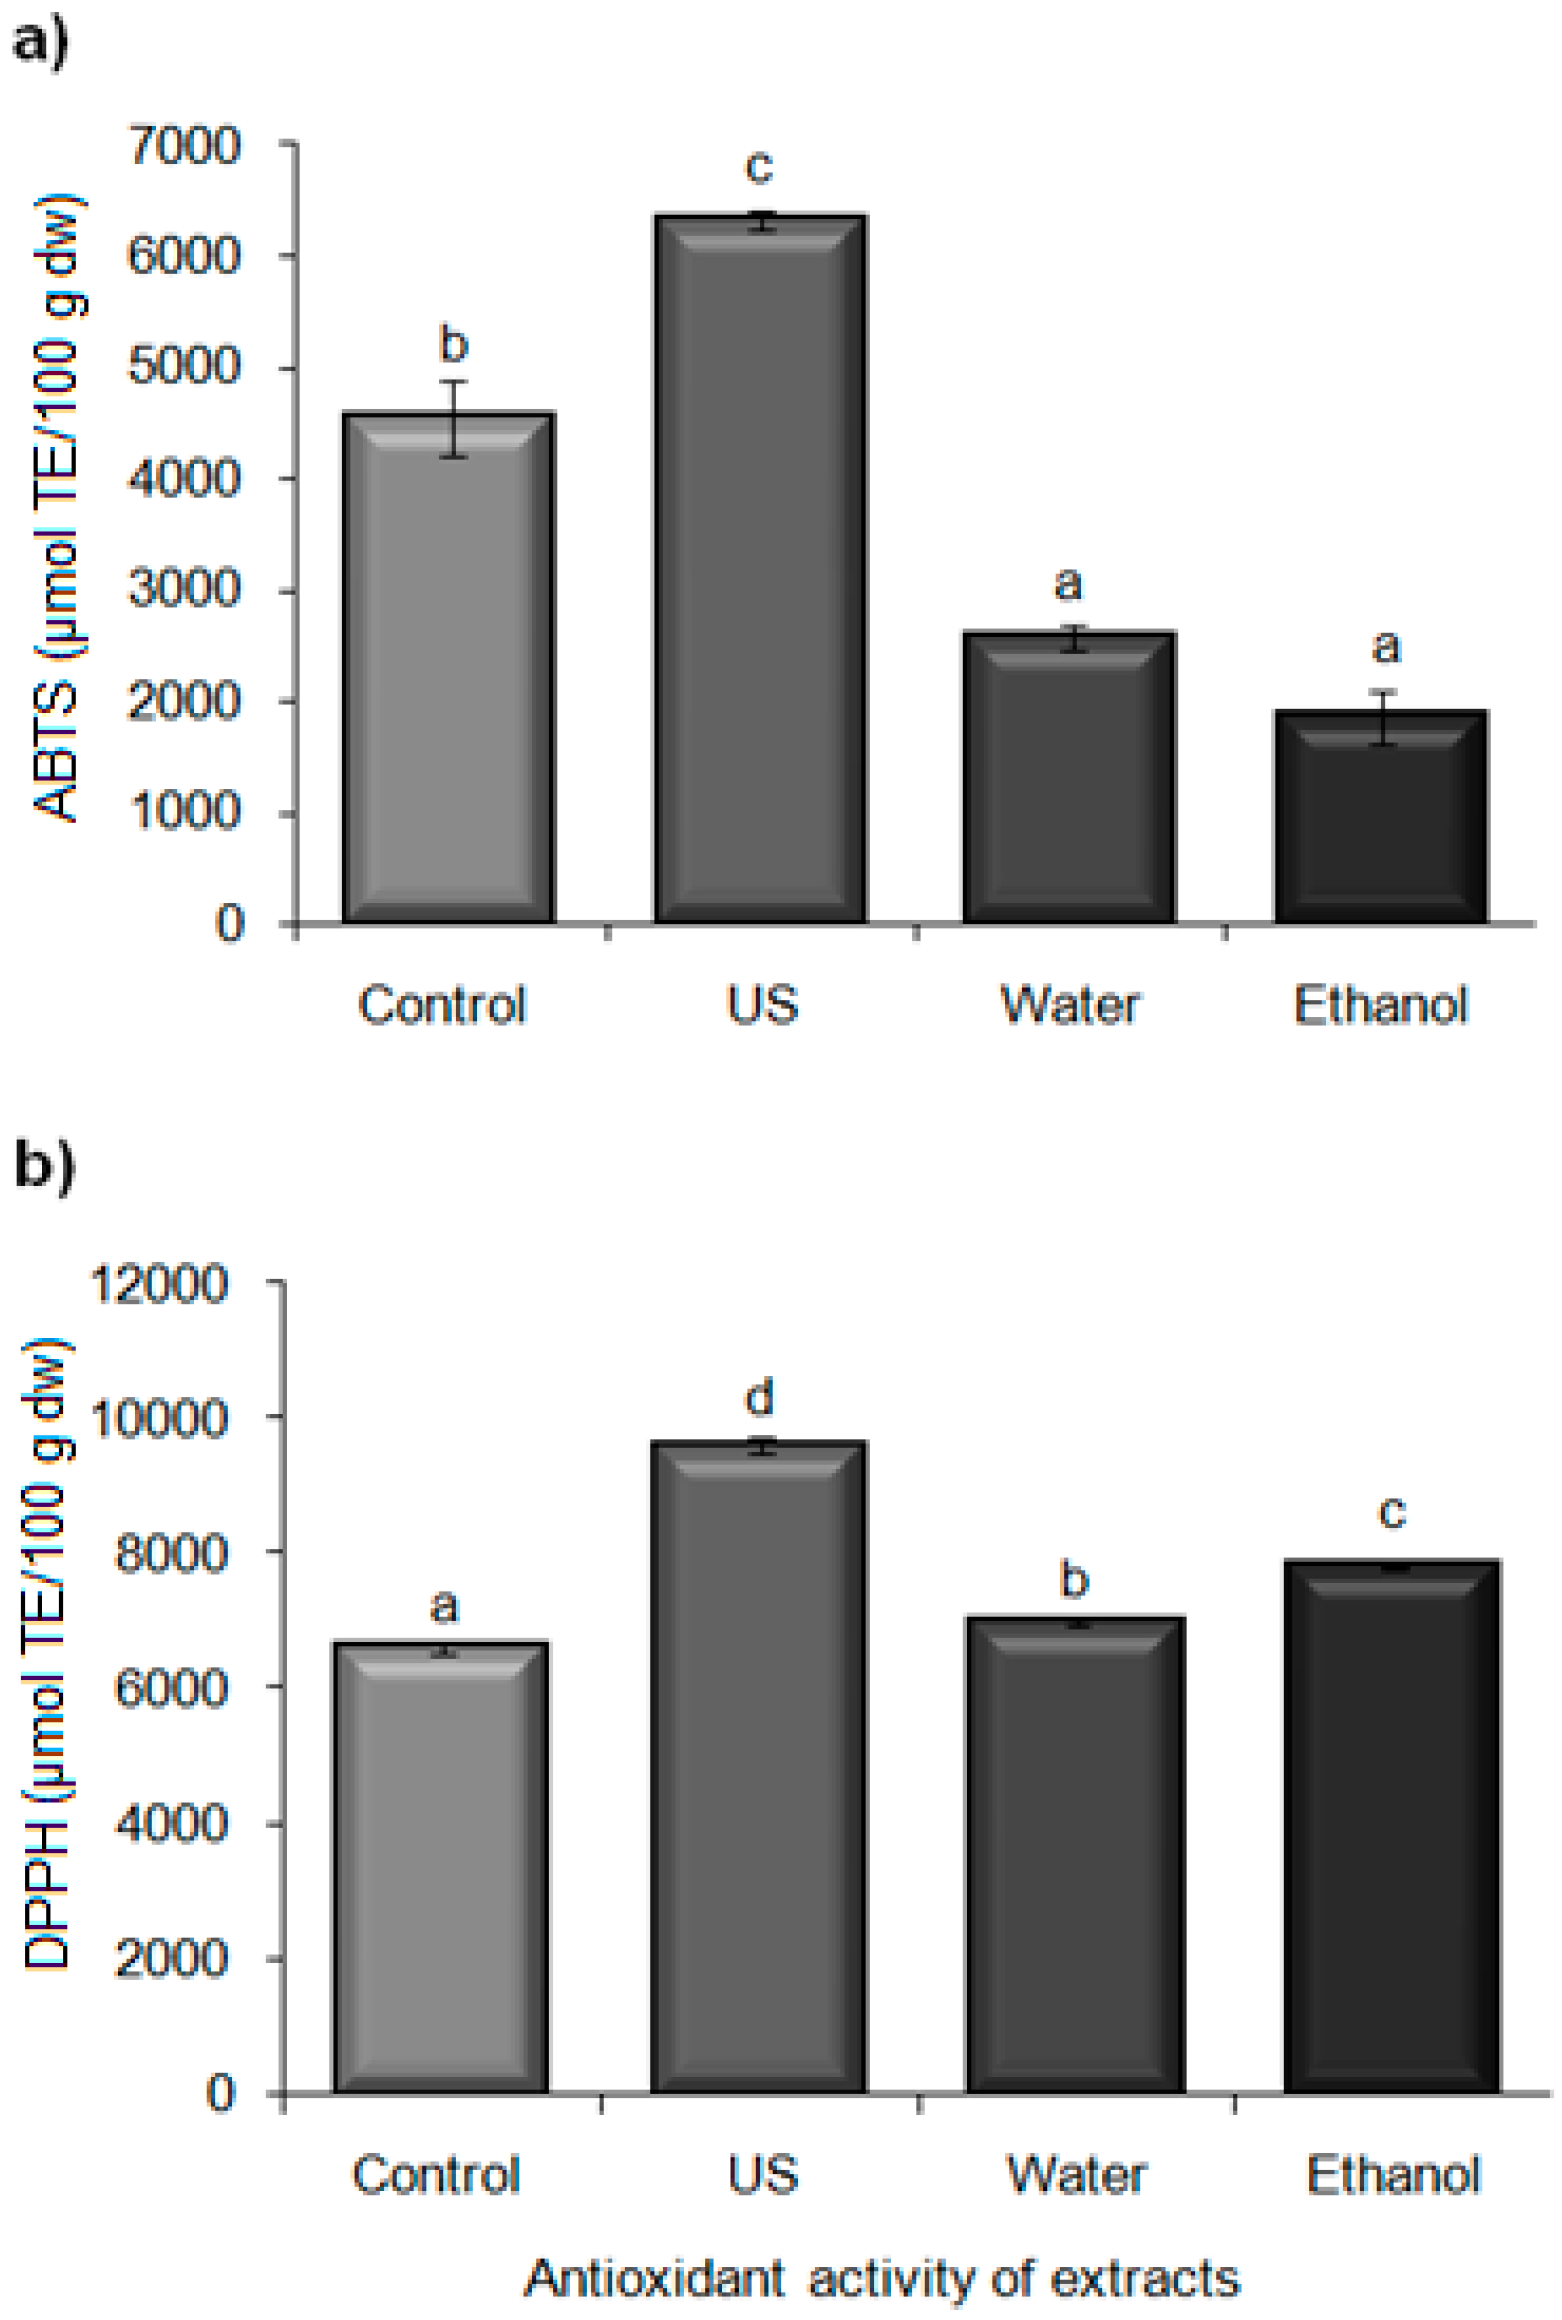
2.5. Comparison of Extracts Obtained by Ultrasound versus Conventional Methodologies from Blackberry Residues
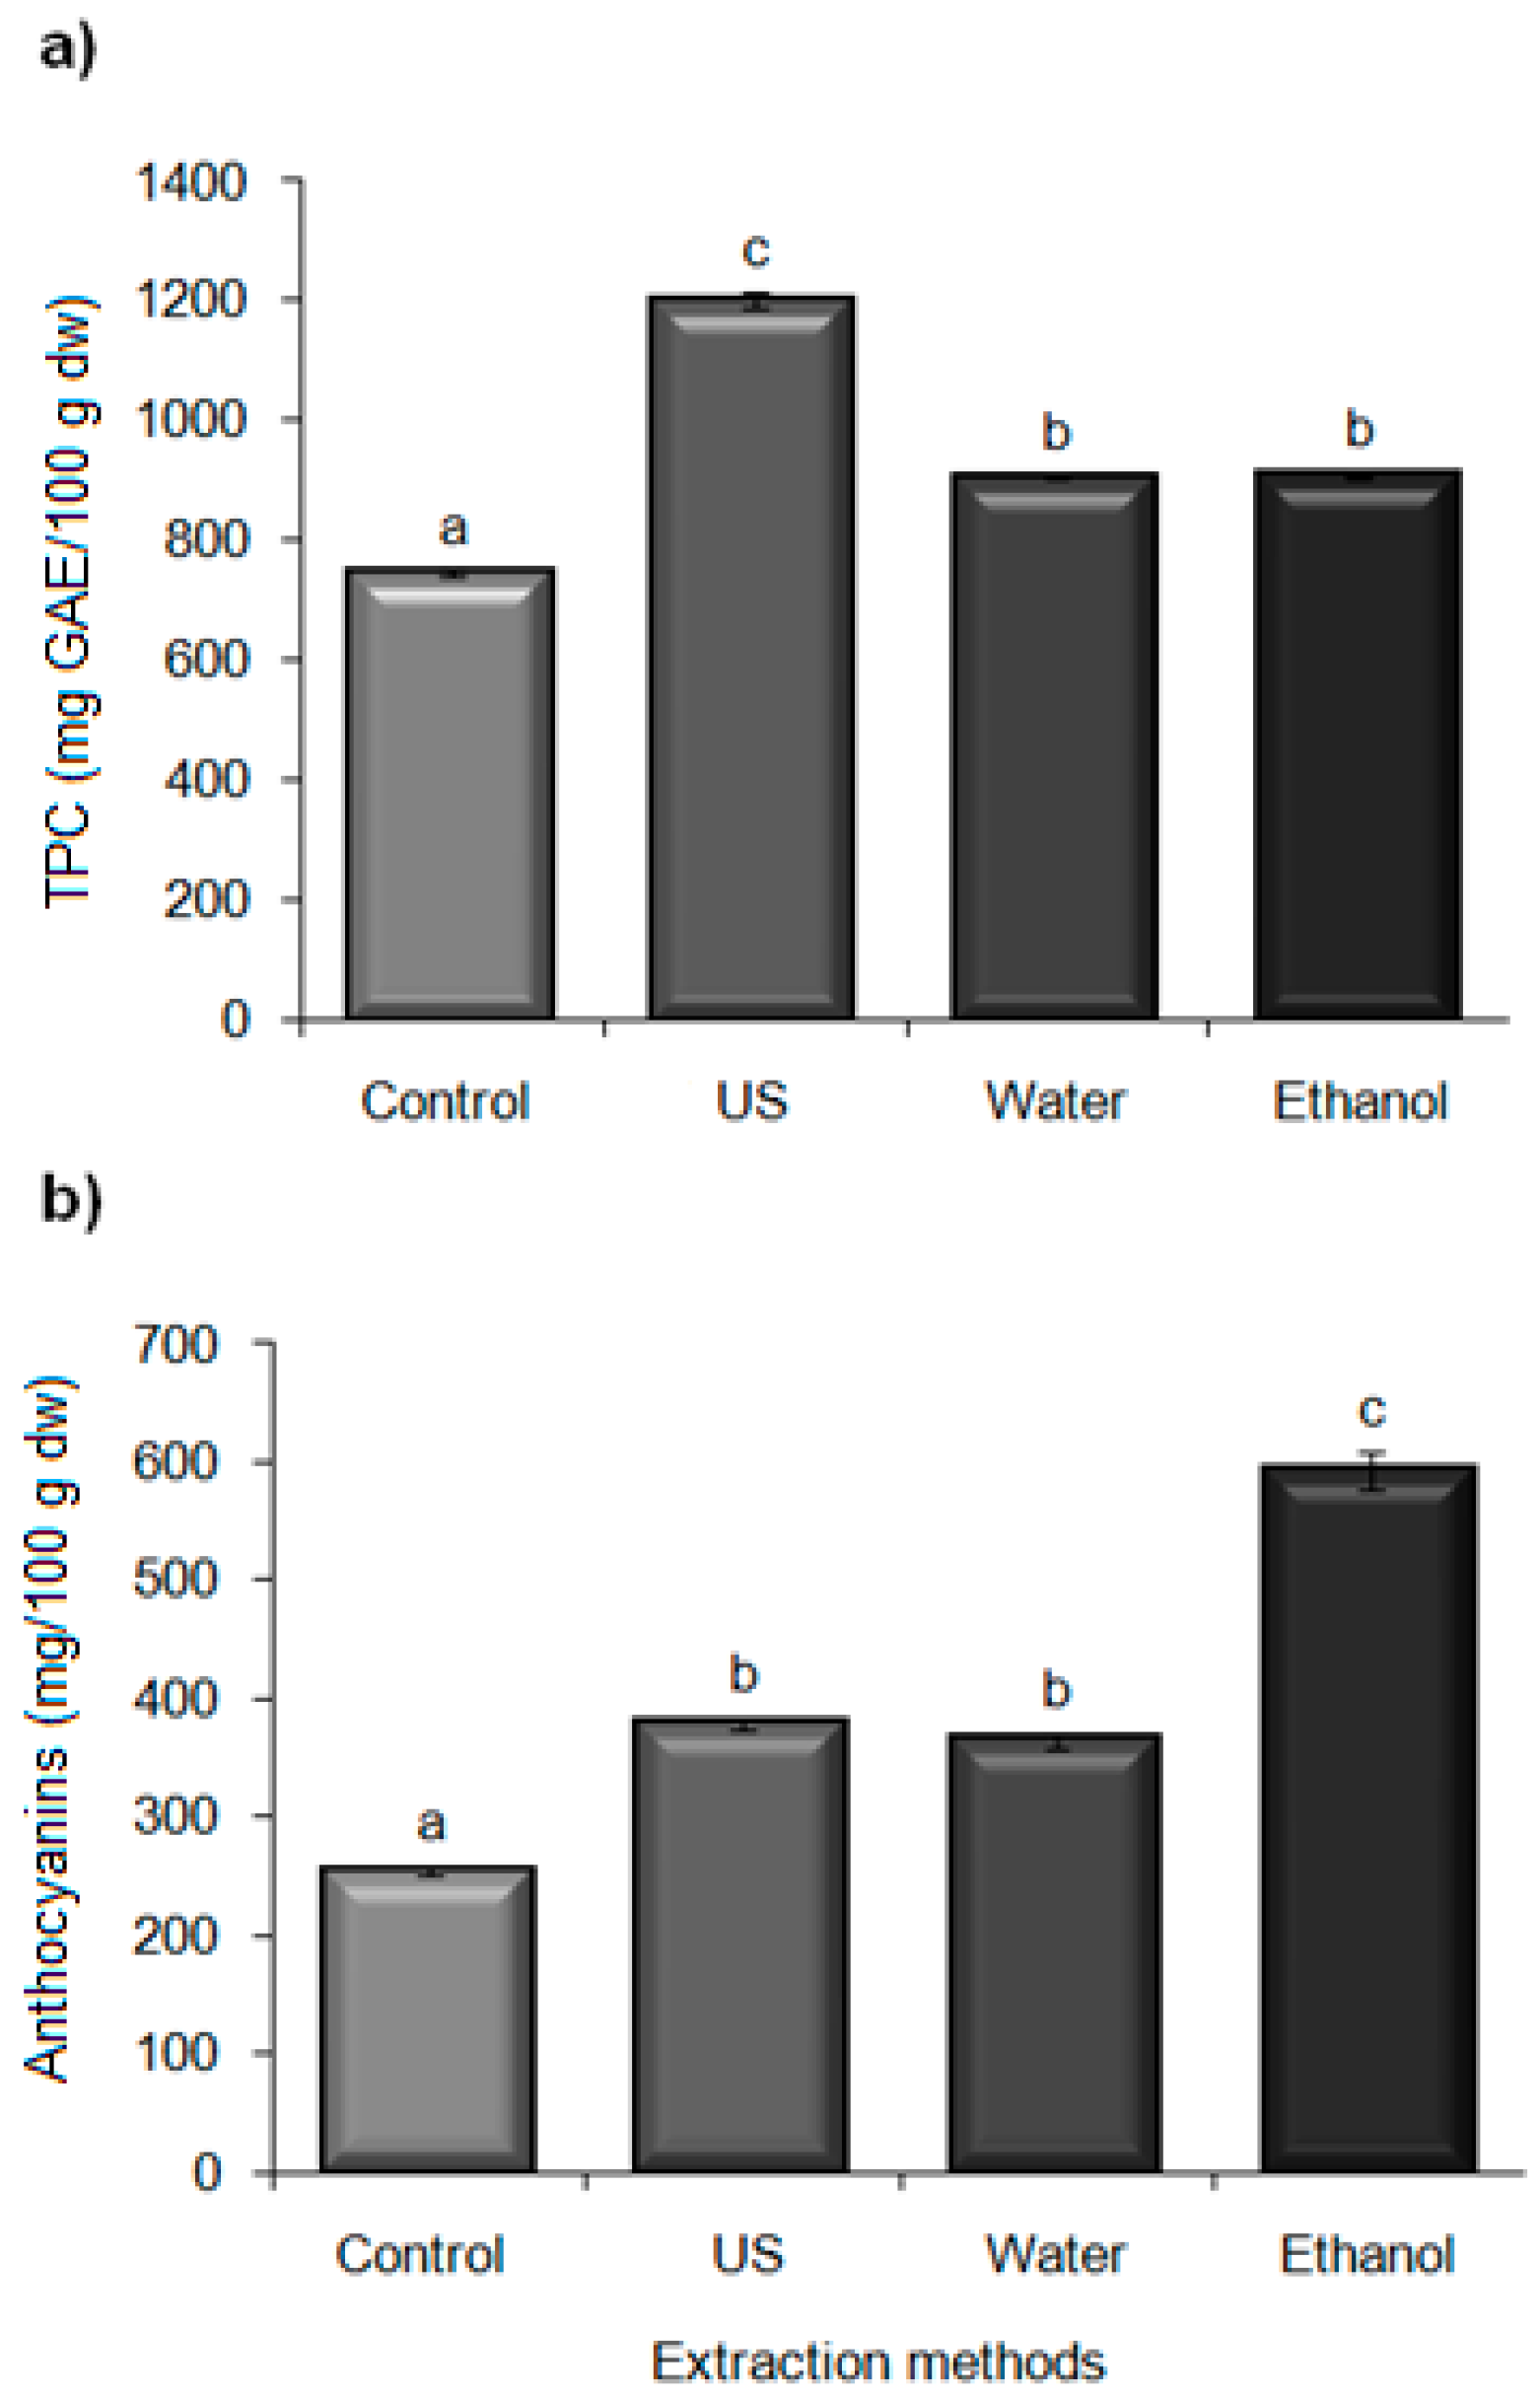
2.5.1. Total Phenolic Content Extraction
2.5.2. Anthocyanins Extraction
2.5.3. Antioxidant Activity of Extracts
3. Materials and Methods
3.1. Reagents
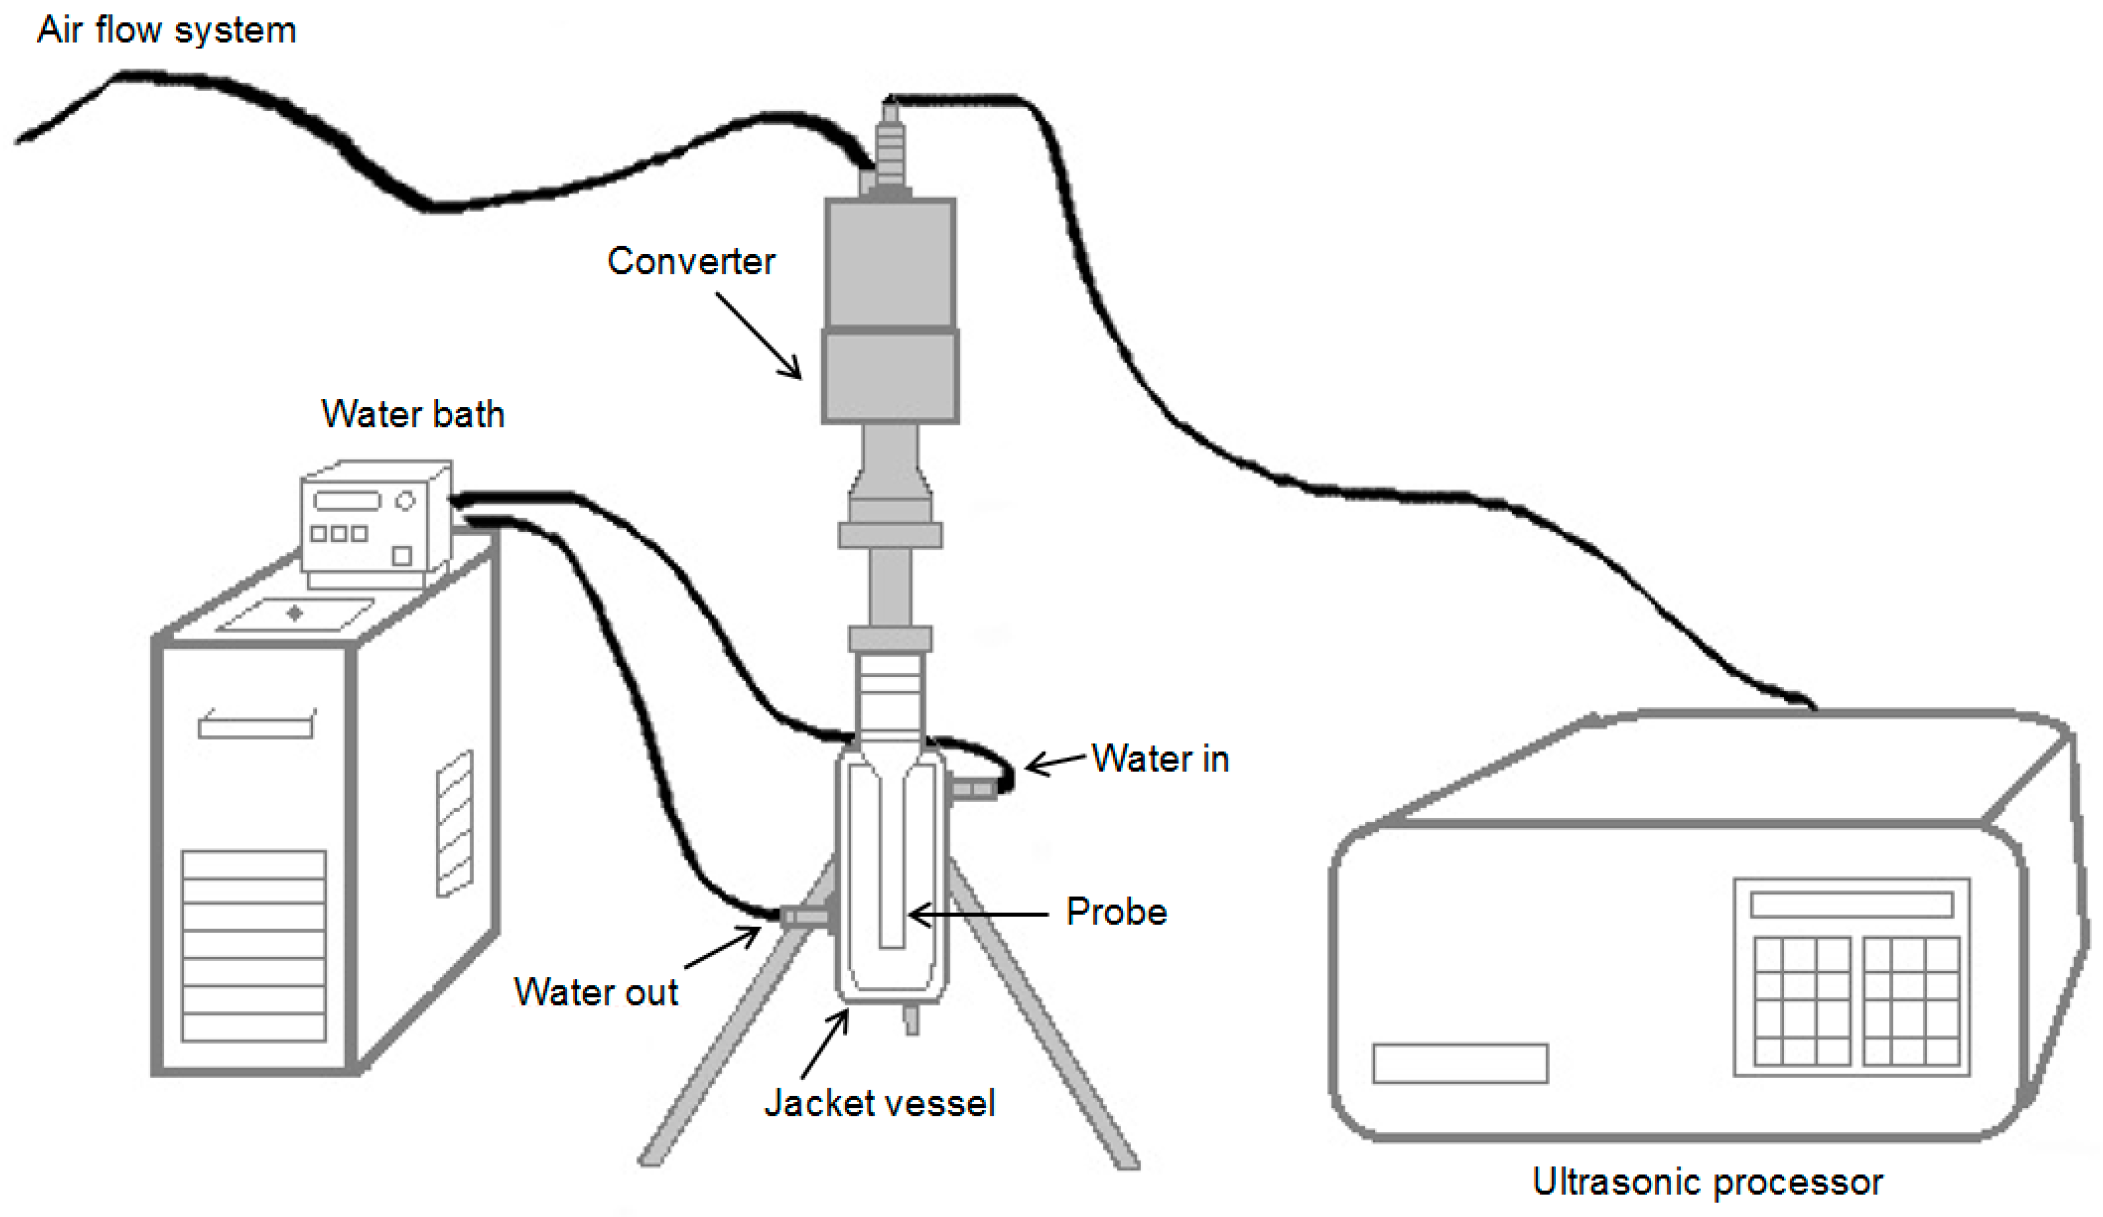
3.2. Instruments
3.3. Sample Preparation
3.4. Ultrasound Extraction
3.5. Experimental Design
3.6. Comparison with Other Extraction Procedures
3.7. Determination of Total Phenolic Content
3.8. Determination of Anthocyanins
3.9. Antioxidant Capacity
3.9.1. ABTS Method
3.9.2. Free Radical Scavenging Activity
3.10. Statistical Analysis
4. Conclusions
Acknowledgments
Author Contributions
Conflicts of Interest
References
- Dai, J.; Gupte, A.; Gates, L.; Mumper, R.J. A comprehensive study of anthocyanin-containing extracts from selected blackberry cultivars: Extraction methods, stability, anticancer properties and mechanisms. Food Chem. Toxicol. 2009, 47, 837–847. [Google Scholar] [CrossRef] [PubMed]
- Strik, B.C.; Clark, J.R.; Finn, C.E.; Bañados, M.P. Worldwide production of blackberries. HortTechnology 2007, 17, 205–213. [Google Scholar] [CrossRef]
- Strik, B.C. Berry crops: Worldwide area and production systems. In Berry Fruit Value-Added Products for Health Promotion; Zhao, Y., Ed.; CRC: Boca Raton, FL, USA, 2007; Volume 1, pp. 3–49. [Google Scholar]
- Cho, M.J.; Howard, L.R.; Prior, R.L.; Clark, J.R. Flavonol glycosides and antioxidant capacity of various blackberry and blueberry genotypes determined by high-performance liquid chromatography/mass spectrometry. J. Sci. Food Agric. 2005, 85, 2149–2158. [Google Scholar] [CrossRef]
- Seeram, N.P.; Heber, D. Impact of berry phytochemicals on human health: Effects beyond antioxidation. In Lipid Oxidation and Antioxidants: Chemistry, Methodologies and Health Effects; ACS Symposium; Ho, C.T., Shahidi, F.S., Eds.; Oxford University Press: New York, NY, USA, 2007; Volume 956, pp. 326–336. [Google Scholar]
- Seeram, N.P. Berries. In Nutritional Oncology, 2nd ed.; Heber, D., Blackburn, G.L., Go, V.L.W., Milner, J., Eds.; Academic Press: London, UK, 2006; pp. 615–625. [Google Scholar]
- Seeram, N.P.; Zhang, Y.; Nair, M.G. Inhibition of proliferation of human cancer cell lines and cyclooxygenase enzymes by anthocyanidins and catechins. Nutr. Cancer 2003, 46, 101–106. [Google Scholar] [CrossRef] [PubMed]
- Seeram, N.P.; Nair, M.G. Inhibition of lipid peroxidation and structure activity-related studies of the dietary constituents, anthocyanins, anthocyanidins and catechins. J. Agric. Food Chem. 2002, 50, 5308–5312. [Google Scholar] [CrossRef] [PubMed]
- Seeram, N.P.; Momin, R.A.; Bourquin, L.D.; Nair, M.G. Cyclooxygenase inhibitory and antioxidant cyanidin glycosides from cherries and berries. Phytomedicine 2001, 8, 362–369. [Google Scholar] [CrossRef] [PubMed]
- Kafkas, E.; Kosar, M.; Türemis, N.; Baser, K.H.C. Analysis of sugars, organic acids and vitamin C contents of blackberry genotypes from Turkey. Food Chem. 2006, 97, 732–736. [Google Scholar] [CrossRef]
- Pasquel, R.J.L.; Da Fonseca, M.A.P.; Barbero, G.F.; Rezende, C.A.; Martínez, J. Extraction of antioxidant compounds from blackberry (Rubus sp.) bagasse using supercritical CO2 assisted by ultrasound. J. Supercrit. Fluids 2014, 94, 223–233. [Google Scholar] [CrossRef]
- Laroze, L.E.; Díaz-Reinoso, B.; Moure, A.; Zúñiga, M.E.; Domínguez, H. Extraction of antioxidants from several berries pressing wastes using conventional and supercritical solvents. Eur. Food Res. Technol. 2010, 231, 669–677. [Google Scholar] [CrossRef]
- Lapornik, B.; Prosek, M.; Wondra, A.G. Comparison of extracts prepared from plant by-products using different solvents and extraction time. J. Food Eng. 2005, 71, 214–222. [Google Scholar] [CrossRef]
- Ignat, I.; Volf, I.; Popa, V.I. A critical review of methods for characterisation of polyphenolic compounds in fruits and vegetables. Food Chem. 2011, 126, 1821–1835. [Google Scholar] [CrossRef] [PubMed]
- Butz, P.; Tauscher, B. Emerging technologies: Chemical aspects. Food Res. Int. 2002, 35, 279–284. [Google Scholar] [CrossRef]
- Abdullah, N.; Chin, N.L. Application of thermosonication treatment in processing and production of high quality and safe-to-drink fruit juices. Agric. Agric. Sci. Procedia 2014, 2, 320–327. [Google Scholar] [CrossRef]
- Wu, J.; Gamage, T.V.; Vilkhu, K.S.; Simons, L.K.; Mawson, R. Effect of thermosonication on quality improvement of tomato juice. Innov. Food Sci. Emerg. Technol. 2008, 9, 186–195. [Google Scholar] [CrossRef]
- Valdramidis, V.P.; Cullen, P.J.; Tiwari, B.K.; O’Donnell, C.P. Quantitative modeling approaches for ascorbic acid degradation and non-enzymatic browning of orange juice during ultrasound processing. J. Food Eng. 2010, 96, 449–454. [Google Scholar] [CrossRef]
- Zafra-Rojas, Q.Y.; Cruz-Cansino, N.; Ramírez-Moreno, E.; Delgado-Olivares, L.; Villanueva-Sánchez, J.; Alanís-García, E. Effects of ultrasound treatment in purple cactus pear (Opuntia ficus-indica) juice. Ultrason. Sonochem. 2013, 20, 1283–1288. [Google Scholar] [CrossRef] [PubMed]
- Tiwari, B.K.; Muthukumarappan, K.; O’Donnell, C.P.; Cullen, P.J. Effects of sonication on the kinetics of orange juice quality parameters. J. Agric. Food Chem. 2008, 56, 2423–2428. [Google Scholar] [CrossRef] [PubMed]
- Pingret, D.; Fabiano-Tixier, A.S.; LeBourvellec, C.; Renard, C.M.; Chemat, F. Lab and pilot-scale ultrasound-assisted water extraction of polyphenols from apple pomace. J. Food Eng. 2012, 111, 73–81. [Google Scholar] [CrossRef]
- Corrales, M.; García, A.F.; Butz, P.; Tauscher, B. Extraction of anthocyanins from grape skins assisted by high hydrostatic pressure. J. Food Eng. 2009, 90, 415–421. [Google Scholar] [CrossRef]
- Revilla, E.; Ryan, J.M.; Martin, O.G. Comparison of several procedures used for the extraction of anthocyanins from red grapes. J. Agric. Food Chem. 1998, 46, 4592–4597. [Google Scholar] [CrossRef]
- Li, Z.; Pan, Q.; Cui, X.; Duan, C. Optimization on anthocyanins extraction from wine grape skins using orthogonal test design. Food Sci. Biotechnol. 2010, 19, 1047–1053. [Google Scholar] [CrossRef]
- Romero, J.C.; Yépez, V.B. Ultrasound as pretreatment to convective drying of Andean blackberry (Rubus glaucus Benth). Ultrason. Sonochem. 2015, 22, 205–210. [Google Scholar] [CrossRef] [PubMed]
- Roginsky, V.; Lissi, E.A. Review of methods to determine chain breaking antioxidant activity in food. Food Chem. 2005, 92, 235–254. [Google Scholar] [CrossRef]
- Hossain, M.B.; Brunton, N.P.; Patras, A.; Tiwari, B.; O’Donnell, C.P.; Martin-Diana, A.B.; Barry-Ryan, C. Optimization of ultrasound assisted extraction of antioxidant compounds from Marjoram (Origanum majorana L.) using response surface methodology. Ultrason. Sonochem. 2012, 19, 582–590. [Google Scholar] [CrossRef] [PubMed]
- Yokozawa, T.; Chen, C.P.; Dong, E.; Tanaka, T.; Nonaka, G.I.; Nishioka, I. Study on the inhibitory effect of tannins and flavonoids against 1,1-diphenyl 2-picrylhydrazyl radical. Biochem. Pharmacol. 1998, 56, 213–222. [Google Scholar] [CrossRef]
- Von Gadov, A.; Joubert, E.; Hansmann, C.F. Comparison of the antioxidant activity of aspalathin with that of other plant phenols of Rooibos tea (Aspalathus linearis), α-tocopherol, BHT, and BHA. J. Agric. Food Chem. 1997, 45, 632–638. [Google Scholar] [CrossRef]
- Knorr, D. Impact of non-thermal processing on plant metabolites. J. Food Eng. 2003, 56, 131–134. [Google Scholar] [CrossRef]
- Shi, J.; Yu, J.; Pohorly, J.; Young, J.C.; Bryan, M.; Wu, Y. Optimization of the extraction of polyphenols from grape seed meal by aqueous ethanol solution. J. Food Agric. Environ. 2003, 1, 42–47. [Google Scholar]
- Quirós-Sauceda, A.E.; Palafox-Carlos, H.; Sáyago-Ayerdi, S.G.; Ayala-Zavala, J.F.; Bello-Perez, L.A.; Álvarez-Parrilla, E.; González-Aguilar, G.A. Dietary fiber and phenolic compounds as functional ingredients: Interaction and possible effect after ingestion. Food Funct. 2014, 5, 1063–1072. [Google Scholar] [CrossRef] [PubMed]
- Vinatoru, M. An overview of the ultrasonically assisted extraction of bioactive principles from herbs. Ultrason. Sonochem. 2001, 8, 303–313. [Google Scholar] [CrossRef]
- Dolatowski, Z.J.; Stadnik, J.; Stasiak, D. Applications of ultrasound in food technology. Acta Sci. Pol. Technol. Aliment. 2007, 6, 89–99. [Google Scholar]
- D’Alessandro, L.G.; Dimitrov, K.; Vauchel, P.; Nikov, I. Kinetics of ultrasound assisted extraction of anthocyanins from Aronia melanocarpa (Black chokeberry) wastes. Chem. Eng. Res. Des. 2014, 92, 1818–1826. [Google Scholar] [CrossRef]
- Kahkonen, M.P.; Hopia, A.I.; Heinonen, M. Berry phenolics and their antioxidant activity. J. Agric. Food Chem. 2001, 49, 4076–4082. [Google Scholar] [CrossRef] [PubMed]
- Cacace, J.E.; Mazza, G. Optimization of extraction of anthocyanins from black currants with aqueous ethanol. J. Food Sci. 2003, 68, 240–248. [Google Scholar] [CrossRef]
- Gironi, F.; Piemonte, V. Temperature and solvent effects on polyphenol extraction process from chestnut tree wood. Chem. Res. Eng. Des. 2011, 89, 857–862. [Google Scholar] [CrossRef]
- Floros, J.D.; Liang, H. Acoustically assisted diffusion through membranes and biomaterials. Food Technol. 1994, 48, 79–84. [Google Scholar]
- Castellanos, M.M.; Reyman, D.; Sieiro, C.; Calle, P. ESR-spin trapping study on the sonochemistry of liquids in the presence of oxygen. Evidence for the superoxide radical anion formation. Ultrason. Sonochem. 2001, 8, 17–22. [Google Scholar] [CrossRef]
- Tiwari, B.K.; Patras, A.; Brunton, N.; Cullen, P.J.; O’Donell, C.P. Effect of ultrasound processing on anthocyanins and color of red grape juice. Ultrason. Sonochem. 2010, 17, 596–604. [Google Scholar] [CrossRef] [PubMed]
- Yılmaz, M.A.; Durmaz, G. Mulberry Seed Oil: A Rich Source of δ-Tocopherol. J. Am. Oil Chem. Soc. 2015, 92, 553–559. [Google Scholar] [CrossRef]
- Maran, J.P.; Manikandan, S. Response surface modeling and optimization of process parameters for aqueous extraction of pigments from Prickly pear (Opuntia ficus-indica) fruit. Dyes Pigment. 2012, 95, 465–472. [Google Scholar] [CrossRef]
- Vulic, J.J.; Tumbas, V.T.; Savatović, S.M.; Đilas, S.M.; Ćetković, G.S.; Čanadanović-Brunet, J.M. Polyphenolic content and antioxidant activity of the four berry fruits pomace extracts. Acta Period. Technol. 2011, 42, 271–279. [Google Scholar] [CrossRef]
- Singleton, V.L.; Rossi, J.A. Colorimetry of total phenolics with phosphomolybdic-phosphotungstic acid reagents. Am. J. Enol. Vitic. 1965, 16, 144–158. [Google Scholar]
- Giusti, M.M.; Wrolstad, R.E. Characterization and measurement of anthocyanins by UV-Visible spectroscopy. In Current Protocols in Food Analytical Chemistry; Wrolstad, R.E., Schwartz, S.J., Eds.; John Wiley & Sons, Inc.: New York, NY, USA, 2001. [Google Scholar]
- Kuskoski, E.; Asuero, A.G.; Troncoso, A.M.; Mancini-Filho, J.; Fett, R. Aplicación de diversos métodos químicos para determinar actividad antioxidante en pulpa de frutos. Ciênc. Tecnol. Aliment. 2005, 25, 726–732. [Google Scholar] [CrossRef]
- Morales, F.J.; Jiménez-Pérez, S. Free radical scavenging capacity of Maillard reaction products as related to colour and fluorescence. Food Chem. 2001, 72, 119–125. [Google Scholar] [CrossRef]
- Sample Availability: Not available.


| Run | Amplitude (%) | Time (min) | TPC b (mg GAE/100 g·dw) | Anthocyanins (mg/100 g·dw) | ABTS (μmol TE/100 g·dw) | DPPH (μmol TE/100 g·dw) |
|---|---|---|---|---|---|---|
| 1 | 78 (−α) | 12.5 (0) | 1094.44 ± 70 | 345.53 ± 18 | 6953.86 ± 300 | 9237.42 ± 194 |
| 2 | 85 (0) | 12.5 (0) | 1201.24 ± 13 | 352.10 ± 29 | 6165.36 ± 645 | 8575.23 ± 485 |
| 3 | 90 (+1) | 10 (−1) | 1124.52 ± 31 | 340.25 ± 03 | 5601.75 ± 104 | 7815.00 ± 74 |
| 4 | 80 (−1) | 10 (−1) | 1311.19 ± 45 | 346.32 ± 02 | 5873.31 ± 166 | 9089.02 ± 22 |
| 5 | 85 (0) | 9 (−α) | 1438.14 ± 62 | 332.04 ± 07 | 3478.45 ± 604 | 7585.90 ± 108 |
| 6 | 85 (0) | 16 (+α) | 1433.79 ± 17 | 374.68 ± 01 | 4538.77 ± 499 | 7050.25 ± 163 |
| 7 | 85 (0) | 12.5 (0) | 1205.84 ± 84 | 356.66 ± 02 | 6124.96 ± 0 | 8557.20 ± 190 |
| 8 | 85 (0) | 12.5 (0) | 1220.31 ± 45 | 352.58 ± 01 | 6226.79 ± 270 | 8474.86 ± 417 |
| 9 | 92 (+α) | 12.5 (0) | 933.63 ± 39 | 357.52 ± 03 | 6841.88 ± 458 | 9219.67 ± 207 |
| 10 | 85 (0) | 12.5 (0) | 1245.28 ± 99 | 352.87 ± 00 | 6400.90 ± 834 | 8627.29 ± 542 |
| 11 | 80 (−1) | 15 (+1) | 1329.90 ± 18 | 358.91 ± 19 | 6185.99 ± 62 | 7593.98 ± 561 |
| 12 | 85 (0) | 12.5 (0) | 1226.87 ± 50 | 354.55 ± 03 | 6207.71 ± 333 | 8609.17 ± 340 |
| 13 | 90 (+1) | 15 (+1) | 1242.89 ± 101 | 378.32 ± 04 | 6234.75 ± 419 | 9571.14 ± 59 |
| Term | Regression Coefficients | |||
|---|---|---|---|---|
| TPC | Anthocyanins | ABTS | DPPH | |
| β0 | 1219.908 a | 353.752 a | 6225.144 a | 8568.75 a |
| Linear | ||||
| β1 | −52.030 c | 3.787 c | −47.645 | 84.754 |
| β2 | 16.366 | 13.870 a | 305.649 d | −62.052 |
| Quadratic | ||||
| β11 | −84.905 a | −0.236 | 466.540 c | 390.891 c |
| β22 | 111.059 a | 0.680 | −978.089 a | −564.343 b |
| Interaction | ||||
| β12 | 24.915 | 6.37 c | 80.08 | 812.795 a |
| R2 | 0.97 | 0.97 | 0.94 | 0.95 |
| Adj-R2 | 0.94 | 0.95 | 0.89 | 0.91 |
| CV (%) | 2.41 | 0.76 | 5.05 | 2.56 |
© 2016 by the authors. Licensee MDPI, Basel, Switzerland. This article is an open access article distributed under the terms and conditions of the Creative Commons Attribution (CC-BY) license ( http://creativecommons.org/licenses/by/4.0/).
Share and Cite
Zafra-Rojas, Q.Y.; Cruz-Cansino, N.S.; Quintero-Lira, A.; Gómez-Aldapa, C.A.; Alanís-García, E.; Cervantes-Elizarrarás, A.; Güemes-Vera, N.; Ramírez-Moreno, E. Application of Ultrasound in a Closed System: Optimum Condition for Antioxidants Extraction of Blackberry (Rubus fructicosus) Residues. Molecules 2016, 21, 950. https://doi.org/10.3390/molecules21070950
Zafra-Rojas QY, Cruz-Cansino NS, Quintero-Lira A, Gómez-Aldapa CA, Alanís-García E, Cervantes-Elizarrarás A, Güemes-Vera N, Ramírez-Moreno E. Application of Ultrasound in a Closed System: Optimum Condition for Antioxidants Extraction of Blackberry (Rubus fructicosus) Residues. Molecules. 2016; 21(7):950. https://doi.org/10.3390/molecules21070950
Chicago/Turabian StyleZafra-Rojas, Quinatzin Y., Nelly S. Cruz-Cansino, Aurora Quintero-Lira, Carlos A. Gómez-Aldapa, Ernesto Alanís-García, Alicia Cervantes-Elizarrarás, Norma Güemes-Vera, and Esther Ramírez-Moreno. 2016. "Application of Ultrasound in a Closed System: Optimum Condition for Antioxidants Extraction of Blackberry (Rubus fructicosus) Residues" Molecules 21, no. 7: 950. https://doi.org/10.3390/molecules21070950
APA StyleZafra-Rojas, Q. Y., Cruz-Cansino, N. S., Quintero-Lira, A., Gómez-Aldapa, C. A., Alanís-García, E., Cervantes-Elizarrarás, A., Güemes-Vera, N., & Ramírez-Moreno, E. (2016). Application of Ultrasound in a Closed System: Optimum Condition for Antioxidants Extraction of Blackberry (Rubus fructicosus) Residues. Molecules, 21(7), 950. https://doi.org/10.3390/molecules21070950