1. Introduction
Trichilia lepidota subsp. schumanniana (Harms) T.D. Pennington (known popularly as “Cedrinho” in Santa Catarina and Minas Gerais States, Brazil) is a tree of 3-6 meters in height. This wood of this species is used to make furniture [
1]. The
Trichilia genus consists of about 230 species distributed throughout tropical America and other countries ranging from Africa and Asia [
2,
3]. Previous investigations on the chemical constituents of the dichloromethane extract from the leaves of this species revealed the presence of hydrocarbons mixtures (C
29H
60, C
31H
64 and C
33H
68), sesquiterpenes, steroids, amino acids and other compounds derived from the terpene metabolic pathway [
4].
Species of the genus
Trichilia (Meliaceae) are known to contain varied limonoid structures (tetranortriterpenoids) and other terpenic metabolites which are responsible for various biological properties. Limonoids of various
Trichilia with a wide spectrum of biological effects such as potential antiviral, analgesic, insecticidal, and insect growth inhibition activity have been documented [
5,
6]. Previous investigations involving limonoids isolated of another Meliaceae species, namely
Melia azedarach, have demonstrated antiproliferative activity against an adenocarcinoma epithelial cell line A549 [
7]. Additionally, it has been proved that limonoids from
Citrus fruits demonstrated
in vitro the capacity to induce apoptosis and to inhibit the proliferation of neuroblastoma cells [
8].
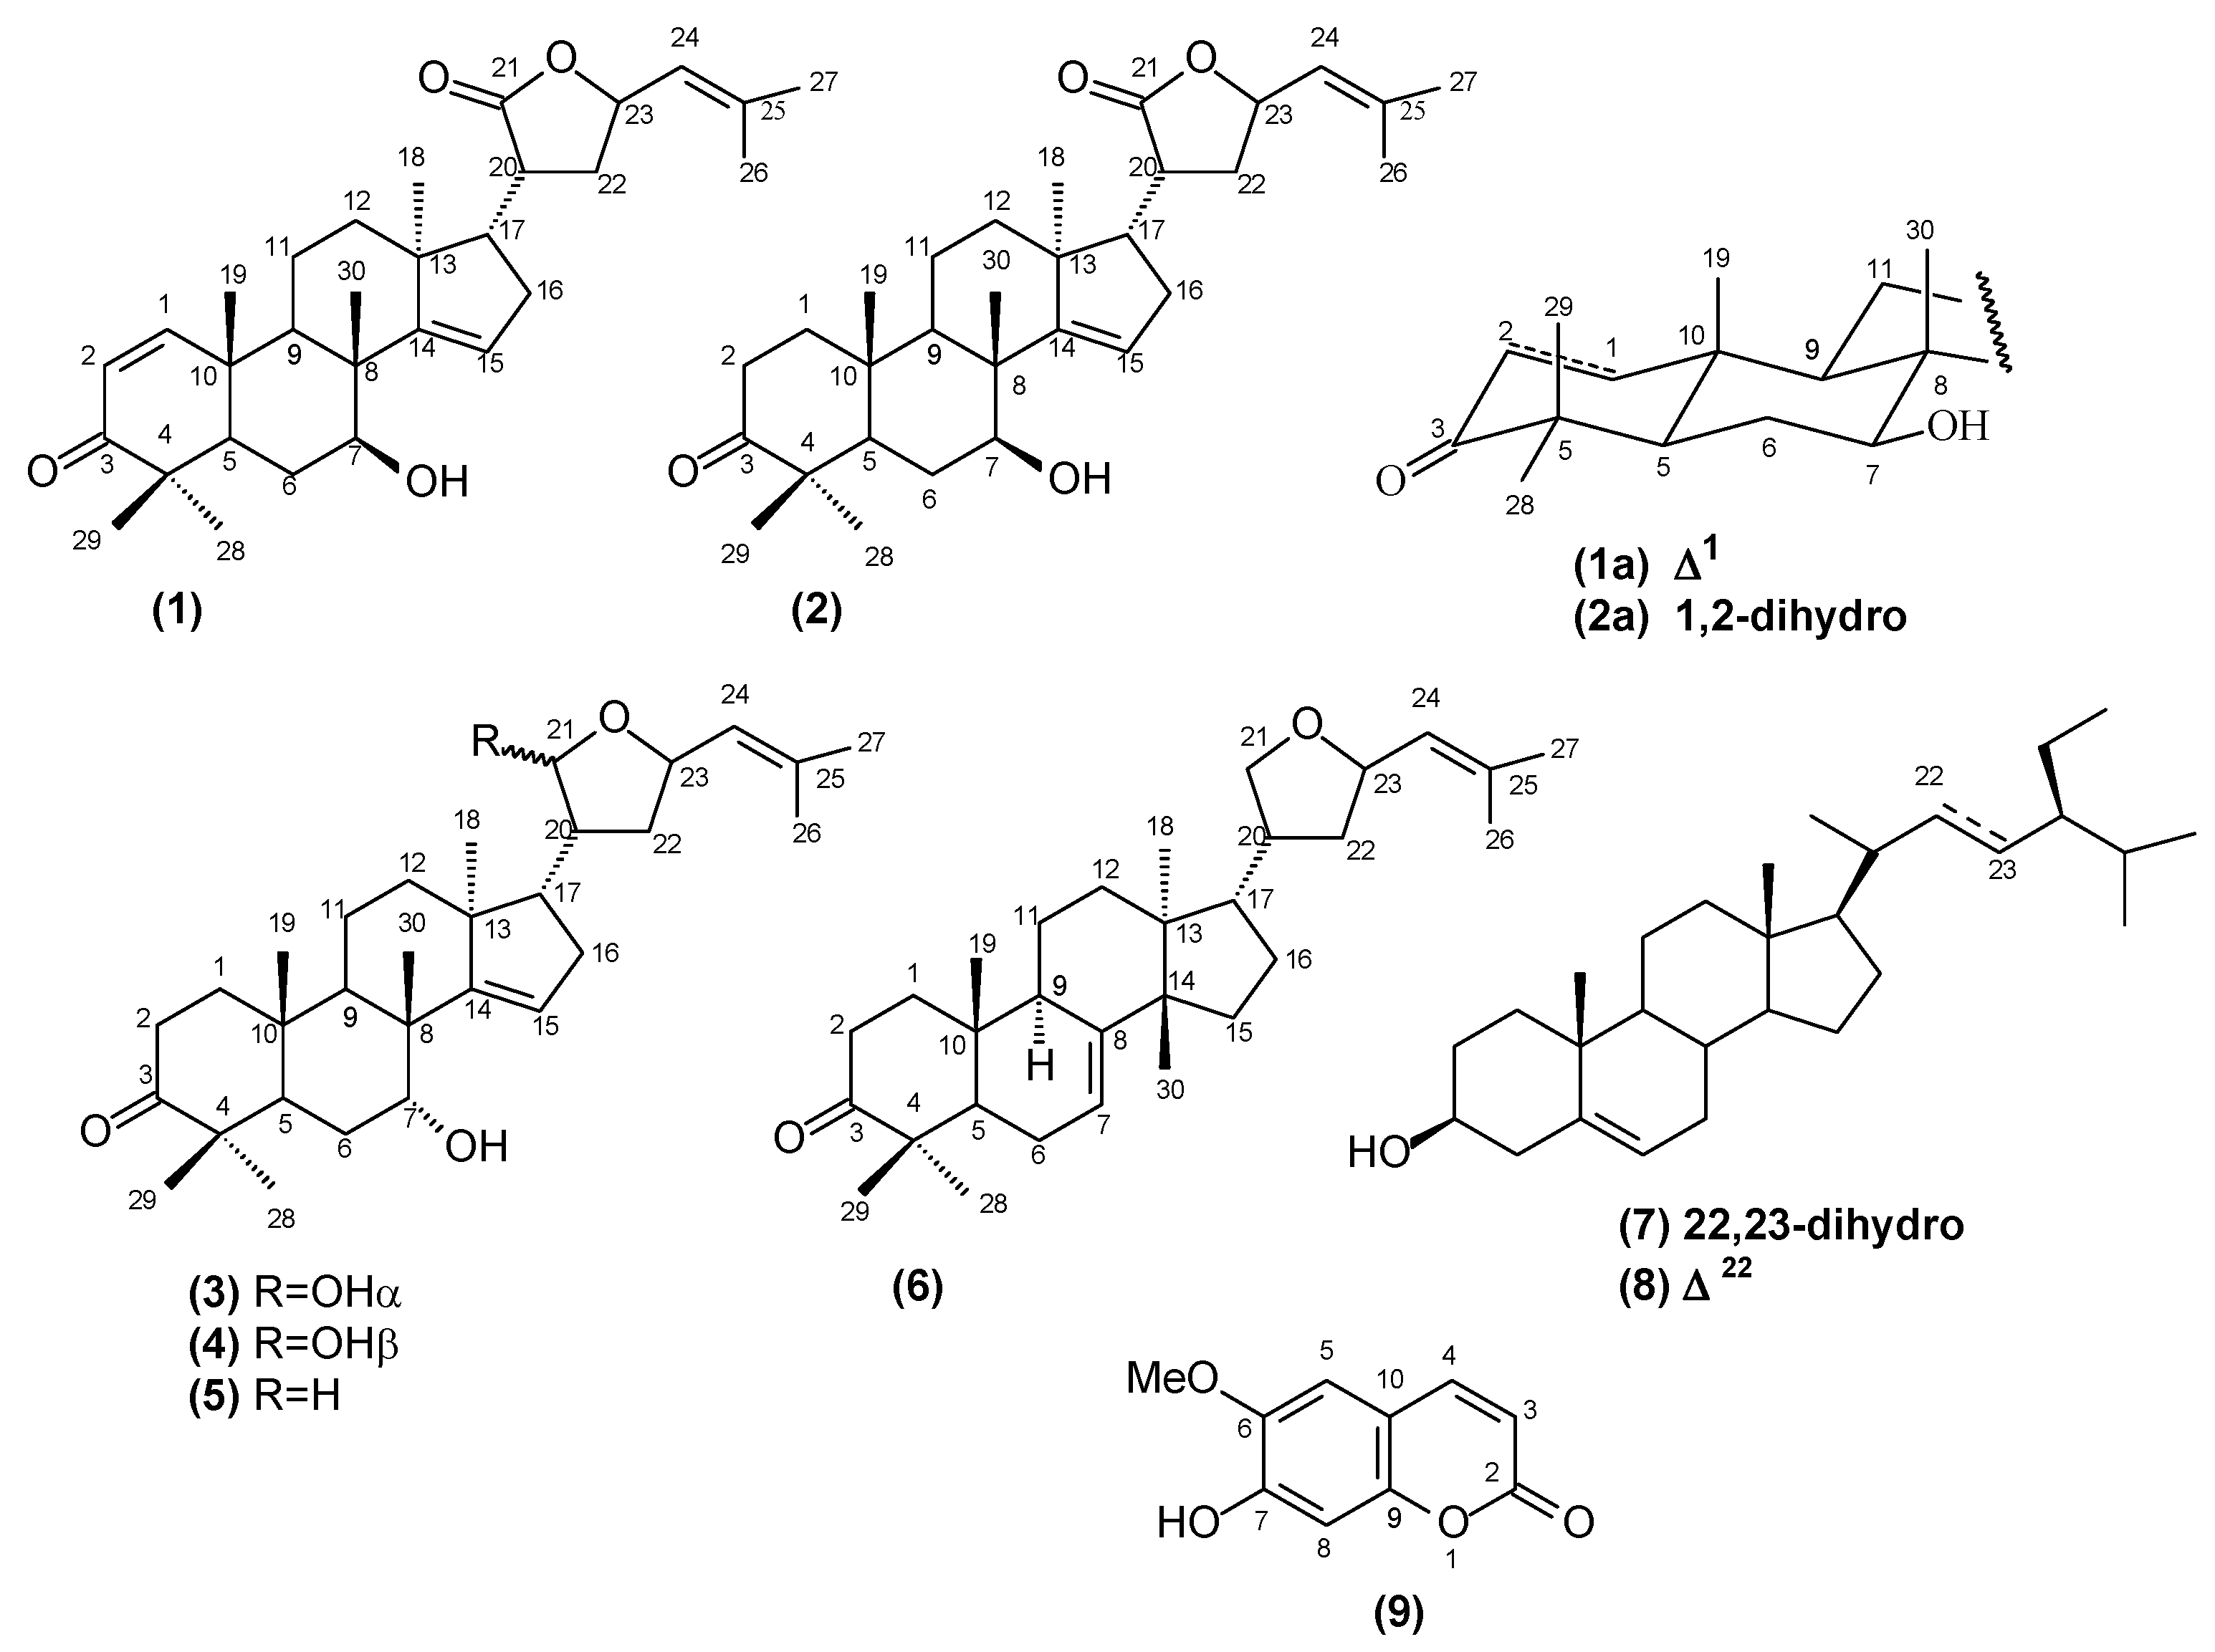
In the present paper, we describe the isolation and characterization of the mixture of two new protolimonoids named lepidotrichilin A (
1) and lepidotrichilin B (
2), along with the known protolimonoids 21,23-epoxy-7α-21α-dihydroxyapotirucalla-14,24-dien-3-one (
3), 21,23-epoxy-7α-21β-dihydroxyapotirucalla-14,24-dien-3-one (
4), dysorane D (
5) and deoxyflindissone (
6), the steroids β-sitosterol (
7) and stigmasterol (
8) and the coumarin scopoletin (
9), whose structures are summarized in
Figure 1.
Figure 1.
Chemical structures of the compounds isolated from T. lepidota.
Figure 1.
Chemical structures of the compounds isolated from T. lepidota.
The structures of the known and new compounds were established on the basis of spectral data, mainly 1H- and 13C-NMR (1D and 2D), HRESIMS spectra and by comparison with literature data. This paper also describes the viability of human leukemic lineages cells U937 and MOLT-4 treated with the hexane and methanol extracts, the mixture of the protolimonoids lepidotrichilins A (1) and B (2) and the protolimonoid desoxyflindissone (6).
2. Results and Discussion
The hexane extract of
T. lepidota leaves was eluted successively in several chromatographic columns affording a mixture of two new protolimonoids, lepidotrichilin A (
1) and lepidotrichilin B (
2), four known protolimonoids, 21,23-epoxy-7α-21α-dihydroxyapotirucalla-14,24-dien-3-one (
3), 21,23-epoxy-7α-21β-dihydroxyapotirucalla-14,24-dien-3-one (
4), dysorane D (
5), deoxyflindissone (
6) and the steroid β-sitosterol (
7). These compounds were identified by comparison of their spectroscopic data (MS, IR, 1D-
1H and
13C-NMR, 2D-NMR) with those reported in the literature [
9]. The methanol extract of
T. lepidota leaves was processed on several chromatographic columns affording two steroids, β-sitosterol (
7) and stigmasterol (
8) and the protolimonoid deoxyflindissone (
6). The methanol extract of
T. lepidota wood affording the coumarin scopoletin (
9).
The mixture of protolimonoids
1 and
2 was obtained as yellow oil. The IR spectrum (KBr disk) for the compounds showed bands at ν
max 3,438 cm
−1, attributed to a hydroxyl group, 2,925 and 2,855, attributed to methyne and methylene groups, and 1,736 and 1,649 cm
−1, attributed to two carbonyl groups at C-21(ester function) and C-3 (α,β-conjugated). The HRESIMS spectrum (positive mode) exhibited peaks at
m/z 467.3200 ([M+H]
+, calcd.
m/z 467.3161) and 489.3021 ([M+Na]
+, calcd.
m/z 489.2981) corresponding to the molecular formula C
30H
42O
4 of
1, along with additional peaks at
m/z 469.3363 ([M+H]
+, calcd.
m/z 469.3318) and 491.3188 ([M+Na]
+, calcd.
m/z 491.3137) corresponding to the molecular formula C
30H
40O
4 of
2, in accordance with ten (
1) and nine (
2) unsaturation degrees. Details of the molecular structures of compounds
1 and
2 were obtained by analysis of its
1H- and
13C-NMR spectra (
Table 1) and from the observed
1H-
1H-COSY, HMQC and HMBC correlations.
Table 1.
13C- (100 MHz) and 1H- (400 MHz) NMR data of the protolimonoids 1 and 2 in CDCl3, δ in ppm and multiplicities and J in Hz (in parenthesis), including results obtained by heteronuclear 2D shift-correlated HMQC (1JHC) and HMBC (nJHC n = 2 and 3) *.
Table 1.
13C- (100 MHz) and 1H- (400 MHz) NMR data of the protolimonoids 1 and 2 in CDCl3, δ in ppm and multiplicities and J in Hz (in parenthesis), including results obtained by heteronuclear 2D shift-correlated HMQC (1JHC) and HMBC (nJHC n = 2 and 3) *.
| | 1 | 2 |
|---|
| | HMQC | HMBC | HMQC | HMBC |
|---|
| | δC | δH | 2JHC | 3JHC | δC | δH | 2JHC | 3JHC |
|---|
| C | | | | | | | | |
| 3 | 204.0 | - | | H-1; 3H-28; 3H-29 | 218.0 | - | | 3H-28; 3H-29 |
| 4 | 44.2 | - | | | 46.7 | - | | |
| 8 | 44.2 | - | | | 44.2 | - | | |
| 10 | 41.8 | - | | | 37.2 | - | | |
| 13 | 46.8 | - | | | 46.9 | - | | |
| 14 | 161.0 | - | | | 161.0 | - | | |
| 21 | 178.2 | - | | | 178.2 | - | | |
| 225 | 140.0 | - | 3H-26; 3H-27 | | 140.0 | - | 3H-26; 3H-27 | |
| CH | | | | | | | | |
| 1 | 158.9 | 714 (d, 10.5) | | 3H-19 | - | - | | |
| 2 | 125.4 | 5.83 (d, 10.5) | | | - | - | | |
| 5 | 44.6 | 2.40 (m) | | | 46.7 | 2.40 (m) | | |
| 7 | 72.1 | 3.98 (d, 11.7) | | 3H-30 | 71.6 | 3.98 (d, 11.7) | | 3H-30 |
| 9 | 40.8 | | | 3H-19; 3H-30 | 41.1 | | | 3H-19;3H-30 |
| 15 | 119.6 | 5.51 (m) | | | 119.6 | 5.51 (m) | | |
| 17 | 54.7 | 2.28 (m) | | 3H-18 | 54.0 | 2.28 (m) | | 3H-18 |
| 20 | 36.8 | 1.84 (m) | | | 36.8 | 1.84 (m) | | |
| 23 | 75.3 | 5.19 (brd, 8.8) | | | 75.3 | 5.19 (brd, 8.8) | | |
| 24 | 122.8 | 5.05 (m) | | 3H-26; 3H-27 | 122.8 | 5.05 (m) | | |
| CH2 | | | | | | | | |
| 1 | - | - | | | 38.5 | | | 3H-19 |
| 2 | - | - | | | 32.2 | 2.28 | | |
| 6 | 24.8 | | | | 24.3 | | | |
| 11 | 16.2 | | | | 16.2 | | | |
| 12 | 32.0 | 2.32 (m) | | 3H-18 | 32.0 | 2.32 (m) | | 3H-18 |
| 16 | 33.9 | 2.10 (m) | | | 33.9 | 2.10 (m) | | |
| 22 | 35.0 | | | | 35.1 | | | |
| CH3 | | | | | | | | |
| 18 | 18.9 | 1.16 (s) | | | 20.2 | 1.17 (s) | | |
| 19 | 24.9 | 1.02 (s) | | | 14.9 | 1.02 (s) | | |
| 26 | 18.4 | 1.75 (brs) | | 3H-27 | 18.4 | 1.75 (brs) | | 3H-27 |
| 27 | 25.7 | 1.78 (brs) | | 3H-26 | 25.7 | 1.78 (brs) | | 3H-26 |
| 28 | 27.1 | 1.09 (s) | | | 27.7 | 1.05 (s) | | |
| 29 | 26.1 | 1.15 (s) | | | 27.2 | 1.05 (s) | | |
| 30 | 21.2 | 1.04 (s) | | | 21.5 | 1.04 (s) | | |
Comparative analysis of the
13C-NMR spectra ({
1H}- and APT) of the protolimonoids
1 and
2 was used to recognize the signals corresponding to eight non-hydrogenated [four sp
3 and four sp
2, including two carbonyl groups at
δC 204.0 (α,β-unsaturated C-3 of
1) and 218.0 (C-3 of
2)], ten to
1 (four sp
2 and six sp
3 including two linked to oxygen atom) and eight to
2 (two sp
2 and six sp
3 including two linked to oxygen atom) methine, five to
1 (all sp
3) and seven to
2 (all sp
3) methylene and seven methyl (
1 and
2) carbon atoms, corresponding to 30 carbon signals for each compound (
Table 1): (C=O)(COO)(=C)
2(C)
4(=CH)
4(CH-O)(CH-OH)(CH)
4(CH
2)
5(CH
3)
7 = C
30H
42O
4 for
1 [ten degrees of unsaturation: tetracyclic skeleton, the presence of two carbonyl groups at
δC 204.0 (α,β-unsaturated ketone C-3) and
δC 178.2 (lactone C-21) and three double bonds] and (C=O)(COO)(=C)
2(C)
4(=CH)
2(CH-O)(CH-OH)(CH)
6(CH
2)
5(CH
3)
7 = C
30H
42O
4 for
2 [nine degrees of unsaturation: tetracyclic skeleton, the presence of two carbonyl groups at
δC 218.0 (ketone C-3) and
δC 178.2 (lactone C-21) and two double bonds]. Thus, seven methyl groups and eight non-hydrogenated carbon atoms (four sp
2 and four sp
3) on each compound
1 and
2, revealed clearly the principal differences anticipated by the presence of a double bond between the carbon atoms 1 and 2 of
1 [
δC 158.9/
δH 7.14 (
J = 10.5 Hz, CH-1) and
δC 125.4/
δH 5.83 (
J = 10.5 Hz, CH-2)] and their corresponding absence in
2 suggested by two additional methylene signals [
δC 38;5 (CH
2-1) and 32.2 (CH
2-2)]. The signals corresponding to methine carbons linked to an oxygen atom HOCH-7 were observed at
δC 72.1/
δH 3.98 (
d,
J = 11.7 Hz,
1) and 71.6/
δH 3.98 (
d,
J = 11.7 Hz.
2), using a value of
J = 11.7 Hz (axial-axial interaction) to locate the hydroxyl group at OH as equatorial (
1a and
2a) and HMQC spectrum to confirm these deductions by direct heteronuclear (
1JHC) correlations. The signals (
δC/
δH) at
δC 75.3/
δH 5.19 (
brd,
J = 8.8 Hz) were attributed to CH-23 of
1 and
2. Analogous results for
1 and
2 were attributed to carbon signals of the double bonds located between C-14 (
δC 161.0) and CH-15 [
δC 119.6/
δH 5.51 (
m)] and between CH-24 [
δC 122.8/
δH 5.05 (
m)] and C-25 (
δC 140.0). The proposed structures of
1 and
2 were confirmed by analyses of the 2D NMR spectra (HMBC, HMQC and
1H-
1H-COSY), shown in
Table 1.
The location of a hydroxyl group at CH-7 in both compounds was confirmed by HMBC correlations of the signals corresponding to CH-7 of 1 (δC 72.1/δH 1.04 (3H-30, 3JHC) and 2 (δC 71.6/δH 1.04 (3H-30, 3JHC). The value from the coupling constants (J = 11 7 Hz) corresponding to a vicinal interaction (3JH,H) between the hydrogens H-7 (δH 3.98, d, 11.7 Hz) with H-6ax is consistent with the axial-axial interaction shown in 1/1a and 2/2a. The significant differences between 1 and 2 can be attributed to the presence of the one more endocyclic (J = 10.5 Hz, cis) double bond in the ring-A (CH-1/CH-2) of 1. The protolimonoids 1 and 2 were named lepidotrichilin A (1) and lepidotrichilin B (2, 1,2-dihydro-lepidotrichilin A).
The compounds
3,
4 and
5 were obtained as colorless crystals, their
13C-NMR spectra showed 30 carbon signals. The compounds
3,
4 and
5 were identified as 21,23-epoxy-7α-21α-dihydroxy-apotirucalla-14,24-dien-3-one, and 21,23-epoxy-7α-21β-dihydroxyapotiru-calla-14,24-dien-3-one previously isolated from
Luvunga sarmentosa [
10] and dysorane D isolated from
Dysoxylum roseum [
11].
The protolimonoid
6 was obtained as purple crystals. The molecular weight was deduced from a molecular ion peak at
m/z 438.3498 allowing the assignment of the molecular formula C
30H
46O
2. The IR spectrum of compound
6 showed absorptions at 1,732 cm
−1, attributed to a carbonyl group (C-3), 800, 959, 1053 and 1,377 cm
−1, attributed to a stretch of the C-O bonds in the ether function. It revealed the presence of one carbonyl functionality at
δC 217.1 (C-3), seven methyl groups, nine methylene groups (CH
2), seven methine groups (CH) including a carbon linked to an oxygen atom at (CH-23)
δC 74.7/
δH 4.61 (
dt,
J = 8.5 and 6.3 Hz) and seven nonhydrogenated carbons (C): four sp
3 and three sp
2. This compound have two double bonds between
δC 118.3 (CH-7) and
δC 145.7 (C-8);
δC 127.0 (CH-24) and
δC 135.3 (C-25). The protolimonoid
6 was identified as deoxyflindissone previously isolated from
Cornus walteri [
12] and synthesized by reduction of flindissol with lithium aluminum hydride following the oxidation of the deoxyflindissol [
13]. Compounds
7,
8 and
9 were were identified as β-sitosterol (
7), stigmasterol (
8) [
14] and scopoletin (
9) by comparison of their
1H- and
13C-NMR and GC/MS spectra with data from the literature [
15].
Cellular viability after treatment with purified compounds and plant extracts was evaluated by MTT metabolization. Reduction in cell viability in both cell lineage submitted to treatment to all extract and isolated compounds were shown on
Figure S16 (see the
Supplementary Material) and summarized in
Table 2. In all cell viability experiments DMSO was used as a normal cell culture control and meaningless cell death was observed, therefore those controls treatments were depicted as 100% of cell viability compared to the cell culture treated with compounds and extracts. Concerning cell death control 15 µgmL
−1 of cisplatin was used to treat the cells and 90% of cell death was observed. Based on both leukemia cell viability analyses, our data suggest that protolimonoid
6 would be more active than the protolimonoid compounds
1 and
2.
Our results are in agreement with the activity limonoids isolated from
Citrus [
8], which were able to reduce viability of neuroblastoma cell line SH-SY5Y. In contrast to our data, the limonoids isolated from
Toona ciliata var.
pubescens [
16] were inactive or had weak activity on cancer and non-cancer cell line, but were able to inhibit CDC25B dual specificity phosphatase. Altogether, these data suggest a range of biological activity associated with a variety of limonoids molecules structures.
Table 2 lists the IC
50 values for cellular viability and LDH release. Analysis of the IC
50 values shows that the isolated protolimonoid
6 was more efficient at inducing cellular cytotoxicity than the new protolimonoids
1 and
2.
Table 2.
IC50 determination for cellular viability and LDH release.
Table 2.
IC50 determination for cellular viability and LDH release.
| | U937-IC50 (µgmL−1) | MOLT4-IC50 (µgmL−1) |
|---|
| Extract/Compound | Viability-MTT | LDH-Release | Viability-MTT | LDH-Release |
| 1 and 2 | 48.0 | 681.4 | 42.7 | 315.0 |
| 6 | ≤9.3 | 32.8 | ≤9.3 | 19.8 |
| Methanol extract | 61.4 | 528.3 | 47.4 | 472.7 |
| Hexane extract | <62.5 | <62.5 | <62.5 | 88.2 |
The lower IC
50 value 9.3 µgmL
−1 was observed for protolimonoid
6 for both cells line U937 and MOLT-4. Among the
T. lepidota extracts the hexane ones were more efficient than the methanol ones. Comparing the values of IC
50 for LDH release and cellular cytotoxicity we can observe that the sample concentration to induce LDH release was much higher than the sample concentration to induce cytotoxicity. Those data suggested that cell death occurred by apoptosis. Other studies on limonoids showed that these compounds were able to reduce cell viability and induce apoptosis in some cancer cells. Tian
et al. showed that four isolated limonoids from
Citrus reticulata induced cell death by apoptosis in breast cancer cell line (MCF-7) [
17]. Additionally neuroblastoma cell culture was shown to die by apoptosis when incubated with limonoids isolated from
Citrus [
8].
3. Experimental
3.1. General Procedures
The IR spectrum was measured on a Shimadzu IR affinity spectrometer. 1H- and 13C-NMR, APT-NMR and 2D-NMR spectra (1H-1H-COSY, HMQC and HMBC) were recorded on a Jeol Eclipse-400 (400 MHz for 1H and 100 MHz for 13C), using CDCl3 as the solvent. High resolution electrospray ionization mass spectra (HRESIMS) were acquired using a LCMS-IT-TOF (Shimadzu) spectrometer, at the Departmento de Química Orgânica e Inorgânica, UFC, Fortaleza, Ceará, Brazil.
3.2. Plant Material
The leaves (1.9 kg) and wood (2.4 kg) of T. lepidota subsp. schumanniana (Harms) T. D. Pennington were collected in November 2006 at Vale Doce Forest Reserve, Linhares City, Espírito Santo State, Brazil. A voucher specimen (CVRD 8743) is deposited at Vale Doce Forest Reserve herbarium, Linhares, Espírito Santo State, Brazil.
3.3. Extraction and Isolation
The leaves (1.9 Kg) were dried, powdered and extracted consecutively with hexane (3 L) and methanol (3 L) for three time and ambient temperature. The hexane extract of T. lepidota leaves (24.8 g) was subjected to chromatography on silica gel 60G (63-200 µm, Merck), using a gradient of hexane-ethyl acetate. Initially 100% hexane was used, and then the composition was changed to 100% ethyl acetate in 5% increments, affording 13 fractions. The fraction 3 (1.32 g) was rechomatographed (hexane-ethyl acetate) affording 10 fractions. The fraction 3.4 (99.0 mg) was subjected to preparative chromatography, eluted with an ethyl acetate-hexane mixture (35:75, v/v), affording protolimonoid 6 (14.8 mg). Fraction 4 (3.17 g) after column chromatography using a gradient of hexane-ethyl acetate (initially 90% hexane was used, and then the composition was changed to 100% ethyl acetate in 5% increments), affording a mixture of steroids 7 and 8 (923.0 mg). Fraction 8 (1.70 g) after column chromatography using a gradient of hexane-ethyl acetate (initially 90% hexane was used, and then the composition was changed to 100% ethyl acetate in 5% increments), affording 11 fractions. The crystals of fraction 8.6 were collected affording protolimonoids 3, 4 and 5 (79.3 mg). Fraction 10 (1.09 g) after column chromatography using a gradient of CH2Cl2-MeOH (initially 90% CH2Cl2 was used, and then the composition was changed to 100% dichloromethane in 1% increments, and then CH2Cl2-MeOH (9:1, v/v)) affording six fractions. The fraction 10.2 (97.8 mg) after column chromatography using a gradient of hexane-ethyl acetate (initially 90% hexane was used, and then the composition was changed to 100% ethyl acetate in 5% increments) affording a mixture a new protolimonoids 1 (37.2%) and 2 (62.8%; 14.3 mg in total).
The methanol extract of T. lepidota leaves (17.35 g) was fractionated on silica gel 60G (63-200 µm, Merck), using a gradient of CH2Cl2-MeOH. Initially 100% dichloromethane was used, and then the composition was changed to 5% methanol in 1% increments affording eight fractions. Fraction 8.4 affording a mixture of steroids 7 and 8 (392.7 mg). Fraction 8.5 (609.2 mg) was subjected to chromatography on silica gel 60G (63-200 µm, Merck), using a gradient of CH2Cl2-MeOH, mixed with activated charcoal. Initially 100% dichloromethane was used, and then the composition was changed to 5% methanol in 1% increments affording the protolimonoid desoxyflindissone 6 (27.7 mg).
The wood (1.5 kg) was dried, powdered and extracted with methanol (3 L) for three time and ambient temperature. The extract of T. lepidota wood (29.47 g) was first submitted to a liquid-liquid partition with H2O-CH2Cl2 (1:3). Part of the dichloromethane fraction (150.0 mg) was fractionated by column chromatography using a gradient of CH2Cl2-MeOH. Initially 100% dichloromethane was used, and then the composition was changed to 5% methanol in 1% increments, affording coumarin 9 (17.4 mg).
3.4. Spectroscopic Data
Lepidotrichilin A (
1)
+ Lepidotrichilin B (
2). Obtained as yellow oil. HRESIMS (positive mode)
m/z 467.3200 ([M+H]
+, calcd.
m/z 467.3161) and 489.3021 ([M+Na]
+, calcd.
m/z 489.2981)
1);
m/z 469.3363 ([M+H]
+, calcd.
m/z 469.3318) and 491.3188 ([M+Na]
+, calcd.
m/z 491.3137)
2);
1H- and
13C-NMR data,
see Table 1.
21,23-Epoxy-7α-21α-dihydroxyapotirucalla-14,24-dien-3-one (3): Obtained as colorless crystals; 13C-NMR δ (ppm): 217.4 (C-3); 46.9 (C-4); 44.0 (C-8); 37.3 (C-10); 46.8 (C-13); 161.9 (C-14); 135.2 (C-25); 46.5 (CH-5); 72.2 (CH-7); 40.9 (CH-9); 119.9 (CH-15); 58.8 (CH-17); 48.2 (CH-20); 90.3 (CH-21); 74.7 (CH-23); 126.6 (CH-24); 38.4 (CH2-1); 33.6 (CH2-2); 24.9 (CH2-6); 16.4 (CH2-11); 33.7 (CH2-12); 35.5 (CH2-16); 38.2 (CH2-22); 19.5 (CH3-18); 14.9 (CH3-19); 18.2 (CH3-26); 25.9 (CH3-27); 26.4 (CH3-28); 21.3 (CH3-29); 27.3 (CH3-30). 1H-NMR δ (ppm): (2.10; m; H-5); (3.96; s; H-7); (2.00; m; H-9); (5.49; s; H-15); (1.65; m; H-17); (2.38; m; H-20); (5.06; m; H-21); (4.62; m; H-23); (5.21; d; J = 8.8 Hz; H-24); (1.48 and 1.76; m; 2H-1); (2.38 and 2.50; m; 2H-2); (1.80 and 1.32; m; 2H-6); (1.60 and 1.54; m; 2H-11); (1.68 and 1.40; m; 2H-12); (2.18; m; 2H-16); (1.70; m; 2H-22); (1.02; s; 3H-18); (1.00; s; 3H-19); (1.69; s; 3H-26); (1.72; s; 3H-27); (1.10; s; 3H-28); (1.05; s; 3H-29); (1.09; s; 3H-30).
21,23-Epoxy-7α-21β-dihydroxyapotirucalla-14,24-dien-3-one (4): Obtained as colorless crystals; 13C-NMR δ (ppm): 217.4 (C-3); 46.9 (C-4); 44.0 (C-8); 37.3 (C-10); 46.8 (C-13); 161.9 (C-14); 135.2 (C-25); 46.5 (CH-5); 72.2 (CH-7); 40.9 (CH-9); 119.9 (CH-15); 58.8 (CH-17); 48.2 (CH-20); 91.6 (CH-21); 74.7 (CH-23); 126.6 (CH-24); 38.4 (CH2-1); 33.6 (CH2-2); 24.9 (CH2-6); 16.4 (CH2-11); 33.7 (CH2-12); 35.5 (CH2-16); 38.2 (CH2-22); 19.5 (CH3-18); 14.9 (CH3-19); 18.2 (CH3-26); 25.9 (CH3-27); 26.4 (CH3-28); 21.3 (CH3-29); 27.3 (CH3-30). 1H-NMR δ (ppm): (2.10; m; H-5); (3.96; s; H-7); (2.00; m; H-9); (5.49; s; H-15); (1.65; m; H-17); (2.38; m; H-20); (5.06; m; H-21); (4.62; m; H-23); (5.21; d; J = 8.8 Hz; H-24); (1.48 and 1.76; m; 2H-1); (2.38 and 2.50; m; 2H-2); (1.80 and 1.32; m; 2H-6); (1.60 and 1.54; m; 2H-11); (1.68 and 1.40; m; 2H-12); (2.18; m; 2H-16); (1.70; m; 2H-22); (1.02; s; 3H-18); (1.00; s; 3H-19); (1.69; s; 3H-26); (1.72; s; 3H-27); (1.10; s; 3H-28); (1.05; s; 3H-29); (1.09; s; 3H-30).
Dysorone D (5): Obtained as colorless crystals; 13C-NMR δ (ppm): 217.4 (C-3); 46.9 (C-4); 44.0 (C-8); 37.3 (C-10); 46.8 (C-13); 161.9 (C-14); 135.2 (C-25); 46.5 (CH-5); 72.2 (CH-7); 40.9 (CH-9); 119.9 (CH-15); 58.8 (CH-17); 40.3 (CH-20); 74.7 (CH-23); 126.6 (CH-24); 38.4 (CH2-1); 33.6 (CH2-2); 24.9 (CH2-6); 16.4 (CH2-11); 33.7 (CH2-12); 35.5 (CH2-16); 72.3 (CH2-21); 38.2 (CH2-22); 19.5 (CH3-18); 14.9 (CH3-19); 18.2 (CH3-26); 25.9 (CH3-27); 26.4 (CH3-28); 21.3 (CH3-29); 27.3 (CH3-30). 1H-NMR δ (ppm): (2.10; m; H-5); (3.96; s; H-7); (2.00; m; H-9); (5.49; s; H-15); (1.65; m; H-17); (2.38; m; H-20); (4.62; m; H-23); (5.21; d; J = 8.8 Hz; H-24); (1.48 and 1.76; m; 2H-1); (2.38 and 2.50; m; 2H-2); (1.80 and 1.32; m; 2H-6); (1.60 and 1.54; m; 2H-11); (1.68 and 1.40; m; 2H-12); (2.18; m; 2H-16); [(4.08; t, J = 7.0 Hz; H-21a); (3.25; td; J = 7.0 and 8.2 Hz; H-21b)]; (1.70; m; 2H-22); (1.02; s; 3H-18); (1.00; s; 3H-19); (1.69; s; 3H-26); (1.72; s; 3H-27); (1.10; s; 3H-28); (1.05; s; 3H-29); (1.09; s; 3H-30).
Deoxyflindissone (6): Purple crystals; m.p. 123 ºC; 13C-NMR δ (ppm): 217.1 (C-3); 48.1 (C-4); 145.7 (C-8); 35.3 (C-10); 43.9 (C-13); 50.9 (C-14); 135.3 (C-25); 51.1 (CH-5); 118.3 (CH-7); 48.5 (CH-9); 52.6 (CH-17); 42.4 (CH-20); 74.7 (CH-23); 127.0 (CH-24); 38.9 (CH2-1); 35.3 (CH2-2); 24.5 (CH2-6); 17.9 (CH2-11); 34.5 (CH2-12); 32.1 (CH2-15); 28.0 (CH2-16); 72.3 (CH2-21); 38.9 (CH2-22); 12.9 (CH3-18); 22.8 (CH3-19); 18.3 (CH3-26); 26.0 (CH3-27); 24.8 (CH3-28); 21.8 (CH3-29); 27.5 (CH3-30). 1H-NMR δ (ppm): (1.68; m; H-5); (5.31; d; J = 3.0 Hz; H-7); (2.32; m; H-9); (1.75; m; H-17); (2.25; m; H-20); (4.61; td; J = 8.5 and 6.3 Hz; H-23); (5.21; d; J = 8.5 Hz; H-24); (1.50 and 2.01; m; 2H-1); [(2.75; ddd; J = 14.1; 9.0 and 5.5 Hz; H-2a); (2.25; m; H-2b)]; (2.30 and 2.10; m; 2H-6); (1.80 and 1.60; m; 2H-11); (1.65 and 1.60; m; 2H-12); (1.70; m; 2H-15); (1.90 and 1.40; m; 2H-16); [(4.00; dd, J = 7.0 and 9.0 Hz; H-21a); (3.24; t; J = 9.0 Hz; H-21b)]; (1.78 and 1.68; m; 2H-22); (1.02; s; 3H-18); (1.12; s; 3H-19); (1.75; brs; 3H-26); (1.69; brs; 3H-27); (1.05; s; 3H-28); (0.83; s; 3H-29); (1.01; s; 3H-30). HR-ESIMS (positive mode) (m/z) 439.3402 [M+H]+ (calcd. 439.3576); 421.3313 [M−H2O+H]+ ((calcd. 4213470); 313.2400 [M−H2O−C8H12+H]+ (calcd. 313.2531); 295.2288 [M−2H2O−C8H12+H]+ (calcd. 295.2425); 403.3233 [M−2H2O+H]+ (calcd. 403.3364).
β-Sitosterol (7): 13C-NMR δ (ppm): 140.8 (C-5); 36.5 (C-10); 42.4 (C-13); 71.8 (CH-3); 121.7 (CH-6); 31.9 (CH-8); 50.2 (CH-9); 56.8 (CH-14); 56.1 (CH-17); 39.8 (CH-20); 45.9 (CH-24); 29.7 (CH-25); 37.3 (CH2-1); 31.9 (CH2-2); 42.4 (CH2-4); 34.0 (CH2-7); 21.1 (CH2-11); 39.8 (CH2-12); 24.3 (CH2-15); 28.9 (CH2-16); 31.9 (CH2-22); 26.2 (CH2-23); 23.1 (CH2-28); 12.0 (CH3-18); 19.4 (CH3-19); 18.8 (CH3-21); 19.8 (CH3-26); 19.8 (CH3-27); 11.9 (CH3-29). LRMS m/z (rel. int.): 414 (100%); 399; 381; 329; 273; 255; 231; 213.
Stigmasterol (8): 13C-NMR δ (ppm): 140.8 (C-5); 36.2 (C-10); 42.4 (C-13); 71.8 (CH-3); 121.7 (CH-6); 31.9 (CH-8); 50.2 (CH-9); 56.8 (CH-14); 56.1 (CH-17); 39.8 (CH-20); 138.3 (CH-22); 129.3 (CH-23); 50.2 (CH-24); 31.7 (CH-25); 37.3 (CH2-1); 31.9 (CH2-2); 42.4 (CH2-4); 34.0 (CH2-7); 21.1 (CH2-11); 39.8 (CH2-12); 24.3 (CH2-15); 28.9 (CH2-16); 25.4 (CH2-28); 12.0 (CH3-18); 19.4 (CH3-19); 19.1 (CH3-21); 21.2 (CH3-26); 19.8 (CH3-27); 12.0 (CH3-29). LRMS m/z (rel. int.): 412 (100%); 394; 273; 255; 231; 213.
Scopoletin (9): white amorphous powder; m.p. 206-207 ºC; 13C-NMR δ (ppm): 161.4 (C-2); 144.0 (C-6); 149.7 (C-7); 150.0 (C-9); 111.5 (C-10); 113.4 (CH-3); 143.3 (CH-4); 107.5 (CH-5); 103.2 (CH-8); 56.4 (OCH3). 1H-NMR δ (ppm): (6.27; d; J = 9.4 Hz; H-3); (7.60; d; J = 9.4 Hz; H-4); (6.85; s; H-5); (6.92; s; H-8); (3.95; s; OCH3). LRMS m/z (rel. int.): 192 (100%); 177 (63%); 164 (30%); 149 (59%); 121 (30%).
3.5. Cell Lines and Culture Conditions
Human Leukemia cells lineages U937 and MOLT-4 were grown in DMEM-12 (Gibco—BRL, Campos dos Goytacazes City, Rio de Janeiro State, Brazil) supplemented with 10% of bovine fetal serum and 20 μgmL−1 of gentamicin. The cultures were split every two or three days in 25 cm2 culture flask and maintained in incubator at 37 °C with 5% of CO2 and controlled humidity.
3.6. Extracts, Isolated Compounds and Treatments
The protolimonoids lepidotrichilin A (1) and B (2) were dissolved in DMSO and 500.0 μg·mL−1 was the highest concentration used for cell culture treatments. Due to the low solubility of the isolated protolimonoid desoxyflindissone (6) and the viscosity of the methanol and hexane extracts, 300 μL of DMSO was added to the each sample, which was homogenized and left standing for 24 h at room temperature. Samples were centrifuged at 11,000 × g for 10 min., then 200 µL of supernatant were collected and submitted to lyophilization. Freeze-dried samples were weighed and diluted in DMSO again. The starting dilution of protolimonoid desoxyflindissone (6) was 150 μg·mL−1, methanol extract 512.5 μg·mL−1 and hexane extract 1000.0 μg·mL−1. Cell viability assay was performed in 96 well plates with 5.0 × 10⁵ cellmL−1. As controls DMSO and cisplatin were included in all experiments.
3.7. Lactate Dehydrogenase Release Assay
Quantification of the enzyme lactate dehydrogenase (LDH) was performed in cell culture supernatants after treatment with the isolated compounds and plant extracts after the period of 48 hours of incubation at 37 °C. The enzyme LDH release was measured by the colorimetric assay from Doles (DLH Doles, Campos dos Goytacazes City, Brazil) according to the manufacturer's recommendation. For negative control, cells were treated with DMSO and positive control Triton was added to the culture. Optical density of the samples was measured in multichannel spectrophotometer with wavelength adjusted for 492 nm.
3.8. MTT Assay
Cell viability was determined by a 3-(4,5-dimethylthiazol-2-yl)-2,5-diphenyltetrazolium bromide (MTT) assay. MTT (5.0 mg·mL−1, 20 μL·well−1) was added to the cell culture after 48 h of treatments with different samples and incubated for 4 h at 37 °C. After incubation, 150 μL of medium from each one well was discarded and the purple crystals of MTT were dissolved by adding 100 μL of isopropanol solution with 0.0014% of HCl. After vigorous agitation the optical density of the samples was measured in multichannel spectrophotometer with wavelength adjusted for 570 nm. For negative and positive control cells were treated with DMSO and Triton, respectively.
3.9. Statistical Analyses
Data analysis was performed with GraphPad Prism Version 5.0 software with ANOVA and the powder-test of Tukey. The IC50 was calculated through the Non-linear regression test.

