1. Introduction
Testing for antioxidant activity/capacity of new synthesized chemical compounds, nutraceuticals or extracts from natural sources, is a rational method of screening for future products with potential beneficial impact on human health [
1,
2]. The methods used are usually based on an antioxidative capacity, or free radical quenching activity of the sample [
3,
4,
5]. Nevertheless, occasionally there is a discrepancy between the antioxidative activity, measured
in vitro, and the antioxidative effects observed
in vivo in human subjects after consumption of the product [
6]. One possible deviation when a strong
in vitro antioxidant does not show the same beneficial effect
in vivo, is most likely due to insufficient absorption in the gastrointestinal tract. On the other hand, some chemically “redox inactive” compounds, like fructose [
7] or mixtures of ethanol and glycerol [
8,
9], showed strong antioxidant effects
in vivo, due to a specific metabolic effect (not possible
in vitro)—an increase of plasma uric acid concentration. Even for the well-established antioxidants, like polyphenols [
10], the effect of their consumption on human health has been questioned. In fact, it has been shown that the increase in human plasma antioxidant capacity after apple consumption is due to the metabolic effect of fructose (from apple) on plasma uric acid elevation, and not due to any apple-derived antioxidant polyphenols [
7]. Our team has recently shown that increase in human plasma antioxidant capacity after red wine consumption is due to both wine polyphenols and increase of plasma uric acid [
9], and that the glycerol and ethanol in red wine are responsible for uric acid-related increases in plasma antioxidant capacity [
8]. Finally, it has been suggested that the large increase in plasma total antioxidant capacity observed after the consumption of polyphenol-rich foods is not caused by the polyphenols themselves, but is likely the consequence of increased uric acid levels [
11].
Uric acid is a well-known antioxidant that contributes significantly to the plasma antioxidant capacity [
12,
13]. However, as uric acid is a molecule with both beneficial and harmful effects on human health [
14], the determination of relative contribution of plasma uric acid increase to the antioxidative activity of new products could be very useful. Therefore, we developed a simple and rapid method for determination of uric acid-independent antioxidant capacity. The main principle for the proposed method is a combined measurement of total antioxidant capacity of a sample by FRAP assay, and specific depletion of the antioxidant (uric acid) in the sample. This approach was already reported for combined determination of FRAP and ascorbic acid in plasma, the so-called FRASC assay (ascorbat oxidase was used instead of uricase) [
15].
2. Results and Discussion
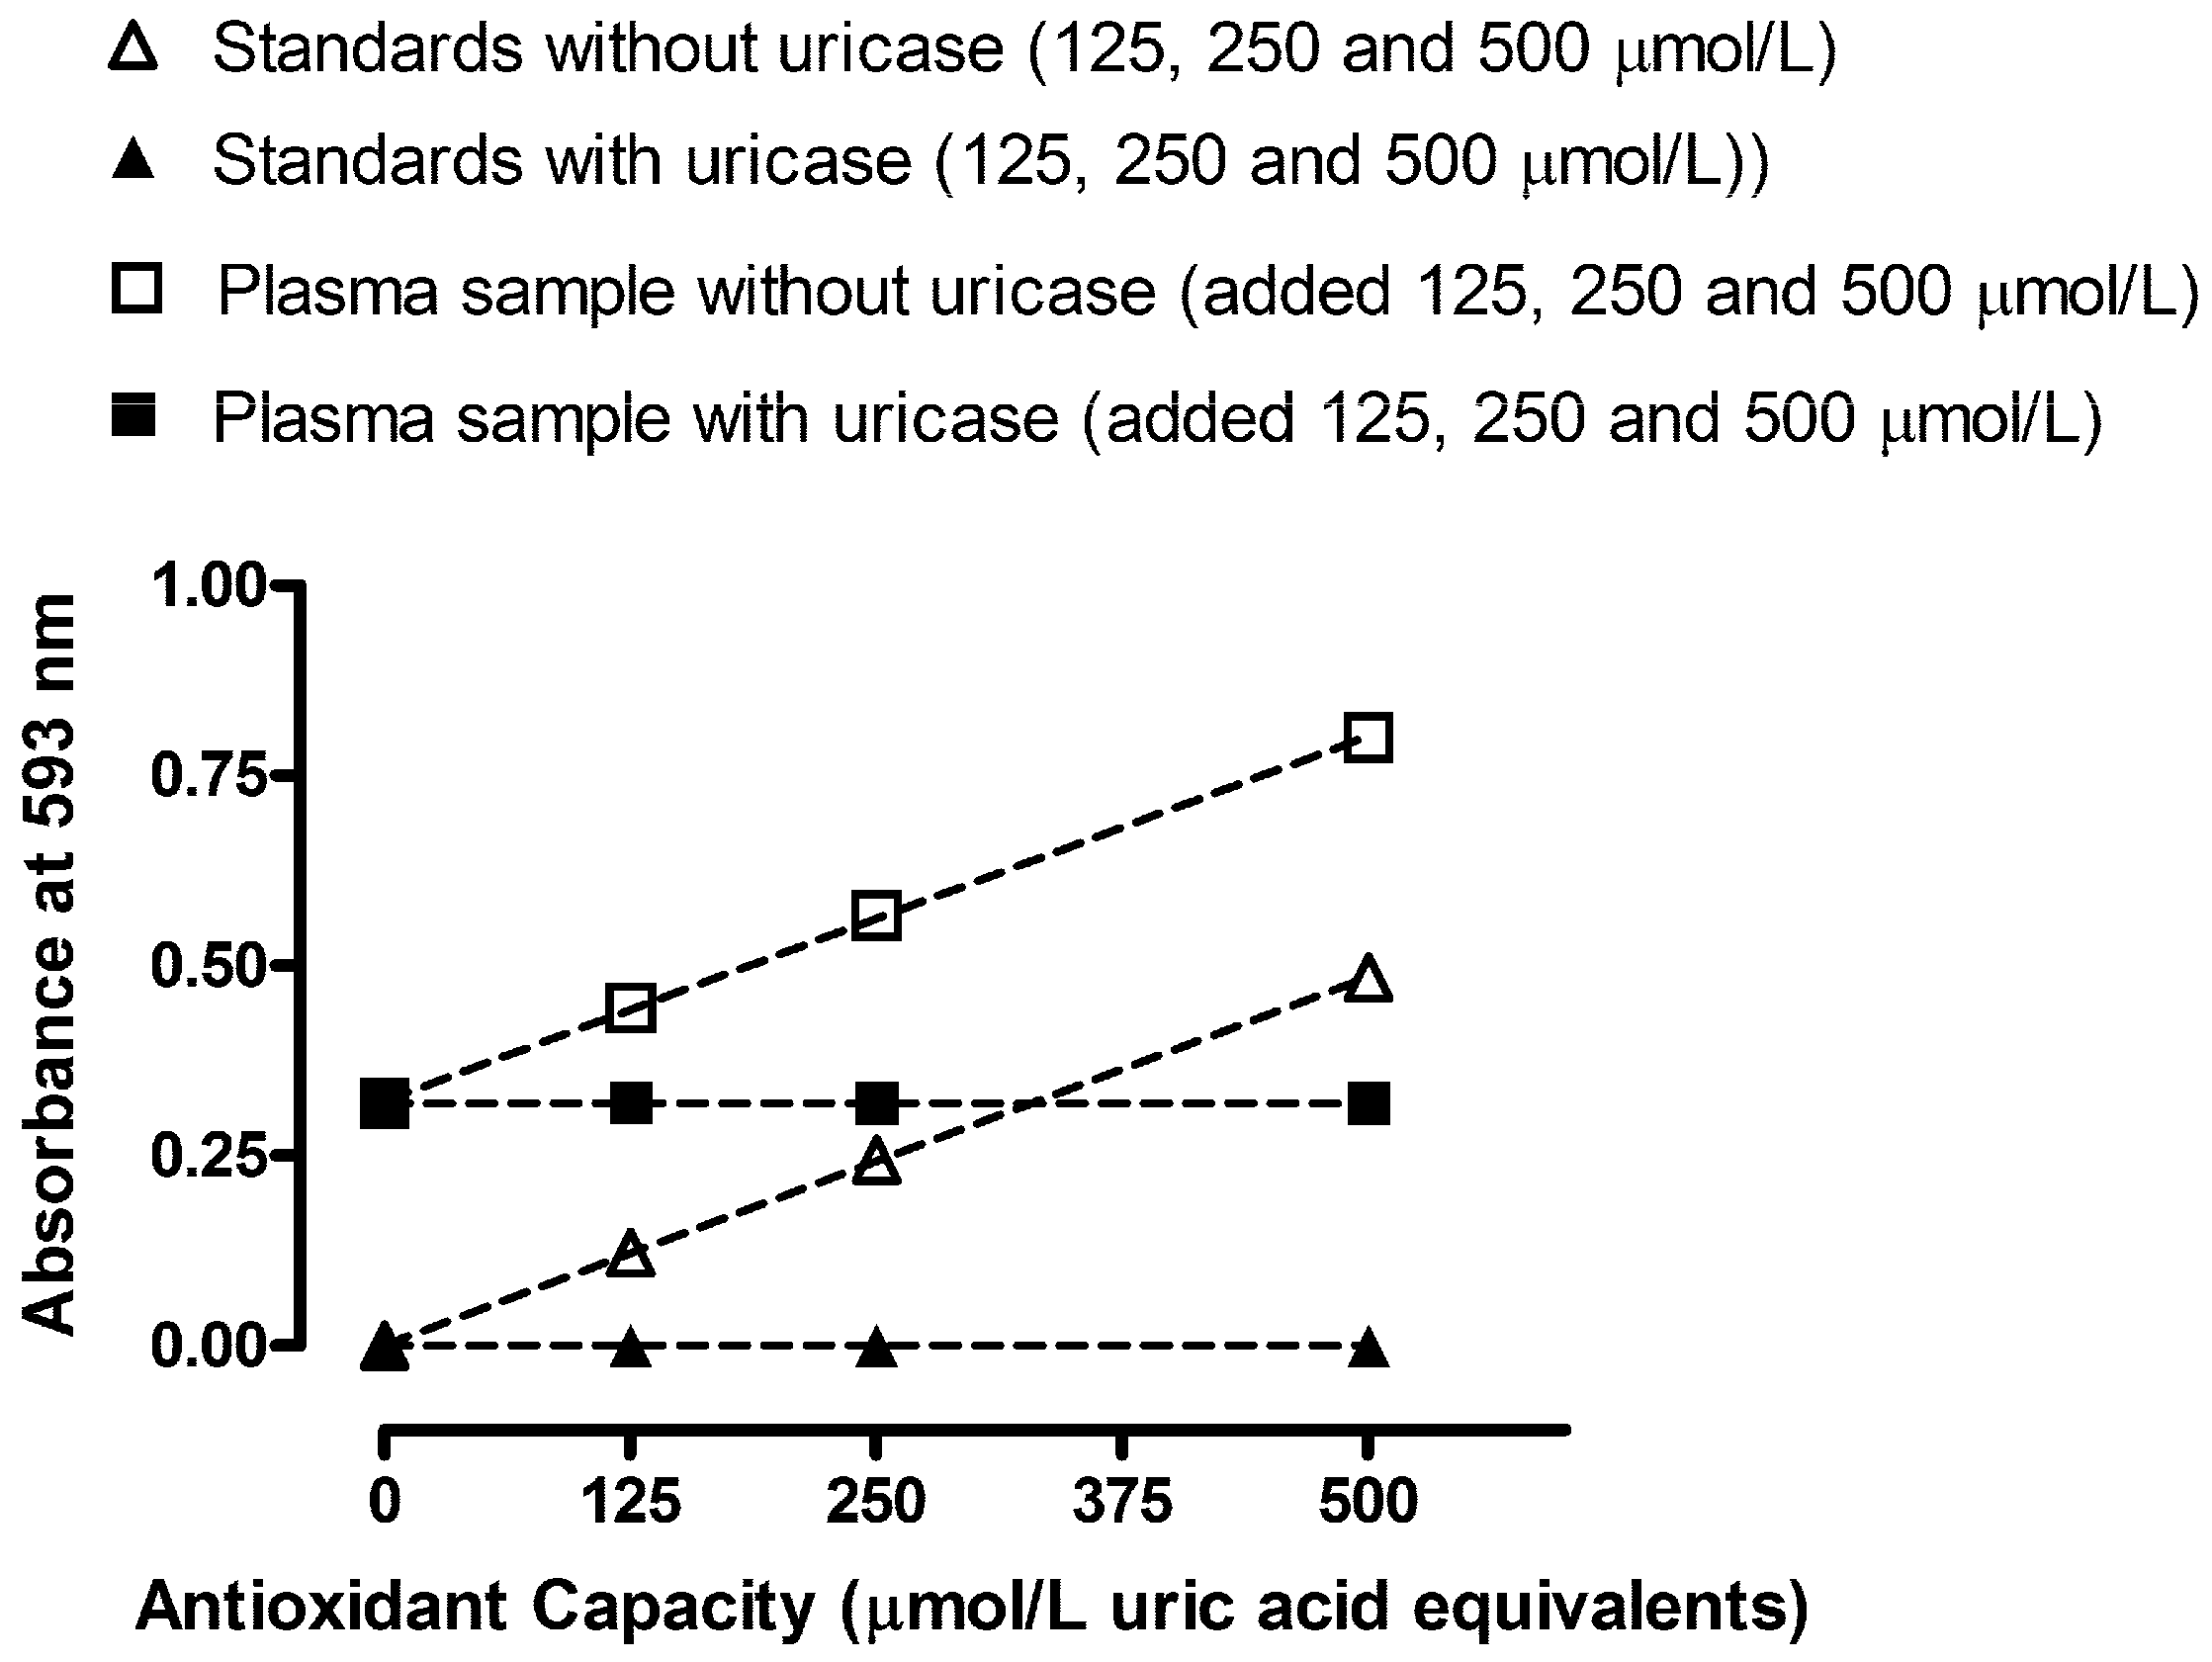
The response in the FRAP assay with uric acid standard solutions (in the absence of uricase) was linear up to 1,000 µmol/L, and the linear regression equation was y = 0.000977x − 0.00060, r
2 = 0.9999 (open triangles in
Figure 1). Treatment with uricase completely abolished this response (closed triangles in
Figure 1). Successful quantitative removal of uric acid using uricase in the proposed method was further confirmed by the reference method [
16]—In uric acid standard solutions and plasma samples, there were no detectable levels of uric acid after treatment with uricase, indicating that the proposed conditions (incubation time for 20 min at 25 °C, pH 7.4) were suitable for uricase to catalyze the degradation of uric acid to allantoin and H
2O
2 (
Table 1, 4th column).
In order to test whether uricase itself interferes with the FRAP assay, we determined TAC and TAC-U for freshly prepared standards of ascorbic acid. We found no difference between TAC and TAC-UA values for 250, 500 and 1000 µmol/L of ascorbic acid (255 ± 3, 512 ± 5 and 1016 ± 9 vs. 252 ± 3, 510 ± 6 and 1013 ± 8 µmol/L UA equivalents, respectively), indicating that uricase treatment (for TAC-UA samples) didn’t interfere with the FRAP assay.
Table 1.
Original data used for testing the proposed method for determination of plasma uric acid (UA)-calculated as the difference between TAC and TAC-UA. All data are expressed as means ± SD. All measurements for each sample were done in five replicates.
Table 1.
Original data used for testing the proposed method for determination of plasma uric acid (UA)-calculated as the difference between TAC and TAC-UA. All data are expressed as means ± SD. All measurements for each sample were done in five replicates.
| Sample number | UA (μmol/L) Proposed method | UA (μmol/L) Reference method [16] | UA (μmol/L) Proposed method Sample |
|---|
| Without uricase | With uricase | +100 μmol/L UA [recovery %] | +250 μmol/L UA [recovery %] | +500 μmol/L UA [recovery %] |
|---|
| 1 | 314 ± 3 | 321 ± 1 | 0 | 411 ± 5 [97%] | 556 ± 6 [97%] | 800 ± 9 [97%] |
| 2 | 352 ± 4 | 360 ± 1 | 0 | 448 ± 5 [97%] | 600 ± 7 [99%] | 840 ± 10 [98%] |
| 3 | 327 ± 3 | 326 ± 1 | 0 | 430 ± 4 [103%] | 580 ± 6 [101%] | 833 ± 8 [101%] |
| 4 | 365 ± 4 | 371 ± 1 | 0 | 461 ± 5 [96%] | 610 ± 7 [98%] | 870 ± 9 [101%] |
| 5 | 381 ± 4 | 385 ± 1 | 0 | 479 ± 5 [98%] | 623 ± 7 [97%] | 871 ± 9 [98%] |
As the enzymatic reaction of uric acid with uricase produces H
2O
2, we tested whether the newly formed H
2O
2 could interfere with the other antioxidants in the sample, particularly ascorbic acid (the main contributor to FRAP values of plasma, after uric acid [
12]). In order to test this we fortified the freshly prepared standards of ascorbic acid (250, 500 and 1,000 µmol/L) with 500 µmol/L of uric acid, and determined TAC and TAC-U for these samples. We found a significant difference between TAC and TAC-UA values (750 ± 6, 1,009 ± 9 and 1,511 ± 12
vs. 249 ± 3, 504 ± 5 and 1,002 ± 7 µmol/L UA equivalents, respectively). However, there was no significant difference between TAC-UA values for 250, 500 and 1,000 µmol/L of ascorbic acid that was exposed to H
2O
2 (produced after uricase reaction with uric acid) in comparison to the “unexposed” one (no uric acid present, therefore no H
2O
2 produced), 249 ± 3, 504 ± 5 and 1,002 ± 7 µmol/L
vs. 252 ± 3, 510 ± 6 and 1,013 ± 8 µmol/L UA equivalents, respectively, indicating that the newly formed H
2O
2 didn’t interfere with the other antioxidants (ascorbic acid) in the sample. The proposed method was then tested for the determination of plasma uric acid (UA)-calculated as the difference between TAC and TAC-UA. The original data used for testing the proposed method for determination of UA is presented in
Table 1.
When we used Bland-Altman analysis (plot of differences
vs. means of results by two methods) to compare the results of plasma uric acid obtained by proposed method with the automated uricase method [
16], we found acceptable bias ±95% limits of agreement (−5 ± 7 µmol/L) of uric acid values. The analytical recovery of uric acid (concentration ranging from 100 to 500 µmol/L) added to plasma samples was 98 ± 3%. The coefficient of variation of all determination by the proposed method was 3%.
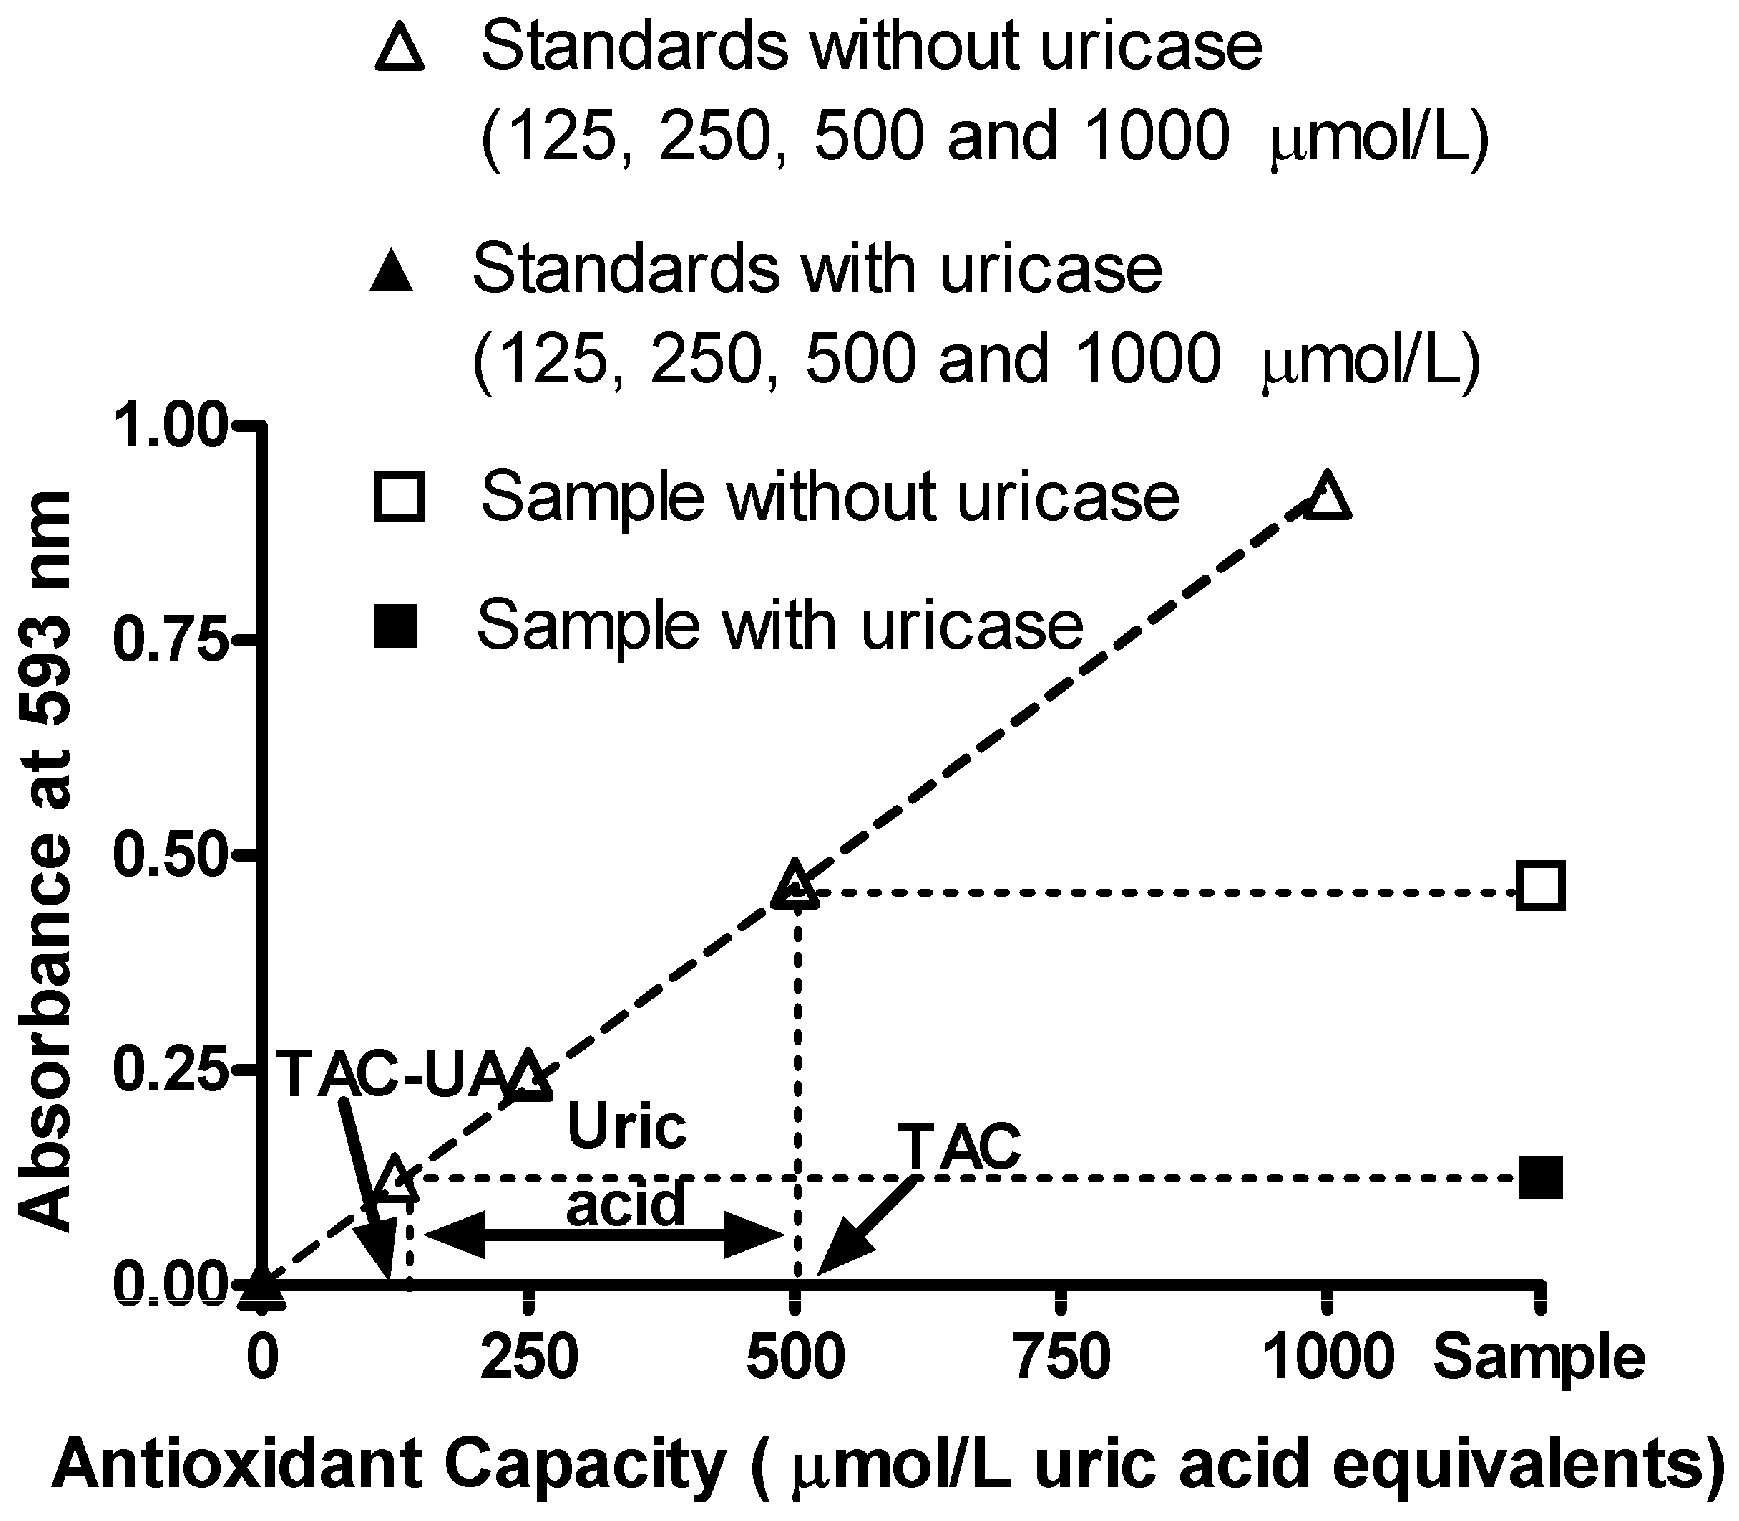
After this testing of the method, we determined TAC, TAC-UA and UA in our plasma samples, as illustrated in
Figure 1. The original data of TAC, TAC-UA and UA in our plasma samples is presented in
Table 2. Values of total antioxidant capacity (TAC), uric acid-independent antioxidant capacity (TAC-UA) and uric acid (UA) for our samples were 518 ± 25 and 175 ± 12 μmol/L uric acid equivalents and 345 ± 15 μmol/L respectively (means ± SEM). The values of plasma uric acid, obtained by the proposed method (
Table 2, 4th Column) are comparable with those obtained by the reference method [
16] (
Table 2, 5th Column), as indicated by statistical analysis (P = 0.88, Student
t-test). On the other hand, the values of TAC are significantly higher in comparison to TAC-UA (P < 0.0001, Student
t-test), indicating that uric acid is the main contributor to the total antioxidant capacity in human plasma, when measured by the FRAP method. Indeed, the calculated ratio of the uric acid in total antioxidant capacity (UA/TAC) was relatively constant at 67%, with small SD (3%). These findings are in accordance with previous studies that showed that uric acid is contributing to approximately 70% of plasma total antioxidant capacity, when measured by FRAP method [
9,
12].
Figure 1.
Absorbance readings vs. antioxidant capacity of uric acid standards (without and with uricase treatment), combined with absorbance of a sample without (total antioxidant capacity, TAC, 500 ± 6 μmol/L uric acid equivalents) and with uricase treatment (uric acid-independent antioxidant capacity, TAC-UA, 140 ± 2 μmol/L uric acid equivalents). Plasma uric acid is calculated as the difference between TAC and TAC-UA (360 ± 4 μmol/L). The ratio of the uric acid in total antioxidant capacity (UA/TAC) is 72%. All data are expressed as means ± SD. All measurements for each sample were done in triplicate.
Table 2.
Original data of TAC, TAC-UA and UA in our plasma samples. All data are expressed as means ± SD. All measurements for each sample were done in triplicate.
Table 2.
Original data of TAC, TAC-UA and UA in our plasma samples. All data are expressed as means ± SD. All measurements for each sample were done in triplicate.
| Sample number | TAC (μmol/L UA equivalents) | TAC-UA (μmol/L UA equivalents) | UA (μmol/L) |
|---|
| Proposed method | Reference method [16] |
|---|
| 1 | 488 ± 4 | 174 ± 2 | 314 ± 3 | 321 ± 1 |
| 2 | 535 ± 5 | 183 ± 2 | 352 ± 4 | 360 ± 1 |
| 3 | 515 ± 5 | 188 ± 2 | 327 ± 3 | 326 ± 1 |
| 4 | 544 ± 6 | 179 ± 3 | 365 ± 4 | 371 ± 1 |
| 5 | 551 ± 5 | 170 ± 2 | 381 ± 4 | 385 ± 1 |
| 6 | 399 ± 4 | 144 ± 2 | 255 ± 3 | 260 ± 1 |
| 7 | 500 ± 6 | 140 ± 2 | 360 ± 4 | 361 ± 1 |
| 8 | 614 ± 7 | 223 ± 3 | 391 ± 4 | 395 ± 1 |
| 9 | 397 ± 4 | 109 ± 2 | 288 ± 3 | 292 ± 1 |
| 10 | 644 ± 7 | 229 ± 3 | 415 ± 5 | 411 ± 1 |
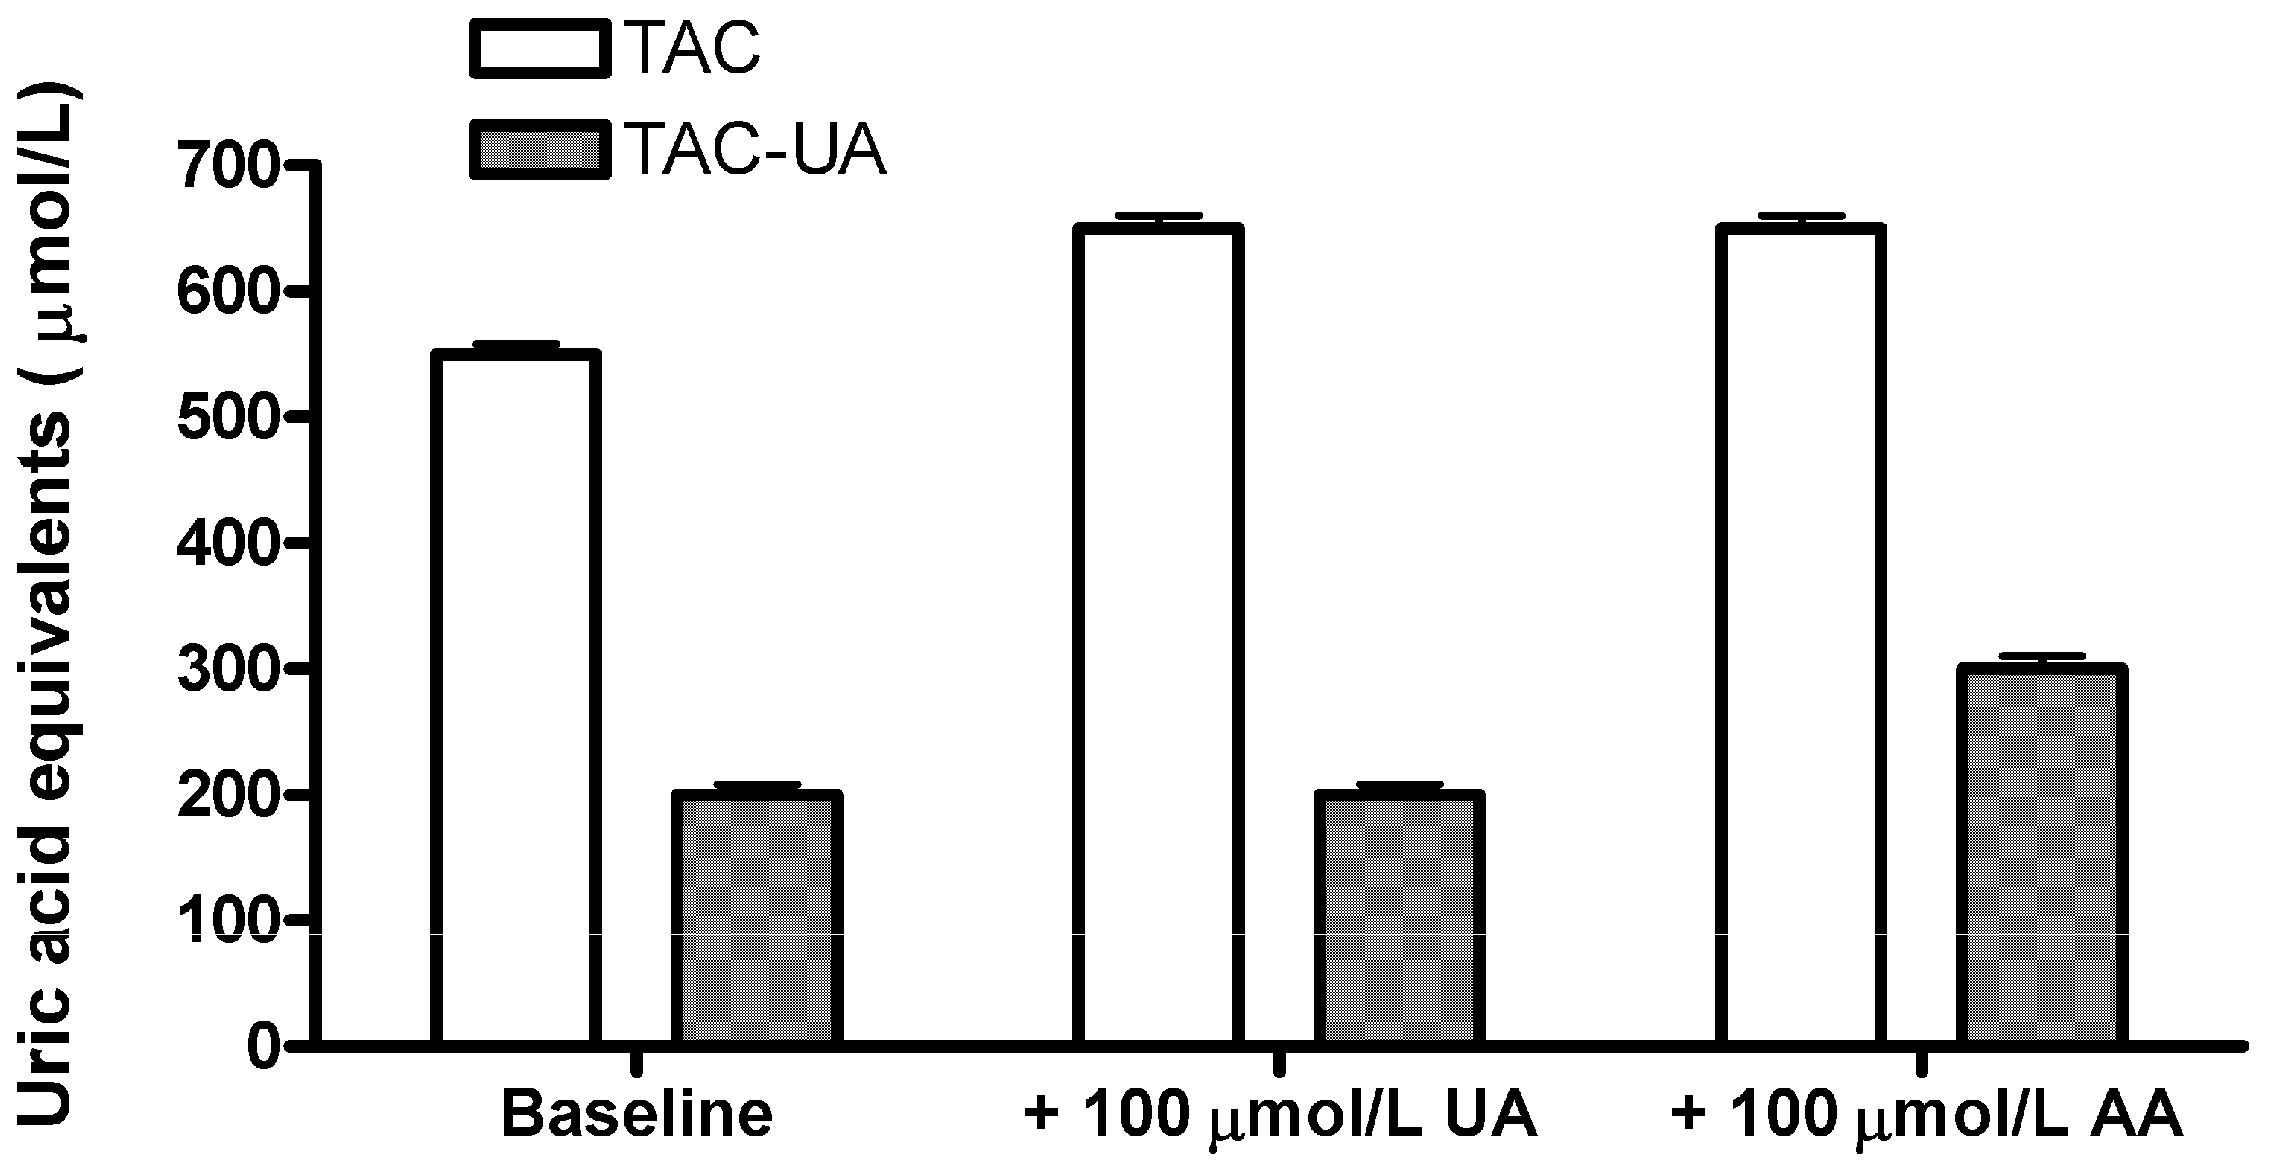
In order to confirm that the proposed method specifically eliminates the relative contribution of uric acid in total antioxidant capacity of plasma samples, we have added 100 μmol/L of uric acid (UA) or 100 μmol/L ascorbic acid (AA) to a plasma sample (
Figure 2). The ascorbic acid was selected as it is a strong antioxidant which shares a 1:1 stoichiometric equivalence with the uric acid in the FRAP assay [
12]. Addition of uric acid resulted in an elevation of TAC (from 550 ± 6 to 648 ± 8 µmol/L), but the TAC-UA remained virtually unchanged (from 201 ± 3 to 205 ± 4 µmol/L), while addition of ascorbic acid resulted in an elevation of both TAC (from 550 ± 6 to 645 ± 9 µmol/L), and TAC-UA (from 201 ± 3 to 295 ± 6 µmol/L). This result confirmed that the proposed method is selective for depletion of relative contribution of uric acid in total antioxidant capacity, as there was not any significant increase of TAC-UA after addition of UA. Moreover, as the measured increase of TAC-UA after addition of AA (94 ± 6 µmol/L uric acid equivalents) is in agreement with the given amount of AA (100 µmol/L) it is likely that relative contribution of other antioxidants to total antioxidant capacity of the sample will not be underestimated by the proposed method, as they are not affected by the uricase reaction. As ascorbic acid is very sensitive to oxidation, we used only freshly prepared standards, and fresh samples (heparinized plasma), in accordance to a previous report [
17].
Figure 2.
Determination of total and uric acid-independent antioxidant capacity (TAC and TAC-UA, respectively) for a regular sample (baseline), the sample with extra 100 μmol/L of uric acid (UA) and the sample with extra 100 μmol/L of ascorbic acid (AA). All data are expressed as means ± SD. All measurements for each sample were done in triplicate.
In order to observe any interfering effects of plasma constituents for determination of TAC and TAC-UA, we performed standard addition experiments of uric acid (before and after the uricase reaction) on human plasma, as shown in
Figure 3. The obtained response-concentration lines are virtually parallel in the standard addition tests (slope values were 0.00097
vs. 0.00096 for standards and plasma samples without uricase, respectively). Therefore, we can conclude that plasma constituents did not cause any detectable chemical deviation from Beer’s law.
We performed additional testing in order to establish whether hyperglycemia or hyperlipemia could influence the determination of TAC and TAC-UA. We mixed a fresh plasma sample with increased triglyceride and TAC levels, proportionally with a sample with low triglyceride and TAC levels. Triglyceride concentrations up to 14 mmol/L had no effect on recovery. In a second experiment we mixed a fresh plasma sample with increased glucose and TAC levels, proportionally with a sample with low glucose and TAC levels. Glucose concentrations up to 18 mmol/L had no effect on recovery. Finally, we tested the same blood sample in four different vacutainers in order to establish whether any common anticoagulant (EDTA, heparin, citrate and fluoride oxalate) could influence the determination of TAC and TAC-UA. We found a significant reduction in both TAC (>5%) and TAC-UA (>30%) in the EDTA plasma. The reduction of TCA and TAC-UA values in EDTA plasma could be due to the increased loss of ascorbic acid in the EDTA plasma [
17]. However, there is another possible explanation. The FRAP reagent—as well as other transition metal ion-based reagents—is expected to be strongly affected by EDTA, preferentially chelating the higher oxidation state of iron (
i.e., Fe(III)) compared to the lower oxidation state [
18]. Thus, Fe(III)/Fe(II) reduction potential would decrease in the presence of EDTA, making Fe(III)-TPTZ a weaker oxidant, incapable of oxidizing all antioxidant constituents of serum. Consequently, the measured TAC values would be lower in the presence of EDTA. Therefore, we can conclude that EDTA is not an appropriate anticoagulant for determination of TAC and TAC-UA.
Figure 3.
Absorbance readings vs. antioxidant capacity of uric acid standards (without and with uricase treatment) combined with standard addition experiment performed on human plasma (without and with uricase treatment). All data are expressed as means ± SD. All measurements for each sample were done in triplicates.
The approach of separating the role of uric acid (or ascorbic acid) is not new, and it has been proposed in previous studies. Benzie
et al. proposed the specific elimination of ascorbic acid impact in the FRAP assay (so-called FRASC assay), which is very similar to the proposed method [
15,
19]. Different studies have emphasized the importance, or suggested an actual method of determination, of total antioxidant capacity without the effect of uric acid in different samples [
7,
9,
13,
15,
20,
21]. This report follows the suggestions and ideas derived from the abovementioned studies. However, we think that the proposed method represents a major improvement of the original FRAP assay, as the FRAP assay is strongly influenced by uric acid (60%–70%). Benzie and Strain, the creators of the original FRAP assay [
12] and the modified “FRASC” assay [
15], have indirectly acknowledged our opinion: “The non-UA FRAP is a novel and potentially useful index of antioxidant defense. While uric acid appears to contribute around 60% of the total reducing (“antioxidant”) power of plasma, its role as a physiological antioxidant is doubtful. High total “antioxidant” status associated with elevated plasma uric acid concentrations may be misleading, masking a relative or absolute deficiency of other antioxidants” [
15]. Moreover, Benzie and Strain have highlighted that: “…Subtracting this (antioxidant power of the sample due to uric acid) from the FRAP value of the sample gives the nonuric acid FRAP value, which may offer a more sensitive index of antioxidant status in uric acid-rich fluid such as plasma” [
19]. The possibility of using the proposed method for determination of TAC and TAC-UA in other biological samples that are often used like tears [
22] or urine [
21], represents a new challenge for the future.
Finally, the measurement of total antioxidant capacity is rather a “concept” than an actual analytical measurement of a specific analyte. An increased antioxidant capacity in plasma may not necessarily be a desirable condition if it reflects a response to increased oxidative stress. Similarly, a decrease in plasma or serum antioxidant capacity may not necessarily be an undesirable condition if the measurement reflects decreased production of reactive species. Therefore, no single measurement of antioxidant status is going to be sufficient. Antioxidant capacity could be useful as a simple initial test for diagnosis of oxidative stress and monitoring therapy for first orientation, to be followed by more specific analyses of individual antioxidants, using more expensive and selective equipment (like HPLC or GC-MS). Every antioxidant capacity assay has its own limitations, for instance the FRAP assay works at a non-physiological pH (3.6). Some other popular assays for total antioxidant capacity work at physiological pH (7–7.4), like CUPRAC [
23] and different versions of TEAC assay [
24,
25]. In a clinical study it is recommended to use a “battery” of measurements, including different assays for total antioxidant capacity and different assays for oxidative stress markers (e.g., end products of lipid peroxidation) [
3,
4,
5].


