Abstract
The unchecked and unplanned expansion of urban areas has led to the conversion of millions of green areas to gray areas. The recent urban growth patterns of Pakistan’s metropolitan twin cities, Islamabad and Rawalpindi, is a matter of concern for the surrounding green areas. The present study aimed to categorize and quantify the land-use and land-cover change (LULCC) patterns and the corresponding impacts on the forest carbon dynamics around Islamabad and Rawalpindi. Multispectral satellite images for the year 1990 (Landsat 5 TM) and 2020 (Landsat 8 OLI) were used to determine, quantify, and compare the LULCC inside and around the twin metropolitan cities. Field inventory surveys in the reserved forests of Rawalpindi and Islamabad were also conducted to determine the amount of stored carbon in these forests. Our results showed an accelerated annual urban expansion (i.e., an increase in the built-up area) of 16.49% and 26.72% in Rawalpindi and Islamabad, respectively, during the study period. Similarly, the amount of barren land and agricultural land was reduced at an annual rate of 2.08% and 2.18%, respectively, in Rawalpindi and 0.25% and 1.04% in Islamabad. A reduction in the area of barren mountains also occurred at an annual of 2.26% in Islamabad, while it increased by 4.16% in Rawalpindi. The amount of carbon stored in the reserved forests of Islamabad stood at 139.17 ± 12.15 Mg C/ha while that of Rawalpindi was 110.4 ± 13.79 Mg C/ha. In addition, total stored forest carbon was found to have decreased from 544.70 Gg C to 218.05 Gg C in Rawalpindi, while in Islamabad it increased from 2779.64 Gg C to 3548.16 Gg C. Investment in ecological urban planning, sustainable cities, and appropriate land-use planning is recommended to curb the degradation and conversion of the surrounding green areas of Rawalpindi and Islamabad.
1. Introduction
In recent decades, the number of people moving to urban cities from rural areas has increased exponentially. The rate of urban migration and settlement varies across different parts of the world. In Asia, the urbanization rate is 6.6% for Nepal, 5.3% for Bangladesh, 4.4% for Pakistan, 2.9% for India, and 2.2% for Sri Lanka. The rates for these developing countries are higher compared to other Asian countries and to the rest of the world [1,2,3]. This upsurge in the global urban population results from economic opportunities, infrastructure development, and political and social stability [4]. Although these growth patterns exhibit regional and continental variations, factors that cause or accelerate urban sprawl remain the same [5]. These environmental, socioeconomic, cultural, and religious factors play an important role in urban development across the globe [6]. Urban development preferences vary by country. For example, across the United States of America, local populations prefer single villa residences, unlike the Japanese, who prefer high-rise buildings with accessible public transportation [7]. The exponential growth of urbanization has caused a huge amount of land-use and land-cover change (LULCC), which is not only damaging for urban wildlife, but for humans and the entire urban ecosystem, too.
According to Seto et al. [8], Mukete et al. [9], and Khan et al. [10], the land-use and land-cover change (LULCC) caused by urban sprawl disrupts ecohydrology, external geodynamics, soil texture, local climates, and geomorphology, which in turn influences local ecological processes, including the local climate and the carbon stored in trees. For instance, Angel et al. [11] observed that an increase of 10% in the urban area led to an estimated 11% increase in CO2 emissions. Rapid unplanned urbanization is a big problem in terms of urban area management in developing countries [12,13]. The forest area in the East Wollega zone, Ethopia, has decreased by 4.18% per year from 1991 to 2019 due to rapid urbanization [14]. In south Asia, Pakistan has become the country with the fastest growing urban population, with an increasing urbanization rate of 17%, 37%, and 39% in 1951, 2010, and 2017, respectively [15]. More than 50% of the population of Pakistan is expected to settle in urban cities in next 10 to 15 years [16]. This would intensify the conversion rate of green belts to barren land or built-up areas. The green belts inside urban areas have important environmental and conservation value. These green areas are the natural ecosystems which ensure the survival of species and biodiversity richness, and which facilitate carbon sequestration [9,17,18]. In addition, green areas in the urbanized cities serve as habitats for various mammal, arthropod, and avifauna corridors, which connect fragmented landscapes [19,20].
In Pakistan, green areas are reducing at an annual rate of 0.75%, which will ultimately affect the ability of the areas to act as carbon sinks [21,22]. Landsat imagery provides an effective way to monitor the heterogeneity of green areas, land-use change, and the carbon dynamics associated with the LULCC of an area [23]. For instance, modern GIS and remote sensing technologies with MS (multispectral) and SAR (synthetic aperture radar) data adequately provide precise results of temporal LULCC as well as the carbon dynamics across terrestrial and marine landscapes [23,24]. Moreover, through satellite imagery, the effects of many socioeconomic events, including suburbanization, urban redevelopment, and urban sprawl, can be quantified. Remote sensing and GIS technologies have been used to ascertain the necessity for including digital change detection in understanding LULCC around the southern part of Yunnan Province, China [25,26], and in the Santchou Wildlife Reserve of west Cameroon [27]. Willkomm et al. [28] used remote sensing and high-resolution rapid eye satellite imagery to distinguish major landcover classes and different land uses in Germany.
Pakistan, as a member country of the Kyoto Protocol and the United Nations Framework Convention on Climate Change (UNFCCC), is bound to check and limit its carbon emissions within an acceptable range [29]. During the past three decades, the metropolitan twin cities of Islamabad and Rawalpindi have experienced extensive urbanization as people from rural areas have migrated there for education, employment, business, and other needs and reasons [29]. Islamabad is relatively well managed in terms of forest conservation due to an active management plan implemented by the Capital Development Authority (CDA) [30,31], while Rawalpindi, on the other hand, is a city with a semi-management system [32]. This study used spatiotemporal data to categorize and quantify LULCC and its impacts on biomass and carbon sink in areas around the metropolitan twin cities (Islamabad and Rawalpindi) in Pakistan.
2. Materials and Methods
2.1. Study Area
The present study was carried out in Rawalpindi and Islamabad, located at 33.662883° Lat, 73.086373° Lon (Figure 1). With an estimated population of about 1.4 million inhabitants [12,33], Islamabad is the capital city of Pakistan and spreads across an area of 906.84 km2 [34]. The minimum and maximum annual temperatures range between −3 °C in winter to 45 °C in summer, while mean annual rainfall ranges between 200 mm in winter and 1846 mm in summer [35]. On the other hand, with an estimated population of about 2 million inhabitants, Rawalpindi covers an area of 259 km2 [36]. The study area is rich in flora and fauna. The dominant forest species of the area include Pinus wallichiana, Pinus roxburghii, Quercus incana, Acacia modesta, Acacia nilotica, Olea ferruginea, and Ziziphus spp. These species act as important carbon sinks and help conserve soil. The forests around the study area are the habitat of important wildlife species, including Panthera pardus, Macaca mulatta, Muntiacus muntjac, Canis aureus, Catreus wallichii, and Alectoris chukar [22]. The twin cities are also of great economic importance, given that Islamabad and Rawalpindi contributed USD 2.86 billion and USD 3.96 billion, respectively, to the gross domestic product (GDP) of Pakistan, out of the total GDP of USD 263.7 billion [16].
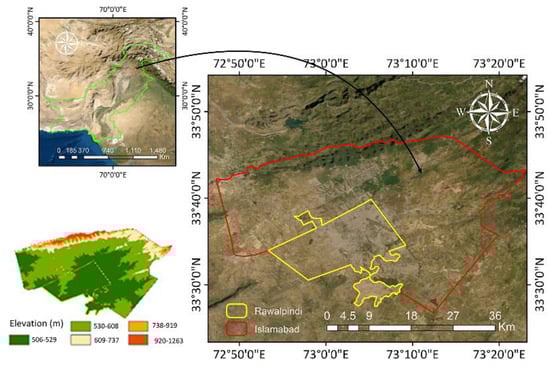
Figure 1.
Location of the Study Area.
2.2. Satellite Data and Pre-Processing
Landsat 8 OLI (operational land imager) for 2020 and Landsat 5 TM (thematic mapper) (WRS Path 150, Row 37) were downloaded from the US Geological Survey (USGS) website. Cloud-free images for the month of February were used, because this month has less atmospheric haze and fewer ground reflectance changes [22]. To geometrically register the image with an ariel photograph, all images were first projected to the Universal Transverse Mercator (UTM) projection system (zone 49 N), and a 30 m resolution of the pixel size was set. The images were then corrected radiometrically to convert the digital number (DN) to a numerical value by using ENVI 5.3 in Equations (1) and (2), as follows:
where represents radiance, are the DNs, is the quantized calibrated minimum pixel value, is the spectral radiance at , is the maximum calibrated quantized pixel value, and is the spectral radiance scale at . In Equation (2), represents top of atmosphere (TOA) reflectance, represents the Earth–Sun distance, while is the solar irradiance and is the elevation of the Sun in degrees. The TOA reflectance to surface reflectance conversion was performed using the atmospheric correction method before performing LULCC detection. By using a fast line-of-sight atmospheric analysis of hypercubes (FLAASH), the corrected image provides better results for the estimation of LULCC and C dynamics [37]. Furthermore, it also reduces the effects of water vapors, aerosols, humidity, and haze, according to [38,39]. The study area was clipped using a vector shapefile prepared from a topographic sheet (1:20,000) obtained from the Survey of Pakistan (SOP).
2.3. Extraction of LULCC Maps and Analysis
For LULCC classification, the images were enhanced with feature enhancement in order to better perceive land-use separability. In addition, the maximum likelihood method for image classification was used in ENVI 5.3, Equation (3):
where gi = the land use class, x = n-dimension data, n = the no. of bands, p(wi) = the probability that class wi appeared in the wi class, = the co-variance matrix data for the wi class, = the inverse matrix, and mi = the vector.
To analyze land-use cover, the study area was divided into six classes: forest land (FL), agricultural land (AL), barren land (BL), built-up area (BA), barren mountains (BM), and water body (WB). A description of the classification categories is given in Table 1. The image accuracy was accessed using 100 random training samples for each class. The training samples were selected from the Landsat image gallery because most of the LULCC types maintained stable characteristics. Based on this Landsat imagery, it was necessary to assess the accuracy of the classified image [40]. The combination of Band 543 in Landsat 5 TM and Band 643 in Landsat 8 provided the visually distinguished features of all the classes [41].

Table 1.
LULCC classification of the study area.
2.4. Accuracy Assessment
The confusion matrix in Envi 5.3 was used to measure the accuracy of the classification, in combination with Equation (4):
where K is the kappa coefficient, the class number is denoted by , where is the total number of classified values compared to truth values, is the number of values belonging to the truth class that have also been classified as class (i.e., values found along the diagonal of the confusion matrix), is the total number of predicted values belonging to class , and is the total number of truth values belonging to class .
2.5. Carbon Dynamics
In order to calculate stored carbon, random sampling was performed across 300 circular sample plots of about 0.1 hectares (ha) in Rawalpindi and Islamabad, as described by [42]. In Rawalpindi, the samples were taken from the Loi Bher (RF), Dhamial (RF), Adiala (RF), and Takht Pari (RF) forest reserves. Meanwhile, in Islamabad, the sampling was conducted around the Margallah Hills National Park (MHNP), Tumair (RF), and Banni Gala (RF) forest reserves. All trees greater than 2.5 cm diameter at breast height (DBH) were measured in the plots. The heights of 20 trees per species were measured using an Abney level, which was sufficient enough to construct the plot-specific diameter–height function. The volume (m3/ha) of all the trees were calculated according to [43]. The stem biomass (SBM), the biomass expansion factor (BEF), and the root–shoor ratio R, as described by [43], were used to calculate the tree biomass (TBM), as per Equation (5):
Furthermore, from the center of the 0.1 ha sample plot, the understory biomass (USVBM), consisting of mainly herbs and shrubs, was calculated by taking a sample of all the herbs and shrubs found within the 9 m radius sample plots, which were harvested and kept in labelled bags for further analysis. The wet weight was measured at harvesting time, while the dry weight was measured after drying them in an oven at a temperature of 72 °C for 48 h. The biomass was calculated as dry weight as described by [44]. Similarly, litter and dead wood were collected for the calculation of the dead wood and litter biomass (DWLTBM), while the ecosystem biomass (EBM) was calculated using Equation (6):
Soil samples at the depth of 0–15 cm and 15–30 cm were taken with the help of a soil auger. The volume of all soil samples was measured using a core sample of 0.0001256 m3, with a diameter = 4 cm and length = 10 cm. All the soil samples were weighed to measure their bulk density and organic content. Furthermore, the tree biomass was converted to carbon by using the factor 0.5, according to [45]. For carbon change, the product of carbon ha−1 and total forest cover (ha) gives the total carbon stock of the area at specific temporal periods [46,47,48]. The percentage change in carbon stock at different time periods was calculated as per Equation (7):
where, is the change in carbon content, is the latest period, and is the base year period.
2.6. Normalized Difference Vegetation Index (NDVI)
The NDVI is an important tool that helps to determine the spatiotemporal change in forest cover [49]. NDVI is the most reliable means of determining the intensity of forest degradation and vegetation loss [50]. The NDVI was calculated for the two periods of 1990 and 2020 for Islamabad and Rawalpindi using Equation (8), in ENVI 5.3:
where NIR is the near-infrared band and RED is the red band.
3. Results
3.1. Urban Growth
We used GIS and remote sensing data and techniques to categorize and quantify the LULCC across the Rawalpindi and Islamabad areas for a thirty year period (1990 to 2020). Our results showed that the twin cities have experienced an enormous expansion of urban growth during the past three decades. For instance, in 1990, the built-up areas in Islamabad and Rawalpindi were 3018.42 ha and 2561.02 ha, respectively, and have expanded by 26.72% and 16.49 a year, respectively, for the two cities during the study period (Table 2 and Table 3). In 1990, the built-up area in Islamabad was 3.33% (3018.42 ha) of its total area, which expanded to 30.01% by 2020 (27,218.06 ha) (Table 3). Similarly, for Rawalpindi, it was 9.88% in 1990, and has increased to 58.08% by 2020 (Figure 2 and Figure 3). For the same study period, barren land has decreased in Rawalpindi at a rate of 2.08% annually as compared to 0.25% for Islamabad (Table 3).
Table 2.
Temporal statistics of LULCC.
Table 3.
Percentage Change.
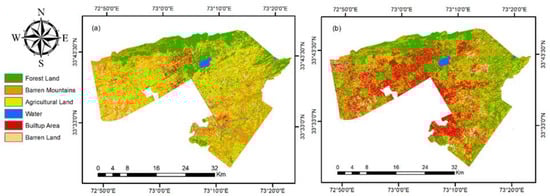
Figure 2.
LULCC of Islamabad: (a) 1990; (b) 2020.
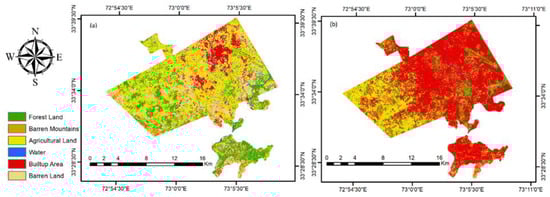
Figure 3.
LULCC of Rawalpindi: (a) 1990; (b) 2020.
Decreasing trends were observed in agricultural land at a rate of 2.18% and 1.04% per annum for Rawalpindi and Islamabad, respectively. Furthermore, the share of barren mountain area decreased from 31.88% to 10.16% in Islamabad, but increased from 4.98% to 11.22% in Rawalpindi (Figure 3). Interestingly, an increase of 0.92% per annum in the forest area has been identified for the Islamabad area during the study period. Forest land in Rawalpindi has been reduced from 4930.55 ha in 1990 to 1973.82 ha in 2020 (Table 2).
The accuracy of these figures has been assessed, and the Kappa coefficient for Islamabad was found to be 0.92 and 0.87 for the years 2020 and 1990, respectively. The Kappa coefficient for Rawalpindi was 0.90 and 0.89 for the years 2020 and 1990, respectively.
3.2. Forest Carbon Dynamics
In Islamabad, stored carbon in the forest’s upper story, lower story, and in dead and dry matter was found to be 78.86 ± 9.94 Mg/ha, 2.1 ± 1.1 Mg/ha, and 1.9 ± 0.7 Mg/ha, respectively. The stored carbon in the ecosystem was 139.17 ± 10.48 Mg/ha for Islamabad. For Rawalpindi, the carbon stored in the upper story, lower story, and in dead and dry wood was 65.16 ± 10.39 Mg/ha, 1.5 ± 1.12 Mg/ha, and 1.7 ± 0.72 Mg/ha, respectively. The stored carbon in the ecosystem for the Rawalpindi forest area was 110.47 ± 11.07 Mg/ha (Figure 4). In 1990, the total carbon stored in Islamabad was 2779.64 Gg, which has increased to 354,816 Gg in 2020, whereas in Rawalpindi, a decreasing trend was observed in the stored carbon, which has dropped to 218.5 Gg C in 2020 from 544.70 Gg C in 1990.
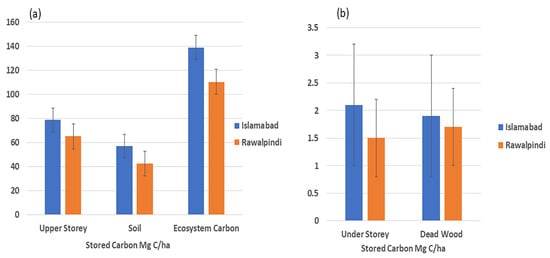
Figure 4.
Stored carbon in different forest segments (a) Upper storey, Soil and Ecosystem, (b) under storey and dead wood.
The mean value of the NDVI for Islamabad was 0.07 in 1990, and this has increased to 0.09 in 2020 (Figure 5). The mean NDVI value calculated for Rawalpindi was 0.03 in 1990, which has decreased to 0.01 in 2020 (Figure 6).
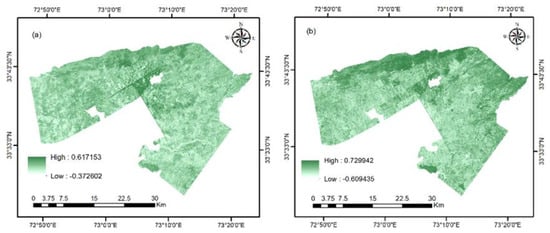
Figure 5.
NDVI of Islamabad: (a) Year-1990; (b) Year-2020.
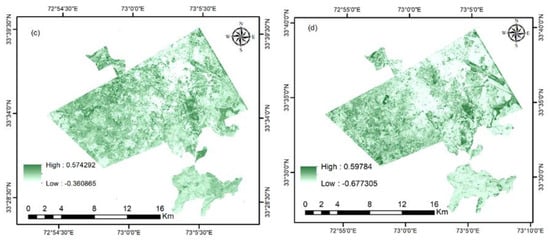
Figure 6.
NDVI of Rawalpindi: (c) Year-1990; (d) Year-2020.
4. Discussion
RS and GIS tools are the most effective methods around today to determine the spatiotemporal LULCC both in urban and rural areas [51]. LULCC has become an important factor in determining the socioeconomic and environmental development of an area [52]. Forests act as a carbon sink. Therefore, a change in forest cover directly affects the climatic and environmental conditions of a region [53]. Urban forests and green areas are more prone to LULCC due to different developmental activities, and so therefore categorizing and quantifying LULCC in urban areas is very important [54]. Our results indicate that between 1990 and 2020, the amount of settlement and built-up area has increased considerably. This increase has exerted pressure on other land-use classes, such as BL, AL, BM, etc., in the study area. In 1990, the built-up area around Islamabad was 3.3%, which has increased to 30.01% in 2020. In Rawalpindi, the built-up area was 9.8% of the total area in 1990, which has expanded to about 58.80% in 2020. An annual urban expansion rate of 0.88% for Islamabad and 1.63% for Rawalpindi has therefore been identified during the study period. This expansion could be attributed to an increase in real estate agents and housing companies operating within the study area. The areas have experienced a huge human influx, as people from the rural areas migrated to the capital for different purposes, including education, jobs, and other business reasons. According to [12], the accelerated urban expansion can be attributed to governmental policies which favor urban development and real estate businesses. Similarly, these governmental policies concomitantly encourage and support industrial growth and infrastructure development within and around the twin cities [55]. Industrial growth and infrastructure development are found to be important factors in the urbanization of the twin cities [12]. Population size directly affects socioeconomic development [56,57], as it determines the available of resources in relation to the social, economic, and environmental stability of any locality [58]. During the study period, an increase of 36,870.23 ha in the built-up area has been recorded in the twin cities (Table 2). The rapid increase in the built-up area could be attributed to the increased human population in the country, now at 207.8 million people [59], with the population size of the twin cities increasing at a rapid rate. During the study period, in Islamabad, the population increased from 0.342 million to 1.129 million, while in Rawalpindi, the population has increased from 1.087 million to 2.236 million during the study period (Figure 7).
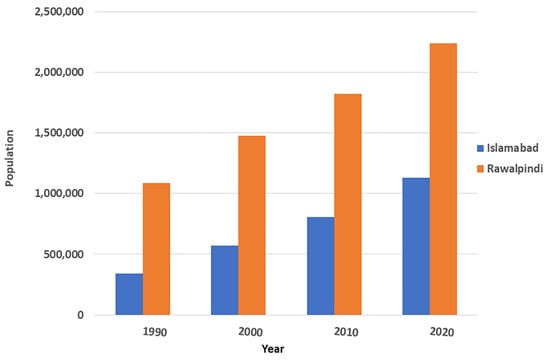
Figure 7.
Temporal population dynamics in the study area.
The master plan of Islamabad was made by Constantinos A. Doxiadis and Doxiadis Associates in 1950, based on the hierarchical community system, with an urban roads spacing network and sustainable conservation [60]. On the other hand, Rawalpindi has a semi-planned urbanization pattern [34,61,62]. The management of the Islamabad is under the supervision of the Capital Development Authority (CDA), which has all the protocols and guidelines for the management and expansion of the city [63], while Rawalpindi is managed by the Rawalpindi Development Authority (RDA) [64]. In addition, the weak enforcement of the law in Rawalpindi has stimulated the encroachment of government land and the development of illegal housing societies, causing haphazard urbanization [65]. In 2017, the Capital Development Authority of Islamabad (CDA) demolished 50 commercial buildings, including marriage halls and shops on illegal land worth PKR 9 billion (USD 51,660,765), as well as 1670 ha of land costing PKR 300 billion (USD 1,722,025,500), which was retrieved from the land grabbers [66]. No such action has been taken by the RDA. However, the main focus of the CDA was to maintain the standard infrastructure and beauty of the city, safeguarding areas such as Rawal Lake, the Rose and Jasmine Garden, Saidpur Village, etc. [67]. The housing sectors in Islamabad, i.e., E, F, G, H, and I, are subdivided into smaller division of 2 km2, i.e., G6, G7, G8, G9, etc. All these subdivisions have one community center at the midpoint, with highways at the border as well as link roads [68]. The drinking water, solid waste management, and sanitation facilities are controlled by the management who are stationed at the community center.
From 1990 to 2020, barren and agricultural land decreased at the rate of 0.25% and 1.24% annually in Islamabad, respectively, and 2.08% and 2.18% annually in Rawalpindi. This may be related to the fact that small-scale agriculture had been the main stay and source of livelihood for local communities [12]. People also used to keep land adjacent to their homesteads for animal rearing and gardening. In later years, governmental policies began to change in favor of urban development and ushered in a rapid increase in land value. These open lands around the homesteads, along with other less economically valuable agricultural and barren lands, were all converted into urban sprawls and settlements.
Our results show that, compared to Rawalpindi, forest land in Islamabad not only remained intact, but has increased at an annual rate of 0.92% during the study period, with a positive increase in the NDVI value. This positive change in the NDVI for Islamabad could be attributed to strict management and law enforcement by the capital’s forest management department. Strict forest protection law enforcement in the urban area can lead to the development of protected areas, including green belts, research areas, and botanical gardens [69]. The establishment of the Margallah Hills National Park (MHNP) in Islamabad is an example of urban forest protection. Furthermore, green belts, roadside plantations, and botanical gardens increased in Islamabad, supporting the green forest cover [70]. This increase in forest area is also related to the planned forest policies of the federal government in Islamabad, whose main objective is increasing the forest area and ensuring its conservation. On the other hand, the protected and reserved forests of Rawalpindi are challenged by illegal wood harvesting, artisanal logging, and forest land encroachment [71]. For instance, illegal encroachment has been observed in the Loi Bher Reserve Forest, located in the center of Rawalpindi. This could be one the reasons for the decrease in the NDVI value for Rawalpindi during the study period. Similarly, unplanned urbanization and forest land degradation in Rawalpindi also resulted in the decrease in the amount of stored carbon in its forests. Islamabad, on the other hand, witnessed an increase in stored carbon in its forests between 1990 and 2020.
The forests of Rawalpindi, including both protected and reserved forests, are very much prone to encroachment from illegal building by housing societies, i.e., Bahira Town, Media Town, the Police Foundation, etc. Encroachment in Loi Bher Reserve Forest, located in the center of Rawalpindi, was noted from 1990 to 2000, and as a result, the mean value of the NDVI decreased from 0.678 to 0.552 in the observed period (see Figure 8).
Figure 8.
NDVI of Loi Bher RF, Rawalpindi: (a) Year-1990; (b) Year-2020.
Due to unplanned, uncontrolled, and unchecked urbanization in Rawalpindi, the forest carbon decreased from 544.70 Gg C to 218.05 Gg C, where in Islamabad, the stored carbon in the forest was 2779.64 Gg C in 1990 and increased to 3548.16 Gg C in 2020. This could be attributed to the increase of forest land in Islamabad and the decrease of forest land in Rawalpindi for the same period of time. Deforestation reduces the ability of forests to act as carbon sinks, as it is directly related to the biomass of forest. Due to deforestation, carbon loss was observed to be 31.33 GgC/ha annually in the subtropical forests of Pakistan [72]. However, contradicting results were observed in China, in which the carbon sink was increased from 36 MgC/ha to 41 MgC/ha from 1981 to 2000, due to forest conservation policies [73]. Although the urbanization in Islamabad was more rapid compared to Rawalpindi, it does not affect the forest land, due to the active implication of environmental policies.
5. Conclusions
The findings of this study show that the twin cities of Rawalpindi and Islamabad have experienced rapid urbanization during the study period. Despite expansion in the urban area, an increase in the vegetation cover was observed in Islamabad. In Rawalpindi, a decrease in the forest area was recorded. The relative increase in Islamabad’s vegetation cover could be attributed to better management and implementation of urban forest protection policies. Our study signifies the importance of forest conservation in the cosmopolitan cities. Our results would assist policy makers in designing conservation and management policies that could potentially support sustainable urban ecosystems. Based on our findings, we recommend that researchers conduct a comparative study focusing on the status and dynamics of land surface temperature for the twin cities.
Author Contributions
Conceptualization, A.M., U.A. and S.M.N.; Data curation, T.U.K., S.M.N., B.M. and A.A.; Formal analysis, J.L. and A.M.; Funding acquisition, F.Y.; Investigation, T.U.K. and A.M.; Methodology, A.M. and F.Y.; Software, T.U.K., A.M. and S.M.N.; Validation, A.M., J.L. and M.W.M.; Visualization, A.M., T.U.K. and M.W.M.; Writing—original draft, A.M.; Writing—review and editing, S.M.N., T.U.K., M.W.M. and B.M. All authors have read and agreed to the published version of the manuscript.
Funding
This research was funded by Integrated acquisition and intelligent applications of remote sensing information with time, space and spectrum synchronization. Grant number (X190211TE190).
Institutional Review Board Statement
Not applicable.
Informed Consent Statement
Not applicable.
Data Availability Statement
Not applicable.
Conflicts of Interest
The authors declare no conflict of interest. The funders had no role in the design of the study; in the collection, analyses, or interpretation of data; in the writing of the manuscript, or in the decision to publish the results.
References
- Bagan, H.; Yamagata, Y. Land-cover change analysis in 50 global cities by using a combination of Landsat data and analysis of grid cells. Environ. Res. Lett. 2014, 9, 064015. [Google Scholar] [CrossRef]
- Sadiq Khan, M.; Ullah, S.; Sun, T.; Rehman, A.U.; Chen, L. Land-Use/Land-Cover Changes and Its Contribution to Urban Heat Island: A Case Study of Islamabad, Pakistan. Sustainability 2020, 12, 3861. [Google Scholar] [CrossRef]
- Moulds, S.; Buytaert, W.; Mijic, A. An open and extensible framework for spatially explicit land use change modelling: The lulcc R package. Geosci. Model Dev. 2015, 8, 3215–3229. [Google Scholar] [CrossRef]
- Nagendra, H.; Bai, X.; Brondizio, E.S.; Lwasa, S. The urban south and the predicament of global sustainability. Nat. Sustain. 2018, 1, 341–349. [Google Scholar] [CrossRef]
- Hanif, I. Impact of fossil fuels energy consumption, energy policies, and urban sprawl on carbon emissions in East Asia and the Pacific: A panel investigation. Energy Strategy Rev. 2018, 21, 16–24. [Google Scholar] [CrossRef]
- Habibi, S.; Asadi, N. Causes, results and methods of controlling urban sprawl. Procedia Eng. 2011, 21, 133–141. [Google Scholar] [CrossRef]
- Angel, S.; Parent, J.; Civco, D.; Blei, A. Atlas of Urban Expansion; Lincoln Institute of Land Policy: Cambridge, MA, USA, 2012. [Google Scholar]
- Seto, K.C.; Güneralp, B.; Hutyra, L.R. Global forecasts of urban expansion to 2030 and direct impacts on biodiversity and carbon pools. Proc. Natl. Acad. Sci. USA 2012, 109, 16083–16088. [Google Scholar] [CrossRef] [PubMed]
- Mukete, B.; Sun, Y. Assessing the Effectiveness of Urban Nature Reserves on Biodiversity Conservation. Appl. Ecol. Environ. Sci. 2014, 2, 130–134. [Google Scholar]
- Khan, T.U.; Mannan, A.; Hacker, C.E.; Ahmad, S.; Amir Siddique, M.; Khan, B.U.; Din, E.U.; Chen, M.; Zhang, C.; Nizami, M. Use of GIS and Remote Sensing Data to Understand the Impacts of Land Use/Land Cover Changes (LULCC) on Snow Leopard (Panthera uncia) Habitat in Pakistan. Sustainability 2021, 13, 3590. [Google Scholar] [CrossRef]
- Camagni, R.; Gibelli, M.C.; Rigamonti, P. Urban mobility and urban form: The social and environmental costs of different patterns of urban expansion. Ecol. Econ. 2002, 40, 199–216. [Google Scholar] [CrossRef]
- Hassan, Z.; Shabbir, R.; Ahmad, S.S.; Malik, A.H.; Aziz, N.; Butt, A.; Erum, S. Dynamics of land use and land cover change (LULCC) using geospatial techniques: A case study of Islamabad Pakistan. SpringerPlus 2016, 5, 812. [Google Scholar] [CrossRef]
- Liu, J.; Tian, H.; Liu, M.; Zhuang, D.; Melillo, J.M.; Zhang, Z. China’s changing landscape during the 1990s: Large-scale land transformations estimated with satellite data. Geophys. Res. Lett. 2005, 32. [Google Scholar] [CrossRef]
- Negassa, M.D.; Mallie, D.T.; Gemeda, D.O. Forest cover change detection using Geographic Information Systems and remote sensing techniques: A spatio-temporal study on Komto Protected Forest priority area, East Wollega Zone, Ethiopia. Environ. Syst. Res. 2020, 9, 1–14. [Google Scholar] [CrossRef]
- Shah, F.; Wei, L.; Lashari, A.; Islam, A.; Khattak, H.; Rasool, U. Evaluation of land use and land cover Spatio-temporal change during rapid Urban sprawl from Lahore, Pakistan. Urban Clim. 2021, 39, 100931. [Google Scholar] [CrossRef]
- Marcotullio, P.J.; Braimoh, A.K.; Onishi, T. The impact of urbanization on soils. In Land Use and Soil Resources; Springer: Berlin/Heidelberg, Germany, 2008; pp. 201–250. [Google Scholar]
- Hansen, V.; Müller-Stöver, D.; Ahrenfeldt, J.; Holm, J.K.; Henriksen, U.B.; Hauggaard-Nielsen, H. Gasification biochar as a valuable by-product for carbon sequestration and soil amendment. Biomass Bioenergy 2015, 72, 300–308. [Google Scholar] [CrossRef]
- Coetzee, D.; Fox, A.; Hearst, M.A.; Hartmann, B. Should your MOOC forum use a reputation system? In Proceedings of the 17th ACM conference on Computer Supported Cooperative Work & Social Computing, Baltimore, MD, USA, 15–19 February 2014; pp. 1176–1187. [Google Scholar]
- Le Roux, D.S.; Ikin, K.; Lindenmayer, D.B.; Blanchard, W.; Manning, A.D.; Gibbons, P. Reduced availability of habitat structures in urban landscapes: Implications for policy and practice. Landsc. Urban Plan. 2014, 125, 57–64. [Google Scholar] [CrossRef]
- Mukete, B.; Sun, Y.; Etongo, D.; Ekoungoulou, R.; Folega, F.; Sajjad, S.; Ngoe, M.; Ndiaye, G. Household characteristics and forest resources dependence in the rumpi hills of Cameroon. Appl. Ecol. Environ. Res. 2018, 16, 2755–2779. [Google Scholar] [CrossRef]
- Chaplin-Kramer, R.; Sharp, R.P.; Mandle, L.; Sim, S.; Johnson, J.; Butnar, I.; Canals, L.M.I.; Eichelberger, B.A.; Ramler, I.; Mueller, C. Spatial patterns of agricultural expansion determine impacts on biodiversity and carbon storage. Proc. Natl. Acad. Sci. USA 2015, 112, 7402–7407. [Google Scholar] [CrossRef]
- Mannan, A.; Feng, Z.; Ahmad, A.; Liu, J.; Saeed, S.; Mukete, B. Carbon dynamic shifts with land use change in Margallah hills national park, Islamabad (Pakistan) from 1990 to 2017. Appl. Ecol. Environ. Res. 2018, 16, 3197–3214. [Google Scholar] [CrossRef]
- Li, M.; Chu, R.; Islam, A.R.M.T.; Shen, S. Characteristics of surface evapotranspiration and its response to climate and land use and land cover in the Huai River Basin of eastern China. Environ. Sci. Pollut. Res. 2021, 28, 683–699. [Google Scholar] [CrossRef] [PubMed]
- Beckline, M.; Yujun, S.; Etongo, D.; Saeed, S.; Mannan, A. Assessing the drivers of land use change in the Rumpi hills forest protected area, Cameroon. J. Sustain. For. 2018, 37, 592–618. [Google Scholar] [CrossRef]
- Zhao, Y.; Zhang, K.; Fu, Y.; Zhang, H. Examining land-use/land-cover change in the Lake Dianchi Watershed of the Yunnan-Guizhou Plateau of southwest China with remote sensing and GIS techniques: 1974–2008. Int. J. Environ. Res. Public Health 2012, 9, 3843–3865. [Google Scholar] [CrossRef] [PubMed]
- Beckline, M.; Yujun, S.; Yvette, B.; John, A.B.; Mor-Achankap, B.; Saeed, S.; Richard, T.; Wose, J.; Paul, C. Perspectives of remote sensing and GIS applications in tropical forest management. Am. J. Agric. For. 2017, 5, 33–39. [Google Scholar] [CrossRef][Green Version]
- Fokeng, M.; Meli, M. Modelling drivers of forest cover change in the Santchou Wildlife Reserve, West Cameroon using remote sensing and land use dynamic degree indexes. Can. J. Trop. Geogr. 2015, 2, 29–42. [Google Scholar]
- Willkomm, M.; Bolten, A.; Bareth, G. Non-Destructive Monitoring of Rice by Hyperspectral In-Field Spectrometry And Uav-Based Remote Sensing: Case Study Of Field-Grown Rice In North Rhine-Westphalia, Germany. Int. Arch. Photogramm. Remote Sens. Spat. Inf. Sci. 2016, 41, 1071–1077. [Google Scholar] [CrossRef]
- Haque, N.U. Flawed Urban Development Policies in Pakistan; Pakistan Institute of Development Economics: Islamabad, Pakistan, 2015. [Google Scholar]
- Bilal, M. Operations and Projects Performance and Quality Metrics for Capital Development Authority (CDA) Islamabad. Available online: https://www.academia.edu/8317062/Operations_and_Projects_Performance_and_Quality_Metrics_for_Capital_Development_Authority_CDA_Islamabad (accessed on 5 September 2021).
- Chandio, S.H.; Ahmed, S.M.; Bhutto, S.U.A.; Sanjrani, M.A.; Khaskheli, N.A. Impact of Natural Events and Anthropogenic Activities on the Biodiversity of Margallah Hills National Park Islamabad (MHNP). N. Am. Acad. Res. 2019, 2, 20–32. [Google Scholar]
- Ilmas, B.; Mir, K.A.; Khalid, S. Greenhouse gas emissions from the waste sector: A case study of Rawalpindi in Pakistan. Carbon Manag. 2018, 9, 645–654. [Google Scholar] [CrossRef]
- Gill, M.I.; Saqib, F. A Comparitive analysis of demographic, fertility and urban transition in Pakistan and the world around. Pak. Geogr. Rev. 2019, 74, 33–47. [Google Scholar]
- Adeel, M. The role of Land Use Policy behind unauthorized spatial expansion in rural areas of Islamabad. In Proceedings of the 46th ISOCARP Congress, Nairobi, Kenya, 19–23 September 2010. [Google Scholar]
- Hussain, M.S.; Lee, S.-H. A classification of rainfall regions in Pakistan. J. Korean Geogr. Soc. 2009, 44, 605–623. [Google Scholar]
- Akram, A.; Rais, M.; Asadi, M.A.; Jilani, M.J.; Balouch, S.; Anwar, M.; Saleem, A. Do habitat variables correlate anuran abundance in arid terrain of Rawalpindi–Islamabad Areas, Pakistan? J. King Saud Univ.-Sci. 2015, 27, 278–283. [Google Scholar] [CrossRef]
- Amoatey, P.; Sulaiman, H.; Kwarteng, A.; Al-Reasi, H.A. Above-ground carbon dynamics in different arid urban green spaces. Environ. Earth Sci. 2018, 77, 431. [Google Scholar] [CrossRef]
- Nguyen, H.C.; Jung, J.; Lee, J.; Choi, S.-U.; Hong, S.-Y.; Heo, J. Optimal atmospheric correction for above-ground forest biomass estimation with the ETM+ remote sensor. Sensors 2015, 15, 18865–18886. [Google Scholar] [CrossRef]
- Kaufman, Y.J. Atmospheric effect on spectral signature-measurements and corrections. IEEE Trans. Geosci. Remote Sens. 1988, 26, 441–450. [Google Scholar] [CrossRef]
- Rwanga, S.S.; Ndambuki, J.M. Accuracy assessment of land use/land cover classification using remote sensing and GIS. Int. J. Geosci. 2017, 8, 611. [Google Scholar] [CrossRef]
- Frutuoso, R.; Lima, A.; Teodoro, A.C. Application of remote sensing data in gold exploration: Targeting hydrothermal alteration using Landsat 8 imagery in northern Portugal. Arab. J. Geosci. 2021, 14, 459. [Google Scholar] [CrossRef]
- Payton, I.; Newell, C.L.; Beets, P.N. New Zealand Carbon Monitoring System: Indigenous Forest and Shrubland Data Collection Manual; Manaaki Whenua Landcare Research: Lincoln, New Zealand, 2004.
- Nizami, S.M. The inventory of the carbon stocks in sub-tropical forests of Pakistan for reporting under Kyoto Protocol. J. For. Res. 2012, 23, 377–384. [Google Scholar] [CrossRef]
- Oliver, G.; Pearce, S.; Graham, J.; Beets, P. Carbon in plantation understorey shrubs. Scion Contract Rep. 2009, 43877. [Google Scholar]
- Change, IPCC Guidelines for National Greenhouse Gas Inventories; The Intergovernmental Panel on Climate Change (IPCC): Geneva, Switzerland, 2006.
- Houghton, R. Revised Estimates of the Annual Net Flux of Carbon to the Atmosphere from Changes in Land Use and Land Management 1850–2000. Tellus B 2003, 55, 378–390. [Google Scholar] [CrossRef]
- Köhl, M.; Lasco, R.; Cifuentes, M.; Jonsson, Ö.; Korhonen, K.T.; Mundhenk, P.; de Jesus Navar, J.; Stinson, G. Changes in forest production, biomass and carbon: Results from the 2015 UN FAO Global Forest Resource Assessment. For. Ecol. Manag. 2015, 352, 21–34. [Google Scholar] [CrossRef]
- Baccini, A.; Walker, W.; Carvalho, L.; Farina, M.; Sulla-Menashe, D.; Houghton, R. Tropical forests are a net carbon source based on aboveground measurements of gain and loss. Science 2017, 358, 230–234. [Google Scholar] [CrossRef] [PubMed]
- Nath, B. Quantitative assessment of forest cover change of a part of Bandarban Hill tracts using NDVI techniques. J. Geosci. Geomat. 2014, 2, 21–27. [Google Scholar]
- Yengoh, G.T.; Dent, D.; Olsson, L.; Tengberg, A.E.; Tucker III, C.J. Use of the Normalized Difference Vegetation Index (NDVI) to Assess Land Degradation at Multiple Scales: Current Status, Future Trends, and Practical Considerations; Springer: Berlin/Heidelberg, Germany, 2015. [Google Scholar]
- Olorunfemi, I.E.; Fasinmirin, J.T.; Olufayo, A.A.; Komolafe, A.A. GIS and remote sensing-based analysis of the impacts of land use/land cover change (LULCC) on the environmental sustainability of Ekiti State, southwestern Nigeria. Environ. Dev. Sustain. 2020, 22, 661–692. [Google Scholar] [CrossRef]
- Xu, X.; Jain, A.K.; Calvin, K.V. Quantifying the biophysical and socioeconomic drivers of changes in forest and agricultural land in South and Southeast Asia. Glob. Chang. Biol. 2019, 25, 2137–2151. [Google Scholar] [CrossRef]
- Linares, J.C.; Camarero, J.J.; Carreira, J.A. Interacting effects of changes in climate and forest cover on mortality and growth of the southernmost European fir forests. Glob. Ecol. Biogeogr. 2009, 18, 485–497. [Google Scholar] [CrossRef]
- Yuan, F.; Sawaya, K.E.; Loeffelholz, B.C.; Bauer, M.E. Land cover classification and change analysis of the Twin Cities (Minnesota) Metropolitan Area by multitemporal Landsat remote sensing. Remote Sens. Environ. 2005, 98, 317–328. [Google Scholar] [CrossRef]
- an Rotmans, J. 9 Indicators for Sustainable Development. In Perspectives on Global Change: The TARGETS Approach; Cambridge University Press: Cambridge, UK, 1997; p. 189. [Google Scholar]
- Zhang, L.; Weng, Q.; Shao, Z. An evaluation of monthly impervious surface dynamics by fusing Landsat and MODIS time series in the Pearl River Delta, China, from 2000 to 2015. Remote Sens. Environ. 2017, 201, 99–114. [Google Scholar] [CrossRef]
- Bennett, M.M.; Smith, L.C. Advances in using multitemporal night-time lights satellite imagery to detect, estimate, and monitor socioeconomic dynamics. Remote Sens. Environ. 2017, 192, 176–197. [Google Scholar] [CrossRef]
- Xu, G.; Jiao, L.; Yuan, M.; Dong, T.; Zhang, B.; Du, C. How does urban population density decline over time? An exponential model for Chinese cities with international comparisons. Landsc. Urban Plan. 2019, 183, 59–67. [Google Scholar] [CrossRef]
- Demographic, P.; Survey, H. MEASURE DHS. ICF International Calverton; National Institute of Population Studies: Islamabad, Pakistan, 2012; pp. 2012–2213. [Google Scholar]
- Frantzeskakis, I. Islamabad, a town planning example for a sustainable city. Sustain. Dev. Plan. IV 2009, 1, 175. [Google Scholar]
- Bokhari, S.; Saqib, Z.; Ali, A.; Zaman-Ul-Haq, M. Perception of residents about urban vegetation: A comparative study of planned versus semi-planned cities of Islamabad and Rawalpindi. Pak. J. Ecosyst. Ecography 2018, 8, 2. [Google Scholar] [CrossRef]
- Sohail, M.T.; Mahfooz, Y.; Azam, K.; Yen, Y.; Genfu, L.; Fahad, S. Impacts of urbanization and land cover dynamics on underground water in Islamabad, Pakistan. Desalination Water Treat. 2019, 159, 402–411. [Google Scholar] [CrossRef]
- Maria, S.I.; Imran, M. Planning of Islamabad and Rawalpindi: What went wrong. In Proceedings of the 42nd ISoCaRP Congress, Istanbul, Turkey, 14–18 September 2006; pp. 14–18. [Google Scholar]
- Dogar, N. The Twin City of Islamabad/Rawalpindi: An Evaluative Study of Twenty-Five Years of Plan Implementation. Master’s Thesis, Asian Institute of Technology, Bangkok, Thailand, 1985. [Google Scholar]
- Malik, R.N.; Hashmi, M.Z. Multivariate statistical techniques for the evaluation of surface water quality of the Himalayan foothills streams, Pakistan. Appl. Water Sci. 2017, 7, 2817–2830. [Google Scholar] [CrossRef]
- Tauhidi, A.; Chohan, U.W. Encroachments & the Mystery of Capital: A Pakistani Context. SSRN Electron. J. 2020. [Google Scholar] [CrossRef]
- Siddique, I.A.Q.; Ahmed, J. Improvement of seed germination in some important multi-purpose leguminous trees of Islamabad Area: An experimental study. Basic Res. J. Agric. Sci. Rev. 2015, 4, 217–224. [Google Scholar]
- Beacco, D. Urban Planning in Islamabad: From the Modern Movement to the Contemporary Urban Development Between Formal and Informal Settlements. In Sustainable Urban Development and Globalization; Springer: Berlin/Heidelberg, Germany, 2018; pp. 65–74. [Google Scholar]
- Chen, X.-W.; Liu, M. Prediction of protein–protein interactions using random decision forest framework. Bioinformatics 2005, 21, 4394–4400. [Google Scholar] [CrossRef]
- Shinwari, M.I.; Khan, M.A. Folk use of medicinal herbs of Margalla hills national park, Islamabad. J. Ethnopharmacol. 2000, 69, 45–56. [Google Scholar] [CrossRef]
- Ashraf, I.; Saeed, U.; Shahzad, N.; Gill, J.; Parvez, S.; Raja, A. Delineating legal forest boundaries to combat illegal forest encroachments: A case study in Murree Forest division, Pakistan. In Forensic GIS; Springer: Berlin/Heidelberg, Germany, 2014; pp. 263–286. [Google Scholar]
- Mannan, A.; Liu, J.; Zhongke, F.; Khan, T.U.; Saeed, S.; Mukete, B.; ChaoYong, S.; Yongxiang, F.; Ahmad, A.; Amir, M. Application of land-use/land cover changes in monitoring and projecting forest biomass carbon loss in Pakistan. Glob. Ecol. Conserv. 2019, 17, e00535. [Google Scholar] [CrossRef]
- Fang, J.; Guo, Z.; Piao, S.; Chen, A. Terrestrial vegetation carbon sinks in China, 1981–2000. Sci. China Ser. D Earth Sci. 2007, 50, 1341–1350. [Google Scholar] [CrossRef]
Publisher’s Note: MDPI stays neutral with regard to jurisdictional claims in published maps and institutional affiliations. |
© 2021 by the authors. Licensee MDPI, Basel, Switzerland. This article is an open access article distributed under the terms and conditions of the Creative Commons Attribution (CC BY) license (https://creativecommons.org/licenses/by/4.0/).