Article

DuoTurbo: Implementation of a Counter-Rotating Hydroturbine for Energy Recovery in Drinking Water Networks

by
Daniel Biner
1,*,
Vlad Hasmatuchi
1,
Laurent Rapillard
1,
Samuel Chevailler
1,
François Avellan
2 and
Cécile Münch-Alligné
1,*
1
Institute of Systems Engineering, School of Engineering, HES-SO Valais-Wallis, Rue de l’Industrie 23, 1950 Sion, Switzerland
2
Technology Platform for Hydraulic Machines PTMH, Ecole Polytechnique Fédérale de Lausanne, Avenue de Cour 33bis, 1007 Lausanne, Switzerland
*
Authors to whom correspondence should be addressed.
Sustainability 2021, 13(19), 10717; https://doi.org/10.3390/su131910717
Submission received: 21 August 2021 / Revised: 22 September 2021 / Accepted: 23 September 2021 / Published: 27 September 2021

Abstract

:
To enhance the sustainability of water supply systems, the development of new technologies for micro scale hydropower remains an active field of research. The present paper deals with the implementation of a new micro-hydroelectric system for drinking water facilities, targeting a gross capacity between 5 kW and 25 kW. A counter-rotating microturbine forms the core element of the energy recovery system. The modular in-line technology is supposed to require low capital expenditure, targeting profitability within 10 years. One stage of the DuoTurbo microturbine is composed of two axial counter-rotating runners, each one featured with a wet permanent magnet rim generator with independent speed regulation. This compact mechanical design facilitates the integration into existing drinking water installations. A first DuoTurbo product prototype is developed by means of a Computational Fluid Dynamics based hydraulic design along with laboratory tests to assess system efficiency and characteristics. The agreements between simulated and measured hydraulic characteristics with absolute errors widely below 5% validate the design approach to a large extent. The developed product prototype provides a maximum electrical power of 6.5 kW at a maximum hydraulic head of 75 m, reaching a hydroelectric peak efficiency of 59%. In 2019, a DuoTurbo pilot was commissioned at a drinking water facility to assess its long-term behavior and thus, to validate advanced technology readiness levels. To the best of the authors knowledge, it is the first implementation of a counter-rotating microturbine with independent runner speed regulation and wet rim generators in a real-world drinking water facility. A complete year of operation is monitored without showing significant drifts of efficiency and vibration. The demonstration of the system in operational environment at pre-commercial state is validated that can be attributed to a technology readiness level of 7. The overall results of this study are promising regarding further industrialization steps and potential broad-scale applicability of the DuoTurbo microturbine in the drinking water industry.

1. Introduction

Among today’s renewable energy sources, hydropower remains one of the most important suppliers of electricity, meeting over 15% of the global needs. In hydrologically and topographically predestined countries, hydropower constitutes even the bulk of electricity production. In Switzerland, hydropower covers more than 57% of the electricity demand [1]. Thereby, small hydropower (SHP) facilities with a gross capacity below 10 MW constitute about 10% of the Swiss hydroelectric capacity. Globally, energy strategies are evolving towards clean and sustainable technologies that also drives the expansion of SHP [2]. In Switzerland, the installed SHP energy production of about 3.4 TWh/year is planned to be increased by up to 770 GWh/year before 2050. Micro-hydropower (MHP), referring to power units below 500 kW, can contribute to a noticeable extent to the SHP mix. Particularly, the field of water treatment and distribution infrastructures hides a considerable MHP potential [3]. However, different main issues are identified such as variations in flows or turbine efficiency and the necessity of further risk assessments and evaluations of long-term reliability of MHP installations. Therefore, energy recovery in the water industry using MHP remains an active area of research, considering the various technical and economical complexities. In Swiss drinking water supply systems, more than 100 GWh/year are already exploited by hundreds of drinking water turbines, thus, about 50% of the estimated potential [4]. Since 2008, a Swiss electricity supply act is in force providing compensatory feed-in remuneration for renewable energies. The newly introduced feed-in tariffs are encouraging MHP exploitation in lower power ranges. Nevertheless, many drinking water facilities with a power potential of a few kW still remain untapped due to the lack of profitable solutions.
One of the most installed hydraulic machines for energy recovery from water distribution systems is the Pump as Turbine (PAT) [5] which represents an economically interesting solution since small pumps are generally produced in series. Extensive research is dedicated to PATs and their implementation in real-world water distribution systems, for example [6]. Recent studies present methodologies to overcome major obstacles for practical applications of PATs such as the lack of performance data [7,8]. Moreover, several technical solutions have been developed to adapt small pumps into small PATs, and variable speed drives may give them one degree of freedom. A recent case study shows that the adoption of PATs in collective irrigation systems is a viable solution to improve their economic and environmental impacts [9]. The latter research reveals a substantial cost decrease of 74% in the electro-mechanical equipment compared to site-specific designed turbines, whereas the electricity production is decreased by only 19%. To increase the sustainability of water distribution systems, special attention is dedicated to management strategies that minimize the overall energy input, inter alia, by integration of MHP technologies [10]. To point out one result of the proposed management strategies, it is found that a set of independent District Metered Areas locally increase the hydraulic energy (compared to widely open water distribution systems) that favors the installation of energy recovery devices at these locations. To facilitate the function extension of water supply networks to energy production, harmony search algorithms are proposed to optimize the planning of such schemes [11].
In the case of facilities with strong hydraulic variations, the development of adapted low power hydroelectric technologies with additional degrees of freedom may provide more operational flexibility. In comparison, the speed coefficient—discharge coefficient characteristic of a PAT with variable speed is typically clustered on only one S-shaped curve [12] whilst for a counter-rotating micro-turbine with one additional degree of freedom it may cover a large area [13]. Moreover, with specific turbine-oriented hydraulic design, efficiency can be optimized. Low head tubular propeller turbines point out one example of this research field [14]. In the perspective of developing a more flexible micro-hydroelectric system for drinking water facilities, HES-SO Valais-Wallis and EPFL-LMH have initiated the DuoTurbo project, focusing on an output power range between 5 kW and 25 kW. A counter-rotating microturbine forms the core element of the new energy recovery station. One stage of this microturbine consists of two axial counter-rotating runners. One early prototype of this specific turbine design was realized at EPFL-LMH using an elbowed pipe system with external electrical generators. Preliminary CFD simulations of this prototype were carried out [15] showing hydraulic efficiencies over 80% for an output power of 2.65 kW. Numerical and experimental methodologies to evaluate the performance and flow features of such type of turbine, involving Laser Doppler Velocimetry, were presented by [16,17]. The experimental validations including losses from the blade tip radial clearance still showed reasonable hydraulic efficiencies above 60%. The integration of a counter-rotating microturbine into water utility networks, considering analytical hill chart models to maximize energy recovery, was presented by [18]. Further, virtual Energy Recovery Station models were analyzed to simulate the energy recovery on a given installation site [19]. A custom runner design strategy [20] is thereby considered to maximize the electricity production at each potential water network. A second prototype with a more compact “bulb” configuration, comprising in-line electrical generators, was later built at HES-SO Valais-Wallis for ongoing developments. Finally, an even more compact DuoTurbo mechanical concepts with more powerful custom rim generators was developed that facilitates the integration into existing water pipelines. To investigate the new hydro-mechanical and electrical concepts, a DuoTurbo laboratory prototype was built in collaboration with industrial partners and extensively tested on the hydraulic test rig of the HES-SO Valais-Wallis [21,22]. Several mechanical solutions concerning the runner bearings and labyrinth seals were investigated to build a first DuoTurbo product prototype in 2018 [23]. Finally, in May 2019, the first DuoTurbo pilot was commissioned at a drinking water network in Savièse, VS Switzerland. The pilot enables long term monitoring and collection of hydraulic, mechanical and electrical parameters and is therefore essential for advanced system validation.
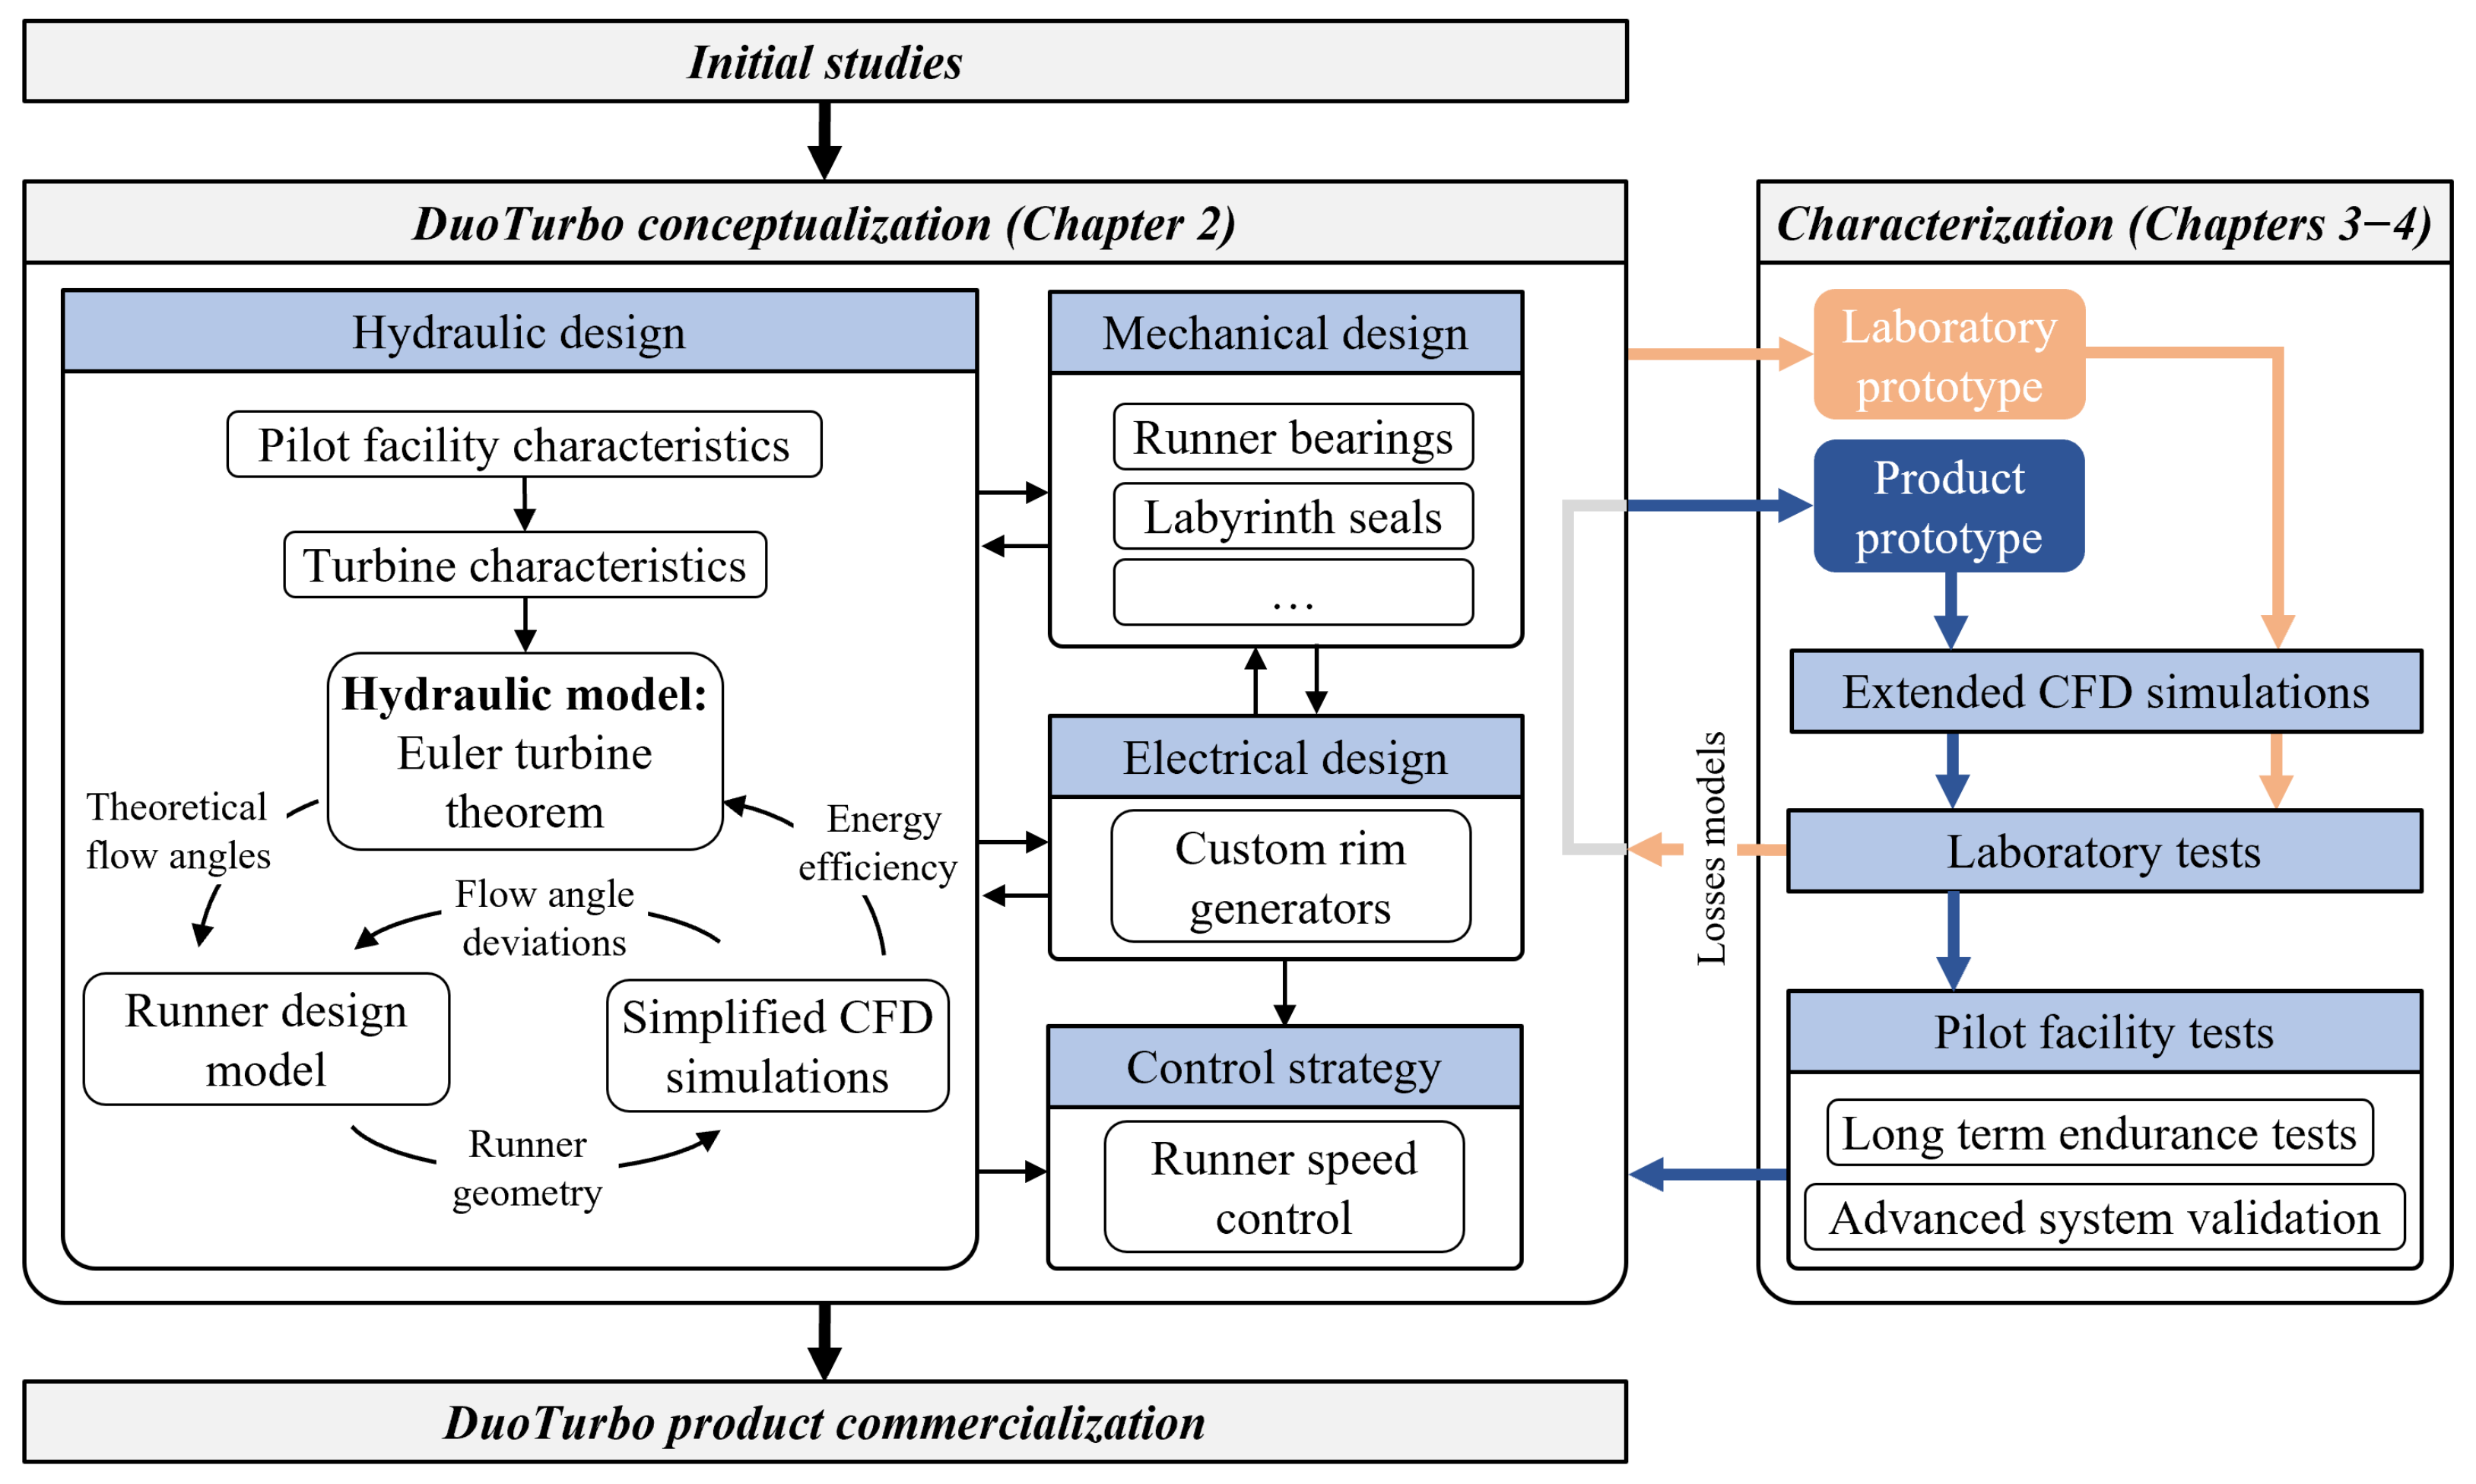
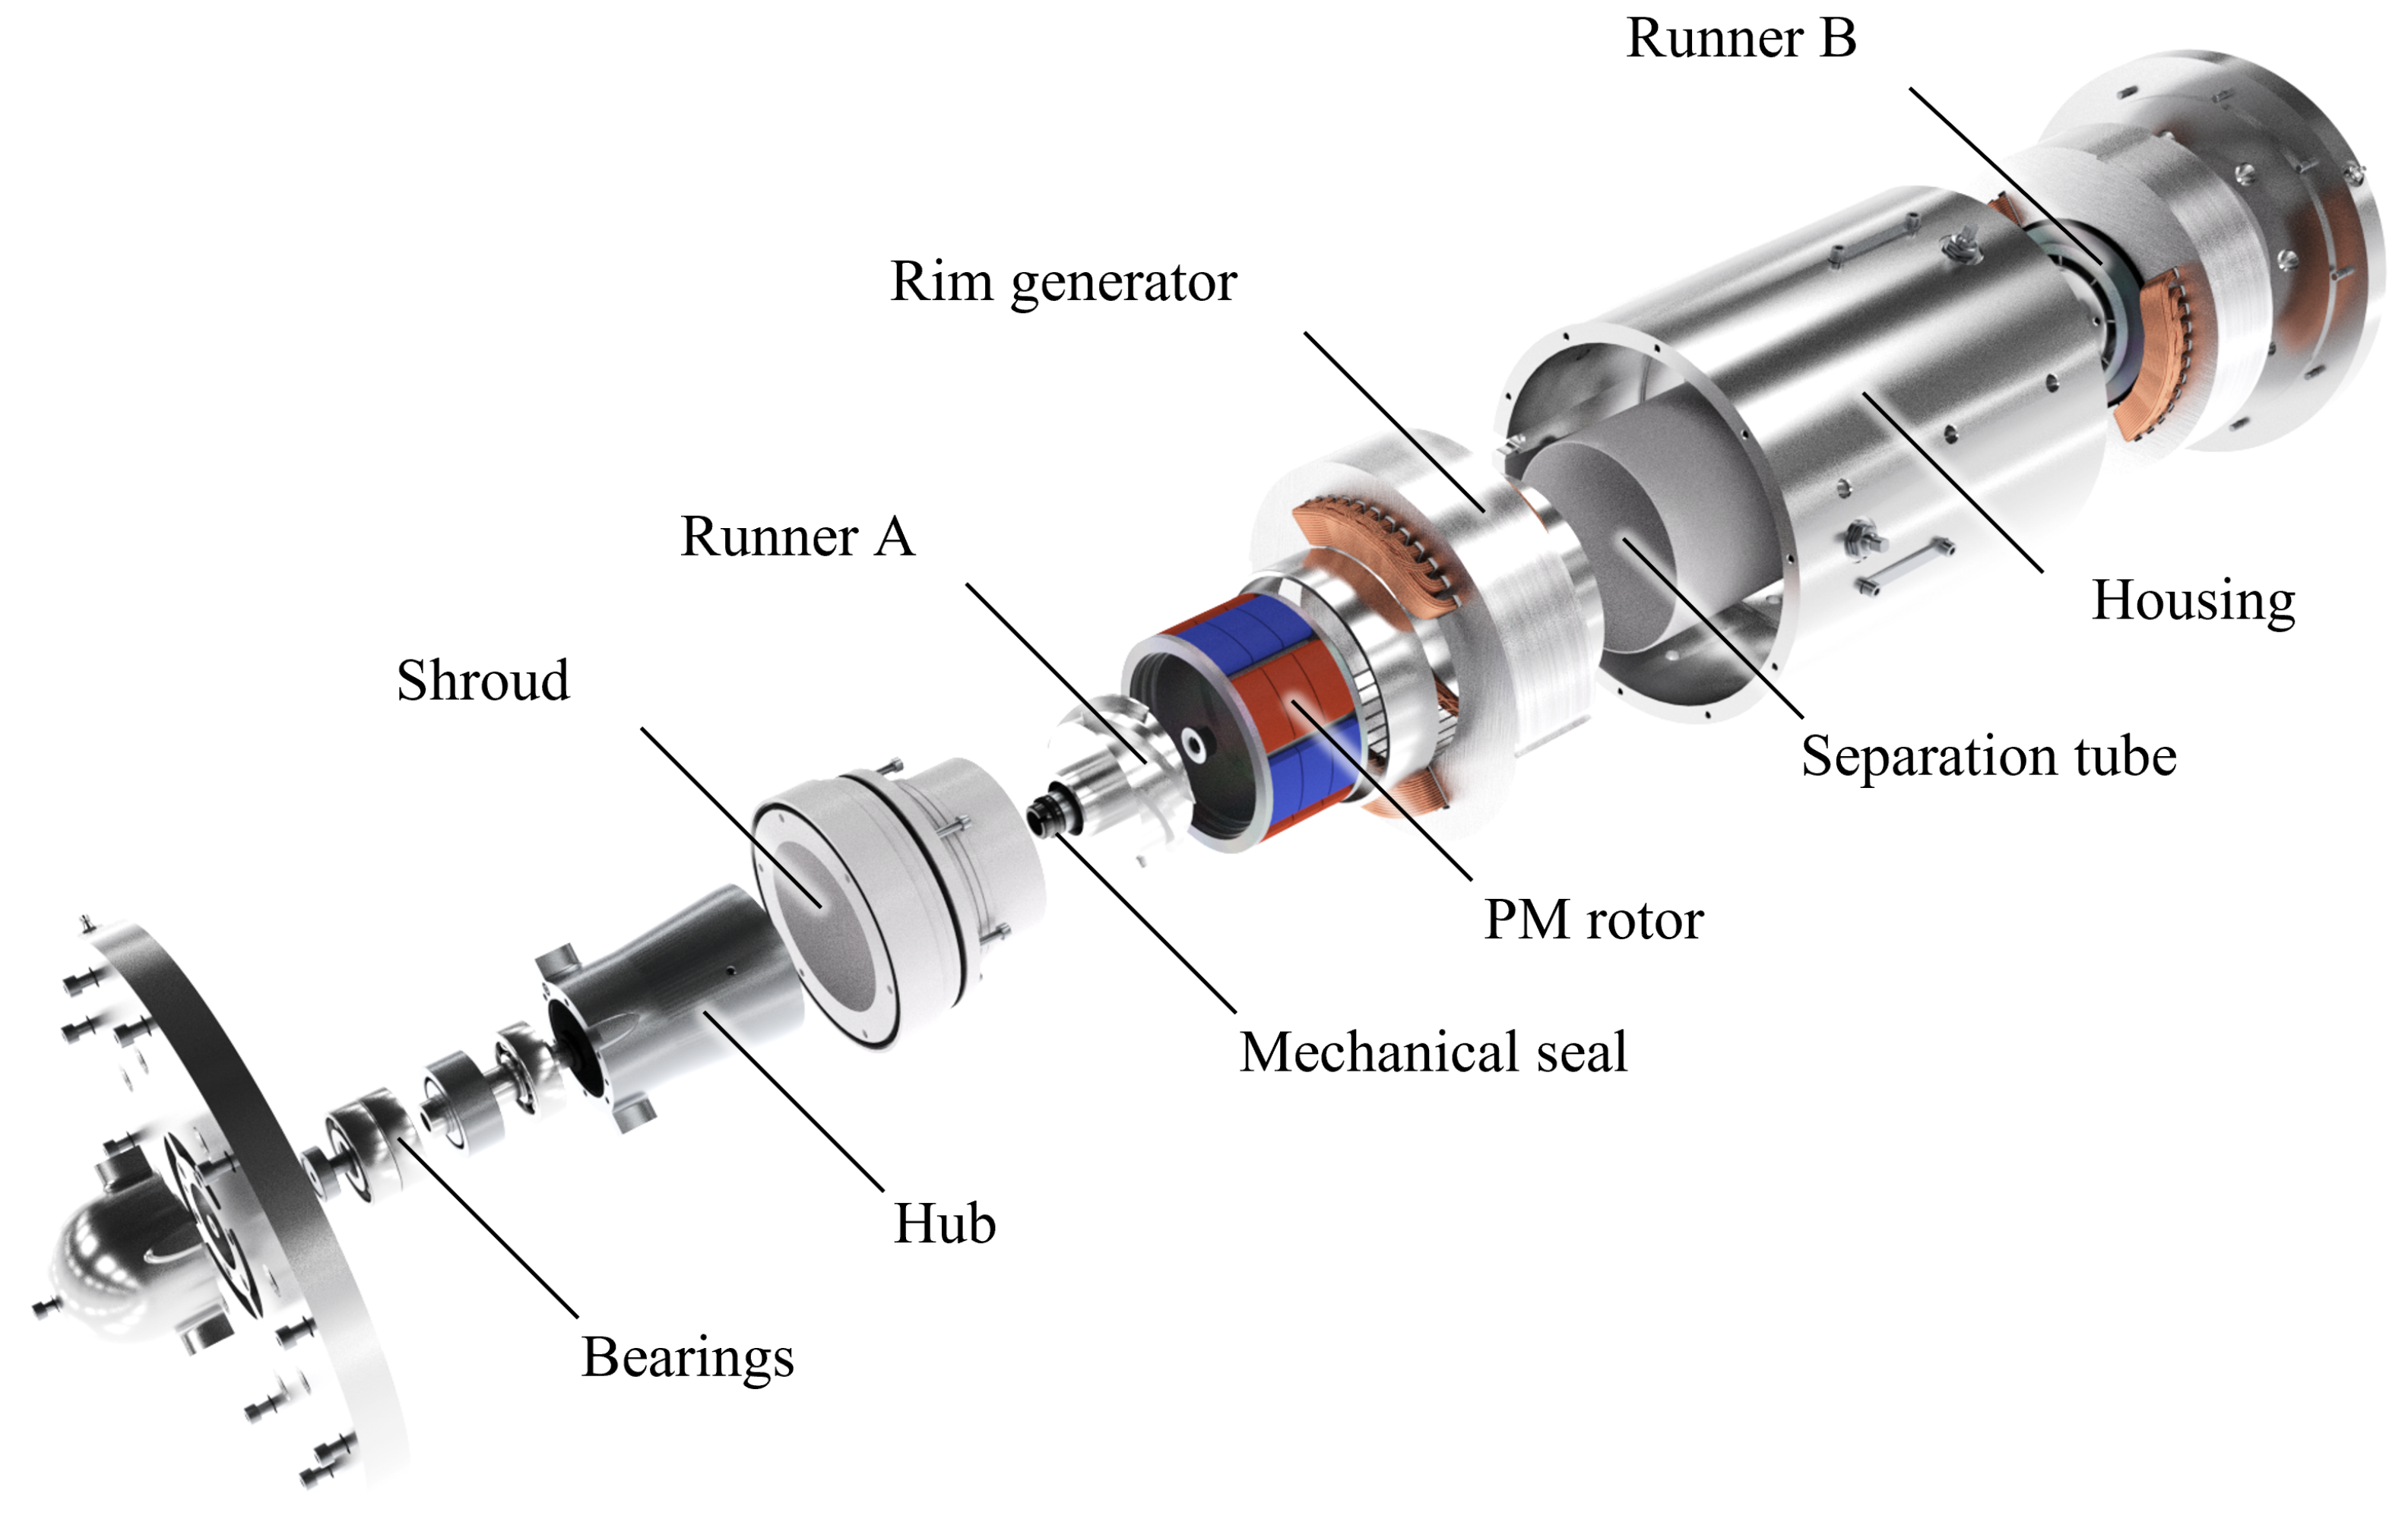
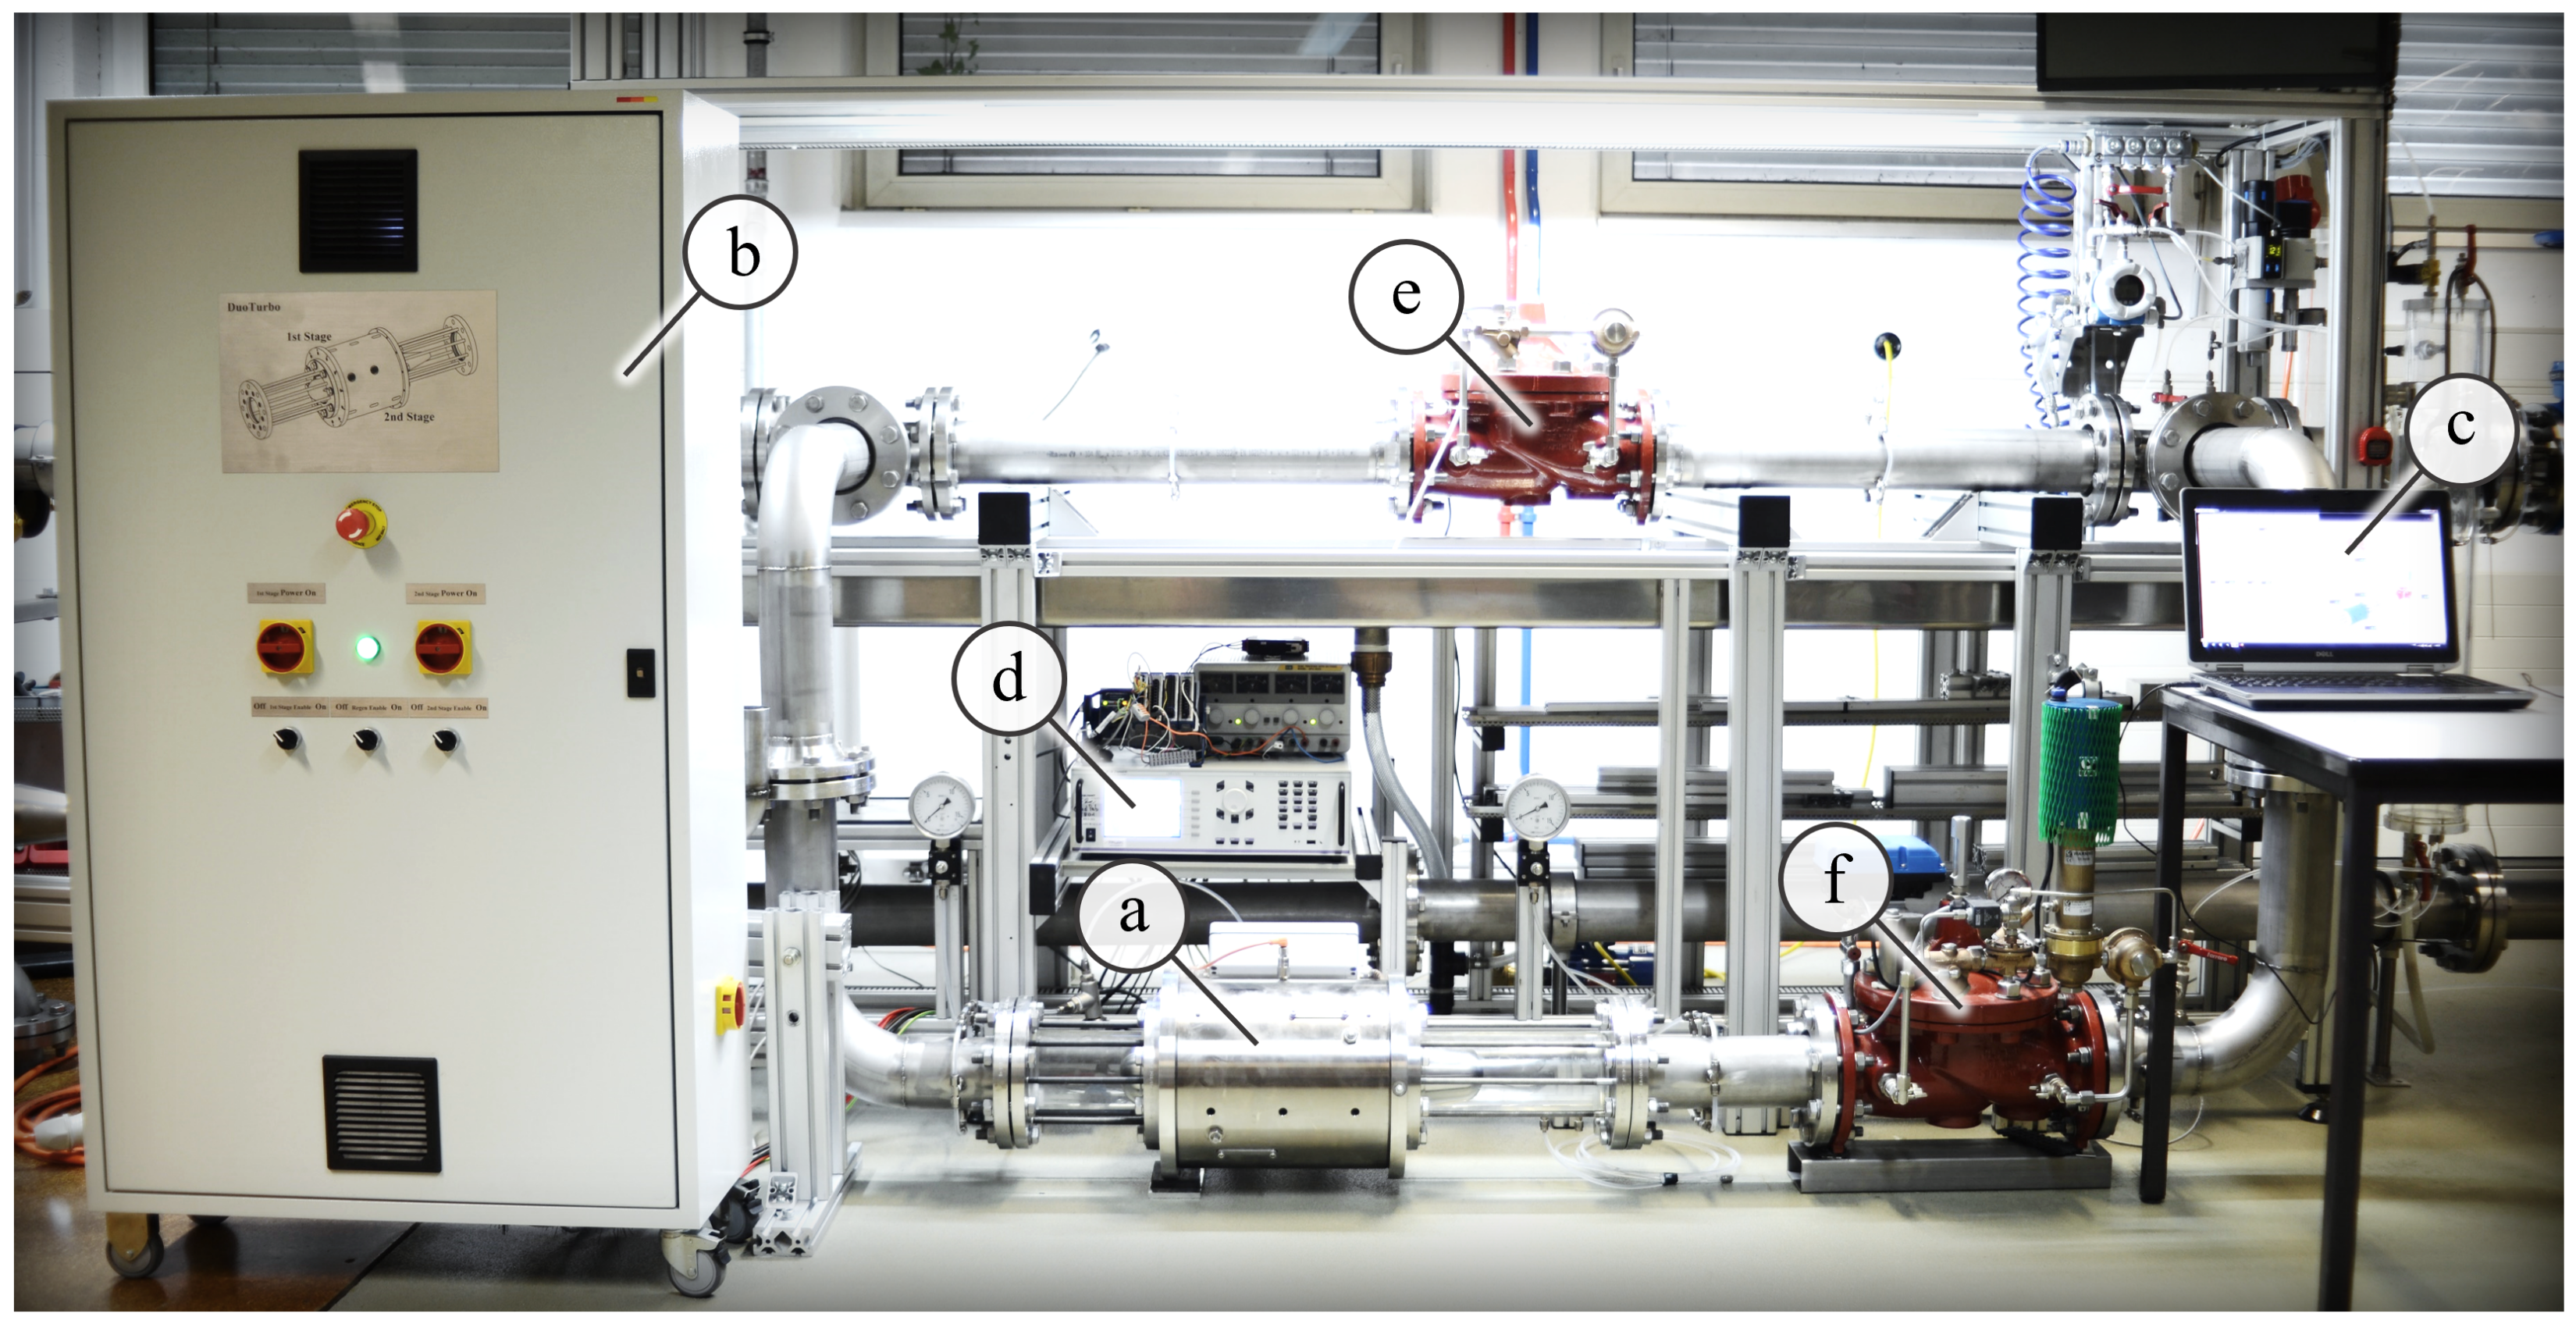
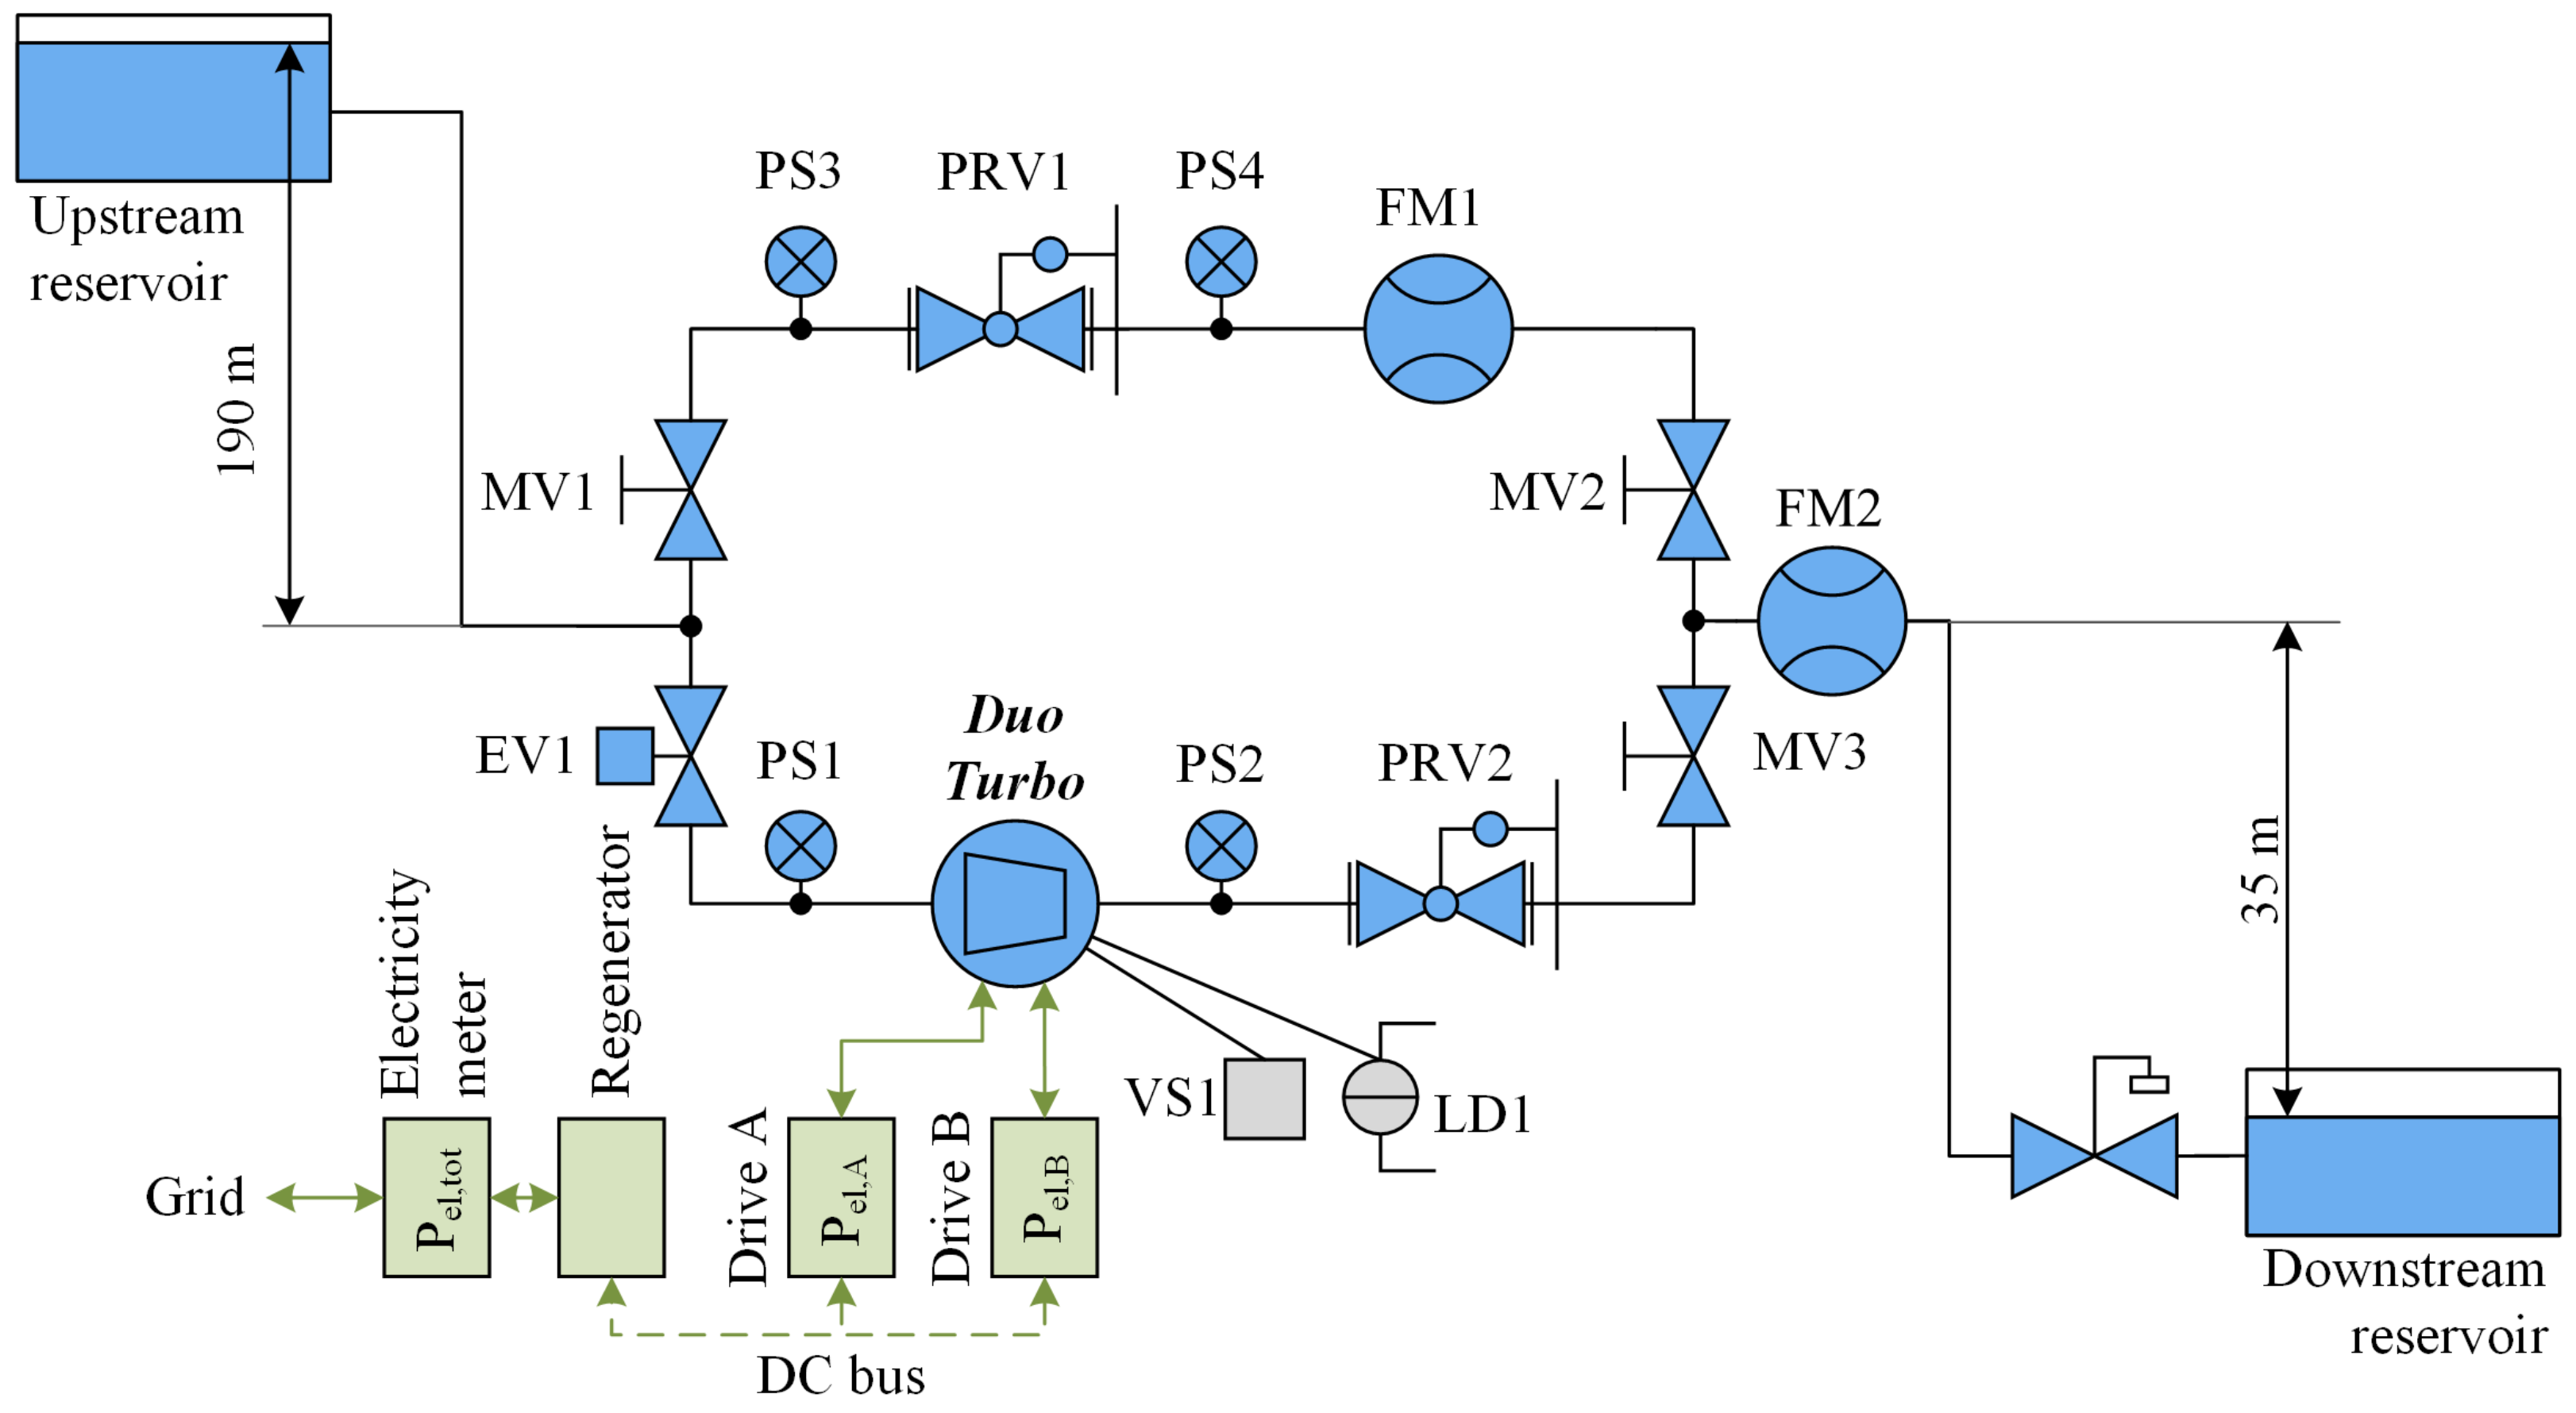
The aim of this paper is to point out the main technical aspects of the developed DuoTurbo product prototype and to demonstrate its reliability operating in a real drinking water network. First, the hydraulic, mechanical and electrical concepts are presented (see Figure 1). Then, numerical and experimental methods used for the system characterization, including the monitoring of the pilot facility, are explained. This paper only deals with the product prototype, as highlighted in dark blue in Figure 1. The corresponding numerical results, laboratory test results and long-term measurement data from the DuoTurbo pilot facility are then presented and discussed.

2. DuoTurbo Concept and Specifications

2.1. Concept Overview

In alpine regions, where altitude differences along the water supply chains are significant, a considerable excess of hydraulic energy is dissipated by Pressure Reducing Valves (PRVs). The DuoTurbo turbine is intended to recover a part of this energy surplus for a maximum hydraulic head of currently 75 m per stage. The core element of the developed technology is a counter-rotating axial microturbine with compact dimensions. Operational flexibility is achieved by the individual speed control of each generator to handle fluctuating hydraulic conditions. Commercial converters are currently used for the runner speed control and the power injection into the electrical grid. A controller manages the autonomous operation of the installation and monitors various hydraulic, mechanical and electrical parameters. For drinking water networks with consumption driven discharge, the layout presented in Figure 2 is suggested. Typically two PRV’s are necessary to ensure the correct and safe functioning of the energy recovery device without affecting the drinking water supply. These elements would also be required using a PAT as a power generating unit. Two parallel branches are needed to ensure the water supply in case of a turbine failure or high water demand, as well as to protect the turbine from overload. Consequently, each branch must be equipped with a PRV to limit the downstream pressure at part load and while bypassing. The pressure set point of the bypass PRV is set slightly below the one of the turbine branch PRV. This pure hydro-mechanical configuration forces the closure of the bypass branch until reaching the turbine power limit. A solenoid valve is used to switch off the pressure control of the turbine branch’s PRV and its deactivation initiates the closure of the turbine branch.

2.2. Hydroturbine Concept

2.2.1. Turbine Principle

The DuoTurbo microturbine is an axial flow turbine with two serial counter-rotating runners per stage. In the field of turbomachines, the concept of counter-rotating axial rotors is known since many years and has been considered for potential use in gas turbines or aircraft engines [24]. The elimination of vanes between two counter-rotating runners is beneficial in terms of weight, length and efficiency. The attributes of counter-rotating turbines in such applications are high specific powers, high efficiency and possible balancing of torque and gyroscopic effects. The counter-rotating principle is also applied to aircraft and marine propellers. Various studies on hydraulic counter-rotating axial pico- and microturbines for potential applications in water infrastructures have been published [25,26,27]. The counter-rotating concept is also known in the field of hydraulic axial flow pumps [28]. From the hydraulic point of view, the main advantages of the counter-rotating architecture of the DuoTurbo microturbine lie in the achievable specific energies, the flexibility of design and the adaptability to variable operating conditions. The speed ratio between the two runners, referred as α , serves as an additional degree of freedom to handle off-design conditions. Further, site specific adaptations of the hydraulic characteristic can be achieved by tuning the nominal speed ratio α n . To minimize the design complexity, the DuoTurbo microturbine is intended to be vaneless. This implies an axial flow at the inlet of the first runner and the outlet of the second runner at nominal operating conditions.

2.2.2. Energy Transfer

The specific energy E released from the fluid in a horizontal hydraulic turbine is expressed as:
E = p ¯ I p ¯ I ¯ ρ + C ¯ I 2 C ¯ I ¯ 2 2
Thereby, p ¯ is the average static pressure, C ¯ is the average absolute flow velocity amplitude and ρ is the density of the fluid. The indices I and I ¯ refer to the high and the low pressure reference sections of the turbine, respectively, as shown in Figure 3. The indices referring to runner specific pressure reference sections are 1 and 1 ¯ . The hydraulic power is then defined by the discharge Q passing the turbine:
P h = ρ E Q
The transferred specific energy E t transmitted to the turbine runner is then determined by the energy efficiency η e as a consequence of turbulent dissipation and wall friction:
E t = E η e
Assuming an inviscid flow passing through the runner on a constant spanwise coordinate, the Euler turbine relation applied to a given streamline yields the correlation between the transferred specific energy E t and the balance of the flux of angular momentum between the runner’s high and low pressure reference sections:
E t = U 1 C u 1 U 1 ¯ C u 1 ¯
Thereby, U is the tangential runner velocity amplitude and C u is the peripheral absolute flow velocity amplitude. In Figure 3, these velocity components are used to define the velocity triangles in an ideal situation. W denotes the relative flow velocity amplitude with respect to the rotating reference frame and C m is the meridional absolute flow velocity amplitude.

2.2.3. Runner Design

On the basis of the velocity triangles defined in Figure 3 and by choosing an appropriate radial distribution of E t that fulfills the radial equilibrium of the flow, all relative flow angles β can be approximated. The relative flow angles determine to a large extend the runner geometry. The inlet blade angles are generally chosen according to the theoretical relative inlet flow angles, by respecting a certain blade incidence angle. The incidence angles are tuned to optimize the blade design. The specific energy of a runner is very sensitive to its outlet blade angles. To achieve the desired characteristics, flow angle deviations must be taken into account. They can be predicted using empirical data or numerical simulations. They generally depend on the hydrofoil shape, the blade solidity (Equation (5)) and the hydraulic design point. The design process of the DuoTurbo runners is based on iterative CFD simulations, by which the required outlet blade angles, as well as efficient hydrofoil parameters are determined. To generate the blade geometry, hydrofoils are defined only at the hub and shroud diameter using a direct profiling parametrization according to Figure 4. This two section based blade shape definition was chosen since it enables a relatively fast and simple machining process.
Further, the shroud diameter D s and the hub diameter D h of the DuoTurbo runners are constant to minimize the fabrication costs. The main runner design parameters of the product prototype are provided in Table 1. The blade solidity σ is calculated at the shroud diameter according to the number of blades N and the chord length c, see Figure 4.
σ = c N π D s

2.3. Mechanical Concept

In many aspects, the mechanical design is key in regard to the success of a MHP energy recovery device. The most crucial requirement addresses to the product’s robustness and lifetime to minimize the occurrence of maintenance operations. Since quite high hydraulic head values are targeted for the DuoTurbo product prototype, the axial loads are significant. An appropriate bearing arrangement with reliable sealing is therefore required, excluding the risk of water contamination by lubricants. Drinking water conform materials are required for all submerged components. Further, the system efficiency is strongly related to the constructive arrangement that is therefore subject to the product optimization process. Accordingly, different mechanical configurations have been tested during the laboratory prototype stage (see Figure 1), along with detailed power loss analyses. Based on these findings, the mechanical components of the product prototype are designed, as presented in Figure 5.
A key feature of the DuoTurbo microturbine are the wet permanent magnet rim generators. Thanks to their design, the mechanical complexity is minimal, reaching a high power density and compact dimensions. A drawback is encountered regarding the additional disc friction losses created by the submerged electrical rotors. Whereas, the cooling effect of the flow increases the power capacity of the permanent magnet generators to a great extent. In the generator gap, a thin polymer tube is placed to separate the electrical stators from the fluid. Labyrinth seals minimize volumetric losses through the generator gap. Actually, the product prototype has an outer diameter of 300 mm and a total axial length of 520 mm.

2.4. Electrical and Electronic Concepts

Due to the particular architecture of the DuoTurbo microturbine, custom permanent magnet synchronous rim generators needed to be designed [29]. The generators are engineered to achieve a maximum electrical power for the given dimensional restrictions and rotational speed values. Specifications of the generators are presented in Table 2. Because of the small axial distance between the runners, partially wounded stators are currently used for the product prototype. The windings are thereby arranged only over 2 × 90 °C of the stator’s circumference. Further, the generator topology is defined by the number of poles, the number of slots, and the number of slots per pole and per phase q. The electromagnetic design was performed and validated using FEM simulations. The simulation showed minimal torque ripple choosing q = 2, reaching an average dynamic torque of about 10 Nm at the rated point.
Power electronics are essential for a micro hydroelectric unit, since the generated electricity is mostly injected to the electrical network and the runner rotational speed may vary. For the DuoTurbo pilot, commercial frequency converters are used for the independent speed control and power regeneration of each generator. A third converter is installed on the grid side for the synchronization and injection of the electrical energy. The two four-quadrant converters on generator side can operate in drive mode for the turbine startup and in regeneration mode during normal operation. The electrical power is transmitted via direct current to the converter on the grid side. The runner speed is controlled in sensorless mode. Because the industrial converters represent an important portion of the total costs of the system, a custom electronic design may be crucial to achieve marketability of the DuoTurbo turbine.

3. Characterization Methodology

3.1. Overview of the Characterization

The product characterization in terms of performance and hydraulic properties is basically assessed by laboratory tests and numerical simulations. Potential characteristic drifts caused by long term degradation are determined by advanced endurance tests carried out at the pilot facility. A diagram of the power flow through the DuoTurbo turbine is presented in Figure 6. Thereby, three types of values are distinguished:
(a)
Experimental data resulting from standard laboratory machine testing such as the hydraulic power, the electrical power and the hydroelectric efficiency η h e l ;
(b)
Numerical data resulting from CFD simulations as part of the runner design procedure such as the energy efficiency η e ;
(c)
Power loss components estimated or measured by means of particular experimental setups during the prototype investigation phase.
Apart from the efficiency terms, the dimensionless φ ψ hydraulic characteristics according to the IEC standard [30] can also be predicted by the numerical flow simulations and be compared to experimental data. Theses hydraulic characteristics, depending only on the hydraulic head, the discharge and the runner rotational speed, are key to validate the CFD based runner design methodology.
Figure 6. Definition of measured, simulated and indirectly estimated quantities on the power flow of the DuoTurbo turbine.
Sustainability 13 10717 g006

3.2. CFD Simulations

3.2.1. Numerical Setup

To evaluate the generated hydraulic design of the product prototype, numerical flow simulations have been carried out with the commercial finite volume solver ANSYS CFX 17.0. The software is solving the incompressible steady Reynolds Averaged Navier-Stokes (RANS) equations in their conservative form and the mass conservation equation [31]. Steady state numerical simulations have been performed using the SST turbulence model [32]. The choice of the steady state flow model is justified by the fact that numerous hydraulic design iterations are carried for the development of the product prototype. Steady state simulations for design purposes of hydraulic machinery are widely applied and stated appropriate to capture mean flow features and engineering quantities [33] and are even capable to evaluate complex operating conditions such as for no-load speed determination [34]. A 2nd order spatial scheme with a specified blend factor of 1 is used. A RMS MAX convergence criterion of 10 6 is imposed, limiting the the maximum number of iterations to 700 per operating point. The equations are discretized in a full computational domain with a mesh made with the ANSYS ICEM CFD 17.0 commercial software, generating structured grids with hexahedral cells. The meshes of the four subdomains are presented in Figure 7, while specific information is provided in Table 3. The y + values, which represent the standardized thickness of the first wall layer, refer to near BEP conditions with | ω A | = | ω B | = 2250 min 1 and Q = 9 L/s. The grid resolution is chosen according to previous numerical studies of a counter-rotating microturbine presented in [15]. The automatic near wall treatment of the CFX solver accepts relatively large y + ranges up to 100 for the SST turbulence model [35]. The presented mesh qualities are therefore considered appropriate for the performed analysis.
The fluxes at the domain interfaces are computed using a General Grid Interface (GGI) algorithm and a frozen rotor formulation is used. Boundary conditions are specified in Table 4. The rotational angular speed values are imposed on the rotating domains.

3.2.2. Definitions for the Numerical Simulations Analysis

Since the leakage flow is not considered in the CFD simulations, the relation Q = Q t applies, see Figure 6. Thus the meridional flow velocity in the runner flow section is:
C m = 4 Q π ( D s 2 D h 2 )
The discharge coefficients are then defined by means of the peripheral runner velocity amplitude at the shroud diameter:
φ = C m U A , s
φ A = φ φ B = C m U B , s
The simulated specific energies of the different turbine domains correspond to Equation (1), denoting the domain’s high and low pressure reference sections as A i and A i ¯ , respectively. The position of the reference sections used for the different simulated specific energy values are defined in Table 5 and Figure 7.
Then, the different energy coefficients are computed by means of the corresponding specific energy and the peripheral runner velocity at the shroud diameter:
ψ = 2 E U A , s 2
ψ A = 2 E A U A , s 2 ψ B = 2 E B U B , s 2
The energy efficiency values are then calculated with the simulated torque T acting on the runner walls, composed of the blade, hub and shroud boundaries:
η e = T A ω A + T B ω B ρ Q E
η e , A = T A ω A ρ Q E A η e , B = T B ω B ρ Q E B
The design of experiment for the numerical simulations was established with respect to the nominal theoretical discharge coefficient and the speed ratio, as pointed out in Figure 8. To investigate potential Reynolds effects, the same set of points was simulated once close to the lower rotational speed limit and once close to the upper rotational speed limit.

3.3. Laboratory Hydraulic Performance Tests

3.3.1. Experimental Setup

To perform tests of small scale turbines, pumps and other hydraulic components, HES-SO Valais-Wallis employs a hydraulic test rig, detailed in [36]. The DuoTurbo product prototype was installed on the test rig for performance measurements of the complete operating range. The testing section with the experimental setup for the DuoTurbo characterization is shown in Figure 9. The experimental hydraulic layout with two parallel PRV’s corresponds to the one implemented at the pilot facility (compare to Figure 2 and Figure 10). This setup also enables analyzing the transient interactions between the PRV’s and the turbine. The transient measurements are not part of this publication.
Three parallel recirculating multistage centrifugal pumps with variable speed supply the test circuit with fresh water from a main reservoir. The meanwhile upgraded total pumping power of 42.5 kW delivers a maximum discharge of 130 m 3 /h and a maximum pressure of 16 bar. Using a pressurized downstream reservoir, the setting level of the testing model can be adjusted to investigate cavitation phenomena. The test rig is controlled through a customized LabView© interface, whereby either the rotational speed of the pumps, the head on the testing model or the discharge can be regulated. The measurements and the control of the test rig are managed by a wireless data communication structure.

3.3.2. Testing Methodology

The instruments used to recover the hydraulic performances of the testing model (detailed in [22]) involve briefly an electromagnetic flowmeter used to recover the discharge and a differential pressure transducer for the testing head. Further, the electrical power and the runner rotational speed values are measured with a precision electrical multimeter. The characteristics of the main measurement instruments are presented in Table 6.
A static testing methodology is applied, performing measurements at several constant testing heads between 10 m and 80 m. Sets of operating points covering the ω A ω B plane were statically measured for each head, implying rotational speeds from 750 to 3500 1/min. The experimentally determined specific energy E e x p is based on the static pressure difference between the inlet and outlet pipelines, see Equation (13) at comparable positions to the inlet and outlet boundaries of the CFD model. Since the swirl velocity at the low pressure side is undetermined and therefore not taken into account for the head calculation, a deviation between the measured and simulated specific energy values is possible. However, this deviation only becomes important for significant swirls at severe off-design conditions.
E e x p = p I p I ¯ ρ ψ e x p = 2 E e x p U A , s 2
Consequently, the measured hydroelectric efficiency η h e l is defined as:
η h e l = P e l ρ Q E e x p
Further, the experimentally extracted discharge coefficient φ e x p deviates slightly from the simulated term, since the measured discharge includes the leakage discharge Q l :
φ e x p = 4 Q U A , s 2 π ( D s 2 D h 2 ) = 4 ( Q t + Q l ) U A , s 2 π ( D s 2 D h 2 )
To estimate the volumetric losses, particular tests with sealed runner blade passages were carried out during the laboratory prototype investigations, forcing the discharge to pass trough the labyrinth seals. In this experimental configuration, the leakage discharge as function of the static pressure difference on the labyrinths could be characterized.

3.4. Pilot Endurance and Performance Tests

3.4.1. Hydraulic Scheme and Monitoring Equipment

Endurance tests are crucial to evaluate degradation and reliability of the developed system under real operating conditions. For this purpose, a DuoTurbo pilot is installed at a pressure reducing station situated in the drinking water network of Savièse, VS Switzerland. The pressure reducing station is located between two drinking water reservoirs with an available altitude difference of about 190 m to the upstream free surface. The discharge in the hydraulic network is ruled by the level of the downstream reservoir that varies as function of the water demand in the underlying distribution network. The resulting consumption driven operating mode is typical for drinking water supply systems. The hydraulic scheme of the DuoTurbo pilot, along with the main hydroelectric elements and instrumentation, is shown in Figure 10.
The hydraulic layout with two parallel PRV’s corresponds to the one tested in the laboratory framework. To recover the hydraulic variables, two flow meters (FM1 and FM2) and four pressure sensors (PS1–PS4) are used. For security reasons, a solenoid valve (EV1) is placed upstream the hydraulic machine, to fully isolate the turbine branch in case of a severe leakage flow. Thus, a water detector (LD1) needed to be installed to initiate the closure of the solenoid valve. Leakage may occur due to a rupture of the polymer tube in the generator gap or due to advanced wear of the mechanical seals. The mechanical behavior is supervised by a vibration sensor, placed on the housing of the turbine. Electrical parameters are recovered from the variable frequency drives and an electricity meter at the grid connection of the pressure reducing station. A list with specifications of the principal hydro-mechanical sensors is provided in Table 7. An illustration of the DuoTurbo pilot is provided in Figure 11. The installation is controlled and supervised by remote via a GSM antenna.

3.4.2. Pilot Measurement Definitions

The total specific energy E t o t theoretically available for electricity generation is defined by the static pressure difference between the inlet and outlet hydraulic junctions of the pressure reducing station and is, inter alia, governed by the setting levels of the PRVs. Neglecting the specific energy losses of the elbows, T-junctions and manual valves, the total specific energy is actually approximated as follows (compare to Figure 10):
E t o t E P R V 1 = p P S 3 p P S 4 ρ
Neglecting the residual outlet swirl of the hydraulic machine, according to the laboratory testing methodology, the specific energy extracted by the turbine E t u r b is calculated as follows:
E t u r b = p P S 1 p P S 2 ρ
The residual head on PRV2 that is significant during part load conditions, is inevitably dissipated. Again, assuming negligible head losses in the piping and valves, the head on PRV2 is approximated as:
E P R V 2 p P S 2 p P S 4 ρ
Finally, the following obvious equilibrium applies for any operating point:
E t o t E t u r b + E P R V 2
The accumulated hydraulic energy released from the hydraulic circuit by the microturbine is specified as:
W h = ρ t 0 t 1 E t u r b ( t ) Q t u r b ( t ) d t
The accumulated energy recovered by the electrical generators is:
W e l = t 0 t 1 P e l ( t ) d t
Considering the auto-consumption of all electronic components like drives, controllers, sensors and solenoid valves yields the net electrical energy W e l , n e t injected to the grid.

4. Results

4.1. CFD Simulation Results

A graphical representation of computed instantaneous relative velocity streamlines at nominal operating conditions is given in Figure 12. The color scale W * indicates the ratio between the local relative flow velocity amplitude W and the average meridional flow velocity C m I at the circular high pressure reference section of the computational domain. Detailed results of the shown nominal operating point, as well as the maximum power point of the product prototype, are provided in Table 8. For both cases, the speed ratio is 1. One may notice that relatively low specific speed values (see Equation (22)) of about 16 are targeted to match the pilot drinking water facility’s characteristics. From [37] one may deduce typical specific speeds of 135–320 for axial flow turbines, 50–150 for semi-axial flow turbines and 10–50 for radial flow turbines. Since the DuoTurbo turbine remains a purely axial flow machine, the low specific speed values seem rather unfavorable for the turbine’s performance. Nevertheless, very acceptable energy efficiencies above 80% could be found by the CFD simulations. This result may indicate that double rotor axial designs have increased capabilities of handling low specific speed conditions compared to single rotor axial designs. Thus, it can be stated that the design range of a DuoTurbo turbine is considerable.
n q = n [ 1 / m i n ] ( Q [ m 3 / s ] ) 0.5 ( H [ m ] ) 0.75
The simulated energy efficiency and energy coefficient of runner A as function of its discharge coefficient are provided in Figure 13a. The three colors represent different values of the speed ratio α and the two symbols indicate the low and high rotational speed regimes close to the lower and upper speed limits of the generators. Since the inlet flow remains always axial for the front runner, the efficiency and energy coefficient curves remain similar for variable speed ratios. Nevertheless, a slight effect of α on the first runner’s efficiency close to BEP conditions is observed, thus, an impact of the rear runner’s inlet flow condition on the front runner’s outlet flow condition can be anticipated. This influence is observed only when the speed ratio is decreased (red curve where α = 0.5), causing a decrease of about 2% of the energy efficiency around BEP conditions. In the high velocity regime with increased Reynolds numbers, the energy efficiency of the front runner is increased by about 2% compared to the low velocity regime, regardless the speed ratio.
In Figure 13b, the simulated energy efficiency and hydraulic characteristics of runner B are presented. One can observe a strong effect of the speed ratio on the rear runner’s energy efficiency and energy coefficient. Indeed, the second runner’s inlet flow is strongly coupled to the first runner’s rotational speed. Consequently, clearly distinct characteristics curves are observed for each speed ratio. The maximum simulated energy efficiency of the second runner is about 10% higher compared to the first runner. Moreover, increasing the speed ratio tends to decrease the second runner’s peak efficiency. It can further be observed that the efficiency curves decay more rapidly out of BEP conditions compared to the first runner’s results, whereas the variation of the speed ratio counteracts the efficiency decrease importantly.
In Figure 13c, the numerical results referring to the two runner’s entity are presented. It can be observed that the variation of the speed ratio prevents a significant drop of efficiency for changing flow conditions. Thus, the variation of α significantly increases the operating range and the flexibility of the turbine. The envelope formed by the three efficiency curves resembles to the one of the rear runner presented in Figure 13a. Thereby it must be noticed that the kinetic energy at the outlet of the front runner would not be recovered without the rear runner. It would therefore be misleading to conclude that comparable performances can be achieved with a single vaneless runner regarding the extraction of hydraulic energy. The current hydraulic design shows only a slight change of the hydraulic characteristic curves as function of the speed ratio that indicates, in some way, the limitations of a fixed geometry design in terms of flexibility. For example, the φ ψ representation of a Francis turbine with adjustable guide vanes would typically show distinct characteristics curves for each opening value, comparable to Figure 13b (right).
Finally, in Figure 13d, the results obtained from the total numerical domain between the inlet and outlet reference sections are presented. In contrast to Figure 13c, the two stator domains are included, each one featured with 4 axially aligned stay vanes to support the turbine hub. Obviously, the outlet stator is expected to interact with the flow when a residual swirl is exiting the rear runner. Indeed, the axial realignment of the flow by the outlet stator slightly modifies the energy coefficient curves at high discharge coefficients. The three curves are almost perfectly matching regardless the speed ratio. Additionally, a slight decrease of efficiency occurs due to the additional head losses in the stator domains. For all numerical results, a slight Reynolds effect is observable, leading to an increase of the energy efficiencies in the order of 2–3% at the high rotational speed regime, thus, at the high power regime.

4.2. Laboratory Test Results

According to the testing strategy, operating points covering the ω A ω B plane are captured for each constant testing head. Correspondingly, for each measured plane, the electrical power and the discharge are interpolated. Using these interpolation surfaces, the maximum electrical power as function of the discharge can be deduced for each head value. The resulting curves are then used to construct a global hill chart of maximum electrical power, provided in Figure 14. The corresponding efficiency values on the maximum power hill chart are provided in Figure 15. Operating limits are imposed by the admissible rotational speed and generator torque. It can be expected that the low specific speed of the current hydraulic design (see Table 8) is causing the rather narrowly shaped operating band. On both hill charts, the Maximum Power Line (MPL) is indicated that represents the most beneficial operating conditions in terms of energy output. The MPL is used for the programming of the rotational speed control algorithm implemented at the pilot facility. The speed ratio varies from 0.4 to 1.6 inside the presented hill charts. The maximum specific energy for long term operation is actually limited to 750 J/kg to reduce the risk of premature wear of the runner bearings. A hydroelectric peak efficiency of 59% is detected that lets anticipate non-negligible amounts labyrinth leakage, disc friction and mechanical power losses.

4.3. Comparison between Laboratory Tests and Numerical Simulations

To validate the CFD based hydraulic design methodology, a comparison between the numerical and experimental hydraulic characteristics is performed. In contrast, a comparison regarding the energy efficiency remains challenging, since a direct measurement of the transmitted mechanical power (see variable P t defined in Figure 6) is not possible with the actual mechanical configuration. Keeping in mind that additional optimization steps may be justified for a final commercialization, the main objective of the product prototype development concentrates on the proof of advanced readiness levels of the technology. A detailed analysis of the various power losses is therefor not part of the present paper. The comparison between the simulated and measured correlations between the energy coefficient and the discharge coefficient for different ranges of the speed ratio are presented in Figure 16. The absolute errors are calculated according to Equation (23) with respect to the maximum energy coefficient ψ e x p = 50.6 contained in the analyzed data set.
ϵ a b s = ψ s i m ψ e x p m a x ( ψ e x p )
It should be mentioned that discrepancies in the compared data occur due to the distinctions between the measured and simulated energy and discharge coefficients. If the volumetric losses would be captured in the laboratory tests, the experimental characteristic curves would shift towards the left, resulting in a positive offset of the energy coefficients. Actually all presented energy coefficients are already greater than the simulated ones, thus the integration of the volumetric losses would further increase the discrepancies. On the contrary, the experimental energy coefficient is overestimated if an outlet swirl is present, which would lead to a better agreement of the compared values. Moreover, the machining tolerance of the runners as well as surface roughness effects are additional sources of deviations. The maximum absolute error in the presented data sets is about 8.1% for the maximum measured energy coefficient value. The error tends to increase with increasing discharge coefficients that could be related to the limited capability of the steady state flow model far from BEP conditions. Around the BEP conditions, the observed errors indicate a quite fair agreement between simulation and laboratory tests, that lets conclude that the hydraulic design procedure is reasonably reliable.

4.4. Pilot Monitoring Results

The following monitoring results were registered between 15 May 2019 and 20 May 2020. During this period of 52 weeks, the DuoTurbo pilot was almost permanently in operation, without requiring any significant human interventions. The reliability and functionality of the system under real conditions is therefore demonstrated in operational environment at pre-commercial state that can be attributed to a technology readiness level of 7 [38]. At steady flow conditions, the rotational speed of the turbine runners is controlled through a Maximum Power Point Tracking (MPPT) method [19] to constantly maximize the generated power. In case of transient flow, a sensorless control loop brings the machine rapidly back on the MPL illustrated in Figure 14 and Figure 15. This approach is comparable to the idea of modified affinity laws in hydraulic machines towards the Best Efficiency Line (BEL) proposed by [39], whereas the BEL and MPL may not coincide depending on the hydraulic scheme. Indeed, if head reserves are available for a given flow (if a PRV is operating downstream the turbine), the operating point may be adapted to increase the head recovered by the turbine. This may lead to an increased power output, not necessarily respecting the BEL.
The evolution of the specific energies of the turbine, PRV2 and the complete pressure reducing station as function of the total discharge, along with the relative cumulative discharge frequency, is pointed out in Figure 17. A time frame of 4 weeks is used for the head statistics, whereas the discharge data of the whole year is respected to derive the frequency of the flow rates. The variability of the data within intervals of 1 L/s is used for the evaluation of the sample standard deviation s. Exceeding a threshold of 5.5 L/s, the turbine start-up is initiated and the turbine branch is opened, see point (a). Falling below 5 L/s, the turbine branch is closed and the turbine is put to standby mode. At point (b), that corresponds to the maximum admissible discharge of the machine, the turbine head and the total net head tend to cross. In this situation the turbine branch PRV is no longer able to maintain the adjusted pressure level at the outlet of the station. Therefore, the bypass PRV will gradually open if the discharge increases further. It can be observed that the residual head loss of PRV2 reduces the potential output power of the turbine in the discharge range above point (b). From Figure 17 one can further deduce that about 10% of the flow rates are below point (a) which do not contribute to the energy production. About 83% of the flow rates are situated between point (a) and point (b) and about 7% of the flow rates exceed the maximum discharge capacity of the machine at point (b).
The maximum and average vibration velocity amplitudes v ^ v for weekly measurement periods as function of the elapsed operating time t o p are presented in Figure 18 (left). The intensity of vibration is directly related to the rotational speed, as shown in Figure 18 (right). An eigenmode of the structure is excited around n a = 2000 min 1 . The alarm threshold for the temporary vibration amplitude is fixed at 2 mm/s. After about 3400 h of operation, a decrease of the vibration intensity can be observed. This is due to the decrease of discharge during the winter period resulting in a shift of the rotational speed range.
In contrast to the laboratory tests, the monitored hydroelectric efficiency seems to decrease towards the maximum power levels, as pointed out in Figure 19 (right). This is probably due to a misjudgment of the turbine discharge close to the opening point of the bypass, since the bypass flow meter is not reliable for small discharge values. In Figure 19 (left), the trend of the weekly hydroelectric efficiency statistics inside the hydraulic power range between 7 kW and 8 kW is shown. Mean values fluctuate within a range of about 7%, whereas, no systematic drift can be observed. It is therefore assumed that no important degradation of the runner blades or labyrinth seals has developed so far.
The evolution of the different accumulated energies of the DuoTurbo pilot are presented in Figure 20. The meteorological seasons are indicated by colors. The drop of discharge at the end of autumn is significant and consequently the production rate is quite low during winter. About 13 MWh of injected electrical energy are counted during the pilot’s first year of operation. The registered hydraulic energy exploited by the turbine corresponds to 27 MWh. The average injected electrical power is 1.88 kW with an average overall system efficiency of 48% (water to wire).

5. Conclusions

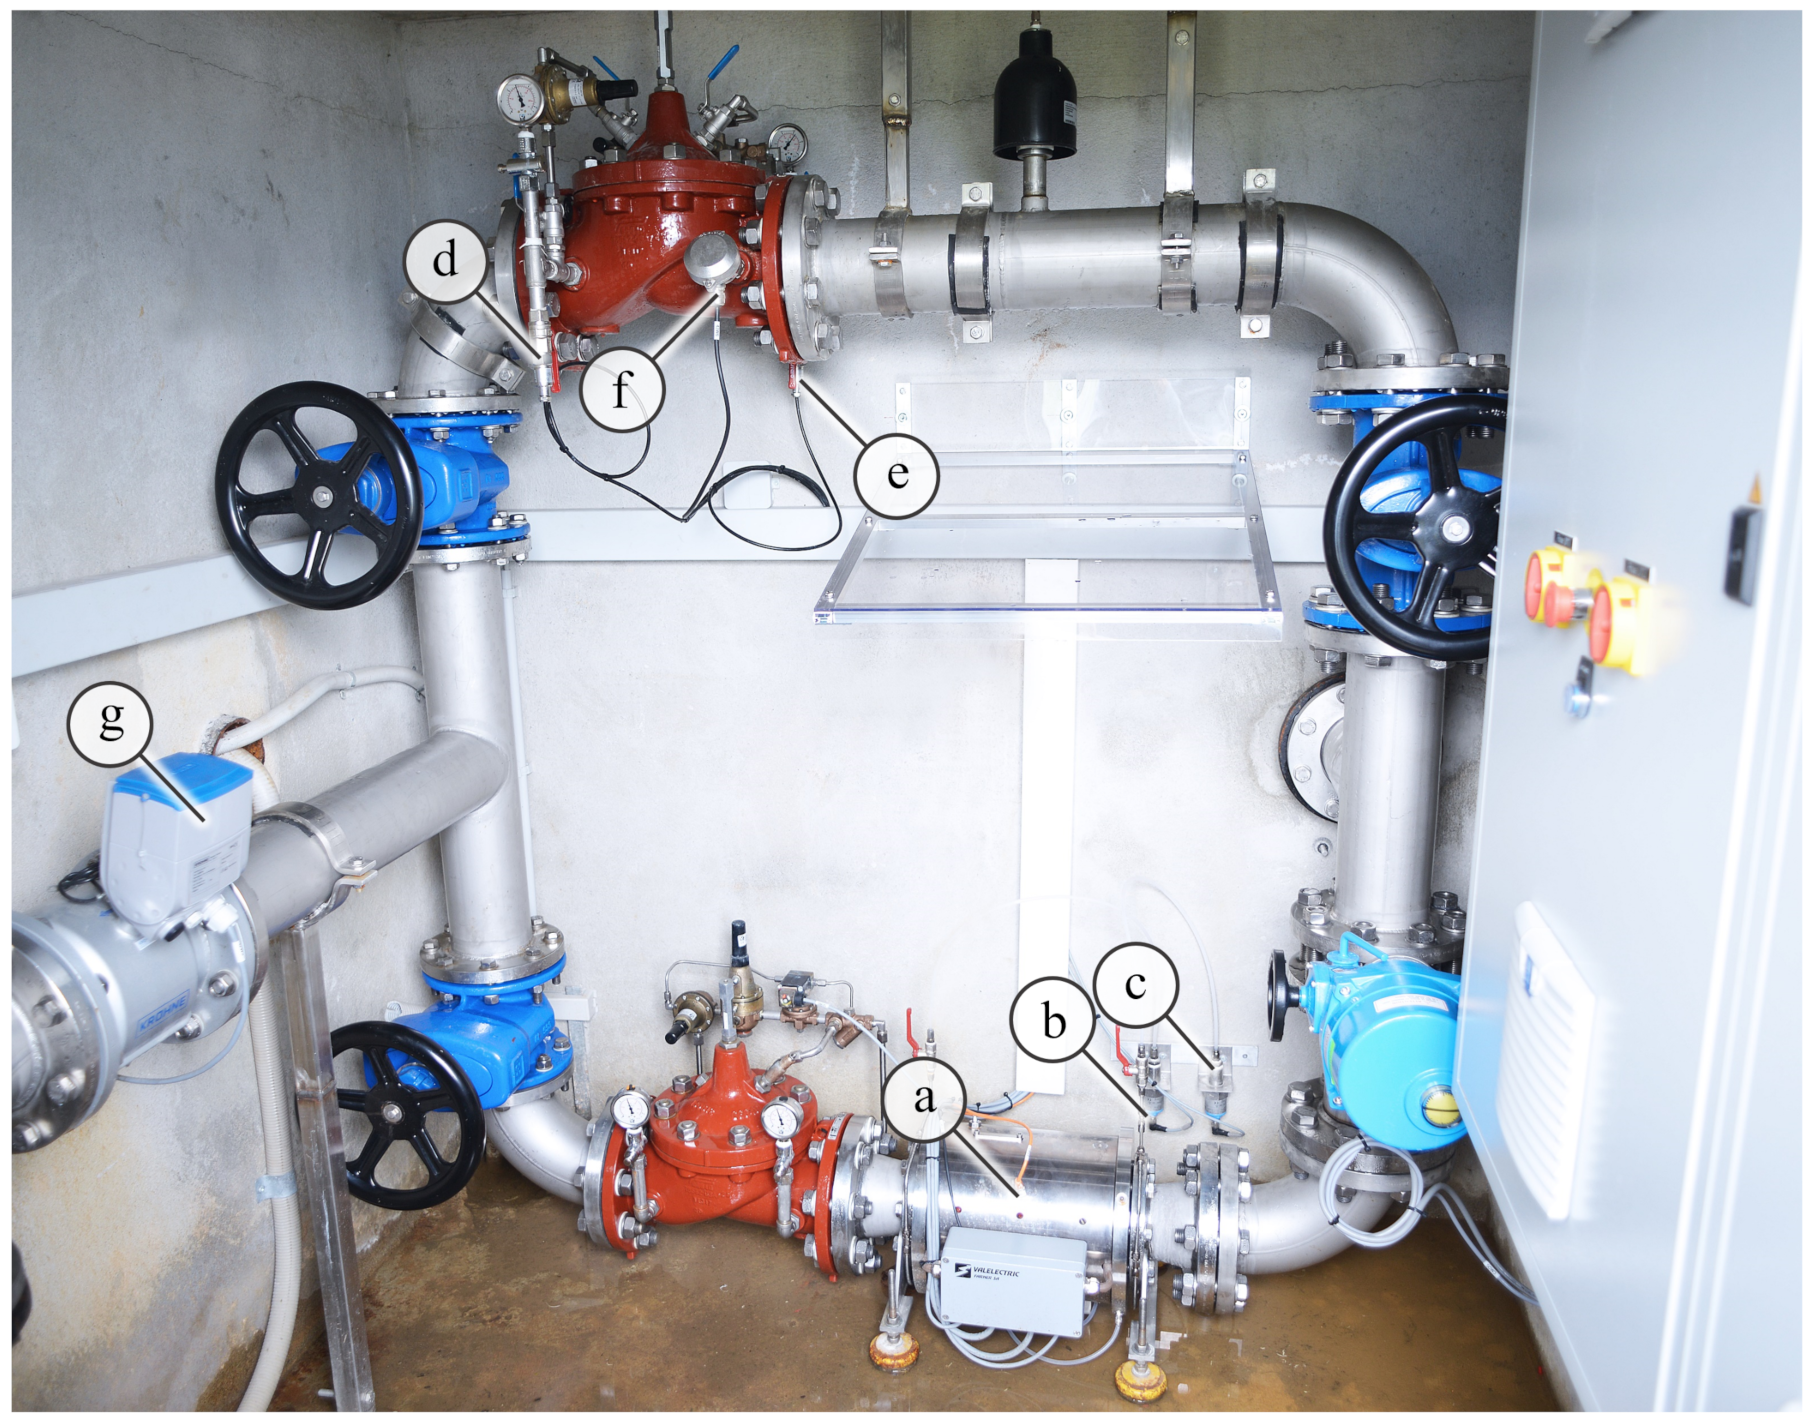
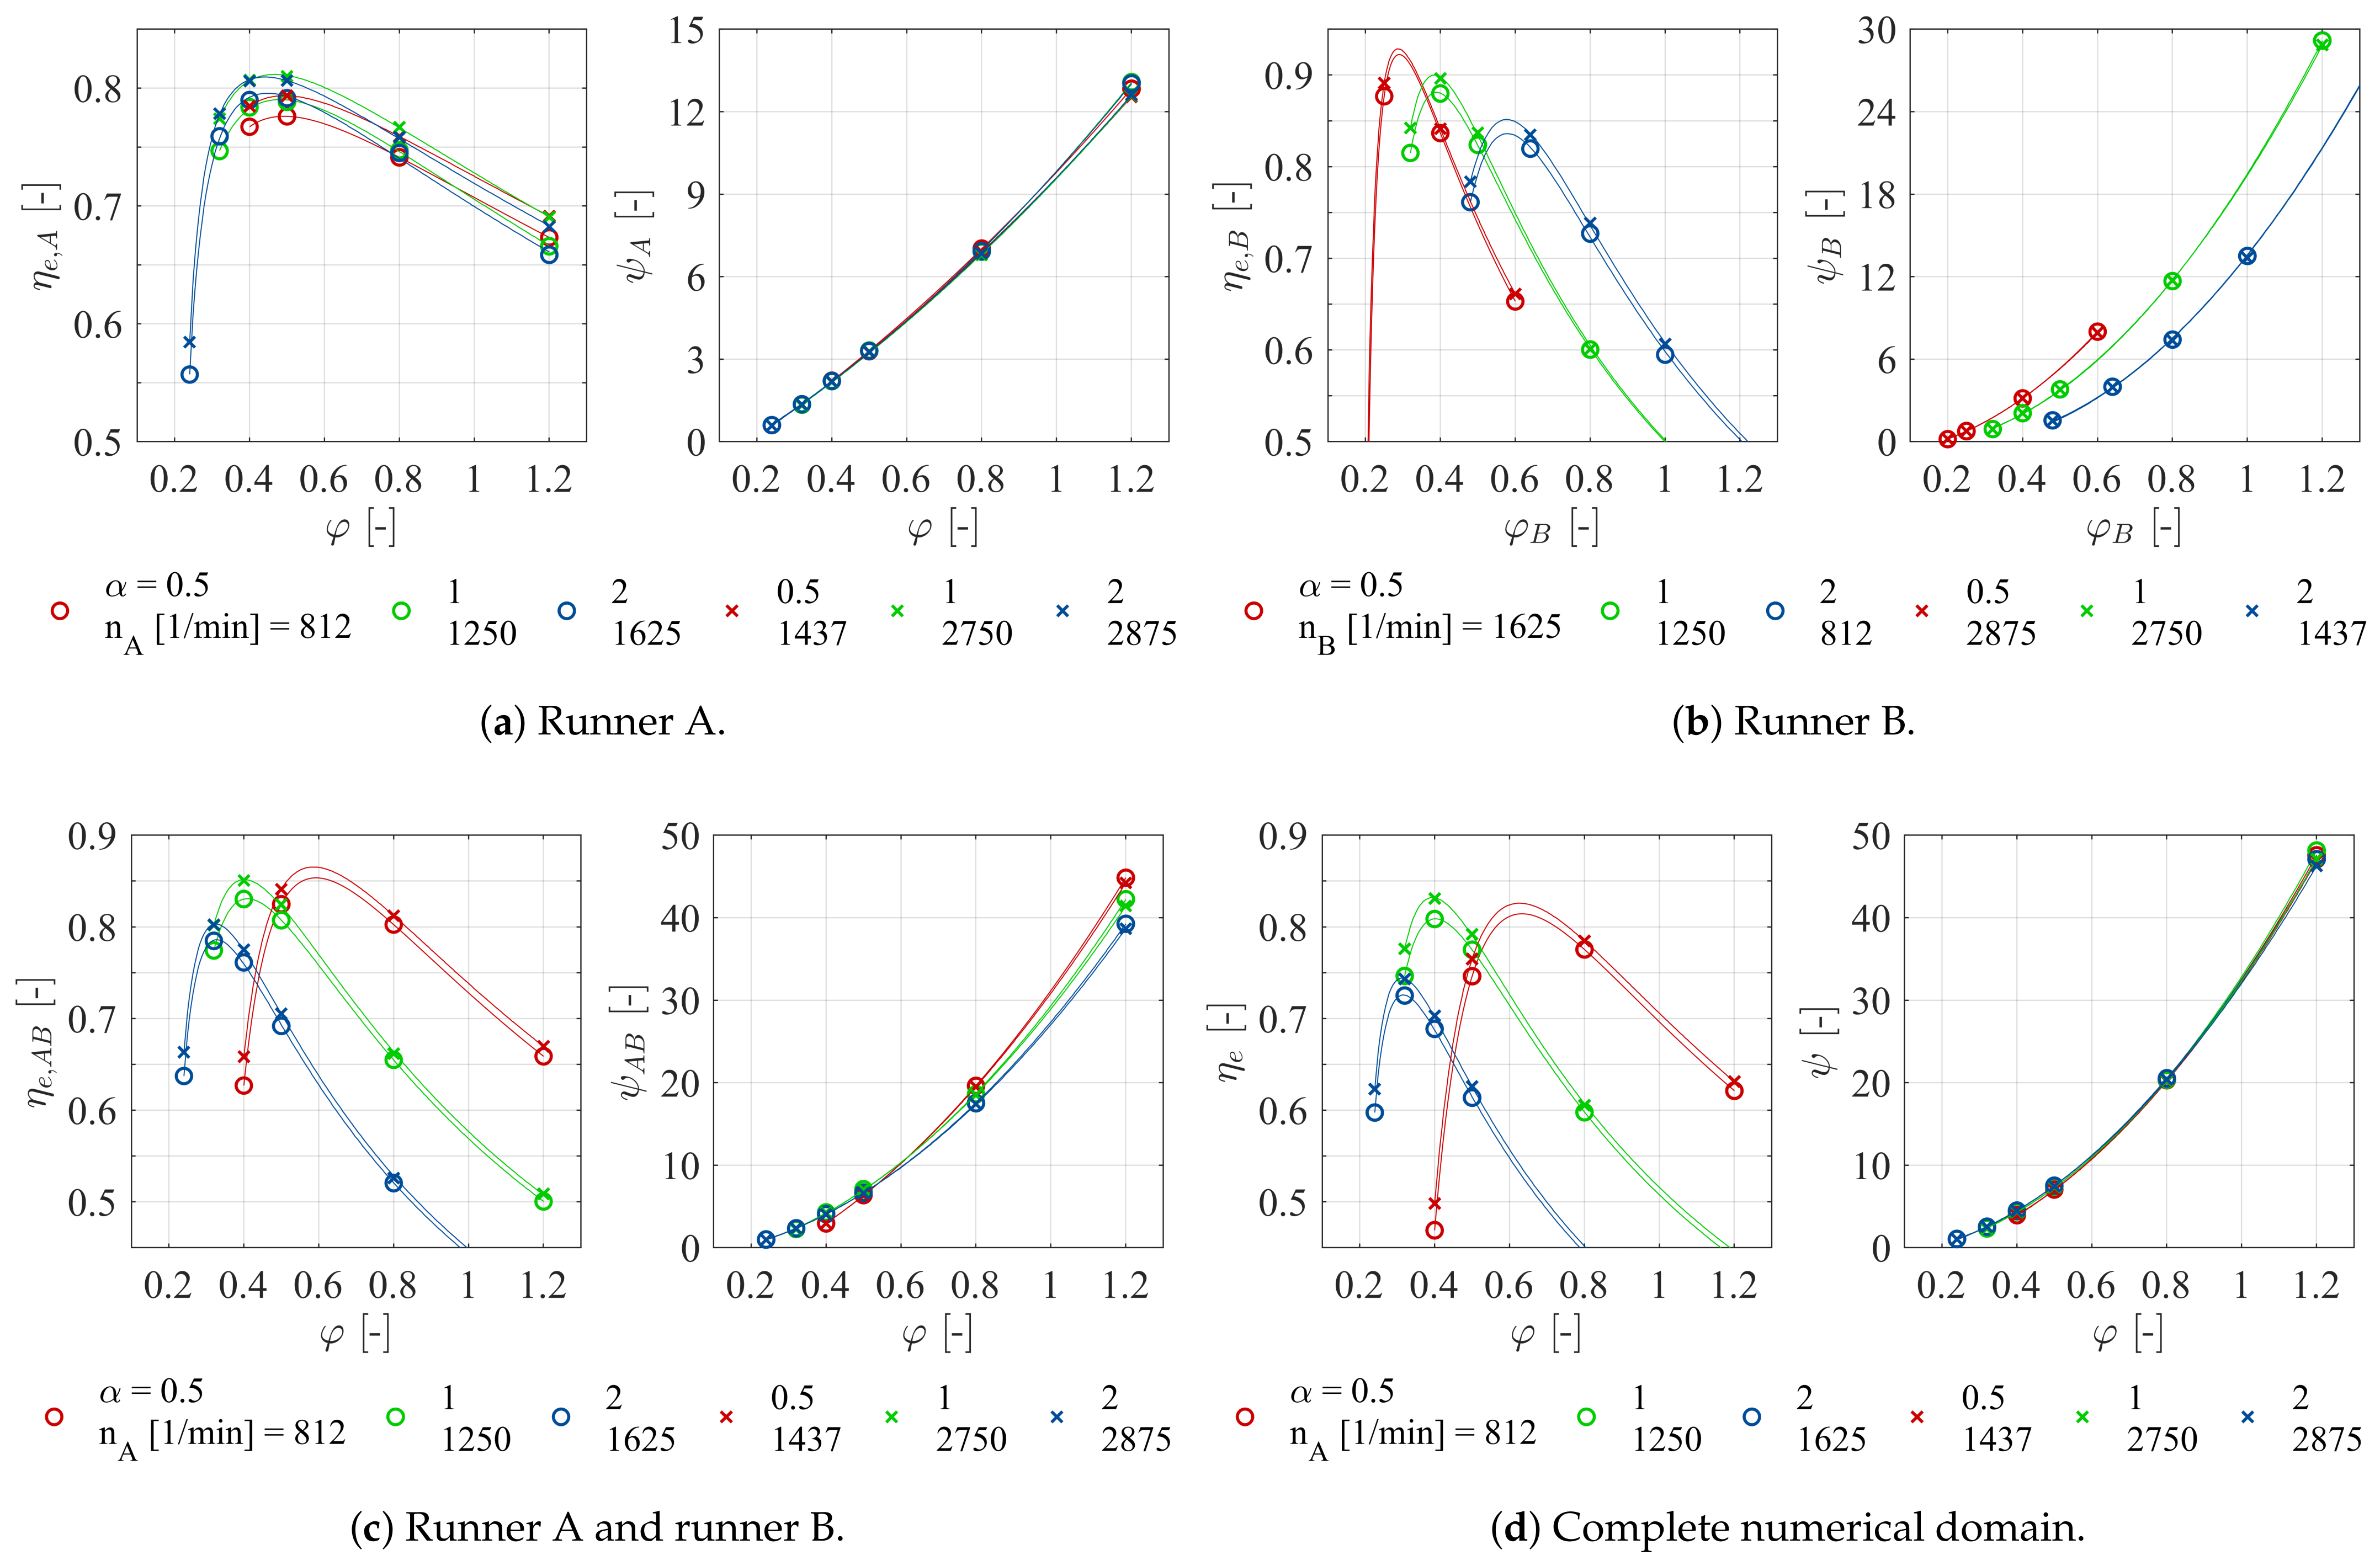
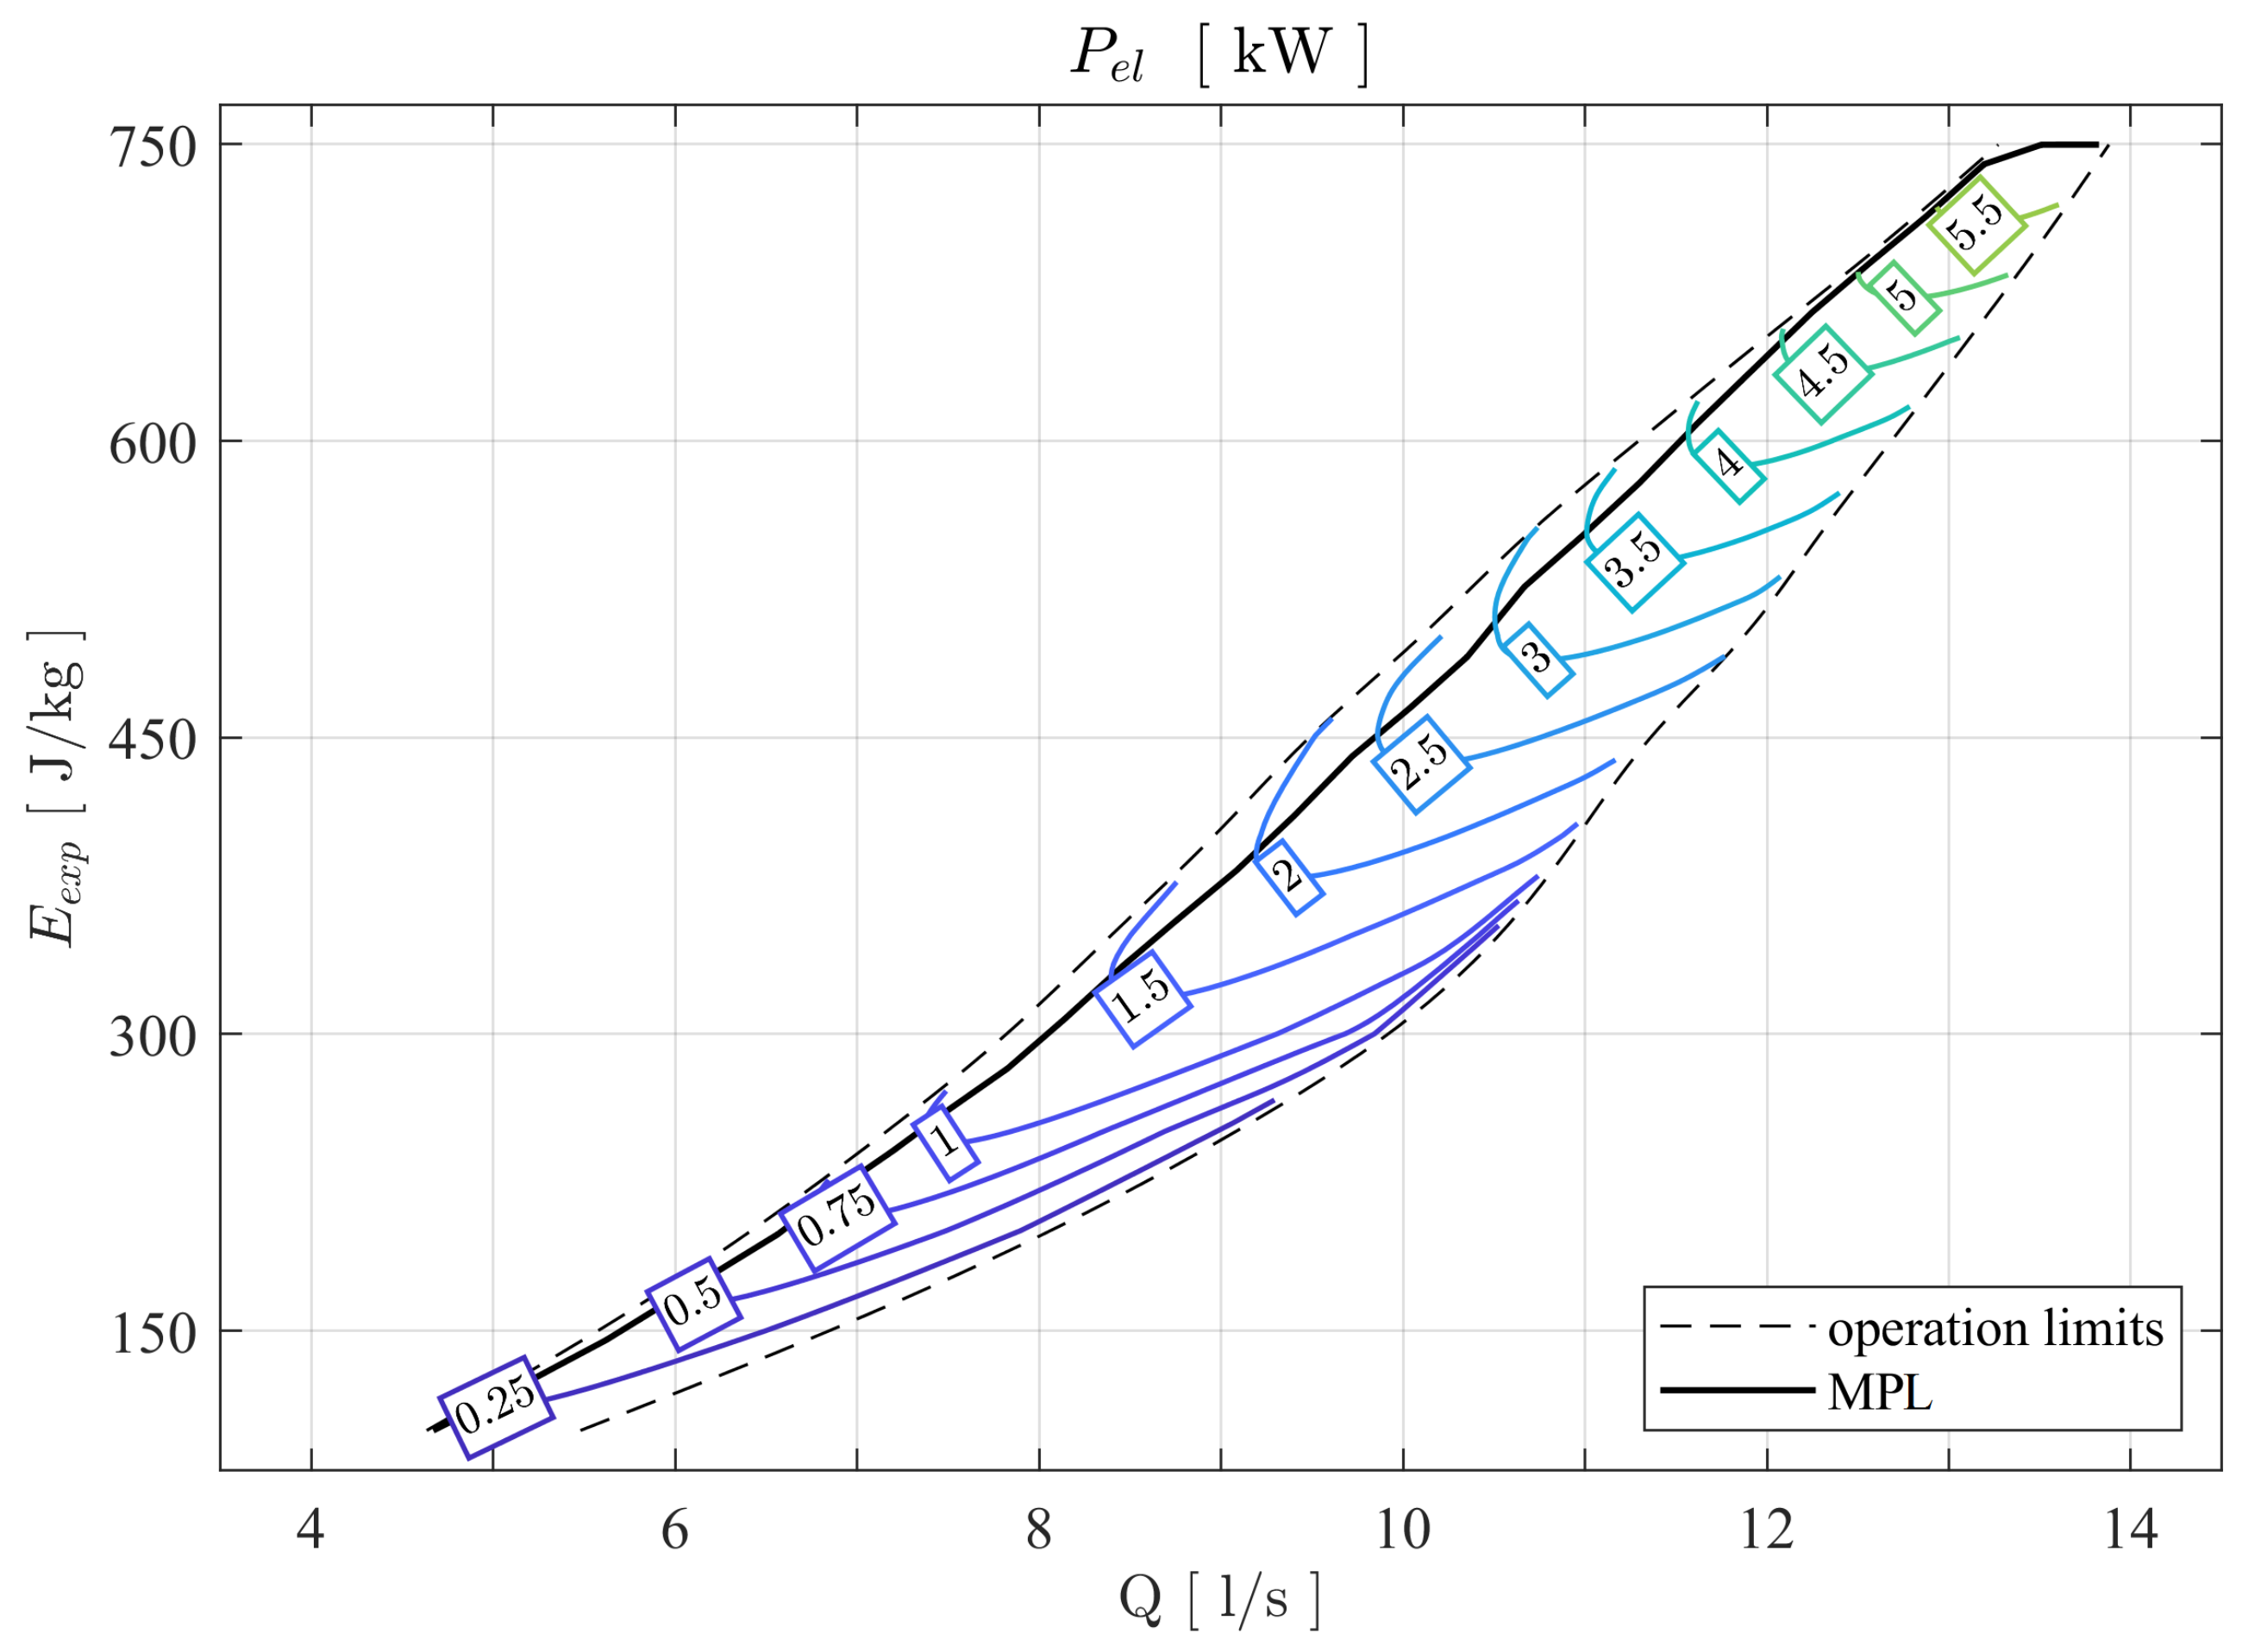
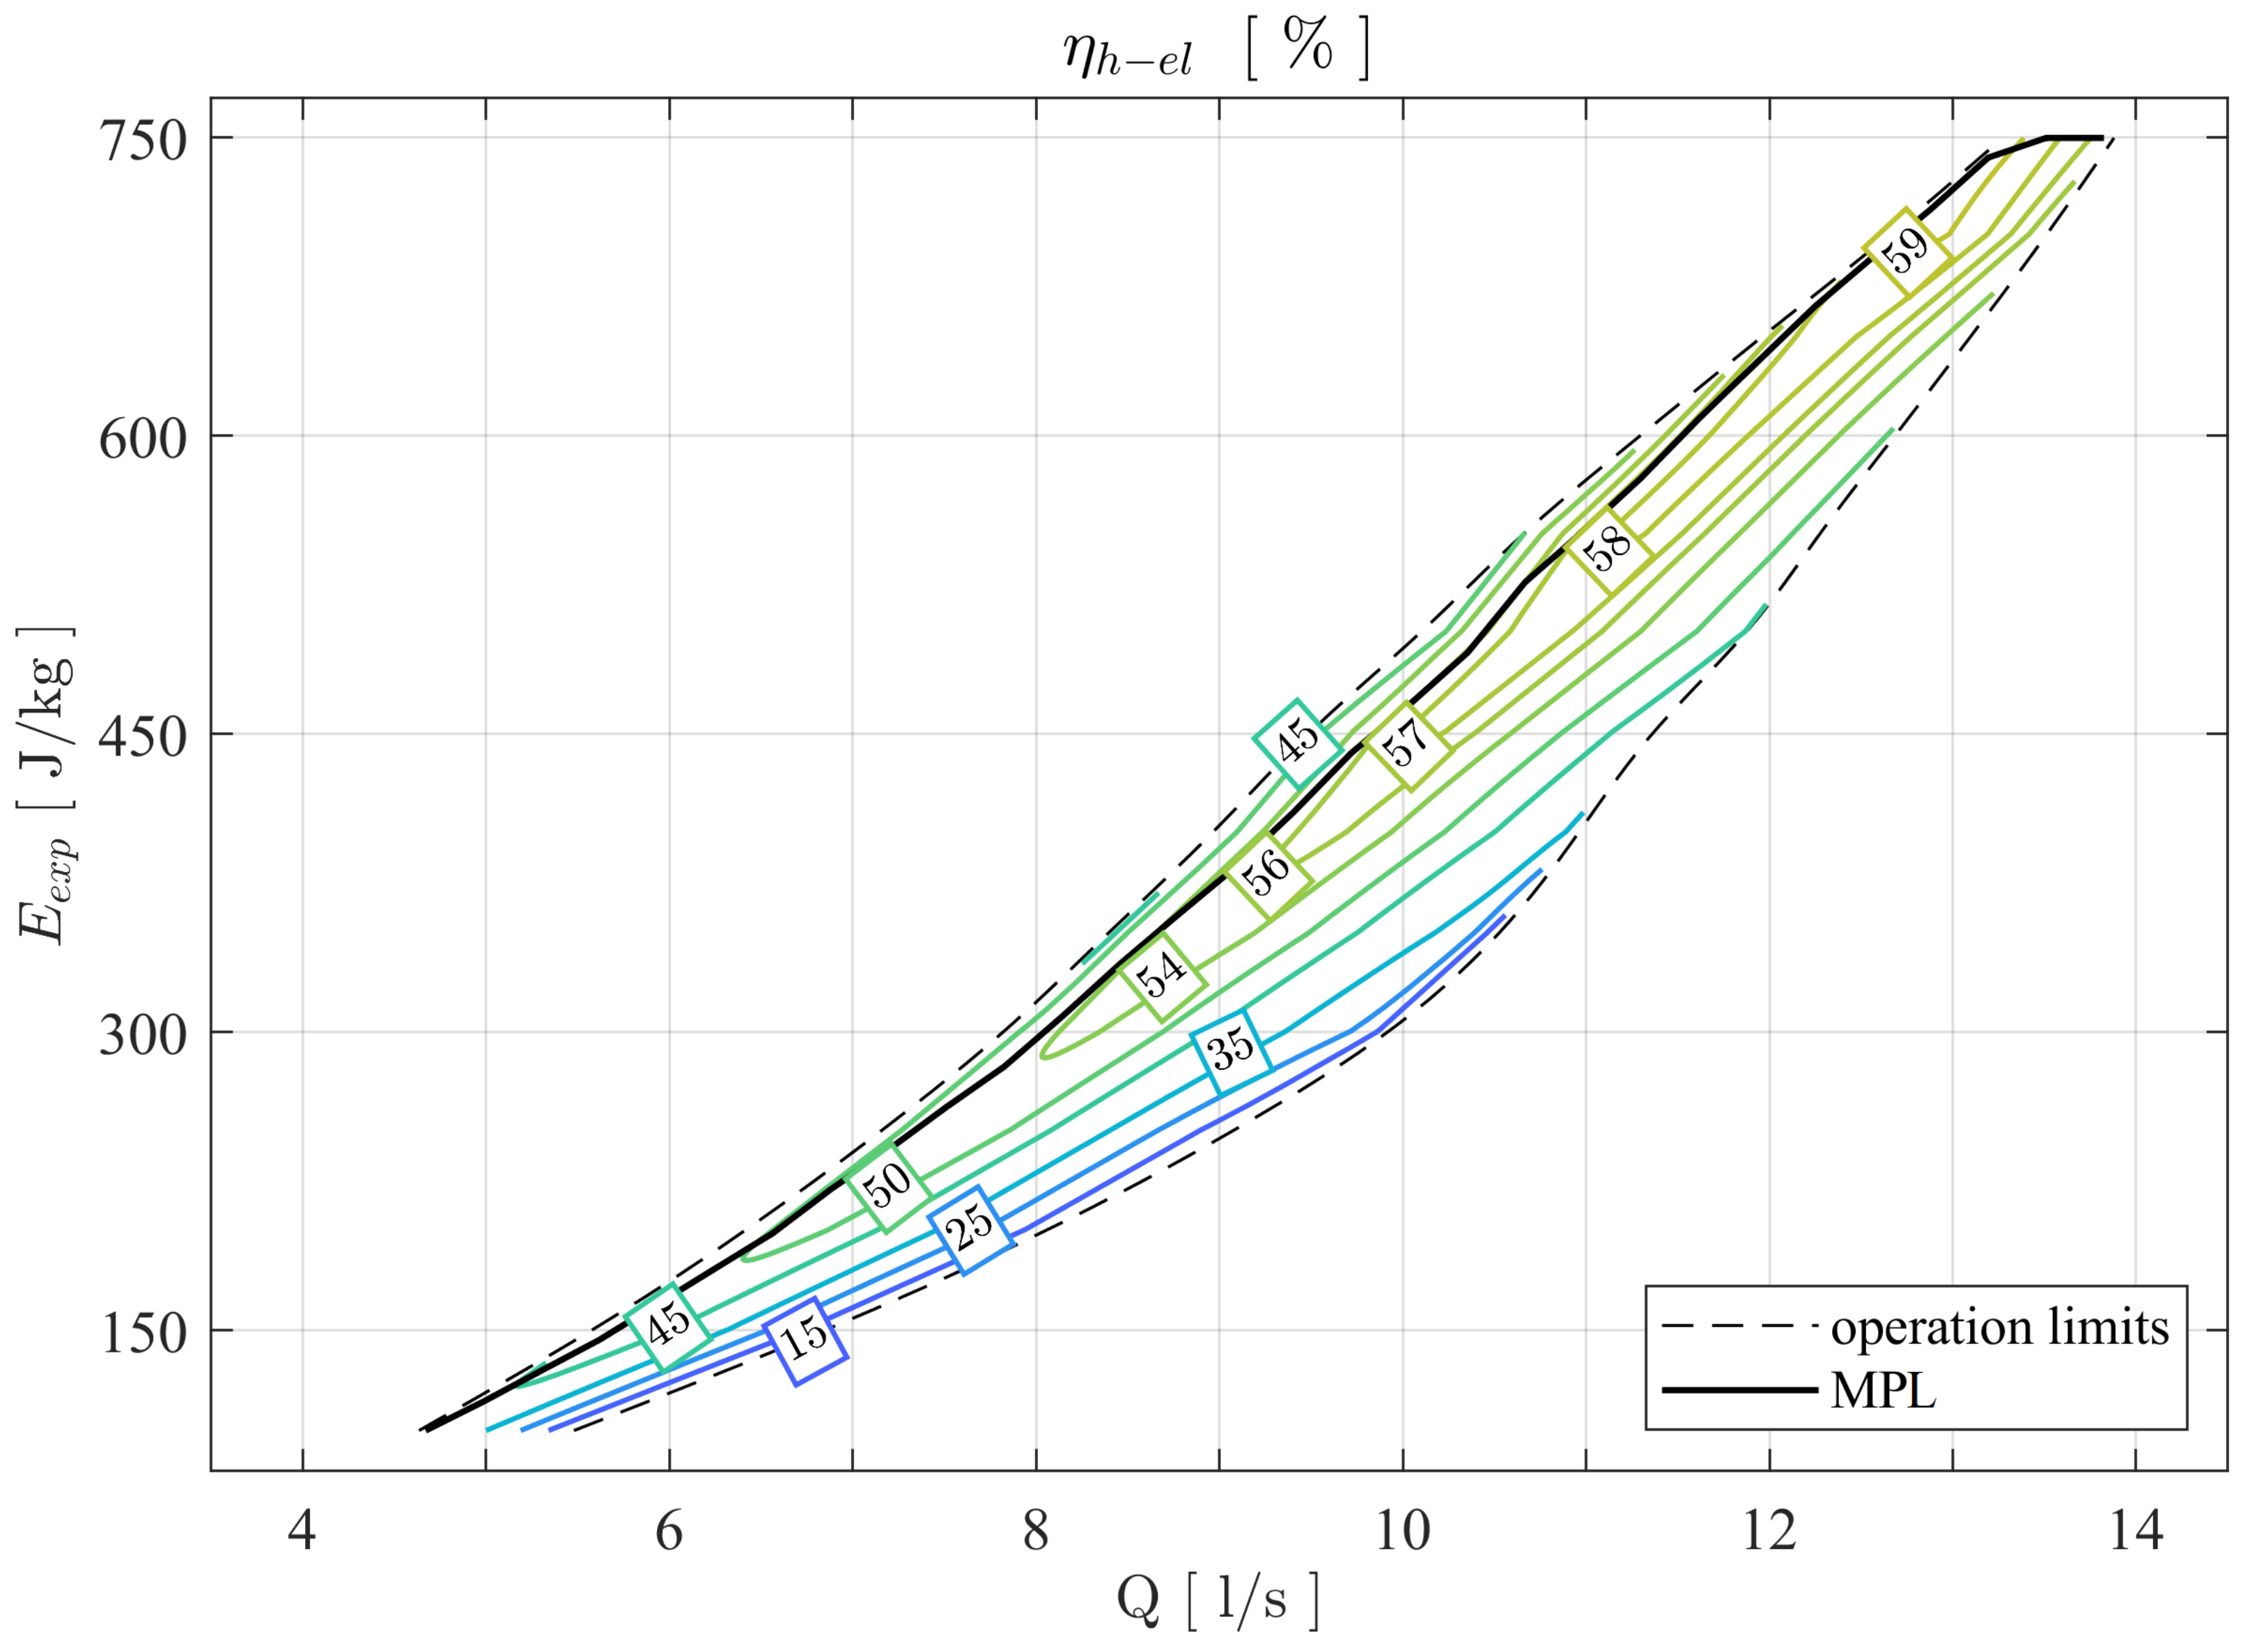
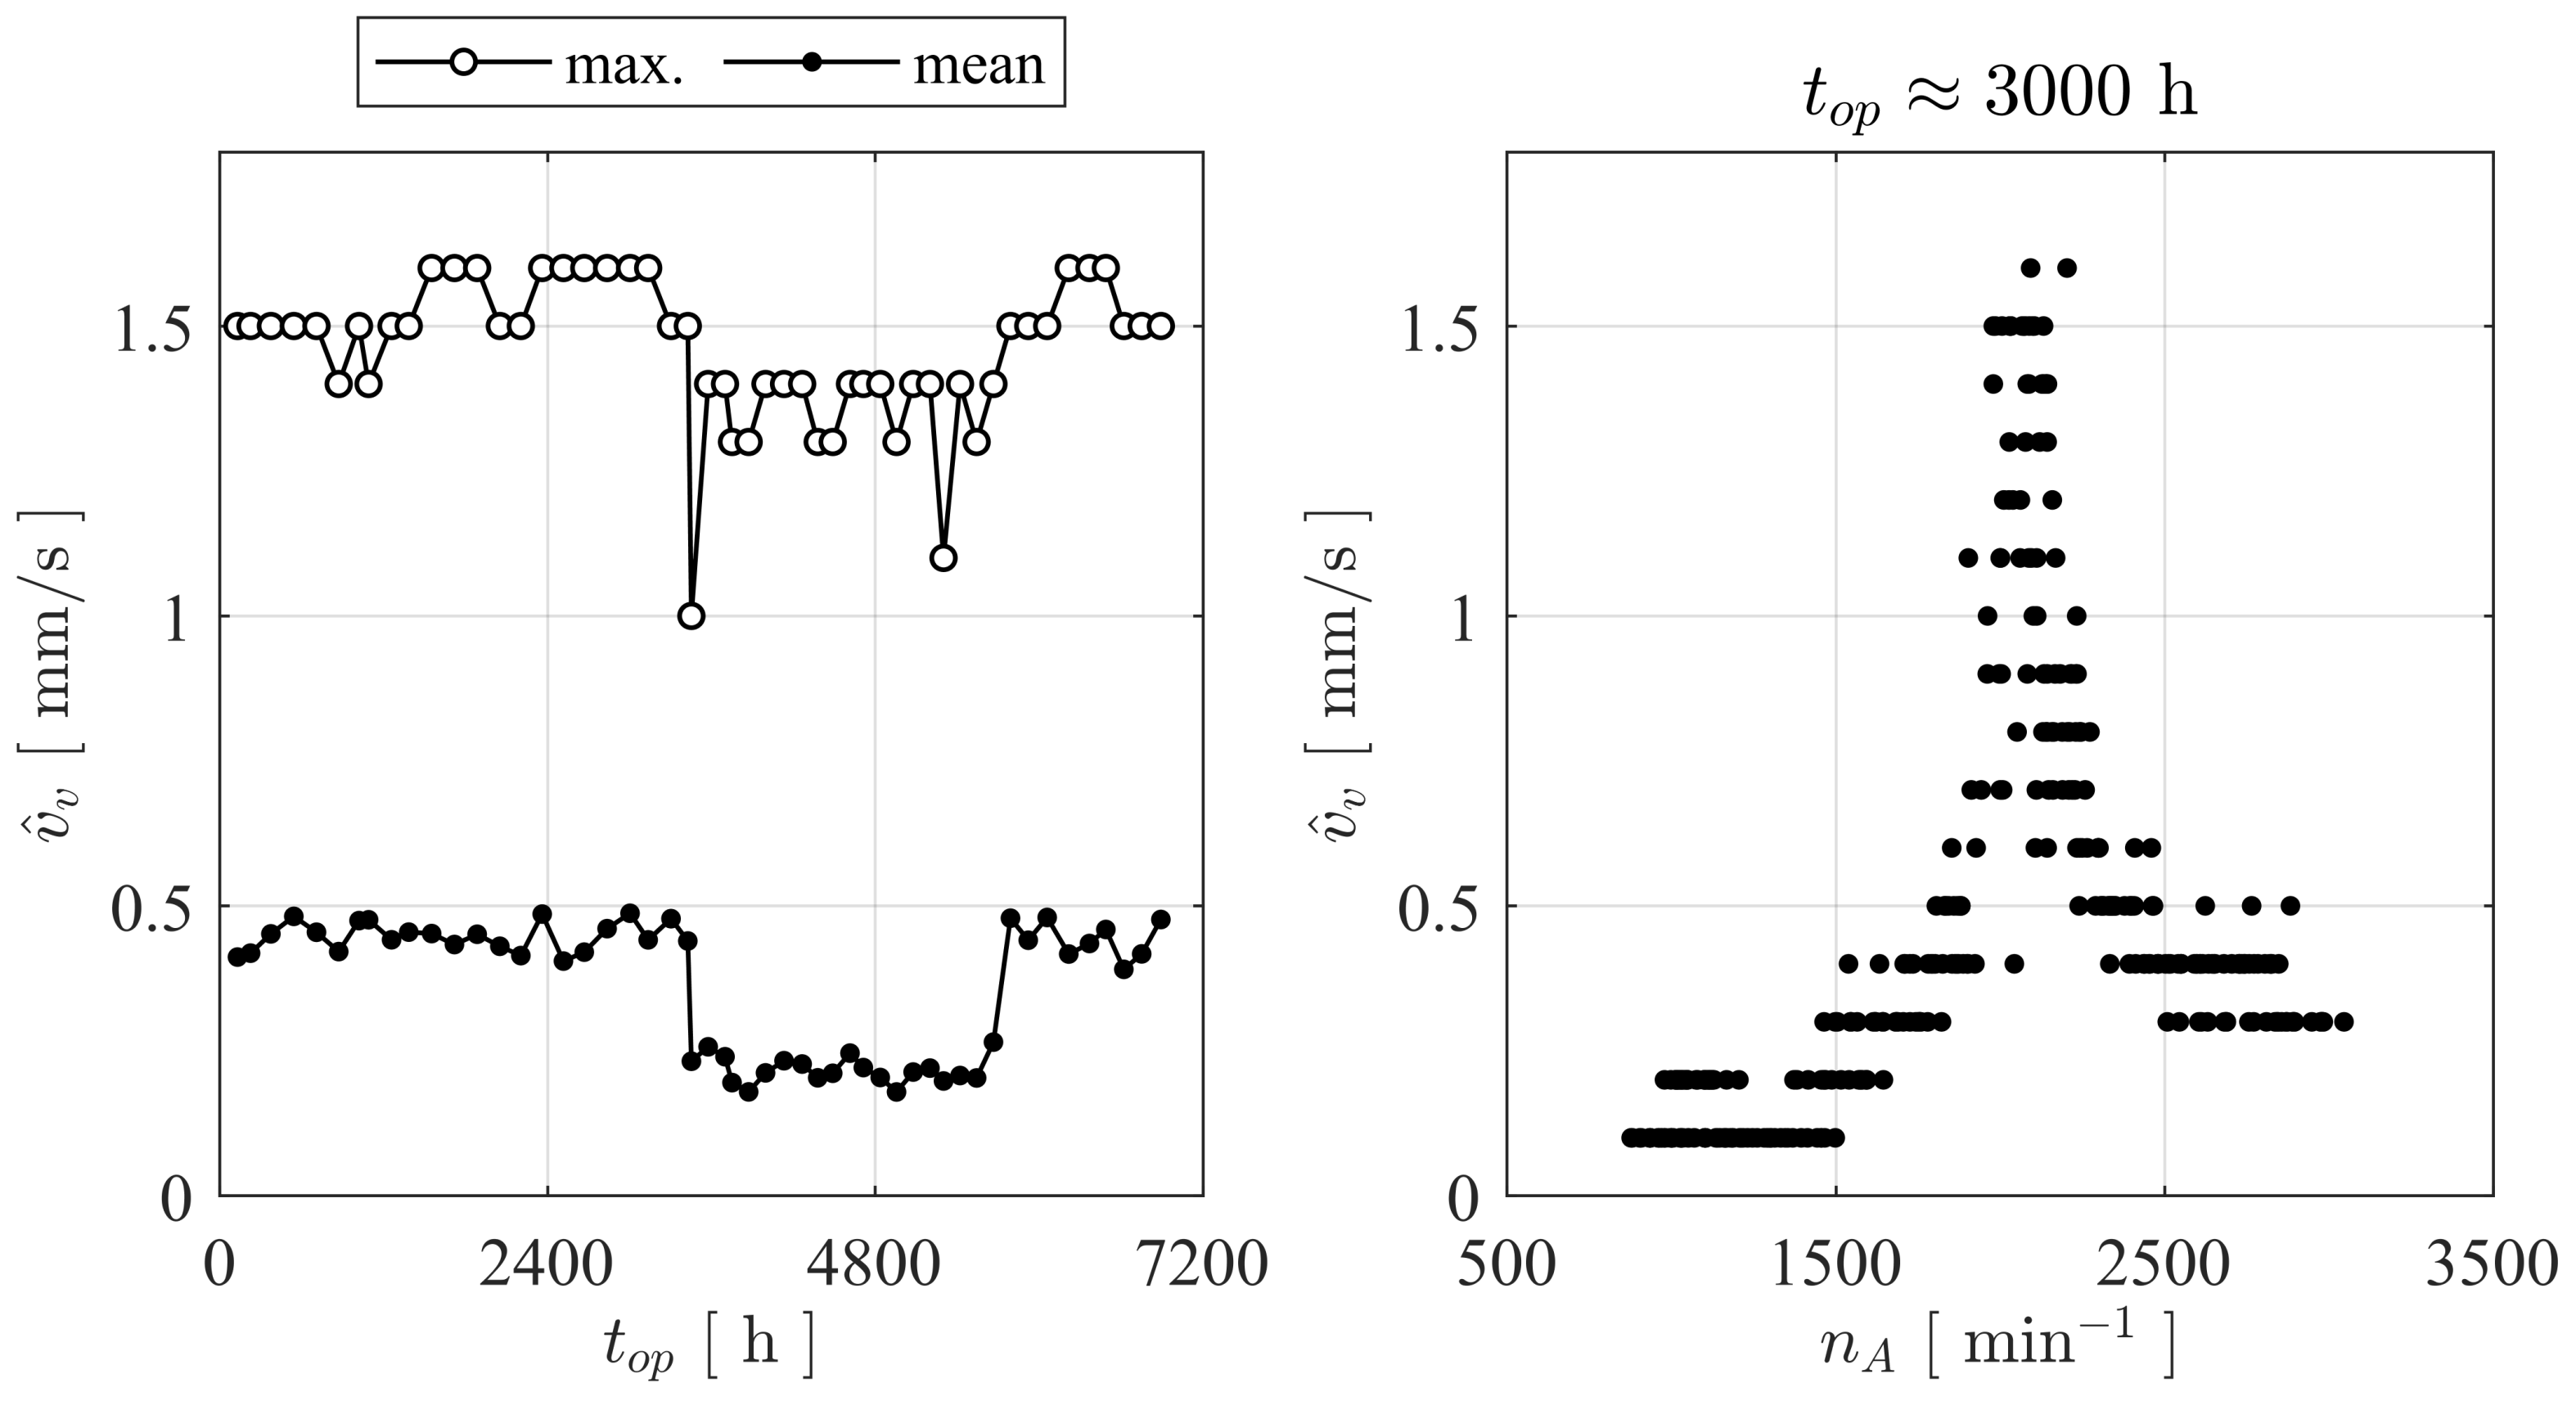
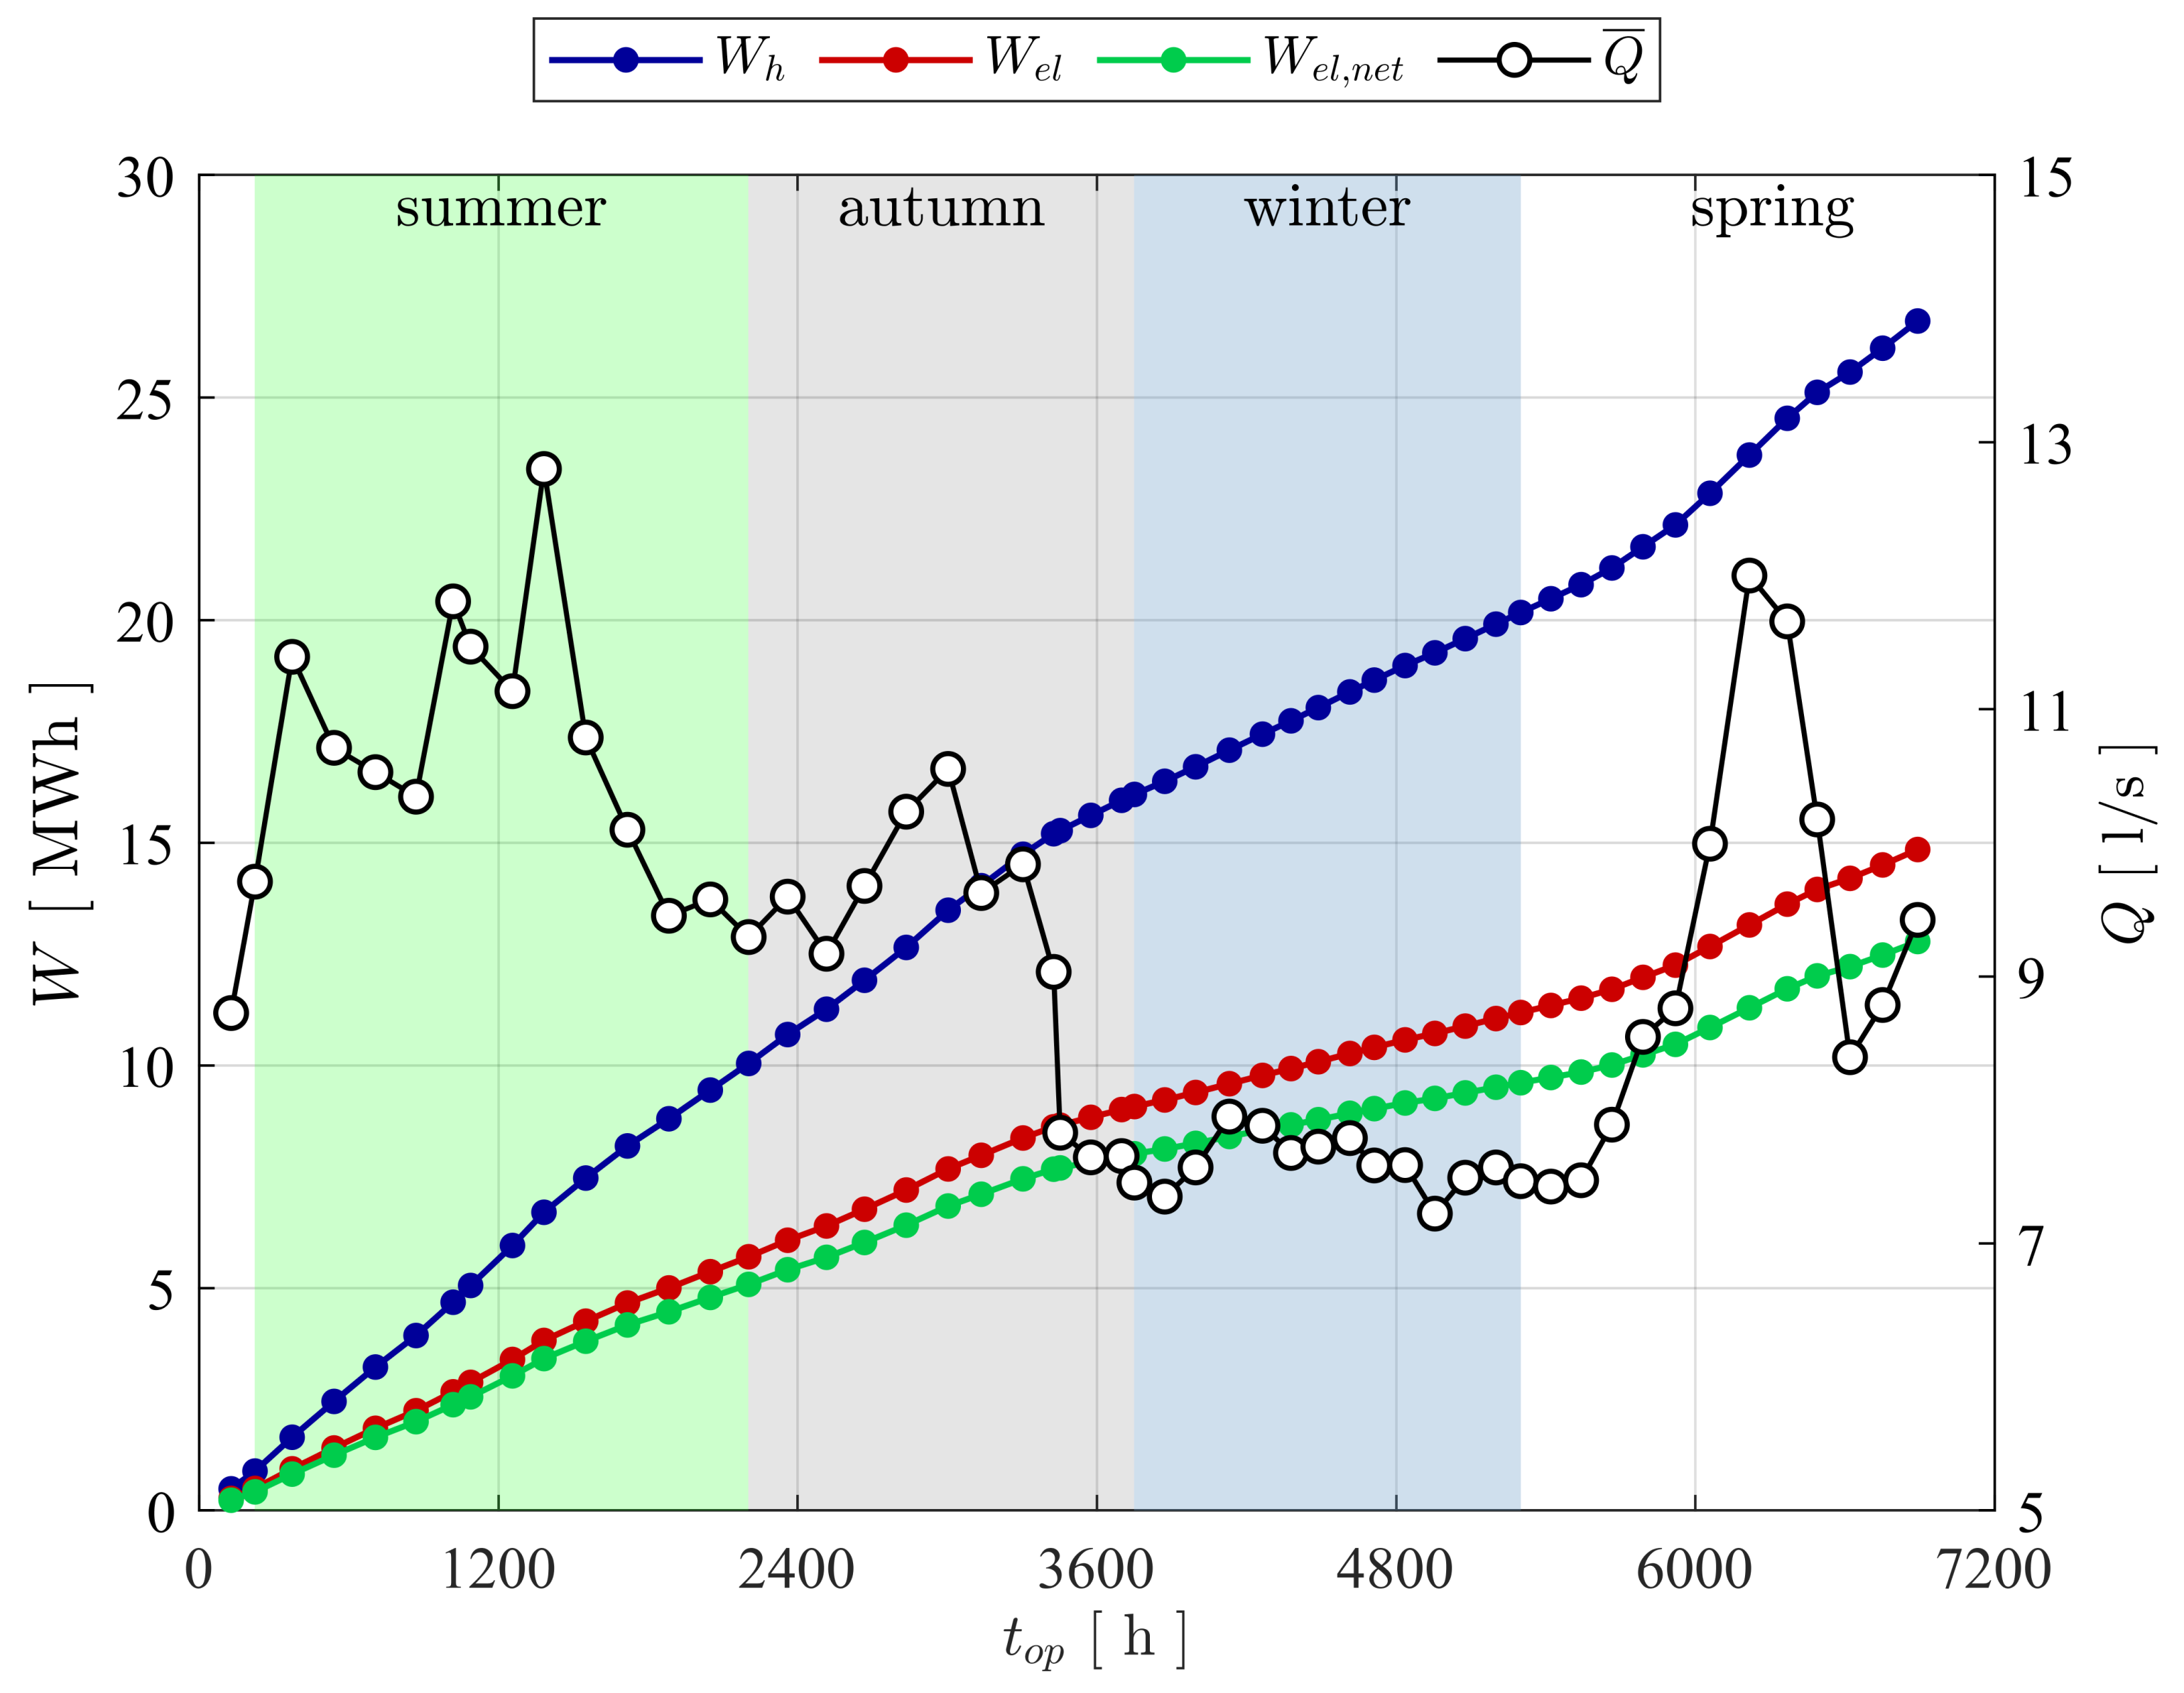
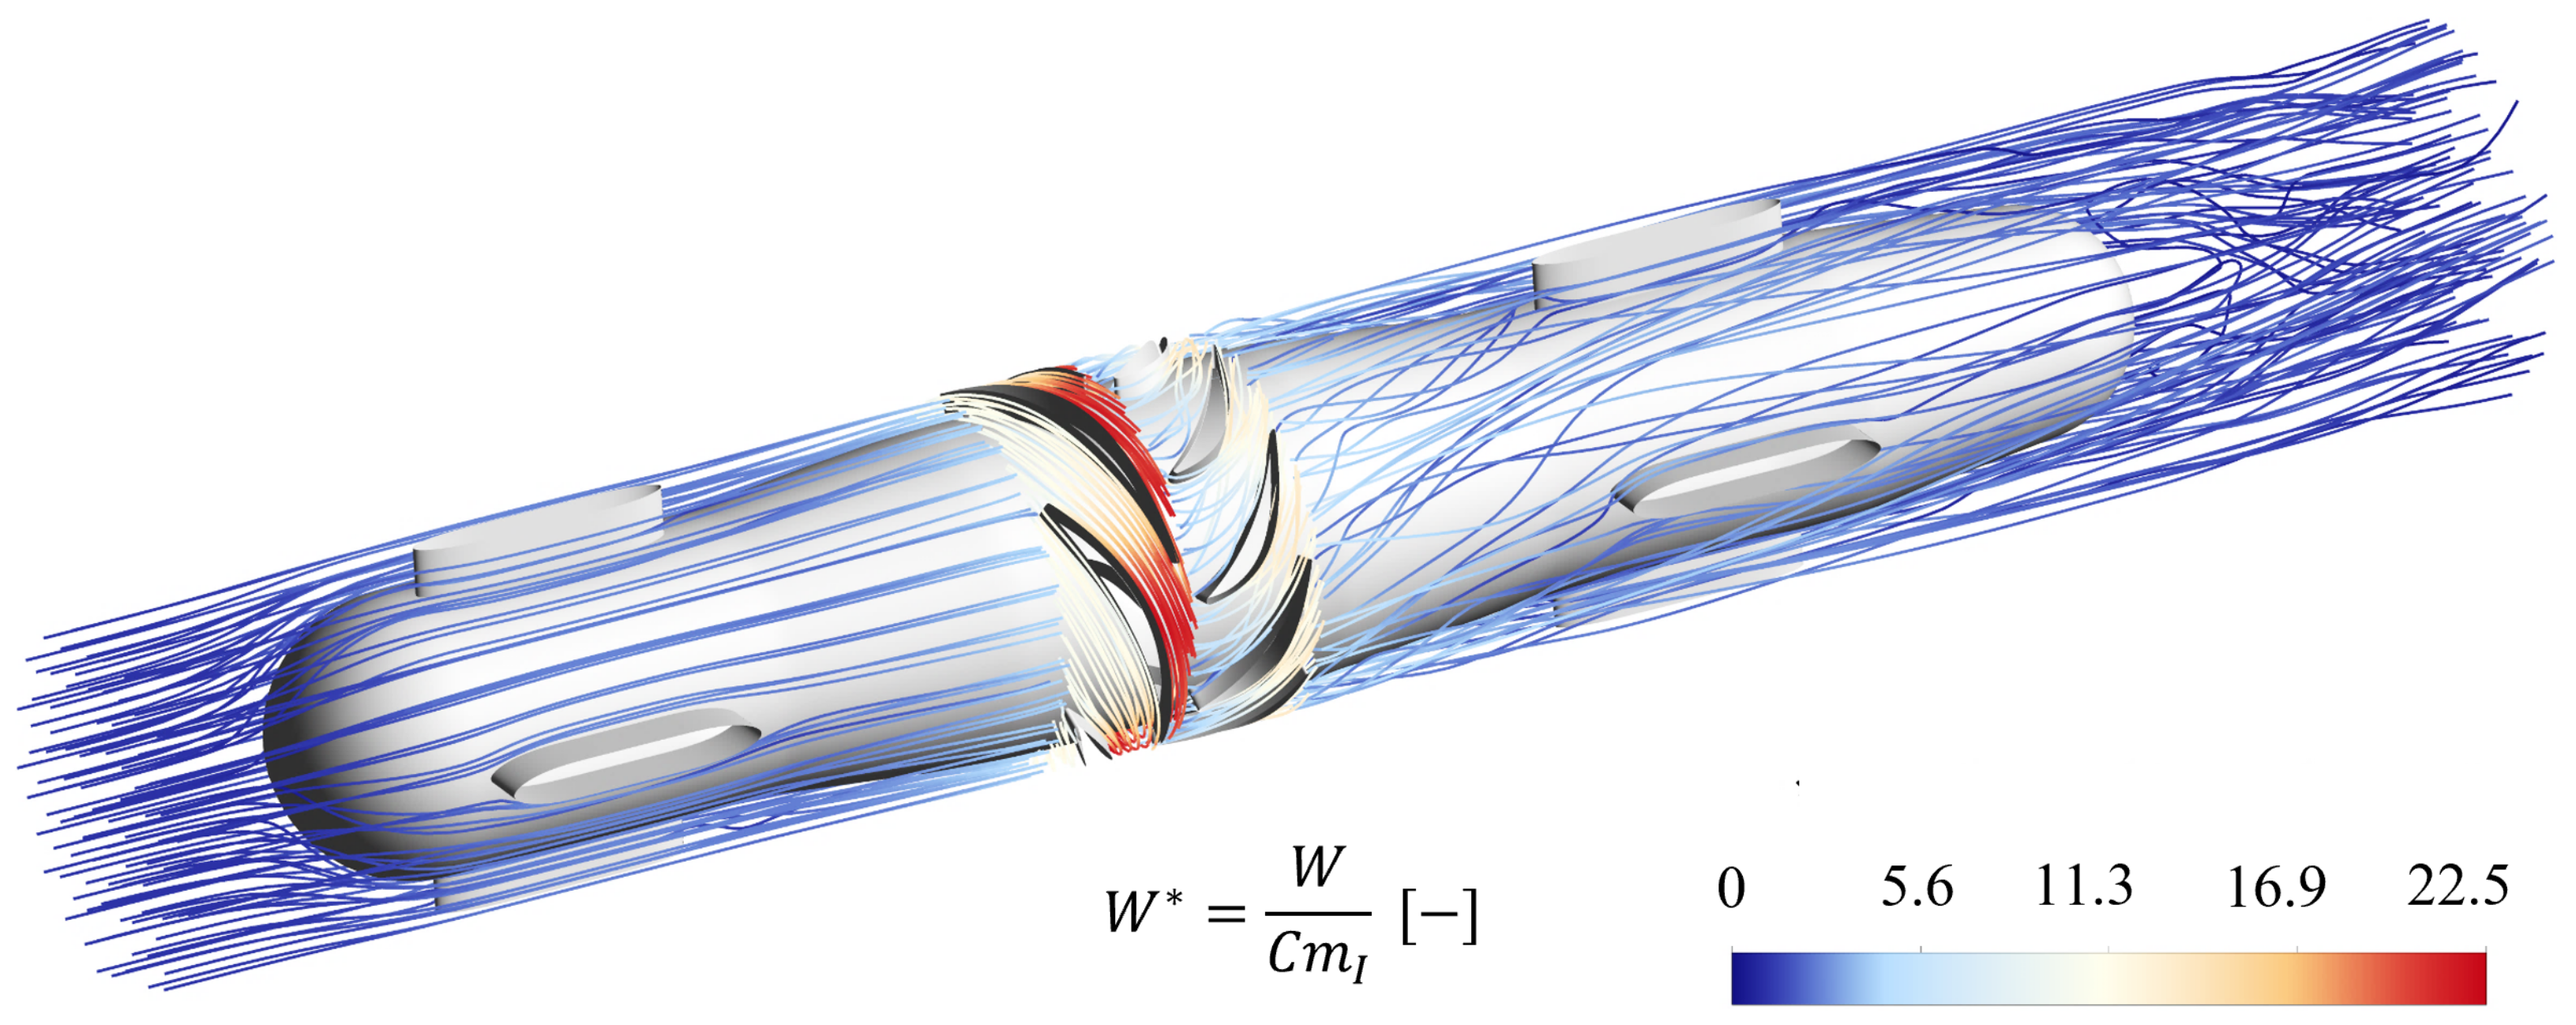
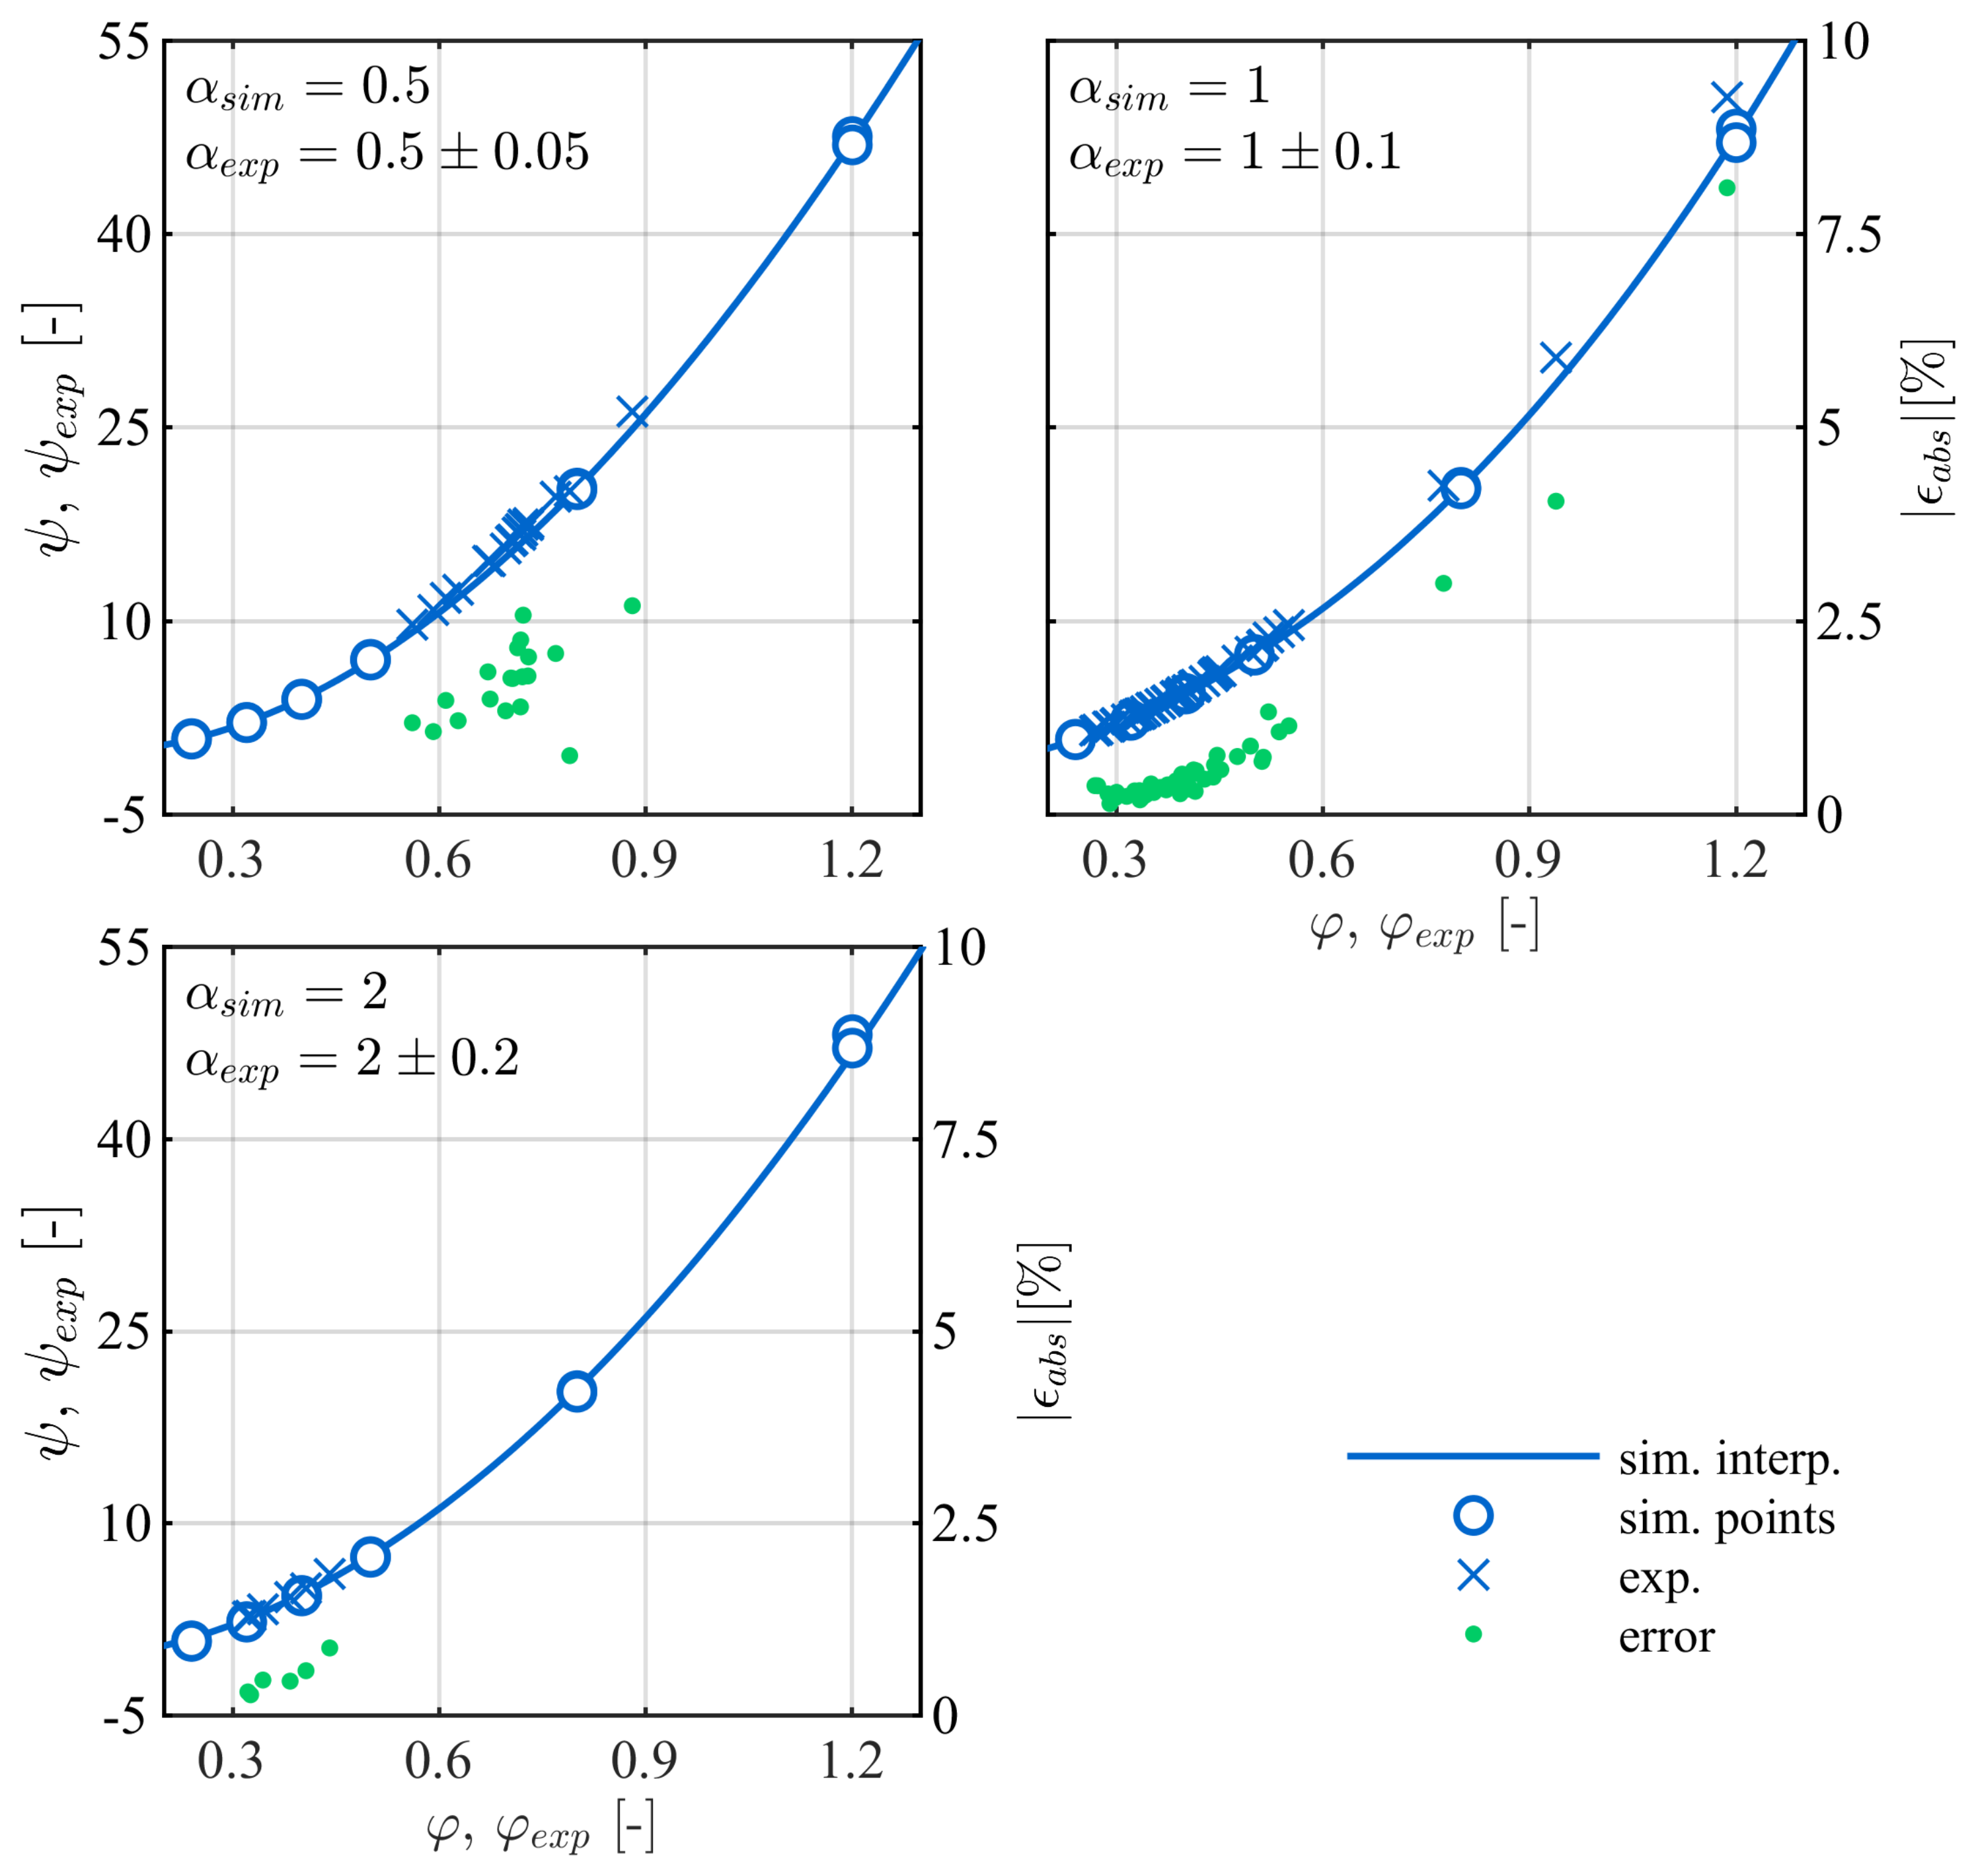
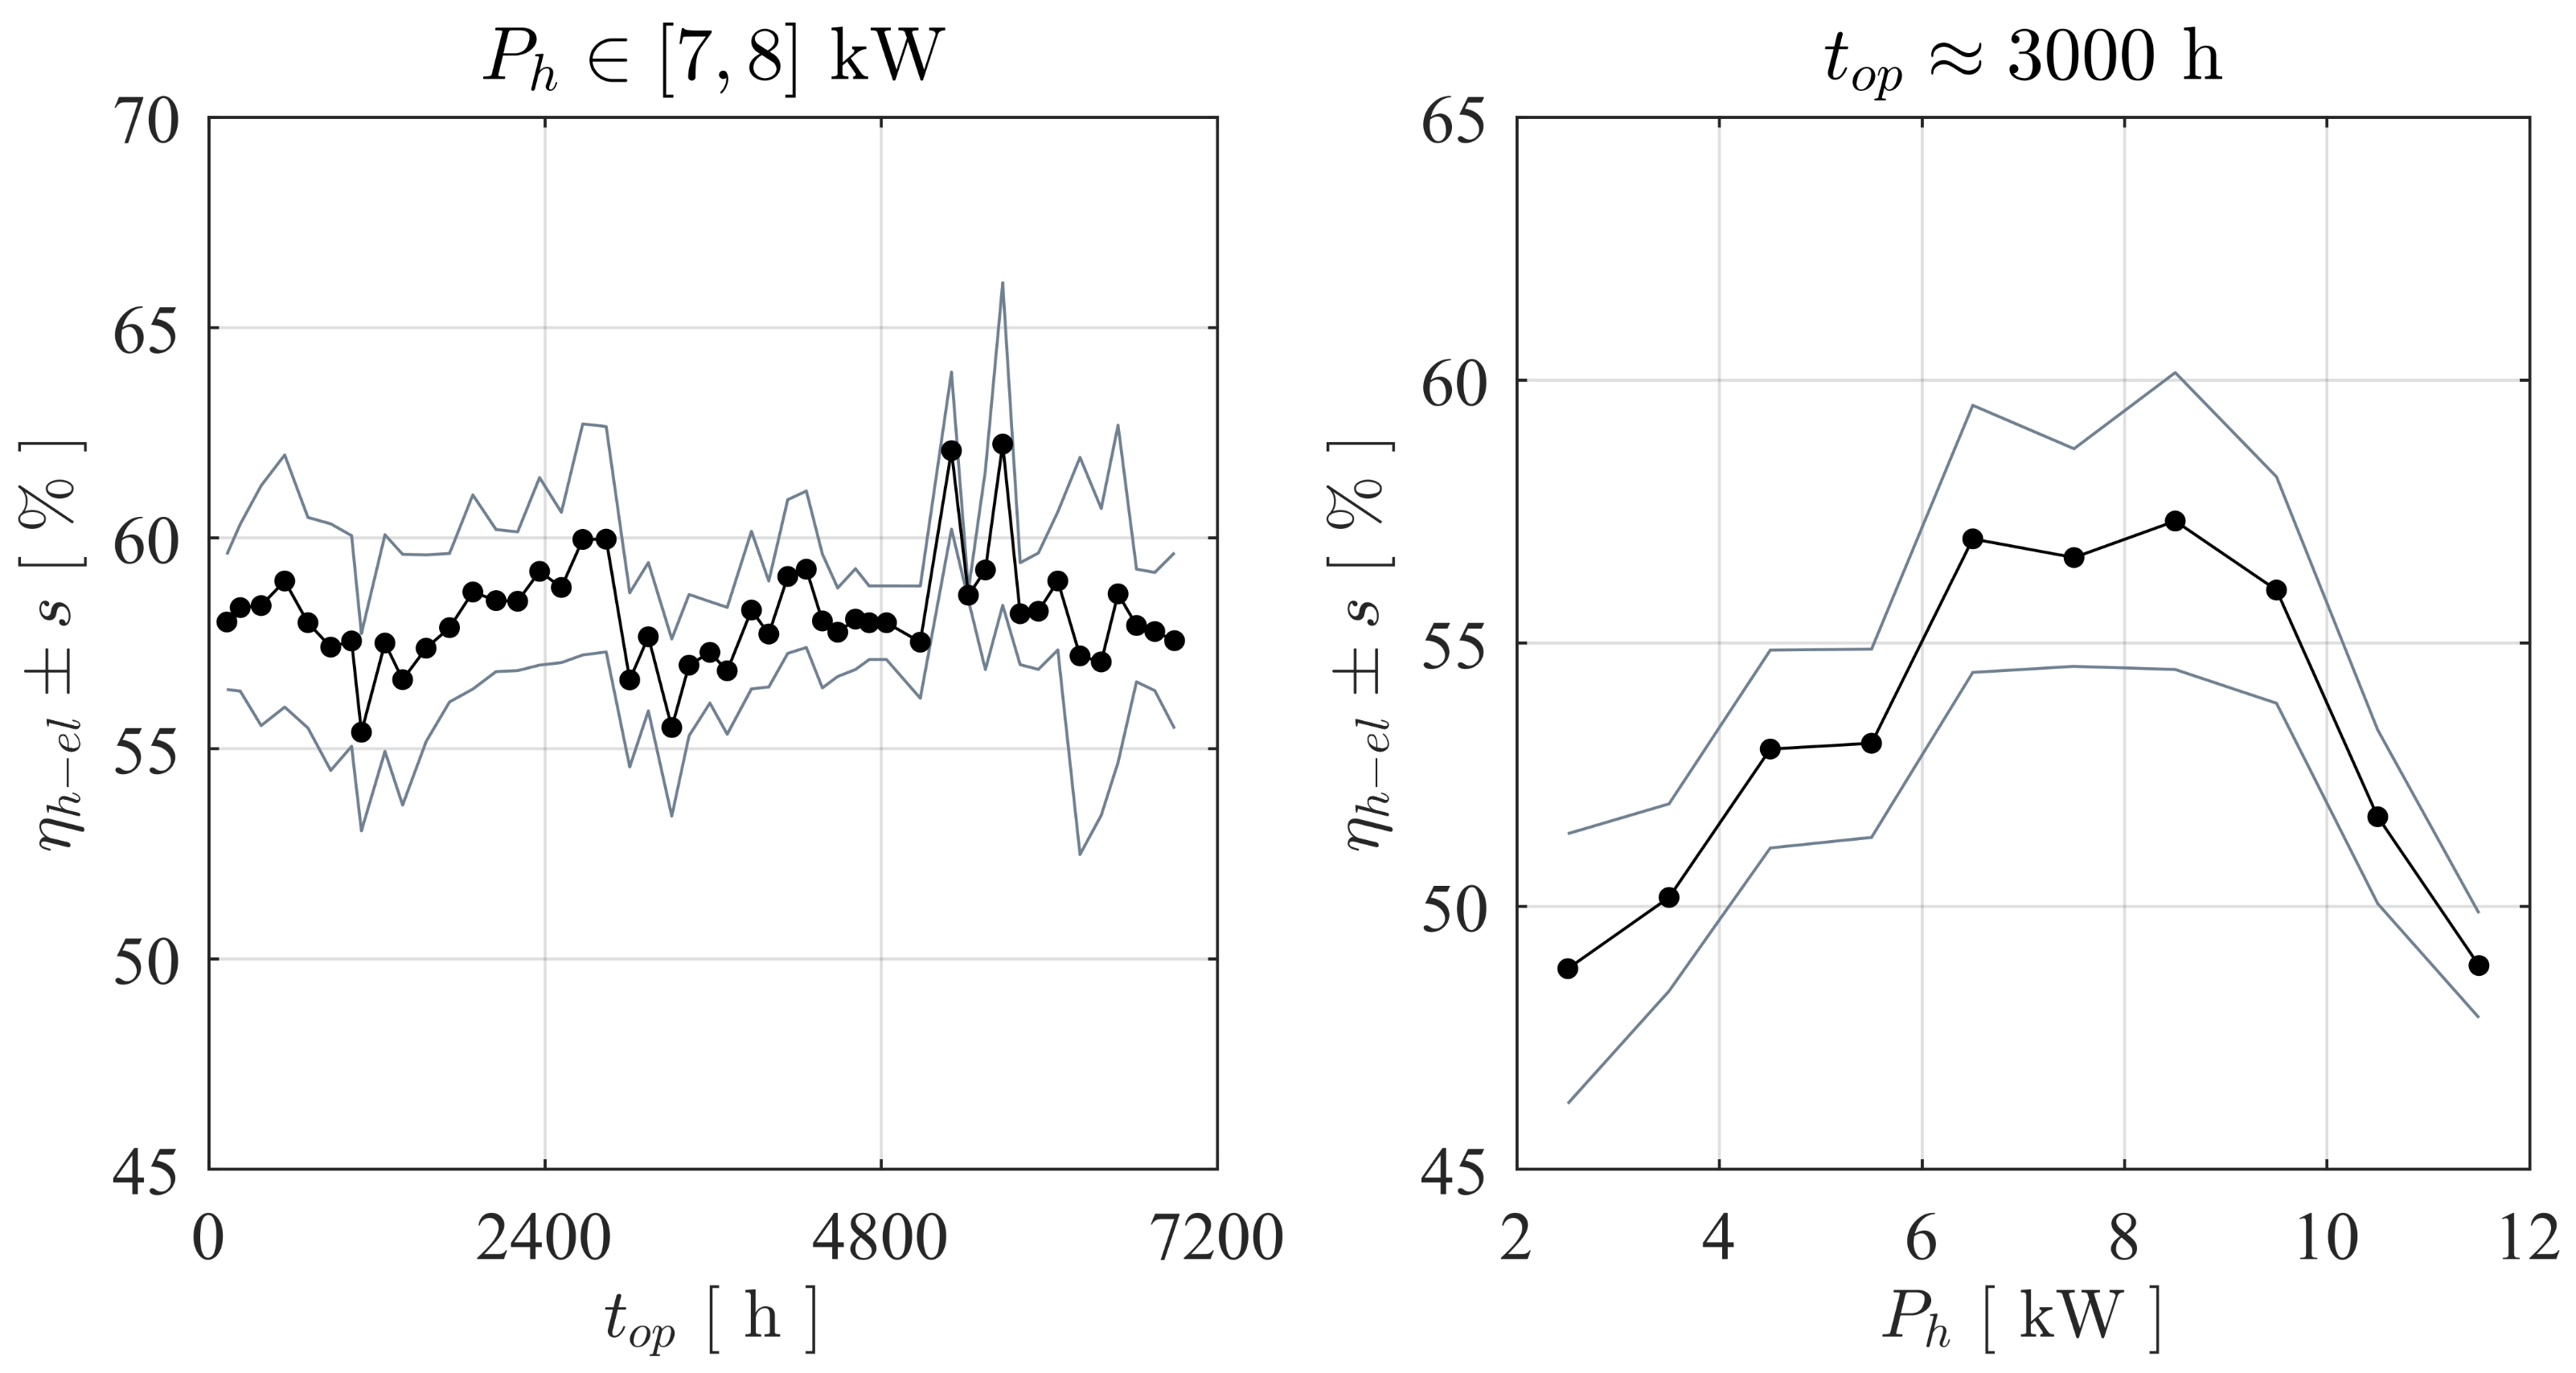
The drinking water industry hides a considerable hydraulic energy potential that remains mostly unexploited for gross capacities of a few kW. In this context, the DuoTurbo research project was initiated to provide a complementary solution for energetic exploitation of drinking water networks in the power range between 5 kW and 25 kW. A new hydroelectric system with a counter-rotating microturbine is developed and installed for long term tests at a drinking water facility. The counter-rotating architecture with particular variable speed rim generators enables a compact design, reaching relatively high specific energy values with extended operational flexibility compared to single degree of freedom solutions. The present study provides an overview of the different technical concepts and methodologies applied for the development of a product prototype with advanced technology readiness level. The particular double rotor hydraulic design is developed and characterized by steady state CFD RANS simulations. The numerical investigations point out the significance of the speed ratio of the system that allows for an extension of the high efficiency range facing important variations of the discharge coefficient. No significant offsets between the characteristic lines of each simulated speed ratio in the φ ψ plane are observed considering the complete turbine domain. This result indicates the limitations on hydraulic flexibility of a fixed geometry hydraulic concept. Despite the currently very low specific speed value of about 16, an energy efficiency greater than 83% could numerically be revealed. This indicates an increased capability of double rotor axial designs handling low specific speed regimes compared to single rotor solutions. The specific speed range of the DuoTurbo turbine could be increased to more than 135 according to typical axial flow designs. Thus, the design range of the DuoTurbo turbine is considerable. In a complementary development step, advanced laboratory tests are performed on a hydraulic test rig to validate the design methodology and to reveal the final characteristics of the product prototype. The tests are conducted at several constant heads between 10 m and 80 m while varying the rotational speeds of each runner to capture the entire characteristics and hydroelectric efficiency of the system. A peak hydroelectric efficiency of 59% is measured that lets estimate a still relatively high amount of power losses from labyrinth leakage flow, disc friction and mechanical friction. The measured energy coefficients and discharge coefficients are then compared to the steady state RANS simulation results, showing a maximum absolute error of almost 8% in the high energy coefficient range, but displaying fair agreements close to BEP conditions with absolute errors widely far below 5%. The hydraulic design procedure is therefore considered reasonably accurate. For the final step of the system validation, a DuoTurbo pilot was commissioned in May 2019 at a pressure reducing station of a drinking water supply network. A complete year of operation counting more than 6’890 operating hours is monitored that confirms the functioning, stability and reliability of the system to a large extend. The vibration level on the turbine housing as well as the hydroelectric efficiency do not show significant deviation trends during the long-term endurance testing. The demonstration of the system in operational environment at pre-commercial state is validated that can be attributed to a technology readiness level of 7. This state includes briefly the in-field operation of the demonstrator adaptable to different operational environments and the verification of the expected efficiency and system stability under long-term real-time operational conditions. The present work demonstrates the technological capability of a counter-rotating micro turbine to recover hydraulic energy from existing water facilities in the power range of a few kW. Subsequent to the endurance tests, research on the required commercialization steps to transform the DuoTurbo concept into a viable MHP solution would typically be addressed. The further steps would also require the broadening and fine tuning of the hydraulic, mechanical and electrical designs along with system scaling considerations in order to target a wide range of potential drinking water networks.

Author Contributions

Conceptualization, D.B., V.H., L.R., S.C, F.A. and C.M.-A.; methodology, D.B., V.H., L.R., S.C., F.A. and C.M.-A.; software, D.B.; validation, D.B., V.H., L.R. and S.C.; formal analysis, D.B. and V.H.; investigation, D.B. and V.H.; resources, V.H.; data curation, D.B. and V.H.; writing—original draft preparation, D.B.; writing—review and editing, D.B., V.H., F.A. and C.M.-A.; visualization, D.B.; supervision, S.C., F.A. and C.M.-A.; project administration, F.A. and C.M.-A.; funding acquisition, F.A. and C.M.-A. All authors have read and agreed to the published version of the manuscript.

Funding

This research is part of the KTI DuoTurbo project number 17197.1 PFEN IW and received funding from the Swiss Commission for Technology and Innovation.

Institutional Review Board Statement

Not applicable.

Informed Consent Statement

Not applicable.

Data Availability Statement

Not applicable.

Acknowledgments

This project was performed in the framework of SCCER-SoE. The authors would like to thank the industrial partners Telsa SA, Valelectric Farner SA, Jacquier-Luisier SA and LAMI SA for their collaboration. Finally, the onsite measurements were performed in the framework of the Savièse project, financially supported by Cimark and by the program The Ark Energy of the Ark, Valais, Switzerland. ClaVal Switzerland is also thanked for all their support concerning the pressure reducing valves.

Conflicts of Interest

The authors declare no conflict of interest.

References

  1. SFOE. Swiss Federal Office of Energy, Hydropower. 2021. Available online: https://www.bfe.admin.ch/bfe/en/home/supply/renewable-energy/hydropower.html (accessed on 23 September 2021).
  2. United Nations Industrial Development Organization, World Small Hydropower Development Report 2019. 2021. Available online: https://www.unido.org/our-focus-safeguarding-environment-clean-energy-access-productive-use-renewable-energy-focus-areas-small-hydro-power/world-small-hydropower-development-report (accessed on 23 September 2021).
  3. McNabola, A.; Coughlan, P.; Corcoran, L.; Power, C.; Williams, A.P.; Harris, I.; Gallagher, J.; Styles, D. Energy recovery in the water industry using micro-hydropower: An opportunity to improve sustainability. Water Policy 2014, 16, 168–183. [Google Scholar] [CrossRef]
  4. Vincent Denis, A.C.; Punys, P. Integration of Small Hydro Turbines into Existing Water Infrastructures. In Hydropower—Practice and Application; IntechOpen: Rijeka, Croatia, 2012. [Google Scholar] [CrossRef] [Green Version]
  5. Carravetta, A.; Derakhshan Houreh, S.; Ramos, H.M. Pumps as Turbines—Fundamentals and Applications; Springer: Cham, Switzerland, 2018. [Google Scholar]
  6. Postacchini, M.; Darvini, G.; Finizio, F.; Pelagalli, L.; Soldini, L.; Di Giuseppe, E. Hydropower Generation Through Pump as Turbine: Experimental Study and Potential Application to Small-Scale WDN. Water 2020, 12, 958. [Google Scholar] [CrossRef] [Green Version]
  7. Fontanella, S.; Fecarotta, O.; Molino, B.; Cozzolino, L.; Della Morte, R. A Performance Prediction Model for Pumps as Turbines (PATs). Water 2020, 12, 1175. [Google Scholar] [CrossRef] [Green Version]
  8. Perez-Sanchez, M.; Sánchez-Romero, F.J.; Ramos, H.M.; López-Jiménez, P.A. Improved planning of energy recovery in water systems using a new analytic approach to PAT performance curves. Water 2020, 12, 468. [Google Scholar] [CrossRef] [Green Version]
  9. Algieri, A.; Zema, D.A.; Nicotra, A.; Zimbone, S.M. Potential energy exploitation in collective irrigation systems using pumps as turbines: A case study in Calabria (Southern Italy). J. Clean. Prod. 2020, 257, 120538. [Google Scholar] [CrossRef]
  10. Giudicianni, C.; Herrera, M.; di Nardo, A.; Carravetta, A.; Ramos, H.M.; Adeyeye, K. Zero-net energy management for the monitoring and control of dynamically-partitioned smart water systems. J. Clean. Prod. 2020, 252, 119745. [Google Scholar] [CrossRef]
  11. Kougias, I.; Patsialis, T.; Zafirakou, A.; Theodossiou, N. Exploring the potential of energy recovery using micro hydropower systems in water supply systems. Water Util. J. 2014, 7, 25–33. [Google Scholar]
  12. Hasmatuchi, V.; Bosioc, A.I.; Luisier, S.; Münch-Alligné, C. Dynamic Approach for Faster Performance Measurements on Hydraulic Turbomachinery Model Testing. Appl. Sci. 2018, 8, 1426. [Google Scholar] [CrossRef] [Green Version]
  13. Hasmatuchi, V.; Münch-Alligné, C.; Gabathuler, S.; Chevailler, S.; Avellan, F. New Counter-Rotating Micro-Hydro Turbine for Drinking Water Systems. In Proceedings of the Hidroenergia 2014, Instanbul, Turkey, 21–23 May 2014. [Google Scholar]
  14. Samora, I.; Hasmatuchi, V.; Münch, C.; Franca, M.J.; Schleiss, A.J.; Ramos, H.M. Experimental characterization of a five blade tubular propeller turbine for pipe inline installation. Renew. Energy 2016, 95, 356–366. [Google Scholar] [CrossRef]
  15. Münch-Alligné, C.; Richard, S.; Meier, B.; Hasmatuchi, V.; Avellan, F. Numerical simulations of a counter rotating micro turbine. Adv. Hydroinform. 2013, 32, 363–373. [Google Scholar]
  16. Vagnoni, E.; Andolfatto, L.; Delgado, J.; Münch-Alligné, C.; Avellan, F. Application of Laser Doppler Velocimetry to the development of a counter rotating micro-turbine. In Proceedings of the 36th IAHR World Congress, Hague, The Netherlands, 28 June–2 July 2015. [Google Scholar]
  17. Vagnoni, E.; Andolfatto, L.; Richard, S.; Münch-Alligné, C.; Avellan, F. Hydraulic performance evaluation of a micro-turbine with counter rotating runners by experimental investigation and numerical simulation. Renew. Energy 2018, 126, 943–953. [Google Scholar] [CrossRef] [Green Version]
  18. Andolfatto, L.; Delgado, J.; Vagnoni, E.; Münch-Alligné, C.; Avellan, F. Analytical hill chart towards the maximisation of energy recovery in water utility networks with counter-rotating runners micro-turbine. In Proceedings of the 36th IAHR World Congress, Hague, The Netherlands, 28 June–2 July 2015. [Google Scholar]
  19. Andolfatto, L.; Delgado, J.; Vagnoni, E.; Münch-Alligné, C.; Avellan, F. Simulation of energy recovery on water utilitynetworks by a micro-turbine with counter-rotating runners. IOP Conf. Ser. Earth Environ. Sci. 2016, 49, 102012. [Google Scholar] [CrossRef] [Green Version]
  20. Andolfatto, L.; Euzena, C.; Vagnoni, E.; Münch-Alligné, C.; Avellan, F. A mixed standard/custom design strategy to minimize cost and maximize efficiency for Picohydro power potential harvesting. In Proceedings of the 2015 5th International Youth Conference on Energy (IYCE), Pisa, Italy, 27–30 May 2015. [Google Scholar]
  21. Biner, D.; Hasmatuchi, V.; Violante, D.; Richard, S.; Chevailler, S.; Andolfatto, L.; Avellan, F.; Münch-Alligné, C. Engineering and performance of duoturbo: Microturbine with counter-rotating runners. IOP Conf. Ser. Earth Environ. Sci. 2016, 49, 102013. [Google Scholar] [CrossRef] [Green Version]
  22. Hasmatuchi, V.; Biner, D.; Avellan, F.; Münch-Alligné, C. Performance measurements on the duoturbo microturbine for drinking water systems. In Proceedings of the Hydro 2016 Conference, Montreux, Switzerland, 10–12 October 2016. [Google Scholar]
  23. Biner, D.; Andolfatto, L.; Hasmatuchi, V.; Rapillard, L.; Chevailler, S.; Avellan, F.; Münch-Alligné, C. DuoTurbo: A New Counter-Rotating Microturbine for Drinking Water Facilities. In Proceedings of the International Conference on Innovative Applied Energy, Oxford, UK, 14–15 March 2019. [Google Scholar]
  24. Louis, J.F. Axial Flow Contra-Rotating Turbines. Proceedings of ASME 1985 International Gas Turbine Conference and Exhibit, Houston, TX, USA, 18–21 March 1985. [Google Scholar]
  25. Lee, N.J.; Choi, J.W.; Hwang, Y.H.; Kim, Y.T.; Lee, Y.H. Performance analysis of a counter-rotating tubular type micro-turbine by experiment and CFD. IOP Conf. Ser. Earth Environ. Sci. 2012, 15, 042025. [Google Scholar] [CrossRef]
  26. Nan, D.; Shigemitsu, T.; Zhao, S. Investigation and analysis of attack angle and rear flow condition of contrarotating small hydro-turbine. Energies 2018, 11, 1806. [Google Scholar] [CrossRef] [Green Version]
  27. Sonohata, R.; Fukutomi, J.; Shigemitsu, T. Study on the contra-rotating small-sized axial flow hydro turbine. Open J. Fluid Dyn. 2012, 11, 318–323. [Google Scholar] [CrossRef] [Green Version]
  28. Linlin, C. High Performance Design of a Contra-Rotating Axial Flow Pump with Different Rotor-Speed Combination. Ph.D. Thesis, Kyushu University Institutional Repository, Fukuoka, Japan, 2014. [Google Scholar]
  29. Violante, D.; Farner, L.; Chevailler, S. Design of a pm-generator for a straight flow counter-rotating microhydro turbine. In Proceedings of the 19th European Conference on Power Electronics and Applications (EPE’17 ECCE Europe), Warsaw, Poland, 11–14 September 2017. [Google Scholar]
  30. IEC60193:1999. In Hydraulic Turbines, Storage Pumps and Pump-Turbines—Model Acceptance Tests; International Electrotechnical Commission: Geneva, Switzerland, 1999.
  31. Launder, B.E.; Spalding, D.B. The numerical computation of turbulent flow. Comput. Methods Appl. Mech. Eng. 1974, 3, 269–289. [Google Scholar] [CrossRef]
  32. Menter, F.R. Two equation eddy viscosity turbulence models for engineering application. AIAA J. 1994, 32, 1598–1650. [Google Scholar] [CrossRef] [Green Version]
  33. Stoessel, L.; Nilsson, H. Steady and unsteady numerical simulations of theflow in the Tokke Francis turbine model, at three operating conditions. J. Phys. Conf. Ser. 2015, 579, 012011. [Google Scholar] [CrossRef] [Green Version]
  34. Hosseinimanesh, H.; Devals, C.; Nennemann, B.; Guibault, F. Comparison of steady and unsteady simulation methodologies for predicting no-load speed in Francis turbines. Int. J. Fluid Mach. Syst. 2015, 8, 155–168. [Google Scholar] [CrossRef] [Green Version]
  35. Menter, F.R.; Kuntz, M.; Langtry, R. Ten Years of Industrial Experience with the SST Turbulence Model. In Proceedings of the 4th International Symposium on Turbulence, Heat and Mass Transfer, Antalya, Turkey, 12–17 October 2003; Begell House Inc.: Redding, CT, USA, 2003; pp. 625–632. [Google Scholar]
  36. Hasmatuchi, V.; Gabathuler, S.; Botero, F.; Münch-Alligné, C. Design and control of a new hydraulic test rig for small hydro turbines. Hydropower Dams 2015, 22, 54–60. [Google Scholar]
  37. Chapallaz, J.M.; Eichenberger, P.; Fischer, G. Manual on Pumps Used as Turbines; MHGP Series Harnessing Water Power on a Small Scale; Informatica International, Incorporated: Singapore, 1992. [Google Scholar]
  38. De Rose, A.; Buna, M.; Strazza, C.; Olivieri, N.; Stevens, T.; Peeters, L.; Tawil-Jamault, D. Technology Readiness Level: Guidance Principles for Renewable Energy Technologies; Technical Report; EU Publications Office, European Commission: Luxembourg, 2017. [Google Scholar]
  39. Pérez-Sánchez, M.; López-Jiménez, P.A.; Ramos, H.M. Modified Affinity Laws in Hydraulic Machines towards the Best Efficiency Line. Water Resour. Manag. 2018, 32, 829–844. [Google Scholar] [CrossRef] [Green Version]
Figure 1. Overview of the DuoTurbo conceptualization and characterization methodology from the initial studies to a potential commercialization phase.
Sustainability 13 10717 g001
Figure 2. Global schematic with main hydroelectric components of the DuoTurbo energy recovery system in a drinking water network with consumer driven discharge.
Sustainability 13 10717 g002
Figure 3. Definition of reference sections and velocity triangles of a counter-rotating turbine stage.
Sustainability 13 10717 g003
Figure 4. Direct profiling parametrization.
Sustainability 13 10717 g004
Figure 5. Overview of the mechanical components of the DuoTurbo product prototype.
Sustainability 13 10717 g005
Figure 7. CFD meshes, computational domains and boundary definitions.
Sustainability 13 10717 g007
Figure 8. Design of experiment for the numerical simulations.
Sustainability 13 10717 g008
Figure 9. Experimental setup on the hydraulic test rig of HES-SO Valais-Wallis. (a) DuoTurbo turbine (b) Electrical cabinet (c) Control interface (d) Precision electrical multimeter (e) Bypass PRV (f) Turbine branch PRV.
Sustainability 13 10717 g009
Figure 10. Installation scheme of the DuoTurbo pilot.
Sustainability 13 10717 g010
Figure 11. Installed DuoTurbo pilot in a drinking water supply network at Savièse (VS Switzerland). The positions (ag) refer to the instrumentation list given in Table 7.
Sustainability 13 10717 g011
Figure 12. Instantaneous relative velocity streamlines for Q = 9 L/s, n A = 2250 min 1 and α = 1.
Sustainability 13 10717 g012
Figure 13. Simulated energy efficiency and φ ψ characteristics.
Sustainability 13 10717 g013
Figure 14. Measured maximum electrical power hill chart along with the Maximum Power Line (MPL).
Sustainability 13 10717 g014
Figure 15. Measured hydroelectric efficiency hill chart at maximum electrical power along with the Maximum Power Line (MPL).
Sustainability 13 10717 g015
Figure 16. Comparison between simulated and measured hydraulic characteristics.
Sustainability 13 10717 g016
Figure 17. Monitored behavior of the specific energy of the pressure reducing station, the DuoTurbo turbine and PRV2 as function of the total discharge, along with the relative cumulative discharge frequency.
Sustainability 13 10717 g017
Figure 18. Pilot vibration monitoring. Weekly maximum and average vibration velocity amplitudes (left) and example of the vibration variation during one week (right).
Sustainability 13 10717 g018
Figure 19. Efficiency monitoring of the DuoTurbo pilot. Weekly statistics for a fixed power interval (left) and example of a weekly efficiency variation as function of the hydraulic power (right).
Sustainability 13 10717 g019
Figure 20. Monitored accumulated energies and weekly discharge average of the DuoTurbo pilot.
Sustainability 13 10717 g020
Table 1. Runner specifications of the DuoTurbo product prototype.
SymboleDescriptionValueUnit
D s Shroud diameter100mm
D h Hub diameter87mm
bAxial blade length30mm
N A Number of blades runner A5-
N B Number of blades runner B9-
σ A Blade solidity runner A1.44-
σ B Blade solidity runner B1.42-
β A , 1 , s * Shroud inlet blade angle A27.3deg
β A , 1 ¯ , s * Shroud outlet blade angle A10.9deg
β B , 1 , s * Shroud inlet blade angle B67.7deg
β B , 1 ¯ , s * Shroud outlet blade angle B20.7deg
Table 2. Generator specifications of the DuoTurbo product prototype.
SymboleDescriptionValueUnit
D r i Inner rotor diameter100mm
D r e Outer rotor diameter126mm
gGenerator air gap2.9mm
l a Active length62mm
2 p Number of poles8-
n n Nominal rot. speed35001/min
T n Nominal torque10Nm
ULine voltage400V
P e l , n Nominal electrical power3.3kW
η e l , n Nominal efficiency0.92-
Table 3. CFD mesh information.
DomainNodesElements y + Mean y + Max
Stator A401’274378’88013.6430.64
Stator B637’698608’28014.3074.11
Runner A640’035601’76033.1686.87
Runner B895’158839’80824.3262.85
Table 4. Definition of boundary conditions.
BoundaryCondition
InletMass flow rate
OutletOutlet with average static pressure
Solid wallsSmooth no-slip wall
Interface 1/2/3Frozen Rotor, GGI
Table 5. Reference sections for the specific energy computations.
VariableSection A i Section A i ¯
EInletOutlet
E A Interface 1Interface 2
E B Interface 2Interface 3
E A B Interface 1Interface 3
Table 6. Main characteristics of the laboratory measurement equipment.
Sensor TypeMeasured QuantityRangeAccuracy
Electromagnetic flowmeterDischarge8–280 m 3 /h±0.2%
Differential pressure sensorHead0–16 bar±0.1%
Rotational speed0–50 kHz±0.025%
Precision electrical multimeterElectrical power0–32 Atrms±0.025%
0–1000 Vtrms±0.025%
Table 7. Main hydromechanical instrumentation of the DuoTurbo pilot.
Pos.IdentifierSensor TypeMeasured QuantityRangeAccuracy
aVS1VibrationHousing acceleration−245–245 m/s 2 ±0.2%
bPS2Abs. pressureTurbine outlet pressure0–20 bar±0.15%
cPS1Abs. pressureTurbine inlet pressure0–20 bar±0.15%
dPS4Rel. pressurePRV1 outlet pressure0–30 bar±0.1%
ePS3Rel. pressurePRV1 inlet pressure0–30 bar±0.1%
fFM1FlowmeterBypass discharge3–75 L/s±2%
gFM2FlowmeterTotal discharge−147–147 L/s±0.2%
Table 8. Simulation results for nominal conditions and maximum power.
QE E A E B P h P t η e n q
[L/s][J/kg][J/kg][J/kg][W][W][-][-]
93021511442’7122’2390.8316.3
1472736334810’1628’5090.8416.4
Publisher’s Note: MDPI stays neutral with regard to jurisdictional claims in published maps and institutional affiliations.

