
Effect of Slow-Release Urea Administration on Production Performance, Health Status, Diet Digestibility, and Environmental Sustainability in Lactating Dairy Cows

 ,
,  ,
,  ,
,
Abstract
:Simple Summary
Abstract
1. Introduction
2. Materials and Methods
2.1. Animal, Groups and Animal Care
2.2. Diets and Feeding Management
2.3. Parameters Recorded
2.3.1. Production Performances: Milk Yield, Energy Corrected Milk (ECM), Milk Quality, Feed Intake, Feed Conversion Rate, Body Condition Score, Reproductive Performances
2.3.2. Characteristics of the Dies, Feces, and Digestibility of the Feeds
- X = each analytical parameter considered (%)
- ADL = acid detergent lignin (%)
- d = diet
- f = feces.
2.3.3. Environmental Impact: Diet Carbon Footprint (CFP)
2.3.4. Environmental Impact: Predicted Enteric Methane Production
- CH4 = enteric methane production
- DMI = dry matter intake (kg/head/day)
2.4. Statistical Analysis
3. Results and Discussion
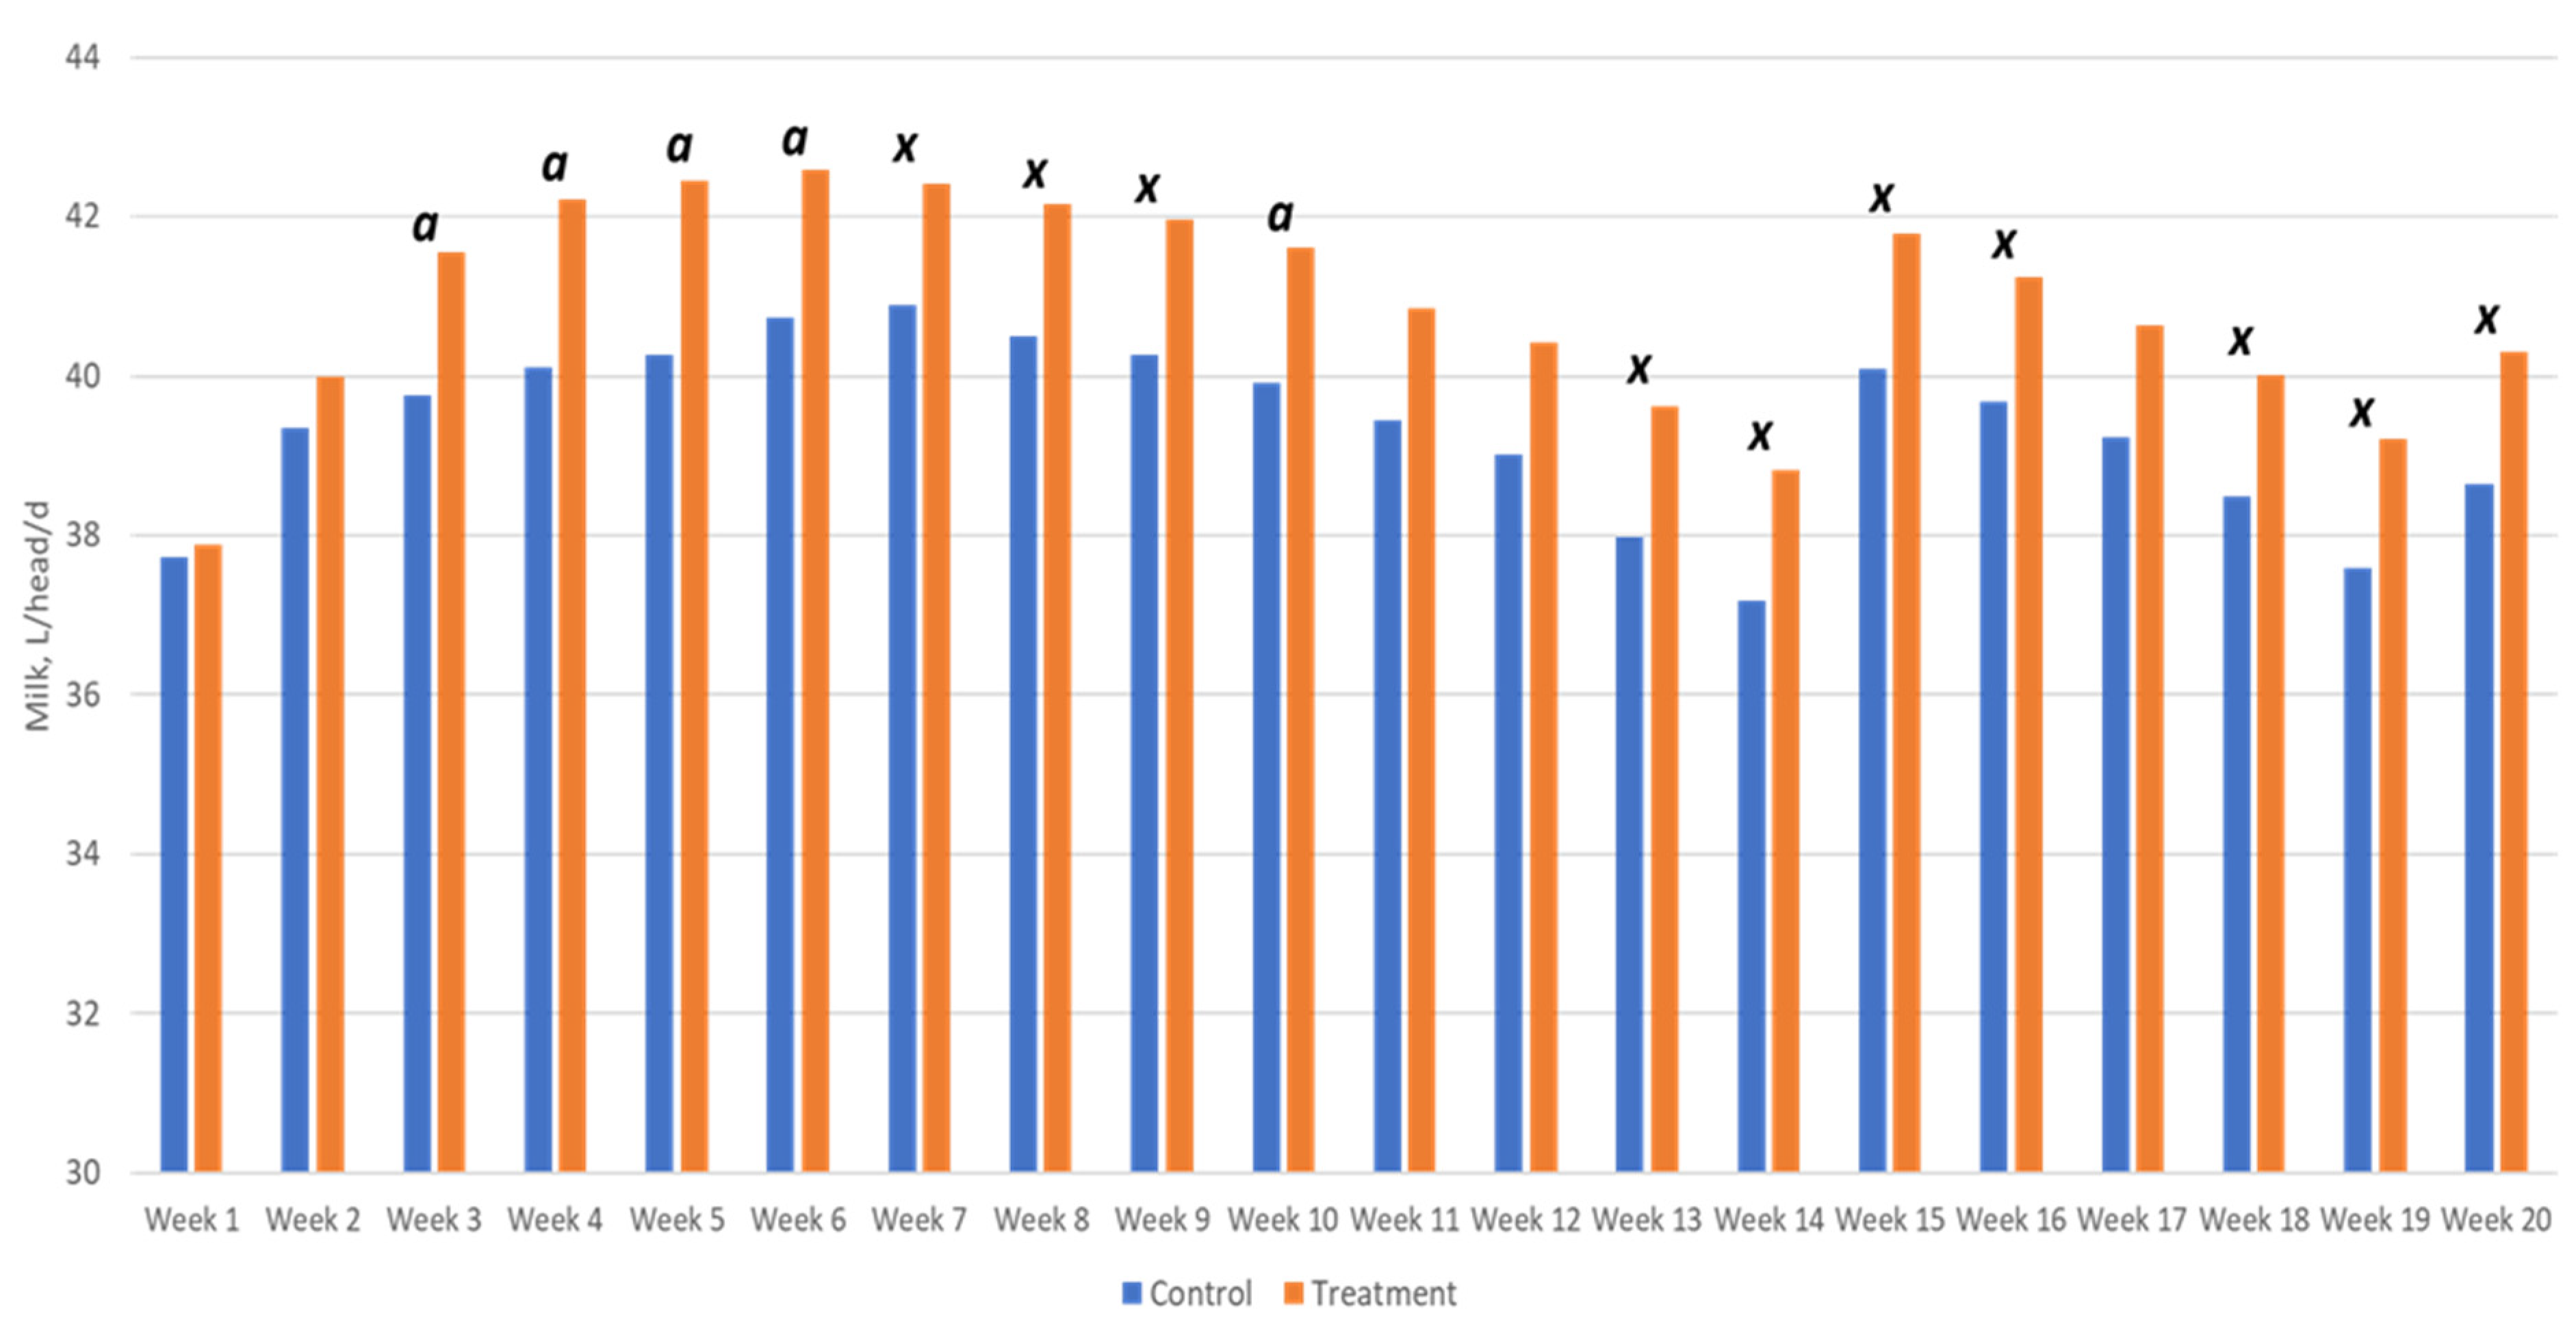
3.1. Production Performances: Milk Yield, Energy Corrected Milk (ECM), Milk Quality, Feed Intake, Feed Conversion Rate, Body Condition Score, Reproductive Performances
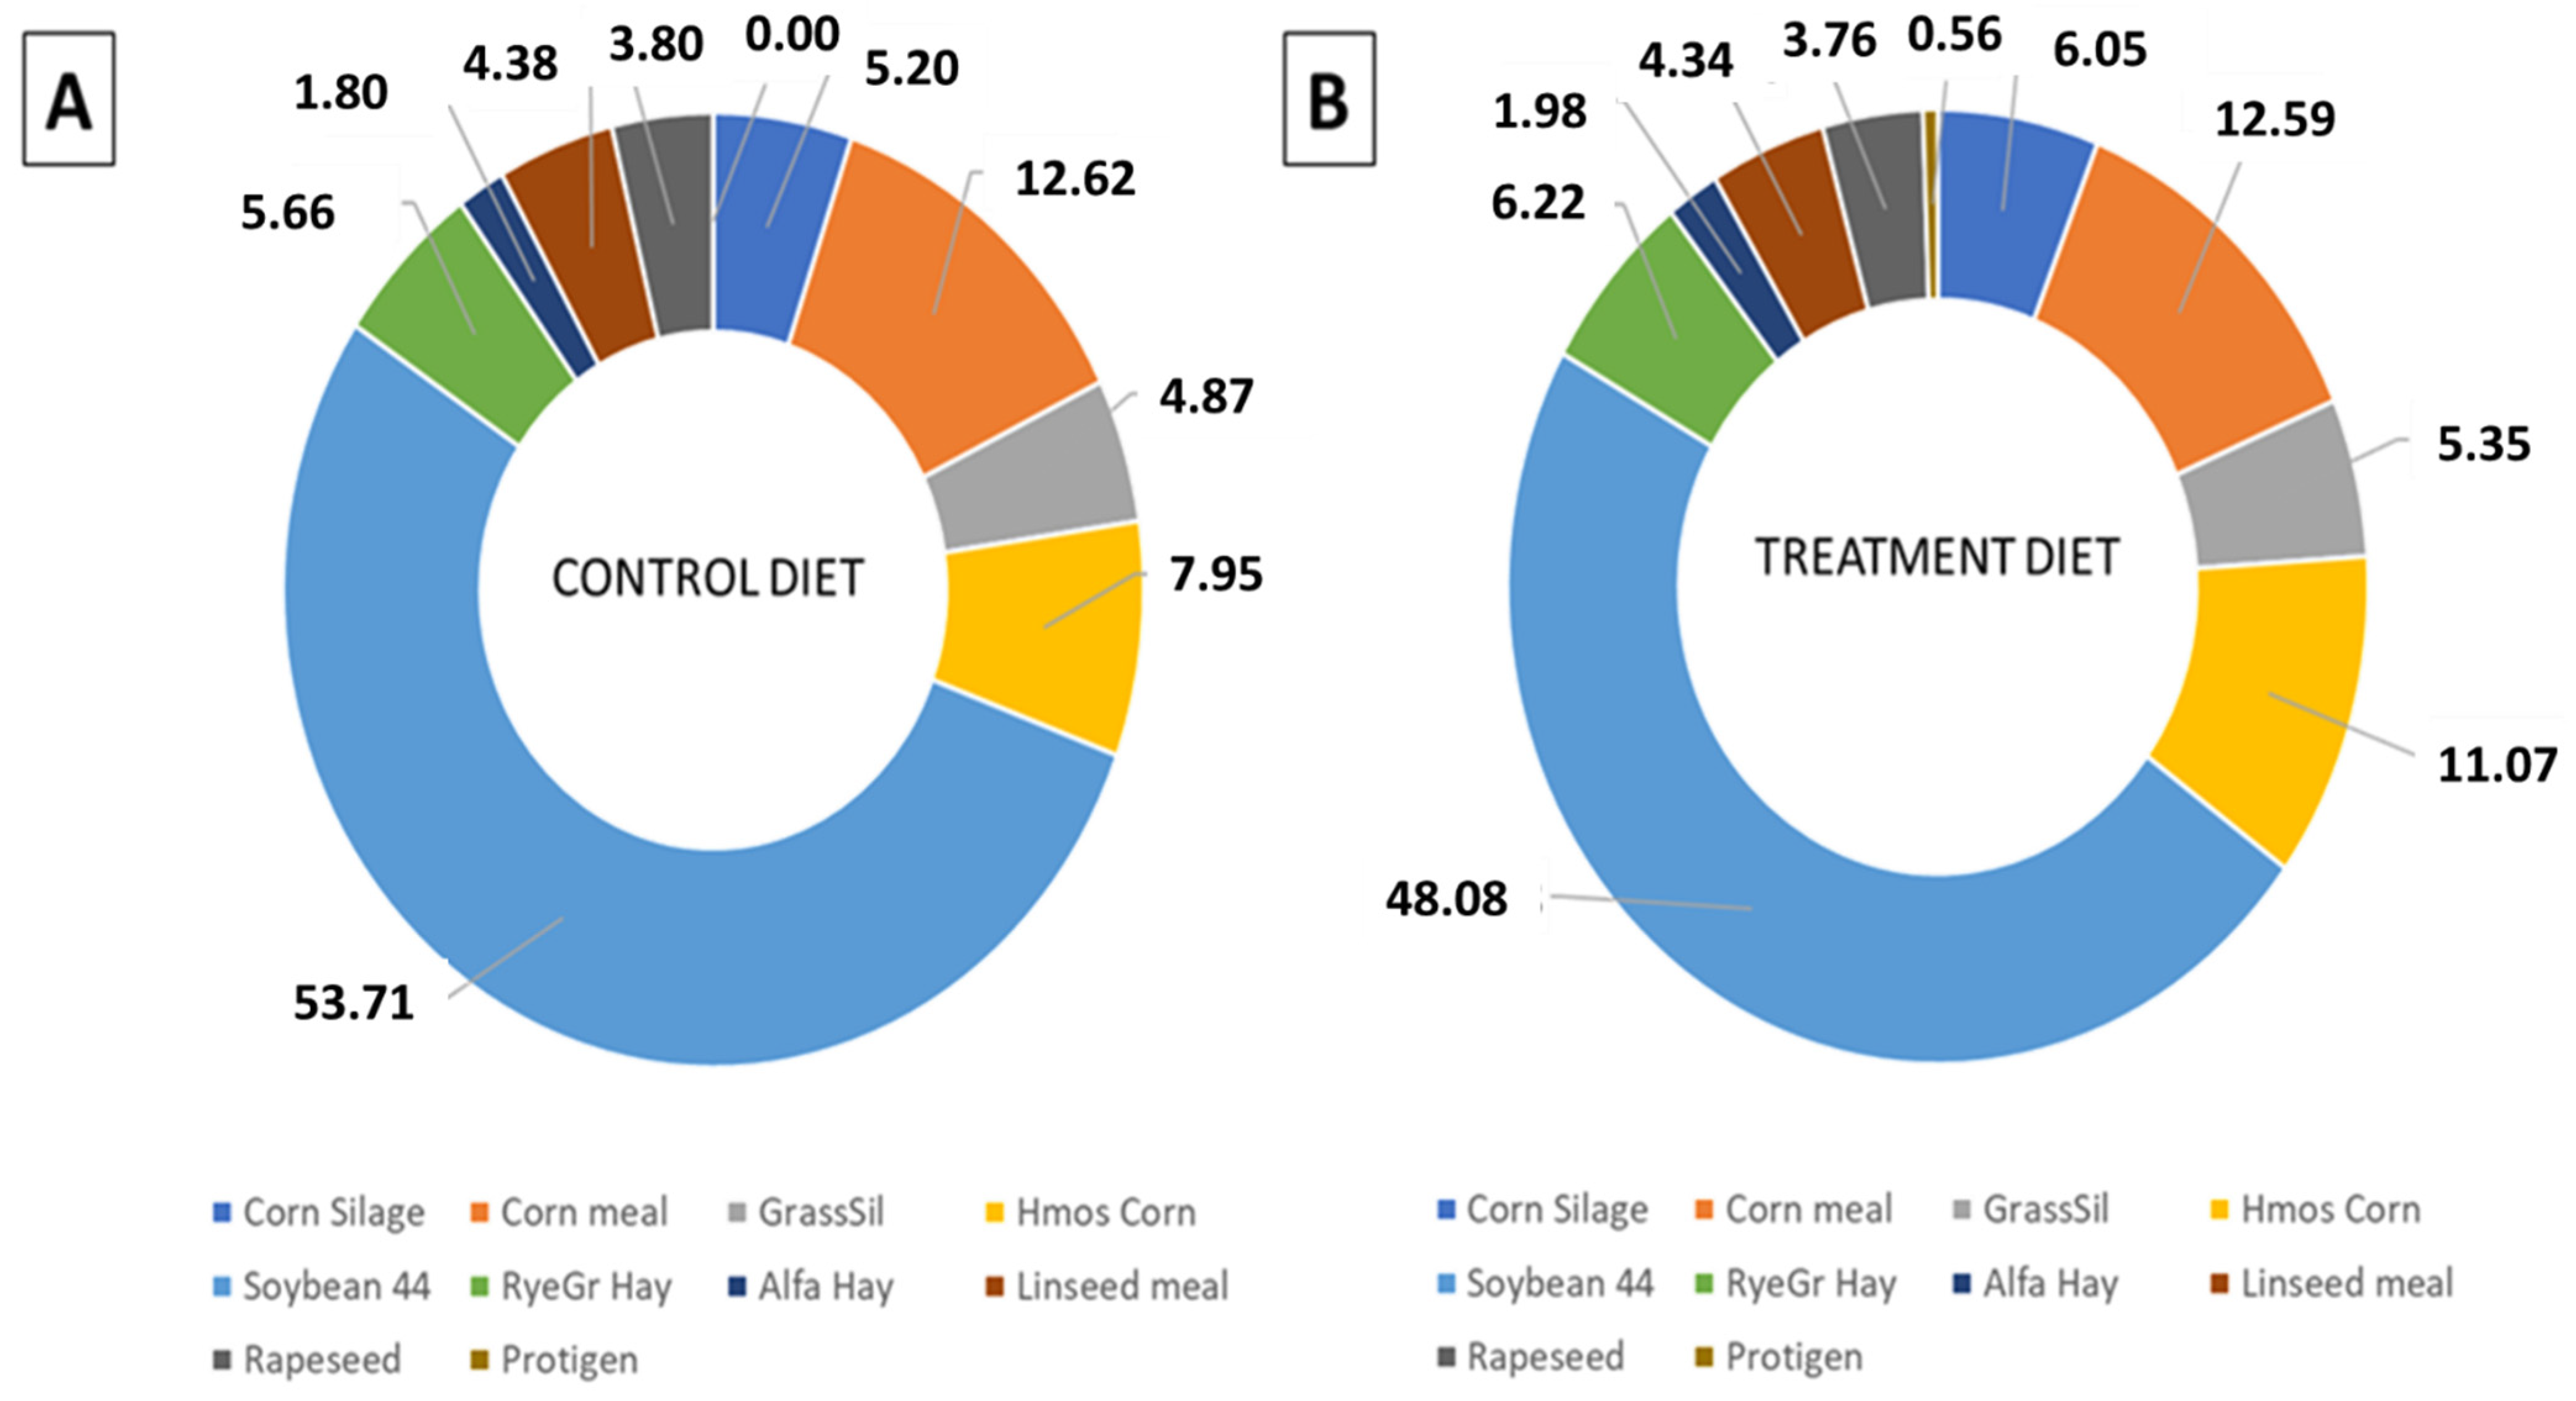
3.2. Characteristics of the Diets, Feces and Digestibility of the Feeds
3.3. Environmental Impact: Carbon Footprint of the Feed (CFP) and Predicted Methane (CH4) Production
4. Conclusions
Supplementary Materials
Author Contributions
Funding
Institutional Review Board Statement
Data Availability Statement
Conflicts of Interest
References
- United Nations, Department of Economic and Social Affairs, Population Division. World Population Prospects 2019; Comprehensive Tables (ST/ESA/SER.A/426); United Nations, Department of Economic and Social Affairs, Population Division: New York, NY, USA, 2019; Volume I. [Google Scholar]
- Georganas, A.; Giamouri, E.; Pappas, A.C.; Papadomichelakis, G.; Galliou, F.; Manios, T.; Tsiplakou, E.; Fegeros, K.; Zervas, G. Bioactive Compounds in Food Waste: A Review on the Transformation of Food Waste to Animal Feed. Foods 2020, 9, 291. [Google Scholar] [CrossRef] [Green Version]
- Takiya, C.S.; Ylioja, C.M.; Bennett, A.; Davidson, M.J.; Sudbeck, M.; Wickersham, T.A.; Vandehaar, M.J.; Bradford, B.J. Feeding Dairy Cows With “Leftovers” and the Variation in Recovery of Human-Edible Nutrients in Milk. Front. Sustain. Food Syst. 2019, 3, 114. [Google Scholar] [CrossRef]
- Capper, J.L.; Cady, R.A. The effects of improved performance in the U.S. dairy cattle industry on environmental impacts between 2007 and 2017. J. Anim. Sci. 2020, 1, skz291. [Google Scholar] [CrossRef]
- Wilkinson, J.; Garnsworthy, P. Impact of diet and fertility on greenhouse gas emissions and nitrogen efficiency of milk production. Livestock 2017, 22, 140–144. [Google Scholar] [CrossRef]
- Foley, J.A.; Asner, G.P.; Costa, M.H.; Coe, M.T.; DeFries, R.; Gibbs, H.K.; Howard, E.A.; Olson, S.; Patz, J.; Ramankutty, N.; et al. Amazonia revealed: Forest degradation and loss of ecosystem goods and services in the Amazon Basin. Front. Ecol. Environ. 2007, 5, 25–32. [Google Scholar] [CrossRef]
- da Silva, V.P.; Van der Werf, H.M.G.; Spies, A.; Soares, S.R. Variability in environmental impacts of Brazilian soybean according to crop production and transport scenarios. J. Environ. Manag. 2010, 91, 1831–1839. [Google Scholar] [CrossRef]
- Salami, S.A.; Moran, C.A.; Warren, H.E.; Taylor-Pickard, J. Meta-analysis and sustainability of feeding slow-release urea in dairy production. PLoS ONE 2021, 16, e0246922. [Google Scholar] [CrossRef]
- Calomeni, G.D.; Gardinal, R.; Venturelli, B.C.; de Freitas, J.E., Jr.; Vendramini, T.H.A.; Takiya, C.; de Souza, H.N.; Rennó, F.P. Effects of polymer-coated slow-release urea on performance, ruminal fermentation, and blood metabolites in dairy cows. Rev. Bras. Zootec. 2015, 44, 327–334. [Google Scholar] [CrossRef] [Green Version]
- Santiago, B.T.; Villela, S.D.J.; Leonel, F.d.P.; Zervoudakis, J.T.; Araujo, R.P.; Machado, H.V.N. Slow-release urea in diets for lactating crossbred cows. Rev. Bras. Zootec. 2015, 44, 193–199. [Google Scholar] [CrossRef] [Green Version]
- Owens, F.; Qi, S.; Sapienza, D. Invited Review: Applied protein nutrition of ruminants. Current status and future directions. Prof. Anim. Sci. 2014, 30, 150–179. [Google Scholar] [CrossRef]
- Kertz, A. Urea feeding to dairy cattle: A historical perspective and review. Prof. Anim. Sci. 2010, 26, 257–272. [Google Scholar] [CrossRef]
- Sinclair, L.; Blake, C.; Griffin, P.; Jones, G. The partial replacement of soyabean meal and rapeseed meal with feed grade urea or a slow-release urea and its effect on the performance, metabolism and digestibility in dairy cows. Animal 2012, 6, 920–927. [Google Scholar] [CrossRef] [PubMed] [Green Version]
- Sgoifo Rossi, C.A.; Compiani, R.; Baldi, G.; Vandoni, S.; Agovino, M. Effect of a source of sustained-release non-protein nitrogen on beef cattle. In Proceedings of the European Association of Animal Production (EAAP) 3rd Annual Meeting, Bratislava, Slovakia, 2012. [Google Scholar]
- Salami, S.A.; Moran, C.A.; Warren, H.E.; Taylor-Pickard, J. A Meta-Analysis of the Effects of Slow-Release Urea Supplementation on the Performance of Beef Cattle. Animals 2020, 10, 657. [Google Scholar] [CrossRef] [Green Version]
- Inostroza, J.F.; Shaver, R.D.; Cabrera, V.E.; Tricárico, J.M. Effect of Diets Containing a Controlled-Release Urea Product on Milk Yield, Milk Composition, and Milk Component Yields in Commercial Wisconsin Dairy Herds and Economic Implications. Prof. Anim. Sci. 2010, 26, 175–180. [Google Scholar] [CrossRef]
- Kowalski, Z.M.; Andrieu, S.; Micek, P. On farm impact: Optigen® in diets fed high yielding dairy cows. In Proceedings of the Alltech’s 23rd Annual Symposium, Lexington, KY, USA, 20–23 May 2007; Lyons, T.P., Jacques, K.A., Eds.; Alltech: Nicholasville, KY, USA, 2010. [Google Scholar]
- Cherdthong, A.; Wanapat, M. Development of urea products as rumen slow-release feed for ruminant production: A review. Aust. J. Basic Appl. Sci. 2010, 4, 2232–2241. [Google Scholar]
- National Research Council. Nutrient Requirements of Dairy Cattle: Seventh Revised Edition, 2001; The National Academies: Washington, DC, USA, 2001. [Google Scholar]
- Tyrrell, H.F.; Reid, J.T. Prediction of the energy value of cow’s milk. J. Dairy Sci. 1965, 48, 1215–1223. [Google Scholar] [CrossRef]
- Edmonson, A.J.; Lean, I.J.; Weaver, L.D.; Farver, T.; Webster, G. A body condition scoring chart for Holstein Dairy Cows. J. Dairy Sci. 1989, 72, 68–78. [Google Scholar] [CrossRef]
- Ferguson, J.D.; Galligan, D.T.; Thomsen, N. Principal descriptors of body condition score in Holstein cows. J. Dairy Sci. 1994, 7, 2695–2703. [Google Scholar] [CrossRef]
- Hristov, A.N.; Oh, J.; Firkins, J.L.; Dijkstra, J.; Kebreab, E.; Waghorn, G.; Makkar, H.P.S.; Adesogan, A.T.; Yang, W.; Lee, C.; et al. Special topics—Mitigation of methane and nitrous oxide emissions from animal operations: I. A review of enteric methane mitigation options. J. Anim. Sci. 2013, 91, 5045–5069. [Google Scholar] [CrossRef] [Green Version]
- Gislon, G.; Bava, L.; Colombini, S.; Zucali, M.; Crovetto, G.M.; Sandrucci, A. Looking for high-production and sustainable diets for lactating cows: A survey in Italy. J. Dairy Sci. 2020, 103, 4863–4873. [Google Scholar] [CrossRef]
- Appuhamy, J.A.; France, J.; Kebreab, E. Models for predicting enteric methane emissions from dairy cows in North America, Europe, and Australia and New Zealand. Glob. Chang. Biol. 2016, 22, 3039–3056. [Google Scholar] [CrossRef]
- Hart, K.J.; Jones, H.G.; Waddams, K.E.; Worgan, H.J.; Zweifel, B.; Newbold, C.J. An Essential Oil Blend Decreases Methane Emissions and Increases Milk Yield in Dairy Cows. Open J. Anim. Sci. 2019, 9, 259–267. [Google Scholar] [CrossRef] [Green Version]
- Tikofsky, J.; Harrison, G.A. Optigen II: Improving the efficiency of nitrogen utilization in the dairy cow. p. 373 in Nutritional Biotechnology in the Feed and Food Industrie. In Proceedings of the Alltech’s 23rd Annual Symposium, Lexington, KY, USA, 20–23 May 2007; Lyons, T.P., Jacques, K.A., Eds.; Allte: Nicholasville, KY, USA. [Google Scholar]
- Broderick, G.A.; Reynal, S.M. Effect of source of rumen-degraded protein on production and ruminal metabolism in lactating dairy cows. J. Dairy Sci. 2009, 92, 2822. [Google Scholar] [CrossRef]
- Libera, K.; Szumacher-Strabel, M.; Vazirigohar, M.; Zieliński, W.; Lukow, R.; Wysocka, K.; Kołodziejski, P.; Lechniak, D.; Varadyova, Z.; Patra, A.; et al. Effects of feeding urea-treated triticale and oat grain mixtures on ruminal fermentation, microbial population, and milk production performance of midlactation dairy cows. Ann. Anim. Sci. 2021, 21, 1007–1025. [Google Scholar] [CrossRef]
- Galo, E.; Emanuele, S.M.; Sniffen, C.J.; White, J.H.; Knapp, J.R. Effects of a polymer-coated urea product on nitrogen metabolism in lactating Holstein dairy cattle. J. Dairy Sci. 2003, 86, 2154. [Google Scholar] [CrossRef] [Green Version]
- Giallongo, F.; Hristov, A.N.; Oh, J.; Frederick, T.; Weeks, H.; Werner, J.; Lapierre, H.; Patton, R.A.; Gehman, A.; Parys, C. Effects of slow-release urea and rumen-protected methionine and histidine on performance of dairy cows. J. Dairy Sci. 2015, 98, 3292–3308. [Google Scholar] [CrossRef] [PubMed]
- Hallajian, S.; Fakhraei, J.; Yarahamdi, H.M.; Khorshidi, K.J. Effects of replacing soybean meal with slow-release urea on milk production of holstein dairy cows. S. Afr. J. Anim. Sci. 2021, 51, 53–64. [Google Scholar] [CrossRef]
- Westwood, C.T.; Lean, I.J.; Garvin, J.K. Factors influencing fertility of Holstein dairy cows: A multivariate description. J. Dairy Sci. 2000, 85, 3225–3237. [Google Scholar] [CrossRef] [Green Version]
- Neal, K.; Eun, J.S.; Young, A.J.; Mjoun, K.; Hall, J.O. Feeding protein supplements in alfalfa hay-based lactation diets improves nutrient utilization, lactational performance, and feed efficiency of dairy cows. J. Dairy Sci. 2014, 97, 7716–7728. [Google Scholar] [CrossRef] [Green Version]
- Lean, I.; Celi, P.; Raadsma, H.; Mcnamara, J.; Rabiee, A. Effects of dietary crude protein on fertility: Meta-analysis and meta-regression. Anim. Feed Sci. Tech. 2012, 171, 31–42. [Google Scholar] [CrossRef]
- Butler, W.R.; Calaman, J.J.; Beam, S.W. Plasma and milk urea nitrogen in relation to pregnancy rate in lactating dairy cattle. J. Anim. Sci. 1996, 74, 858–865. [Google Scholar] [CrossRef] [Green Version]
- Sinclair, L.A. Rate of nitrogen and energy release in the rumen and effects on feed utilisation and animal performance. In Gut Efficiency; The Key Ingredient in Ruminant Production; Andrieu, S., Wilde, D., Eds.; Wageningen Academic Publishers: Wageningen, The Netherlands, 2008; pp. 61–78. [Google Scholar]
- Russell, J.B.; O’Connor, J.D.; Fox, D.G.; Van Soest, P.J.; Sniffen, C.J. A net carbohydrate and protein system for evaluating cattle diets. 1. Ruminal fermentation. J. Anim. Sci. 1992, 70, 3551–3561. [Google Scholar] [CrossRef] [PubMed]
- Hackmann, T.J.; Firkins, J.L. Maximizing efficiency of rumen microbial protein production. Front Microbiol. 2015, 15, 465. [Google Scholar] [CrossRef] [PubMed] [Green Version]
- Geron, L.J.V.; Garcia, J.; de Aguiar, S.C.; da Costa, F.G.; da Silva, A.P.; Neto, E.L.S.; de Carvalho, J.T.H.; Roberto, L.S.; Coelho, K.S.M.; Santos, I.S. Effect of slow-release urea in sheep feed on nitrogen balance. Semin. Ciências Agrárias 2016, 39, 683. [Google Scholar] [CrossRef] [Green Version]
- Zanten van, H.H.; Bikker, P.; Mollenhorst, H.; Meerburg, B.G.; de Boer, I.J. Environmental impact of replacing soybean meal with rapeseed meal in diets of finishing pigs. Animal 2015, 9, 1866–1874. [Google Scholar] [CrossRef] [PubMed] [Green Version]
- Alipour, D.; Saleem, A.M.; Sanderson, H.; Brand, T.; Santos, L.V.; Mahmoudi-Abyane, M. Effect of combinations of feed-grade urea and slow-release urea in a finishing beef diet on fermentation in an artificial rumen system. Transl. Anim. Sci. 2020, 4, 839–847. [Google Scholar] [CrossRef]
- Rebelo, L.R.; Luna, I.C.; Messana, J.D.; Araujo, R.C.; Simioni, T.A.; Granja-Salcedo, Y.T. Effect of replacing soybean meal with urea or encapsulated nitrate with or without elemental sulfur on nitrogen digestion and methane emissions in feedlot cattle. Anim. Feed Sci. Technol. 2019, 257, 1142. [Google Scholar] [CrossRef]

| Feed, % as Fed | Control | Treatment |
|---|---|---|
| Corn Silage | 50.56 | 52.33 |
| Corn meal | 11.39 | 10.12 |
| Grass Silage | 8.43 | 8.24 |
| High-moisture Corn | 6.74 | 8.35 |
| Soybean meal 44% CP 1 | 6.54 | 5.21 |
| RyeGrass Hay | 5.84 | 5.72 |
| Alfalfa Hay | 4.20 | 4.11 |
| Linseed meal | 2.91 | 2.57 |
| Rapeseed meal | 1.82 | 1.60 |
| Min Mix | 1.57 | 1.54 |
| Protigen | 0.00 | 0.22 |
| Analysis, % of d.m. 2 in the TMR | ||
| d.m., % | 54.81 | 53.77 |
| Energy, Mcal/kg d.m. | 1.62 | 1.62 |
| CP 1 | 15.02 | 15.00 |
| RDP 3, % on CP | 62.69 | 65.33 |
| RUP 4, % on CP | 37.31 | 34.67 |
| Sol CP 5, % on CP | 28.83 | 34.40 |
| Sol CP, % on RDP | 45.98 | 52.66 |
| Sugars | 3.11 | 2.97 |
| Starch | 27.93 | 28.25 |
| NDF | 34.71 | 35.33 |
| ADF | 20.22 | 20.48 |
| ADL | 3.93 | 3.98 |
| Fat | 2.90 | 2.89 |
| Ca total | 0.84 | 0.85 |
| p total | 0.36 | 0.35 |
| Group | SEM | p-Value | ||
|---|---|---|---|---|
| Control | Treatment | |||
| Production Performance | ||||
| Milk yield, L/head/day | 39.34 | 40.89 | 0.13 | <0.0001 |
| ECM 2, kg | 43.20 | 44.87 | 0.37 | 0.0017 |
| DMI 3, kg/head/day | 24.69 | 23.92 | 0.04 | <0.0001 |
| FCR 4 | 1.59 | 1.70 | 0.004 | <0.0001 |
| BCS 4 | ||||
| December, week 3 | 2.87 | 2.911 | 0.03 | 0.351 |
| January, week 7 | 3.02 | 3.06 | 0.03 | 0.193 |
| February, week 12 | 3.17 | 3.18 | 0.03 | 0.852 |
| March, week 17 | 3.16 | 3.12 | 0.03 | 0.181 |
| Reproductive Performance | ||||
| Days open | 101.46 | 100.10 | 1.28 | 0.454 |
| Services to pregnancy | 2.08 | 1.97 | 0.09 | 0.402 |
| December, Week 3 | January, Week 7 | February, Week 12 | March, Week 17 | |
|---|---|---|---|---|
| Fat, % | ||||
| Control | 3.81 | 3.82 | 3.84 | 3.84 |
| Treatment | 3.84 | 3.80 | 3.85 | 3.86 |
| p-value | 0.720 | 0.786 | 0.901 | 0.864 |
| Proteins, % | ||||
| Control | 3.67 | 3.69 | 3.67 | 3.65 |
| Treatment | 3.74 | 3.66 | 3.65 | 3.66 |
| p-value | 0.234 | 0.535 | 0.847 | 0.852 |
| Urea, mg/100 mL (mmol/L) | ||||
| Control | 21.45 (3.560) | 23.13 (3.839) | 22.28 (3.698) | 22.29 (3.700) |
| Treatment | 21.01 (3.487) | 23.56 (3.910) | 22.31 (3.703) | 22.96 (3.811) |
| p-value | 0.471 | 0.479 | 0.486 | 0.274 |
| Lactose, % | ||||
| Control | 4.82 | 4.83 | 4.84 | 4.82 |
| Treatment | 4.83 | 4.82 | 4.84 | 4.86 |
| p-value | 0.533 | 0.61 | 0.886 | 0.061 |
| Somatic cells, x.000 | ||||
| Control | 426.57 | 488.79 | 496.29 | 470.56 |
| Treatment | 421.02 | 480.53 | 488.78 | 463.42 |
| p-value | 0.957 | 0.936 | 0.942 | 0.945 |
| Fat yield, kg/day | ||||
| Control | 1.517 | 1.563 | 1.497 | 1.510 |
| Treatment | 1.590 | 1.609 | 1.552 | 1.569 |
| p-value | 0.104 | 0.300 | 0.224 | 0.190 |
| Protein yield, kg/day | ||||
| Control | 1.464 | 1508 | 1.432 | 1.436 |
| Treatment | 1.550 | 1.553 | 1.476 | 1.491 |
| p-value | 0.031 | 0.258 | 0.272 | 0.1605 |
| Parameter | December | January | February | March | April |
|---|---|---|---|---|---|
| d.m. 1, % | 54.91 | 54.95 | 54.85 | 54.65 | 54.70 |
| Ash, % d.m. | 9.20 | 9.76 | 9.69 | 9.23 | 9,76 |
| Crude protein, % d.m. | 15.96 | 16.21 | 16.20 | 15.83 | 16.17 |
| Fats, % d.m. | 3.00 | 2.99 | 3.15 | 3.00 | 3.02 |
| NDF, % d.m. | 36.35 | 36.65 | 36.20 | 36.43 | 36,68 |
| Cellulose, % d.m. | 18.74 | 18.77 | 19.27 | 18.82 | 18,71 |
| Lignin, % d.m. | 3.92 | 3.89 | 3.89 | 3.93 | 3.94 |
| Hemicellulose, % d.m. | 13.70 | 14.00 | 13.05 | 13.68 | 14.03 |
| Starch, % d.m. | 28.00 | 28.15 | 28.07 | 28.15 | 28.19 |
| Sugars and pectins, % d.m. | 7.49 | 6.25 | 6.70 | 7.37 | 6.20 |
| Parameter | December | January | February | March | April |
|---|---|---|---|---|---|
| d.m. 1, % | 53.79 | 53.89 | 53.78 | 54.63 | 54.55 |
| Ash, % d.m. | 9.10 | 9.80 | 9.55 | 9.19 | 9.72 |
| Crude protein, % d.m. | 16.00 | 16.19 | 16.35 | 15.86 | 16.05 |
| Fats, % d.m. | 2.88 | 3.05 | 3.05 | 3.00 | 3.03 |
| NDF, % d.m. | 36.55 | 36.25 | 36.10 | 36.55 | 36.80 |
| Cellulose, % d.m. | 18.80 | 18.46 | 18.44 | 18.82 | 18.73 |
| Lignin, % d.m. | 3.85 | 3.95 | 3.90 | 3.93 | 3.89 |
| Hemicellulose, % d.m. | 13.90 | 13.85 | 13.77 | 13.80 | 14.17 |
| Starch, % d.m. | 28.38 | 28.42 | 28.25 | 28.05 | 28.21 |
| Sugars and pectins, % d.m. | 7.10 | 6.30 | 6.70 | 7.35 | 6.20 |
| Parameter | December | January | February | March | April |
|---|---|---|---|---|---|
| Moisture, % | 86.97 | 86.88 | 86.60 | 86.90 | 87.03 |
| Dry matter, % | 13.03 | 13.13 | 13.40 | 13.10 | 12.97 |
| Ash, % d.m. | 9.27 | 9.47 | 8.97 | 9.38 | 9.25 |
| Crude protein, % d.m. | 17.00 | 17.05 | 17.15 | 17.27 | 17.00 |
| Fats, % d.m. | 2.75 | 2.55 | 2.57 | 2.78 | 2.64 |
| NDF, % d.m. | 61.65 | 61.63 | 61.50 | 61.47 | 61.67 |
| Cellulose, % d.m. | 35.93 | 36.28 | 35.30 | 35.70 | 35.81 |
| Lignin, % d.m. | 11.21 | 11.12 | 11.25 | 11.28 | 11.37 |
| Hemicellulose, % d.m. | 14.51 | 14.23 | 14.95 | 14.57 | 14.50 |
| Starch, % d.m. | 5.90 | 5.91 | 6.11 | 5.68 | 6.03 |
| Sugars and pectins, % d.m. | 2.44 | 2.40 | 2.71 | 2.42 | 2.41 |
| Parameter | December | January | February | March | April |
|---|---|---|---|---|---|
| Moisture, % | 86.84 | 87.25 | 86.00 | 86.90 | 87.03 |
| d.m., % | 13.16 | 12.75 | 14.00 | 13.10 | 12.96 |
| Ash, % d.m. | 9.52 | 10.25 | 9.25 | 10.03 | 10.03 |
| Crude protein, % d.m. | 16.46 | 16.45 | 16.68 | 16.87 | 16.60 |
| Fats, % d.m. | 2.70 | 2.89 | 2.63 | 2.85 | 2.82 |
| NDF, % d.m. | 62.12 | 60.76 | 61.70 | 60.52 | 60.91 |
| Cellulose, % d.m. | 35.75 | 34.85 | 34.26 | 34.22 | 35.01 |
| Lignin, % d.m. | 11.35 | 11.58 | 11.93 | 11.28 | 11.37 |
| Hemicellulose, % d.m. | 14.93 | 14.34 | 15.42 | 15.02 | 14.53 |
| Starch, % d.m. | 5.80 | 6.25 | 6.00 | 6.20 | 6.18 |
| Sugars and pectins, % d.m. | 2.40 | 2.41 | 2.75 | 2.54 | 2.47 |
| Month | December | January | February | March | April | Average | P(g) 1 | P(m) 1 | P(g * m) 1 |
|---|---|---|---|---|---|---|---|---|---|
| Group | Ash, % | ||||||||
| Control | 64.81 | 66.11 | 67.92 | 64.56 | 67.14 | 66.10 | 0.069 | 0.010 | 0.528 |
| Treatment | 64.52 | 64.36 | 68.35 | 61.91 | 64.68 | 64.77 | |||
| Sem | 1.04 | 1.04 | 1.04 | 1.04 | 1.04 | 0.46 | |||
| p-value | 0.848 | 0.264 | 0.775 | 0.103 | 0.127 | 0.069 | |||
| Crude Protein, % | |||||||||
| Control | 62.79 | 63.25 | 63.42 | 61.97 | 63.56 | 63.00 | 0.012 | 0.201 | 0.763 |
| Treatment | 65.06 | 65.37 | 66.66 | 62.90 | 64.59 | 64.92 | |||
| Sem | 0.99 | 0.99 | 0.99 | 0.99 | 0.99 | 0.44 | |||
| p-value | 0.139 | 0.164 | 0.044 | 0.524 | 0.483 | 0.012 | |||
| Fats, % | |||||||||
| Control | 66.48 | 70.27 | 71.94 | 67.86 | 69.42 | 69.20 | 0.621 | 0.018 | 0.324 |
| Treatment | 69.20 | 68.02 | 72.32 | 65.36 | 68.91 | 68.76 | |||
| Sem | 1.33 | 1.34 | 1.34 | 1.34 | 1.34 | 0.60 | |||
| p-value | 0.184 | 0.266 | 0.848 | 0.218 | 0.794 | 0.621 | |||
| NDF 2, % | |||||||||
| Control | 40.77 | 41.27 | 41.29 | 41.18 | 41.71 | 41.24 | 0.039 | 0.821 | 0.952 |
| Treatment | 41.32 | 42.89 | 44.16 | 42.26 | 43.32 | 42.99 | |||
| Sem | 1.16 | 1.16 | 1.16 | 1.16 | 1.16 | 1.16 | |||
| p-value | 0.368 | 0.349 | 0.113 | 0.528 | 0.351 | 0.039 | |||
| Cellulose, % | |||||||||
| Control | 33.02 | 32.47 | 36.59 | 33.88 | 33.66 | 33.93 | 0.033 | 0.234 | 0.999 |
| Treatment | 35.52 | 35.64 | 39.30 | 36.57 | 36.01 | 36.61 | |||
| Sem | 1.71 | 1.71 | 1.71 | 1.71 | 1.71 | 1.71 | |||
| p-value | 0.329 | 0.221 | 0.292 | 0.295 | 0.357 | 0.033 | |||
| Hemicellulose, % | |||||||||
| Control | 63.00 | 64.52 | 60.39 | 62.87 | 64.17 | 62.99 | 0.470 | 0.343 | 0.783 |
| Treatment | 63.47 | 64.76 | 63.41 | 62.04 | 64.88 | 63.71 | |||
| Sem | 1.54 | 1.54 | 1.54 | 1.54 | 1.54 | 2.76 | |||
| p-value | 0.833 | 0.911 | 0.193 | 0.710 | 0.746 | 0.470 | |||
| Starch, % | |||||||||
| Control | 92.64 | 92.66 | 92.47 | 92.97 | 92.58 | 92.66 | 0.874 | 0.456 | 0.045 |
| Treatment | 93.07 | 92.50 | 93.06 | 92.29 | 92.50 | 92.68 | |||
| Sem | 0.18 | 0.18 | 0.18 | 0.18 | 0.18 | 0.08 | |||
| p-value | 0.132 | 0.550 | 0.05 | 0.028 | 0.776 | 0.874 | |||
| Sugars and Pectins, % | |||||||||
| Control | 88.65 | 86.58 | 85.88 | 88.58 | 86.54 | 87.25 | 0.903 | 0.003 | 0.753 |
| Treatment | 88.53 | 87.00 | 86.57 | 87.07 | 86.36 | 87.29 | |||
| Sem | 0.53 | 0.53 | 0.53 | 0.53 | 0.53 | 0.23 | |||
| p-value | 0.883 | 0.583 | 0.382 | 0.441 | 0.817 | 0.903 | |||
| Group | SEM | p-Value | ||
|---|---|---|---|---|
| Control | Treatment | |||
| Diet CFP 1 | ||||
| CO2 eq 2 g/DMI (kg/DMI) | 12484.00 (12.48) | 10764.00 (10.76) | 22.45 (0.22) | <0.0001 |
| CO2 eq g/L milk | 320.53 | 266.40 | 0.79 | <0.0001 |
| Predicted enteric CH4 3 Production | ||||
| CH4, g/d | 475.28 | 460.45 | 0.90 | <0.0001 |
| CH4, g/L milk | 12.20 | 11.30 | 0.03 | <0.0001 |
Publisher’s Note: MDPI stays neutral with regard to jurisdictional claims in published maps and institutional affiliations. |
© 2021 by the authors. Licensee MDPI, Basel, Switzerland. This article is an open access article distributed under the terms and conditions of the Creative Commons Attribution (CC BY) license (https://creativecommons.org/licenses/by/4.0/).
Share and Cite
Grossi, S.; Compiani, R.; Rossi, L.; Dell’Anno, M.; Castillo, I.; Sgoifo Rossi, C.A. Effect of Slow-Release Urea Administration on Production Performance, Health Status, Diet Digestibility, and Environmental Sustainability in Lactating Dairy Cows. Animals 2021, 11, 2405. https://doi.org/10.3390/ani11082405
Grossi S, Compiani R, Rossi L, Dell’Anno M, Castillo I, Sgoifo Rossi CA. Effect of Slow-Release Urea Administration on Production Performance, Health Status, Diet Digestibility, and Environmental Sustainability in Lactating Dairy Cows. Animals. 2021; 11(8):2405. https://doi.org/10.3390/ani11082405
Chicago/Turabian StyleGrossi, Silvia, Riccardo Compiani, Luciana Rossi, Matteo Dell’Anno, Israel Castillo, and Carlo Angelo Sgoifo Rossi. 2021. "Effect of Slow-Release Urea Administration on Production Performance, Health Status, Diet Digestibility, and Environmental Sustainability in Lactating Dairy Cows" Animals 11, no. 8: 2405. https://doi.org/10.3390/ani11082405
APA StyleGrossi, S., Compiani, R., Rossi, L., Dell’Anno, M., Castillo, I., & Sgoifo Rossi, C. A. (2021). Effect of Slow-Release Urea Administration on Production Performance, Health Status, Diet Digestibility, and Environmental Sustainability in Lactating Dairy Cows. Animals, 11(8), 2405. https://doi.org/10.3390/ani11082405