
Contrasting Responses of Guar Genotypes Shed Light on Multiple Component Traits of Salinity Tolerance Mechanisms


1
U.S. Salinity Lab (USDA-ARS), 450 W Big Springs Road, Riverside, CA 92507, USA
2
College of Natural and Agricultural Sciences, University of California Riverside, 900 University Avenue, Riverside, CA 92521, USA
3
Department of Plant and Environmental Sciences, New Mexico State University, Las Cruces, NM 88003, USA
*
Authors to whom correspondence should be addressed.
Agronomy 2021, 11(6), 1068; https://doi.org/10.3390/agronomy11061068
Submission received: 21 April 2021
/
Revised: 18 May 2021
/
Accepted: 23 May 2021
/
Published: 26 May 2021
(This article belongs to the Special Issue New Crops for Arid Regions)
Abstract
:Guar (Cyamopsis tetragonoloba (L.) Taub.) is a legume crop, and gum derived from its seeds has various industrial applications. Due to its tolerance to various abiotic stresses, guar can be grown under water-deficit or high-salinity conditions. In this investigation, four diverse guar genotypes that performed at a similar level in field conditions were evaluated in a salinity experiment in the greenhouse lysimeter system. Based on the salt tolerance index (STI) for shoot biomass, root biomass, shoot length, and root length, Matador and PI 268229 were classified as salt-tolerant, and PI 340261 and PI 537281 as salt-sensitive. Leaf Na concentrations were 4- to 5.5-fold higher, and leaf Cl concentrations were 1.6- to 1.9-fold higher in salt-sensitive lines than salt-tolerant lines under salinity. The strong associations between the leaf K concentrations under salinity compared to the control (K-salinity/K-control) ratio and STI for stem and root length advocate higher importance of K-salinity/K-control than total leaf K concentrations. The expression analyses of genes involved in Na+ and Cl− transport revealed the importance of different component traits of salinity tolerance mechanisms, such as the exclusion of Na+/Cl− from the root, sequestration of Cl− in root vacuoles, retrieval of Na+/Cl− from xylem during salinity stress, root-to-shoot Na+/Cl− translocation, and K+-Na+ homeostasis.
1. Introduction
Guar is a drought-tolerant legume crop grown for fresh beans for human consumption, forage for animals, and seed to produce guar gum [1,2,3,4,5]. Guar has been mainly grown in South Asian countries, particularly India and Pakistan, but in recent years a limited area has come under guar cultivation in the U.S. for seed production [1,6]. The major area under guar cultivation is for seed production to produce guar gum.
Guar gum is derived from the endosperm of guar seed and comprises of galactomannan polysaccharides. Guar gum is used in various industries, such as food, cosmetics, paper, and pharmaceuticals [7]. A major portion of guar gum is utilized as a gelling agent in the oil and gas industry in the U.S. [4]. The U.S. demand for guar products is mainly met through imports from India, making the U.S. the largest importer of guar products in the world [6]. The domestic production of guar is carried out on a limited scale in the western U.S. Recently, there has been a renewed emphasis on generating region-specific information for guar cultivation in the southwest U.S. [8,9,10,11].
Guar can be an excellent alternate crop under semi-arid climatic conditions, receiving <250 mm annual rainfall [4]. Due to its abiotic stress tolerance, relatively low input needs, and low production cost, it fits well in southwestern U.S. agriculture, which often faces limited water supply due to the declining water availability.
In order to promote domestic production of guar in the U.S., there is a need to study its response to biotic and abiotic stresses in detail. Guar can tolerate heat and dry conditions well [12,13]. Salinity is another abiotic stress that is common in arid agriculture. Salinization of soils is a growing issue worldwide. Thirty-three percent of agricultural land is highly saline and keeps increasing each year [14]. Combined with the use of saline or degraded waters, it highlights the importance of studying mechanisms of salt tolerance in guar. Salt tolerance is multifaceted, and many mechanisms can be responsible for salt tolerance in a plant. Some of these include ion exclusion, compartmentalization, root-to-shoot translocation, and tissue tolerance [15].
Although it is drought-tolerant, guar is afflicted by high salinity. The vegetative growth was reduced above 4.9 dS m−1 and seed yield was reduced above 8.8 dS m−1 [16]. However, one study suggested that some guar lines respond to salt stress with an increase in root biomass and length [17]. Some recent studies have focused on salinity tolerance in guar, showing a range of tolerance in the selected germplasm [18,19,20,21,22,23]. Nevertheless, there is a need to understand the mechanisms of salinity tolerance at the genetic level to identify suitable guar genotypes for domestic cultivation in the U.S.
In our study, we screened four cultivars of guar and compared their responses to salt stress through morphological, physiological, and genetic responses. The aim was to identify genetic factors that contribute to guar’s salt tolerance.
2. Materials and Methods
2.1. Field Evaluations
Four guar genotypes were evaluated in field conditions as part of a replicated guar germplasm evaluation study at Fabian Garcia Plant Science Center in Las Cruces, NM. The genotypes were planted in late June in a randomized complete block design with three replications. A number of plant growth and yield performance parameters were recorded during the growing season and at maturity. The traits studied included biomass, clusters per plant, pods per plant, pods per cluster, total pod weight per plant, pod width, pod length, pod thickness, seeds per pod, seeds per plant, seed weight per plant, 100-seed weight, dry above-ground biomass, seed yield, harvest index, plant height, branch count, plant count per meter, and plant height.
Plant height, canopy width, number of branches per plant, and above-ground dry biomass were measured during the growing season by selecting two plants from each genotype. For seed yield attributing characteristics, single plants were hand-harvested at maturity, oven-dried at a temperature of 55 °C for 2–3 days, and then weighed for dry biomass. The number of clusters per plant and number of pods per plant were counted manually. Five pods were used from each plant to record pod length, width, and thickness at harvest. Then, seeds were removed from the pods and counted with the help of a digital seed counter. The seeds were then weighed to calculate a 100-seed weight (g). For measuring final seed yield and harvest index, plants were harvested from an area of 1 m2 with the help of secateurs. Harvested plants were then oven-dried at a temperature of 55 °C for 2–3 days and then weighed. Dried guar plants were threshed, and seed yield was measured and converted from g m−2 to kg ha−1. Harvest index was calculated by dividing seed weight per m2 to whole plant dry weight per m2.
For the trial in Las Cruces, a Shapiro–Wilks normality check was performed. Afterward, a one-way analysis of variance (ANOVA) was performed on the field data from the four lines.
2.2. Screening for Salinity Tolerance under Greenhouse Conditions
We selected four guar lines that were previously screened for salt tolerance (data not shown). Two salt-tolerant lines (Matador, PI 28699) and two salt-sensitive lines (PI 340261, PI 537281) were selected to contrast their salt stress responses. Seeds were selected and sown in lysimeters at the USDA ARS greenhouse (33.973265 latitude, −117.321158 longitude). Ten seeds were sown for every line, which was later thinned down to 6 plants upon germination. Plants were watered twice a day with the modified half Hoagland’s solution to provide macronutrients for three weeks. The composition of both the half Hoagland and salt treatments can be found in Table 1. After two weeks, saline water treatment was started, while half Hoagland’s solution served as control. Salt treatment was slowly increased over four days to avoid osmotic shock. Leaf and root samples were harvested 48 h after the final increment in salt treatment and were stored at –80 °C for genetic analyses. The remaining plants continued treatment for three weeks. The plants were harvested, their shoots and roots were separated, and their respective lengths were measured. Samples were dried at 70 °C for 96 h. After drying, roots and shoots were weighed and prepared for ion analysis.
2.3. Ion Analysis
Approximately 1 g of leaf and root tissues from each line were ground. Chloride concentrations were determined by the AQ300 discrete analyzer using mercuric thiocyanate reaction in the presence of ferric nitrate [24]. Concentrations of other macro and micronutrients were determined from nitric acid digestions by inductively coupled plasma optical emission spectrometry (ICP-OES, 3300DV, Perkin-Elmer Corp., Waltham, MA, USA).
2.4. Selection of Candidate Genes
Genes commonly associated with salt tolerance were selected for analysis. We obtained sequences of genes of interest from The Arabidopsis Information Resource (TAIR; https://www.arabidopsis.org/; accessed on 8 January 2020). The Arabidopsis gene sequences were used, and the corresponding soybean (Glycine max) sequences were identified (https://phytzome.jgi.doe.gov/pz/potal.html#!search?show=BLAST&method=Org_Gmax; accessed on 8 January 2020). The soybean sequences were further used in NCBI Sequence Read Archive (SRA) Nucleotide BLAST search, utilizing the RNA-Seq data from a previous study [25] (https://blast.ncbi.nlm.nih.gov/blast/Blast.cgi?PROGRAM=blastn&BLAST_PROGRAMS=megaBlast&PAGE_TYPE=BlastSearch&BLAST_SPEC=SRA&DB_GROUP=Exp&NUM_ORG=1&EQ_MENU=SRX4909173; accessed on 8 January 2020) to obtain corresponding guar sequences. The sequence with the highest homology was used for the primer design for each gene (Supplementary Table S1). In addition, primers for three housekeeping genes were designed to be used for normalization.
2.5. Expression Analyses
RNA was extracted from samples using TRIzol® reagent (Invitrogen, Carlsbad, CA, USA) and was purified with DNase I to remove any DNA contamination (Thermo Scientific, Waltham, MA, USA). The RNA samples were then diluted to 5 ng/μL and underwent quantitative reverse transcription–polymerase chain reaction (qRT-PCR). The analysis was performed with the iTaqTM Universal SYBR® Green One-Step Kit in the BioRad CFX96 machine (Bio-Rad Laboratories, Hercules, CA, USA). Each sample consisted of a 10 μL solution of 10 ng total RNA, 0.75 μM each of forward and reverse primers, 5 μL of 2X one-step SYBR® Green Reaction mix, and 0.125 μL iScriptTM Reverse Transcriptase. The PCR program used is as follows: 50 °C for 10 min, 95 °C for 1 min, followed by 40 cycles of 95 °C for 10 s, 57 °C for 30 s, 68 °C for 30 s. Guar elongation factor-1 alpha (EF-1a), Actin 11 (Act11), and glyceraldehyde-3-phosphate dehydrogenase (GAPDH) were used as reference genes in expression analyses [26].
3. Results
3.1. Field Evaluation of Four Guar Genotypes
Four guar varieties: Matador, PI 268229, PI 340261, and PI 537281, were evaluated in the field for various agronomic traits (Table 2). Of these traits, only clusters per plant and branch count after 65 days were statistically significant among varieties. PI 268229 had the most clusters per plant, and PI 340261 had the least number of clusters per plant (Figure 1a). For branch count, Matador had the maximum branch count, and PI 340261 had the minimum branch count (Figure 1b).
3.2. Greenhouse Evaluation of Four Guar Genotypes for Salinity Tolerance
Evaluation of four guar genotypes was carried out under control and salinity conditions in a greenhouse. Under the control condition, shoot and root biomass did not differ among the four genotypes (Figure 2a,b). However, under salinity, Matador and PI 268229 performed significantly better than PI 340261 and PI 537281. PI 340261 was the best performer under the control condition for shoot length, whereas Matador was the worst performer (Figure 2c). PI 268229 was the best performer under control for root length, and Matador was the worst performer. For shoot and root length under salinity, Matador performed the best, and PI 537281 was the poorest performer (Figure 2c,d). Matador and PI 268229 did not show significant changes under salinity compared to control. However, PI 340261 and PI 537281 showed a significant decrease in shoot biomass, shoot length, and root biomass (Figure 2). Root length did not decrease significantly under salinity in any of the genotypes.
Due to inherent variation in genotypes within a species under control condition, the net biomass yield under salinity is not an accurate measure of salinity tolerance of a genotype [27]. Salt tolerance index (STI), which represents performance under saline condition compared to control condition, truly represents salt tolerance of a genotype [28]. Matador and PI 268229 had STI for shoot biomass of 1.35 and 1.58, respectively (Figure 2e). Similarly, Matador and PI 268229 had STI for root biomass of 1.42 and 1.77, respectively (Figure 2e). On the other hand, PI 340261 and PI 537281 had shoot biomass STI of 0.21 and 0.20, respectively, and root biomass STI of 0.20 and 0.27, respectively (Figure 2e). A similar trend was seen for shoot height STI, where Matador and PI 268229 had shoot height STI of 1.23 and 0.80, respectively, whereas PI 340261 and PI 537281, these values were 0.15 and 0.17, respectively (Figure 2f). For root height STI, the values were 1.14, 0.93, 0.79, and 0.77 for Matador, PI 268229, PI 340261, and PI 537281, respectively (Figure 2f).
3.3. Tissue Ion Analysis
Ion toxicity plays a vital role during salinity stress. Leaf Na concentrations under the control condition were similar in four guar varieties, varying from 20.8 mmol kg−1 in PI 268229 to 23.0 mmol kg−1 in Matador (Figure 3a). All four genotypes showed drastic increases in Na concentrations in leaves under salinity compared to control. Leaf Na concentrations were 290.6 and 261.4 mmol kg−1 for Matador and PI 268229, respectively, and 1181.4 and 1424.1 mmol kg−1 for PI 340261 and PI 537281, respectively (Figure 3a). Root Na concentrations were also similar in the four guar varieties under the control condition, ranging from 268.2 for Matador and 337.3 for PI 268229 (Figure 3b). However, under salinity, root Na concentrations were 844.3 and 677.4 mmol kg−1 for Matador and PI 268229, respectively, and 896.1 and 952.4 mmol kg−1 for PI 340261 and PI 537281, respectively (Figure 3b).
Similar to tissue Na concentrations, leaf and root Cl concentrations were comparable in the four guar varieties under the control condition, ranging from 72.3 to 77.5 mmol kg−1 for leaves and 58.6 to 90.0 mmol kg−1 for roots (Figure 3c). However, under salinity, leaf Cl concentrations were 1262.1 and 1146.7 mmol kg−1 for Matador and PI 268229, respectively, and 2010.5 and 2221.1 mmol kg−1 for PI 340261 and PI 537281, respectively (Figure 3c). Root Cl concentrations were slightly higher in PI 340261 and PI 537281 as compared to Matador and PI268229 (Figure 3d).
There was a reduction in tissue K in both leaves and roots under salinity compared to control (Figure 3e). Under control, K concentrations were slightly higher in PI 340261 and PI 537281 as compared to Matador and PI268229. However, under salinity, the four guar genotypes did not show much difference in K concentrations. For root K concentrations, both under control and salinity, the four genotypes had similar concentrations (Figure 3f). Guar genotypes varied significantly in the relative leaf K concentrations under salinity compared to control (K-salinity/K-control). Matador and PI 268229 had leaf K-salinity/K-control ratios of 0.71 and 0.62, respectively, whereas PI 340261 and PI 537281 had leaf K-salinity/K-control ratios of 0.57 and 0.53 (Figure 3e).
Analysis of Ca, Mg, SO4, Zn, Cu, and Fe did not show significant differences between the genotypes with high STI and the genotypes with low STI (Supplementary Table S2).
3.4. Expression Analysis under Salinity
Ten genes known to play important roles during salinity stress in various plants were used to study expression differences under control and salinity in four guar genotypes. These include genes involved in Na+ regulation (SOS1, SOS2, SOS3, NHX1, AKT1, and HKT1) and Cl− regulation (ALMT9, CCC, CLCc, and NPF2.5).
Expression analysis of the roots revealed that among the genes involved in Na+ transport, SOS1, SOS2, and SOS3 were upregulated in Matador, and SOS1, SOS3, AKT1, and HKT1 were upregulated in PI 268229 (Figure 4). None of the genes involved in Na transport were upregulated in roots under salinity compared to control in PI 340261 or PI 537281. All six genes were downregulated in PI 537281 (Figure 4).
Expression analyses of genes involved in Cl− regulation revealed that ALMT9 and NPF2.5 were upregulated under salinity compared to control in Matador, whereas CCC was upregulated in PI 268229 (Figure 5). PI 268229 showed downregulation for CLCc. For PI 340261, all four genes did not show any significant change between control and salinity treatment (Figure 5). CCC, CLCc, and NPF2.5 were significantly downregulated under salinity compared to control in PI 537281 (Figure 5).
4. Discussion
Guar is an important legume forage crop that is rich in proteins. In addition, it is an important source of guar gum, which is used as a thickening agent in various foods, as well as to increase the viscosity of water used to extract oil and natural gas from tight rock formations [4]. Due to its ability to tolerate various abiotic stresses, guar can be successfully grown in water-deficit conditions and/or with degraded waters, which are generally high in salt contents. In this investigation, we aimed at understanding the importance of different component traits regulating salinity tolerance in guar. In a preliminary screen of several guar genotypes, Matador and PI 268229 were found to be relatively tolerant to salinity, whereas PI 340261 and PI 537281 were sensitive to salinity (data not shown). In this study, we conducted a detailed analysis of these genotypes to understand morphological responses and ionic relationships during salinity stress in guar and linked those with underlying genetic determinants.
Field evaluations of four genotypes (Matador, PI 268229, PI 340261, and PI 537281) under non-saline conditions revealed that except for clusters per plant and branch count, these genotypes did not show significant differences. Hence, under a non-saline field environment, the performances of these genotypes were comparable (Table 2).
Greenhouse evaluations of four genotypes irrigated with control water (1.4 dS m−1) showed no significant differences among genotypes for shoot biomass, root biomass, shoot length, and root length (Figure 2). However, under saline irrigation water (13.65 dS m−1), Matador and PI 268229 performed significantly better than PI 340261 and PI 537281 (Figure 2). Shoot biomass STI for Matador, PI 268229, PI340261, and PI 537281 were 1.35, 1.58, 0.21, and 0.20, respectively (Figure 2e). Similarly, root biomass STI for Matador, PI 268229, PI 340261, and PI 537281 were 1.42, 1.77, 0.20, and 0.27, respectively (Figure 2e). Likewise, for height STI, Matador and PI 268229 performed significantly better than PI 340261 and PI 537281 (Figure 2f). Based on this analysis, Matador and PI 268229 were classified as salt-tolerant, and PI 340261 and PI 537281 were classified as salt-sensitive. Although both root and shoot STI were lower in PI 340261 and PI 537281 than Matador and PI 268229, the shoot STI was severely affected (Figure 2f). These observations suggest that shoots are more sensitive to salinity stress as compared to roots. It has been shown earlier that the leaves show ionic toxicity much earlier than roots [29]. Roots were shown to be more tolerant to salinity than shoots as the osmotic balance was maintained by moving photosynthates to stressed roots [30].
In plants, the genotypes that exclude Na+ and Cl− from roots transport less of these ions to the shoots [28]. In our investigation, Na and Cl concentrations increased in all four genotypes under salinity; however, K concentration decreased (Figure 3). Salt-tolerant lines, Matador and PI 268229, maintained low leaf Na and Cl concentrations under salinity compared to the salt-sensitive lines (Figure 3a,c). The relative increases in leaf Na concentrations under salinity compared to control were 12.7- and 12.6-fold in Matador and PI 268229, respectively, whereas these increases were 54.7- and 70.0-fold in PI 340261 and PI 537281, respectively (Figure 4a). Leaf Na concentrations were 4.0- to 5.5-fold higher in salt-sensitive lines compared to salt-tolerant lines under salinity. However, differences in root concentrations between salt-tolerant and salt-sensitive lines were between 1.1- and 1.4-fold. These observations suggest that the salt-tolerant and salt-sensitive lines differ drastically in their abilities to move Na+ from root to shoot. Under the control condition, root Na concentrations were higher than leaves (Figure 3a,b). However, under salinity, Matador and PI 268229 maintained higher Na concentrations in roots than leaves, whereas PI 340261 and PI 537281 had higher leaf Na concentrations in leaves than roots (Figure 3a, b). These observations indicate that Matador and PI 268229 were able to restrict the movement of Na+ from root to shoot. As leaves are more sensitive to Na+ than root, the differences in root to shoot Na+ movement abilities may have led to enhanced salt tolerance of Matador and PI 268229 compared to PI 340261 and PI 537281. Nonetheless, Na concentrations in roots were also lower in salt-tolerant lines than salt-sensitive lines, suggesting that Na+ exclusion may also be playing some role in keeping Na concentration low (Figure 3b).
Leaf Cl concentrations were 1.6- to 1.9-fold higher in salt-sensitive lines compared to salt-tolerant lines under salinity (Figure 3c). At the same time, root Cl concentrations were 1.0- to 1.7-fold higher in salt-sensitive lines than salt-tolerant lines (Figure 3d). PI 268229 (a salt-tolerant line) and PI 340261 (a salt-sensitive line) accumulated comparable concentrations of Cl in roots; however, PI 340261 accumulated 1.8-fold higher Cl in leaves as compared to PI 268229 (Figure 3c,d), indicating different regulation of Cl− movement from root to shoot in these genotypes. PI 537281 had a high Cl concentration in both roots and leaves, suggesting that this genotype takes up more Cl− from soil or does not exclude Cl− from roots to soil and does not regulate the movement of Cl− from root to shoot (Figure 3c,d).
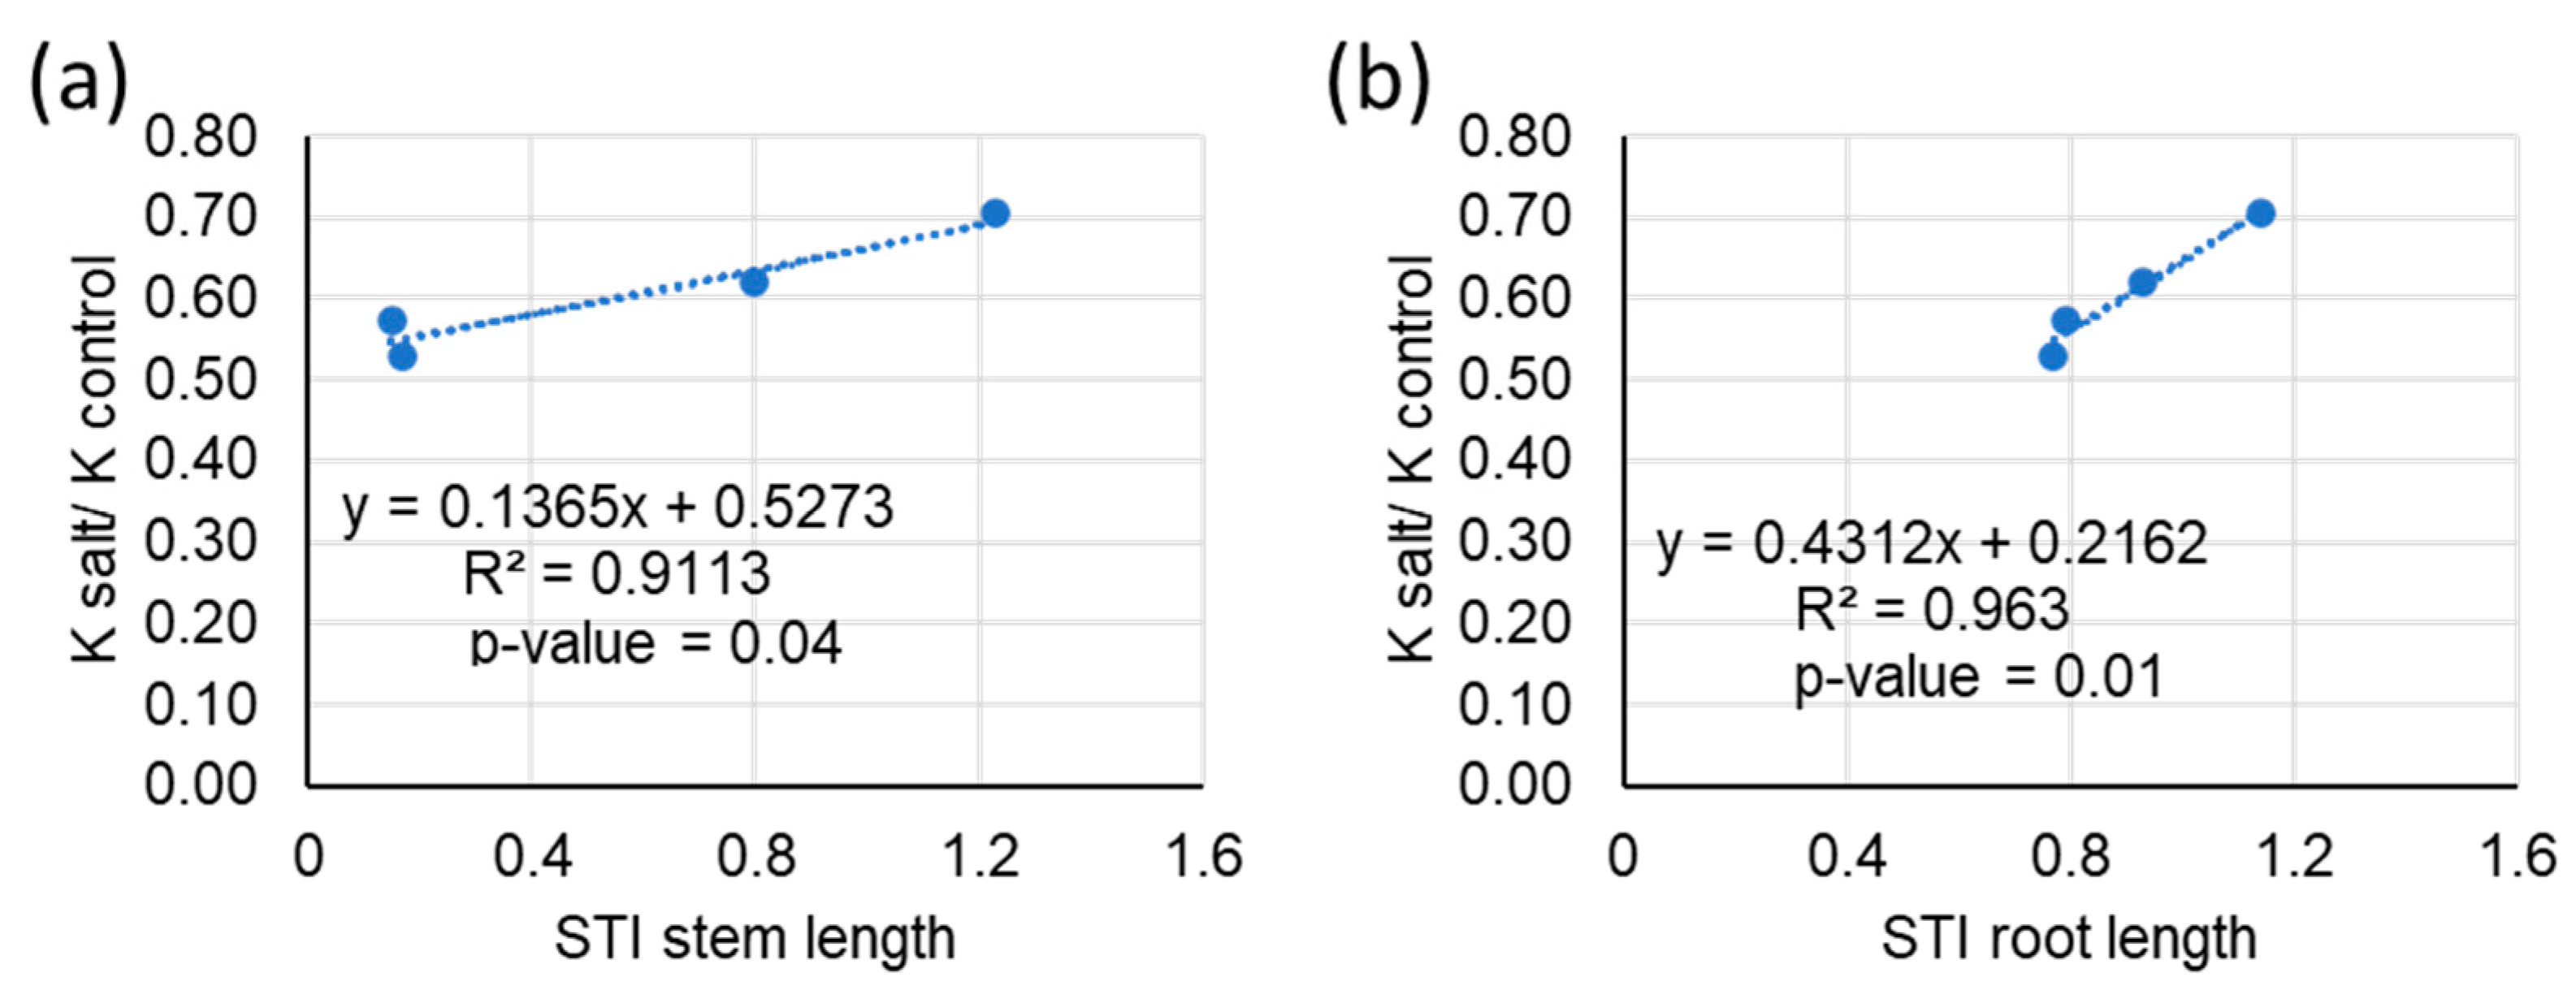
Potassium is an important nutrient that affects plant growth and development in many ways. Salinity stress reduces K+ absorption from the soil, translocation from root to shoot, and lower cytosolic K+ due to membrane leakage [31]. Although K concentrations reduced under salinity in our study, they were not significantly different among the four genotypes under salinity (Figure 3e). However, the relative leaf K concentrations under salinity compared to control (K-salinity/K-control) were significantly different between salt-tolerant (Matador = 0.71 and PI 268229 = 0.62) and salt-sensitive (PI 340261 = 0.57 and PI 537281 = 0.53) genotypes (Figure 3e). The R2 values between leaf K-salinity/K-control and STI shoot length and leaf K-salinity/K-control and STI root length were 0.9113 and 0.963, respectively (Figure 6a,b). These observations suggest a strong association between the leaf K-salinity/K-control ratio with STI for the stem and root lengths (Figure 6). Hence, our data advocate that leaf K-salinity/K-control is more critical during salinity stress than total leaf K concentrations. As the net K+ accumulation differs in different varieties, the association of relative K concentration with respect to control with STI is logical. In a previous study, leaf K-salinity/K-control was also shown to be one of the factors determining salinity tolerance of different Prunus genotypes [32]. Similar associations between K-salinity/K-control and STI have been observed in our salinity studies on vegetable crops such as eggplant, tomato, and pepper (D. Suarez and D. Sandhu, unpublished).
To characterize different players involved in salinity tolerance, we conducted the expression analyses of 10 genes involved in Na+ and Cl− transport in the roots of four guar genotypes. Of the genes involved in Na+ transport, all three SOS genes were upregulated in Matador under salinity compared to control (Figure 4). As the SOS pathway has been shown to actively exclude Na+ out of plant roots [25], our results advocate that the high salt tolerance of Matador is possibly due to enhanced efflux of Na+ from roots. For PI 268229, two genes involved in the SOS pathway (SOS1 and SOS3), one gene involved in translocation of Na+ from root to shoot (HKT1), and one gene involved in K+ transport (AKT1) were upregulated under salinity. HKT1 is involved in retrieving Na from the xylem, limiting the movement of Na+ from root to shoot [33], and AKT1 increases tissue levels of K+ and maintains Na+ homeostasis [34]. Hence, the increased salt tolerance of PI 268229 may be attributable to different component traits, including Na+ exclusion, root to shoot Na+ translocation, and K+-Na+ homeostasis. For the salt-sensitive genotypes (PI 340261 and PI 537281), none of the genes involved in Na+ transport were upregulated in roots under salinity (Figure 4). In fact, all six genes involved in Na transport were downregulated in PI 537281, which also explains the highest leaf and root Na concentrations of this genotype under salinity. The downregulation of the AKT1 gene in PI 537281 under salinity compared to control (Figure 4) is perfectly in line with the lowest leaf K-salinity/K-control value for this genotype.
For the genes involved in Cl− transport, ALMT9 and NPF2.5 were upregulated in roots in Matador, while CCC was upregulated in PI 268229 (Figure 5). It has been shown previously that the knockout mutation in vacuolar transporter ALMT9 led to disruption of Cl− balance in the cytosol, suggesting that ALMT9 maintains low Cl− concentration in the cytosol by moving excess Cl− to the vacuole [35]. NFP2.5, which is predominantly localized to the plasma membrane of root cortex cells, mediates Cl− exclusion from the root [36]. CCC is proposed to retrieve Cl− from root xylem, restricting the movement of Cl− to shoot [37]. Our results indicated that the low leaf concentrations of Matador were most probably due to its enhanced ability to exclude Cl− from roots and increased sequestration of Cl− in root vacuoles, whereas PI 268229 maintained low leaf Cl concentration by retrieving Cl− from xylem and restricting root to shoot movement of Cl−. For the salt-sensitive genotype, PI 537281, CCC, and CLCc were downregulated in roots under salinity. In Arabidopsis, CLCc was localized to the tonoplast and was shown to be involved in sequestration of Cl− to vacuoles [38]. Hence, increased leaf Cl concentration in PI 537281 may be attributed to its reduced ability to sequester Cl− to root vacuoles and retrieval of Cl from the xylem into the root.
5. Conclusions
Guar has the potential to be an important crop for the low-rainfall regions of the U.S. due to its high tolerance to abiotic stresses. Although a number of studies have focused on drought tolerance of guar, little work has been carried out to explore the salinity tolerance of this important crop. We have shown that an immense variation for salinity tolerance exists within four guar genotypes evaluated in this study. Salinity tolerance in plants is multifaceted and complex. We were able to identify several important component traits of salinity tolerance mechanisms in guar. Identification of additional or unique factors of salt tolerance is critical in fully understanding salt tolerance in guar. Screening of a large number of diverse lines from different geographical locations may perhaps further illuminate different mechanisms of salt tolerance in guar. Pyramiding different component traits into a single genotype may lead to superior salt tolerance. Since guar is already known to be drought-tolerant, research into its salt tolerance mechanisms can also create a complete picture of its ability to survive in arid climates. While these findings will certainly help the development and improvement of guar crops, they can also benefit research into plant salt tolerance as a whole.
Supplementary Materials
The following are available online at https://www.mdpi.com/article/10.3390/agronomy11061068/s1, Table S1: List of primers used for expression analyses. Table S2: Tissue ion concentrations of four guar genotypes.
Author Contributions
Conceptualization, D.S. and K.K.G.; methodology, D.S. and K.K.G.; formal analysis, D.S., A.P., M.V.P., and K.K.G.; resources, D.S. and K.K.G.; writing—original draft preparation, D.S. and A.P.; writing—review and editing, D.S., A.P., M.V.P., and K.K.G.; supervision, D.S. and K.K.G.; project administration, D.S. and K.K.G.; funding acquisition, D.S. and K.K.G. All authors have read and agreed to the published version of the manuscript.
Funding
This research was funded by the United States Department of Agriculture—Agricultural Research Service, National Program 301: Plant Genetic Resources, Genomics, and Genetic Improvement (project number 2036-13210-012-00-D), NIFA-AFRI CAP Grant # 2017-68005-26867, and from the Agriculture Experiment Station of New Mexico State University.
Institutional Review Board Statement
Not applicable.
Informed Consent Statement
Not applicable.
Data Availability Statement
All data supporting this study are included in the article and its Supplementary Materials.
Acknowledgments
Acknowledgements are due to Pangki Xiong for the ion analyses and Christian Duenas for statistical analyses.
Conflicts of Interest
The authors declare no conflict of interest. The funders had no role in the design of the study; in the collection, analyses, or interpretation of data; in the writing of the manuscript, or in the decision to publish the results.
Disclaimer
The use of trade, firm, or corporation names in this publication is for the information and convenience of the reader. Such use does not constitute an official endorsement or approval by the United States Department of Agriculture or the Agricultural Research Service of any product or service to the exclusion of others that may be suitable.
References
- Whistler, R.L.; Hymowitz, T. Guar: Agronomy, Production, Industrial Use, and Nutrition; Purdue University Press: West Lafayette, IN, USA, 1979. [Google Scholar]
- Morris, J.B. Morphological and reproductive characterization of guar (Cyamopsis tetragonoloba) genetic resources regenerated in Georgia, USA. Genet. Resour. Crop Evol. 2010, 57, 985–993. [Google Scholar] [CrossRef]
- Rao, S.C.; Northup, B.K. Biomass production and quality of Indian-origin forage guar in Southern Great Plains. Agron. J. 2013, 105, 945–950. [Google Scholar] [CrossRef]
- Abidi, N.; Liyanage, S.; Auld, D.; Norman, L.; Grover, K.; Augadi, S.; Singla, S.; Trostle, C. Challenges and Opportunities for Increasing Guar Production in the United States to Support Unconventional Oil and Gas Production. In Hydraulic Fracturing Impacts and Technologies; Uddameri, V., Morse, A., Tindle, K.J., Eds.; CRC Press: Boca Raton, FL, USA, 2015; pp. 207–225. [Google Scholar]
- Mudgil, D.; Barak, S.; Khatkar, B.S. Guar gum: Processing, properties and food applications-A Review. J. Food Sci. Technol. 2014, 51, 409–418. [Google Scholar] [CrossRef] [PubMed] [Green Version]
- Singh, S.K. An Analysis of Guar Crop in India; Report Prepared for USDA-FAS: New Delhi, India, 2014. [Google Scholar]
- Kalyani, D.L. Performance of cluster bean genotypes under varied time of sowing. Legume Res. 2012, 35, 154–158. [Google Scholar]
- Singla, S.; Grover, K.; Angadi, S.V.; Begna, S.; Schutte, B.J.; VanLeeuwen, D. Growth and yield of guar (Cyamopsis tetragonoloba L.) genotypes under different planting dates in the semi-arid Southern High Plains. Am. J. Plant Sci. 2016, 7, 1246–1258. [Google Scholar] [CrossRef] [Green Version]
- Singla, S.; Grover, K.; Angadi, S.V.; Schutte, B.; VanLeeuwen, D. Guar stand establishment, physiology, and yield responses to planting date in southern New Mexico. Agron. J. 2016, 108, 2289–2300. [Google Scholar] [CrossRef]
- Adams, C.B.; Boote, K.J.; Shrestha, R.; MacMillan, J.; Hinson, P.O.; Trostle, C. Growth stages and developmental patterns of guar. Agron. J. 2020, 112, 4990–5001. [Google Scholar] [CrossRef]
- Singh, J.; Guzman, I.; Begna, S.; Trostle, C.; Angadi, S. Germination and early growth response of guar cultivars to low temperatures. Ind. Crop. Prod. 2021, 159, 113082. [Google Scholar] [CrossRef]
- Alshameri, A.; Al-Qurainy, F.; Gaafar, A.R.; Khan, S.; Nadeem, M.; Alansi, S. Identification of heat-responsive genes in guar [Cyamopsis tetragonoloba (L.) Taub]. Int. J. Genom. 2020, 2020, 3126592. [Google Scholar] [CrossRef]
- Al-Qurainy, F.; Alshameri, A.; Gaafar, A.R.; Khan, S.; Nadeem, M.; Alameri, A.A.; Tarroum, M.; Ashraf, M. Comprehensive stress-based de novo transcriptome assembly and annotation of guar (Cyamopsis tetragonoloba (L.) Taub.): An important industrial and forage crop. Int. J. Genom. 2019, 2019, 7295859. [Google Scholar] [CrossRef] [Green Version]
- Jamil, A.; Riaz, S.; Ashraf, M.; Foolad, M.R. Gene expression profiling of plants under salt stress. Critic. Rev. Plant Sci. 2011, 30, 435–458. [Google Scholar] [CrossRef]
- Munns, R.; Husain, S.; Rivelli, A.R.; James, R.A.; Condon, A.G.T.; Lindsay, M.P.; Lagudah, E.S.; Schachtman, D.P.; Hare, R.A. Avenues for increasing salt tolerance of crops, and the role of physiologically based selection traits. In Progress in Plant Nutrition: Plenary Lectures of the XIV International Plant Nutrition Colloquium: Food Security and Sustainability of Agro-Ecosystems through Basic and Applied Research; Horst, W.J., Bürkert, A., Claassen, N., Flessa, H., Frommer, W.B., Goldbach, H., Merbach, W., Olfs, H.W., Römheld, V., Sattelmacher, B., et al., Eds.; Springer: Dordrecht, The Netherlands, 2002; pp. 93–105. [Google Scholar]
- Francois, L.E.; Donovan, T.J.; Maas, E.V. Salinity effects on emergence, vegetative growth, and seed yield of guar. Agron. J. 1990, 82, 587–592. [Google Scholar] [CrossRef]
- Ashraf, M.Y.; Akhtar, K.; Sarwar, G.; Ashraf, M. Role of the rooting system in salt tolerance potential of different guar accessions. Agron. Sustain. Dev. 2005, 25, 243–249. [Google Scholar] [CrossRef]
- Suthar, J.D.; Rajpar, I.; Ganjegunte, G.K.; Shah, Z.-U.-H.; Niu, G.; Grover, K. Germination, growth, and ion uptake of 15 guar accessions under elevated salinity. Agrosyst. Geosci. Environ. 2019, 2, 190020. [Google Scholar] [CrossRef] [Green Version]
- Teolis, I.; Liu, W.; Peffley, E.B. Salinity effects on seed germination and plant growth of guar. Crop Sci. 2009, 49, 637–642. [Google Scholar] [CrossRef]
- Khator, K.; Mahawar, L.; Shekhawat, G.S. NaCl induced oxidative stress in legume crops of Indian Thar Desert: An insight in the cytoprotective role of HO1, NO and antioxidants. Physiol. Mol. Biol. Plants 2020, 26, 51–62. [Google Scholar] [CrossRef] [PubMed]
- Robina, S.; Sheela, A. Salt stress effects on germination, early seedling growth and ion uptake of Cyamopsis seedlings. Curr. Agric. 2006, 30, 31–37. [Google Scholar]
- Suthar, J.D.; Rajpar, I.; Ganjegunte, G.K.; Shah, Z.-u.-h. Evaluation of guar (Cyamopsis tetragonoloba L.) genotypes performance under different irrigation water salinity levels: Growth parameters and seed yield. Ind. Crop. Prod. 2018, 123, 247–253. [Google Scholar] [CrossRef]
- Rasheed, M.J.Z.; Ahmad, K.; Ashraf, M.; Qurainy, F.A.; Khan, S.; Athar, H.U.R. Screening of diverse local germplasm of guar (Cyamposis tetragonoloba (l) taub) for salt tolerance: A possible approach to utilize salt-affected soils. Pak. J. Bot. 2015, 47, 1721–1726. [Google Scholar]
- EPA 600/4-79-020. Methods For Chemical Analysis of Water And Wastes; Method 325.2; Environmental Protection Agency: Cincinnati, OH, USA, 1983. [Google Scholar]
- Tanwar, U.K.; Pruthi, V.; Randhawa, G.S. RNA-Seq of guar (Cyamopsis tetragonoloba, L. Taub.) leaves: De novo transcriptome assembly, functional annotation and development of genomic resources. Front. Plant Sci. 2017, 8, 91. [Google Scholar] [CrossRef] [Green Version]
- Jaiswal, P.S.; Kaur, N.; Randhawa, G.S. Identification of reference genes for qRT-PCR gene expression studies during seed development and under abiotic stresses in Cyamopsis tetragonoloba. Crop Sci. 2019, 59, 252–265. [Google Scholar] [CrossRef]
- Sandhu, D.; Kaundal, A. Dynamics of salt tolerance: Molecular perspectives. In Biotechnologies of Crop Improvement, Volume 3: Genomic Approaches; Gosal, S.S., Wani, S.H., Eds.; Springer International Publishing: Cham, Switzerland, 2018; pp. 25–40. [Google Scholar]
- Sandhu, D.; Cornacchione, M.V.; Ferreira, J.F.; Suarez, D.L. Variable salinity responses of 12 alfalfa genotypes and comparative expression analyses of salt-response genes. Sci. Rep. 2017, 7, 42958. [Google Scholar] [CrossRef] [PubMed]
- Munns, R.; Termaat, A. Whole plant responses to salinity. Aust. J. Plant Physiol. 1986, 13, 143–160. [Google Scholar] [CrossRef]
- Al-Niemi, T.S.; Campbell, W.F.; Rumbaugh, M.D. Response of alfalfa cultivars to salinity during germination and post-germination growth. Crop Sci. 1992, 32, 976–980. [Google Scholar] [CrossRef]
- Wang, M.; Zheng, Q.; Shen, Q.; Guo, S. The critical role of potassium in plant stress response. Int. J. Mol. Sci. 2013, 14, 7370–7390. [Google Scholar] [CrossRef] [Green Version]
- Sandhu, D.; Kaundal, A.; Acharya, B.R.; Forest, T.; Pudussery, M.V.; Liu, X.; Ferreira, J.F.S.; Suarez, D.L. Linking diverse salinity responses of 14 almond rootstocks with physiological, biochemical, and genetic determinants. Sci. Rep. 2020, 10, 21087. [Google Scholar] [CrossRef] [PubMed]
- Rubio, F.; Gassmann, W.; Schroeder, J.I. Sodium-driven potassium uptake by the plant potassium transporter HKT1 and mutations conferring salt tolerance. Science 1995, 270, 1660–1663. [Google Scholar] [CrossRef] [PubMed]
- Ma, Q.; Hu, J.; Zhou, X.-R.; Yuan, H.-J.; Kumar, T.; Luan, S.; Wang, S.-M. ZxAKT1 is essential for K+ uptake and K+/Na+ homeostasis in the succulent xerophyte Zygophyllum xanthoxylum. Plant J. 2017, 90, 48–60. [Google Scholar] [CrossRef] [PubMed] [Green Version]
- Baetz, U.; Eisenach, C.; Tohge, T.; Martinoia, E.; De Angeli, A. Vacuolar chloride fluxes impact ion content and distribution during early salinity stress. Plant Physiol. 2016, 172, 1167–1181. [Google Scholar] [CrossRef] [PubMed] [Green Version]
- Li, B.; Qiu, J.; Jayakannan, M.; Xu, B.; Li, Y.; Mayo, G.M.; Tester, M.; Gilliham, M.; Roy, S.J. AtNPF2.5 modulates chloride (Cl−) efflux from roots of Arabidopsis thaliana. Front. Plant Sci. 2016, 7, 2013. [Google Scholar] [CrossRef] [Green Version]
- Colmenero-Flores, J.M.; Martinez, G.; Gamba, G.; Vazquez, N.; Iglesias, D.J.; Brumos, J.; Talon, M. Identification and functional characterization of cation-chloride cotransporters in plants. Plant J. 2007, 50, 278–292. [Google Scholar] [CrossRef] [PubMed]
- Jossier, M.; Kroniewicz, L.; Dalmas, F.; Le Thiec, D.; Ephritikhine, G.; Thomine, S.; Barbier-Brygoo, H.; Vavasseur, A.; Filleur, S.; Leonhardt, N. The Arabidopsis vacuolar anion transporter, AtCLCc, is involved in the regulation of stomatal movements and contributes to salt tolerance. Plant J. 2010, 64, 563–576. [Google Scholar] [CrossRef] [PubMed]
Figure 1.
Field evaluation of four guar varieties for agronomic traits. (a) Clusters per plant. (b) Branch count. Different letters at the top of bars represent the statistical difference (p ≤ 0.05) between means for different genotypes (n = 3). Error bars represent standard errors.
Figure 1.
Field evaluation of four guar varieties for agronomic traits. (a) Clusters per plant. (b) Branch count. Different letters at the top of bars represent the statistical difference (p ≤ 0.05) between means for different genotypes (n = 3). Error bars represent standard errors.
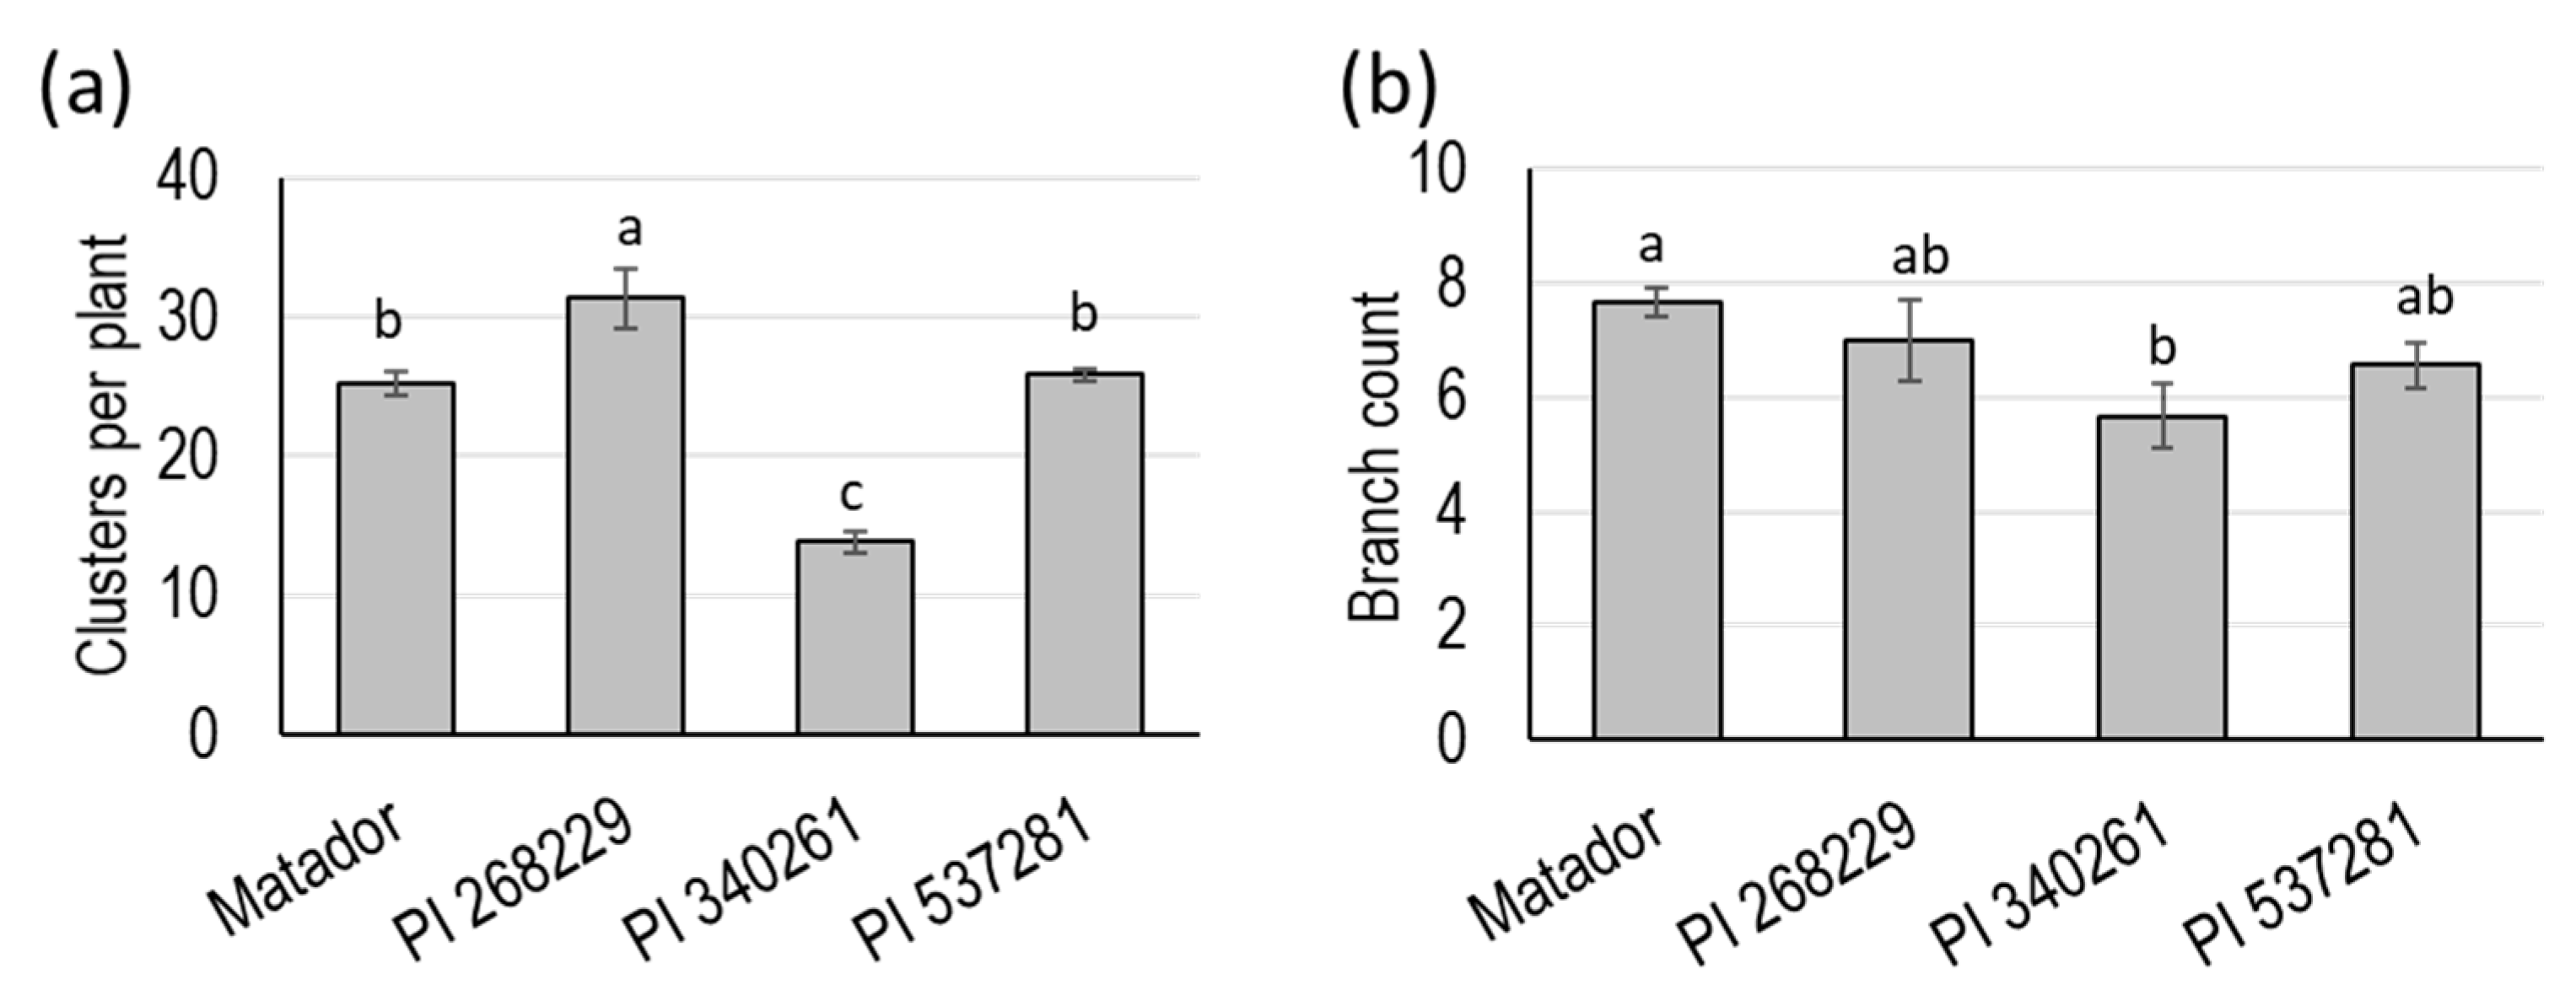
Figure 2.
Performance of four guar genotypes under control and salinity conditions. (a) Shoot biomass. (b) Root biomass. (c) Shoot length. (d) Root length. (e) Salt tolerance index (STI) for the shoot and root biomass. (f) STI for the shoot and root length. Capital letters signify significant differences under control conditions, while lower case letters signify significant differences under the saline condition (p ≤ 0.05) (n = 3). Error bars represent standard errors.
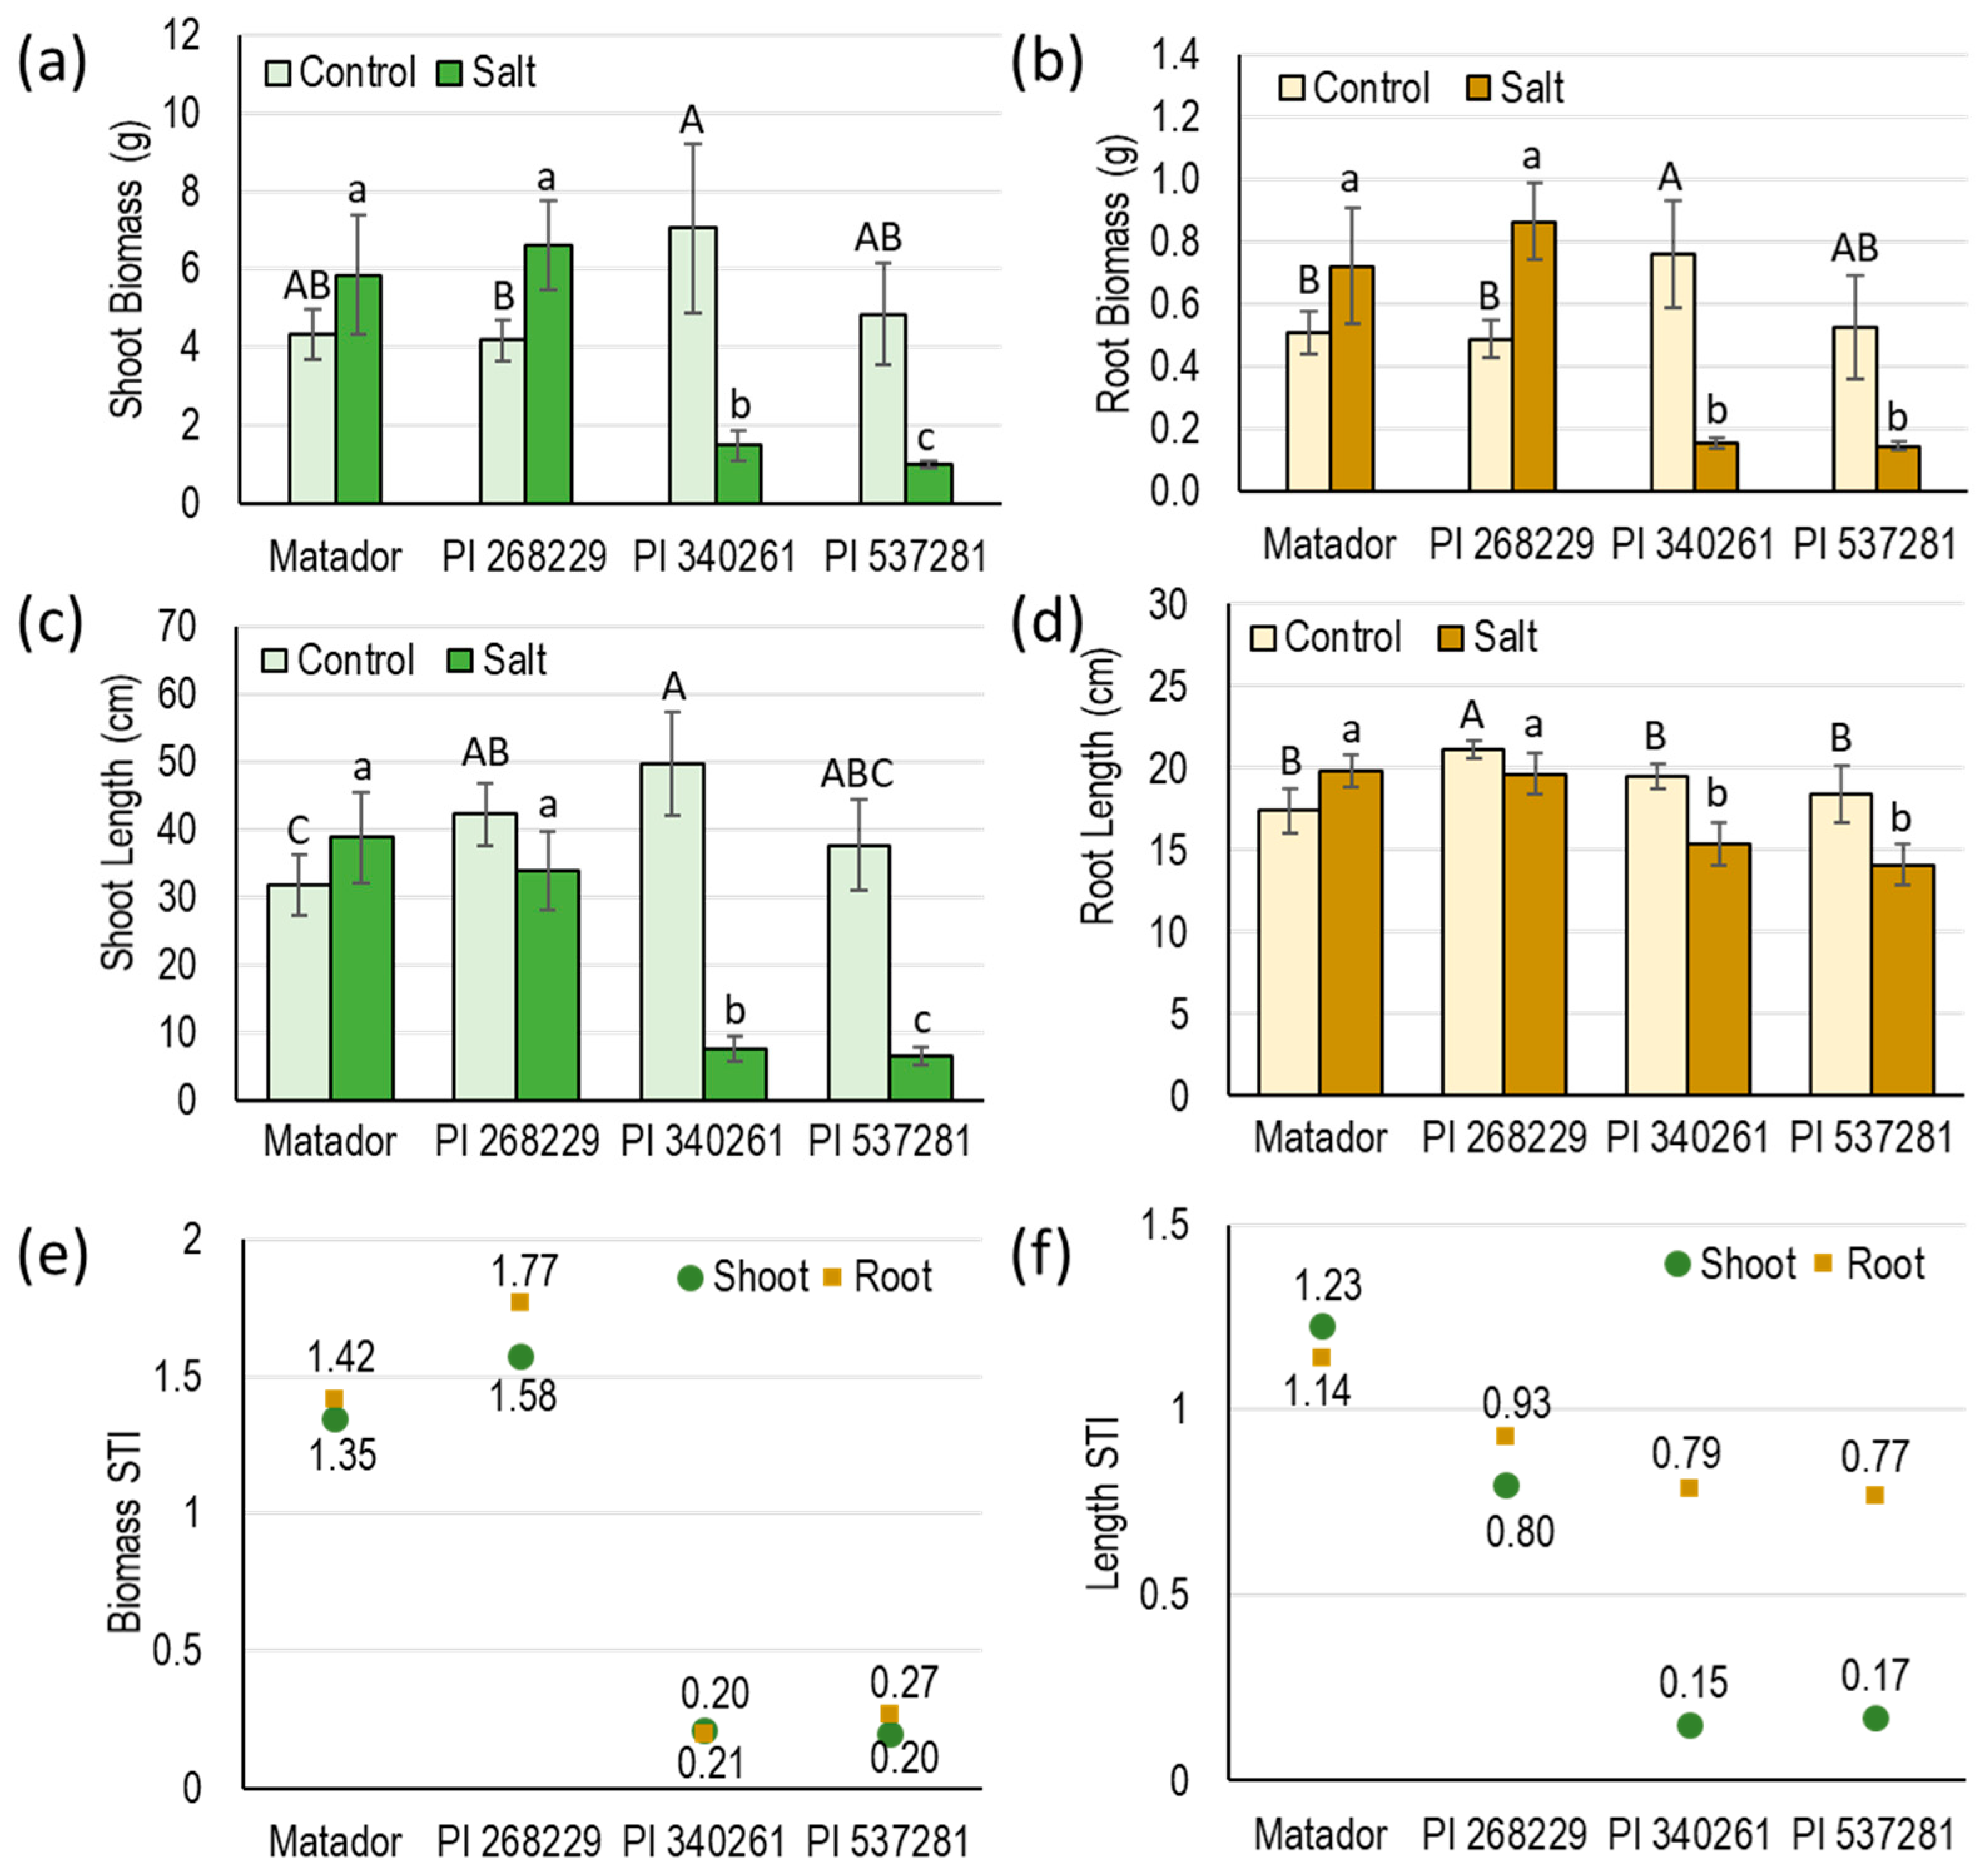
Figure 3.
Tissue ion concentrations of the four guar genotypes irrigated with control and saline irrigation waters. (a) Leaf Na concentrations. (b) Root Na concentrations. (c) Leaf Cl concentrations. (d) Root Cl concentrations. (e) Leaf K concentrations. (f) Root K concentrations. Capital letters denote differences between varieties under the control condition, while lowercase letters signify significant differences under the saline condition (p < 0.05) (n = 3). Error bars represent standard errors.
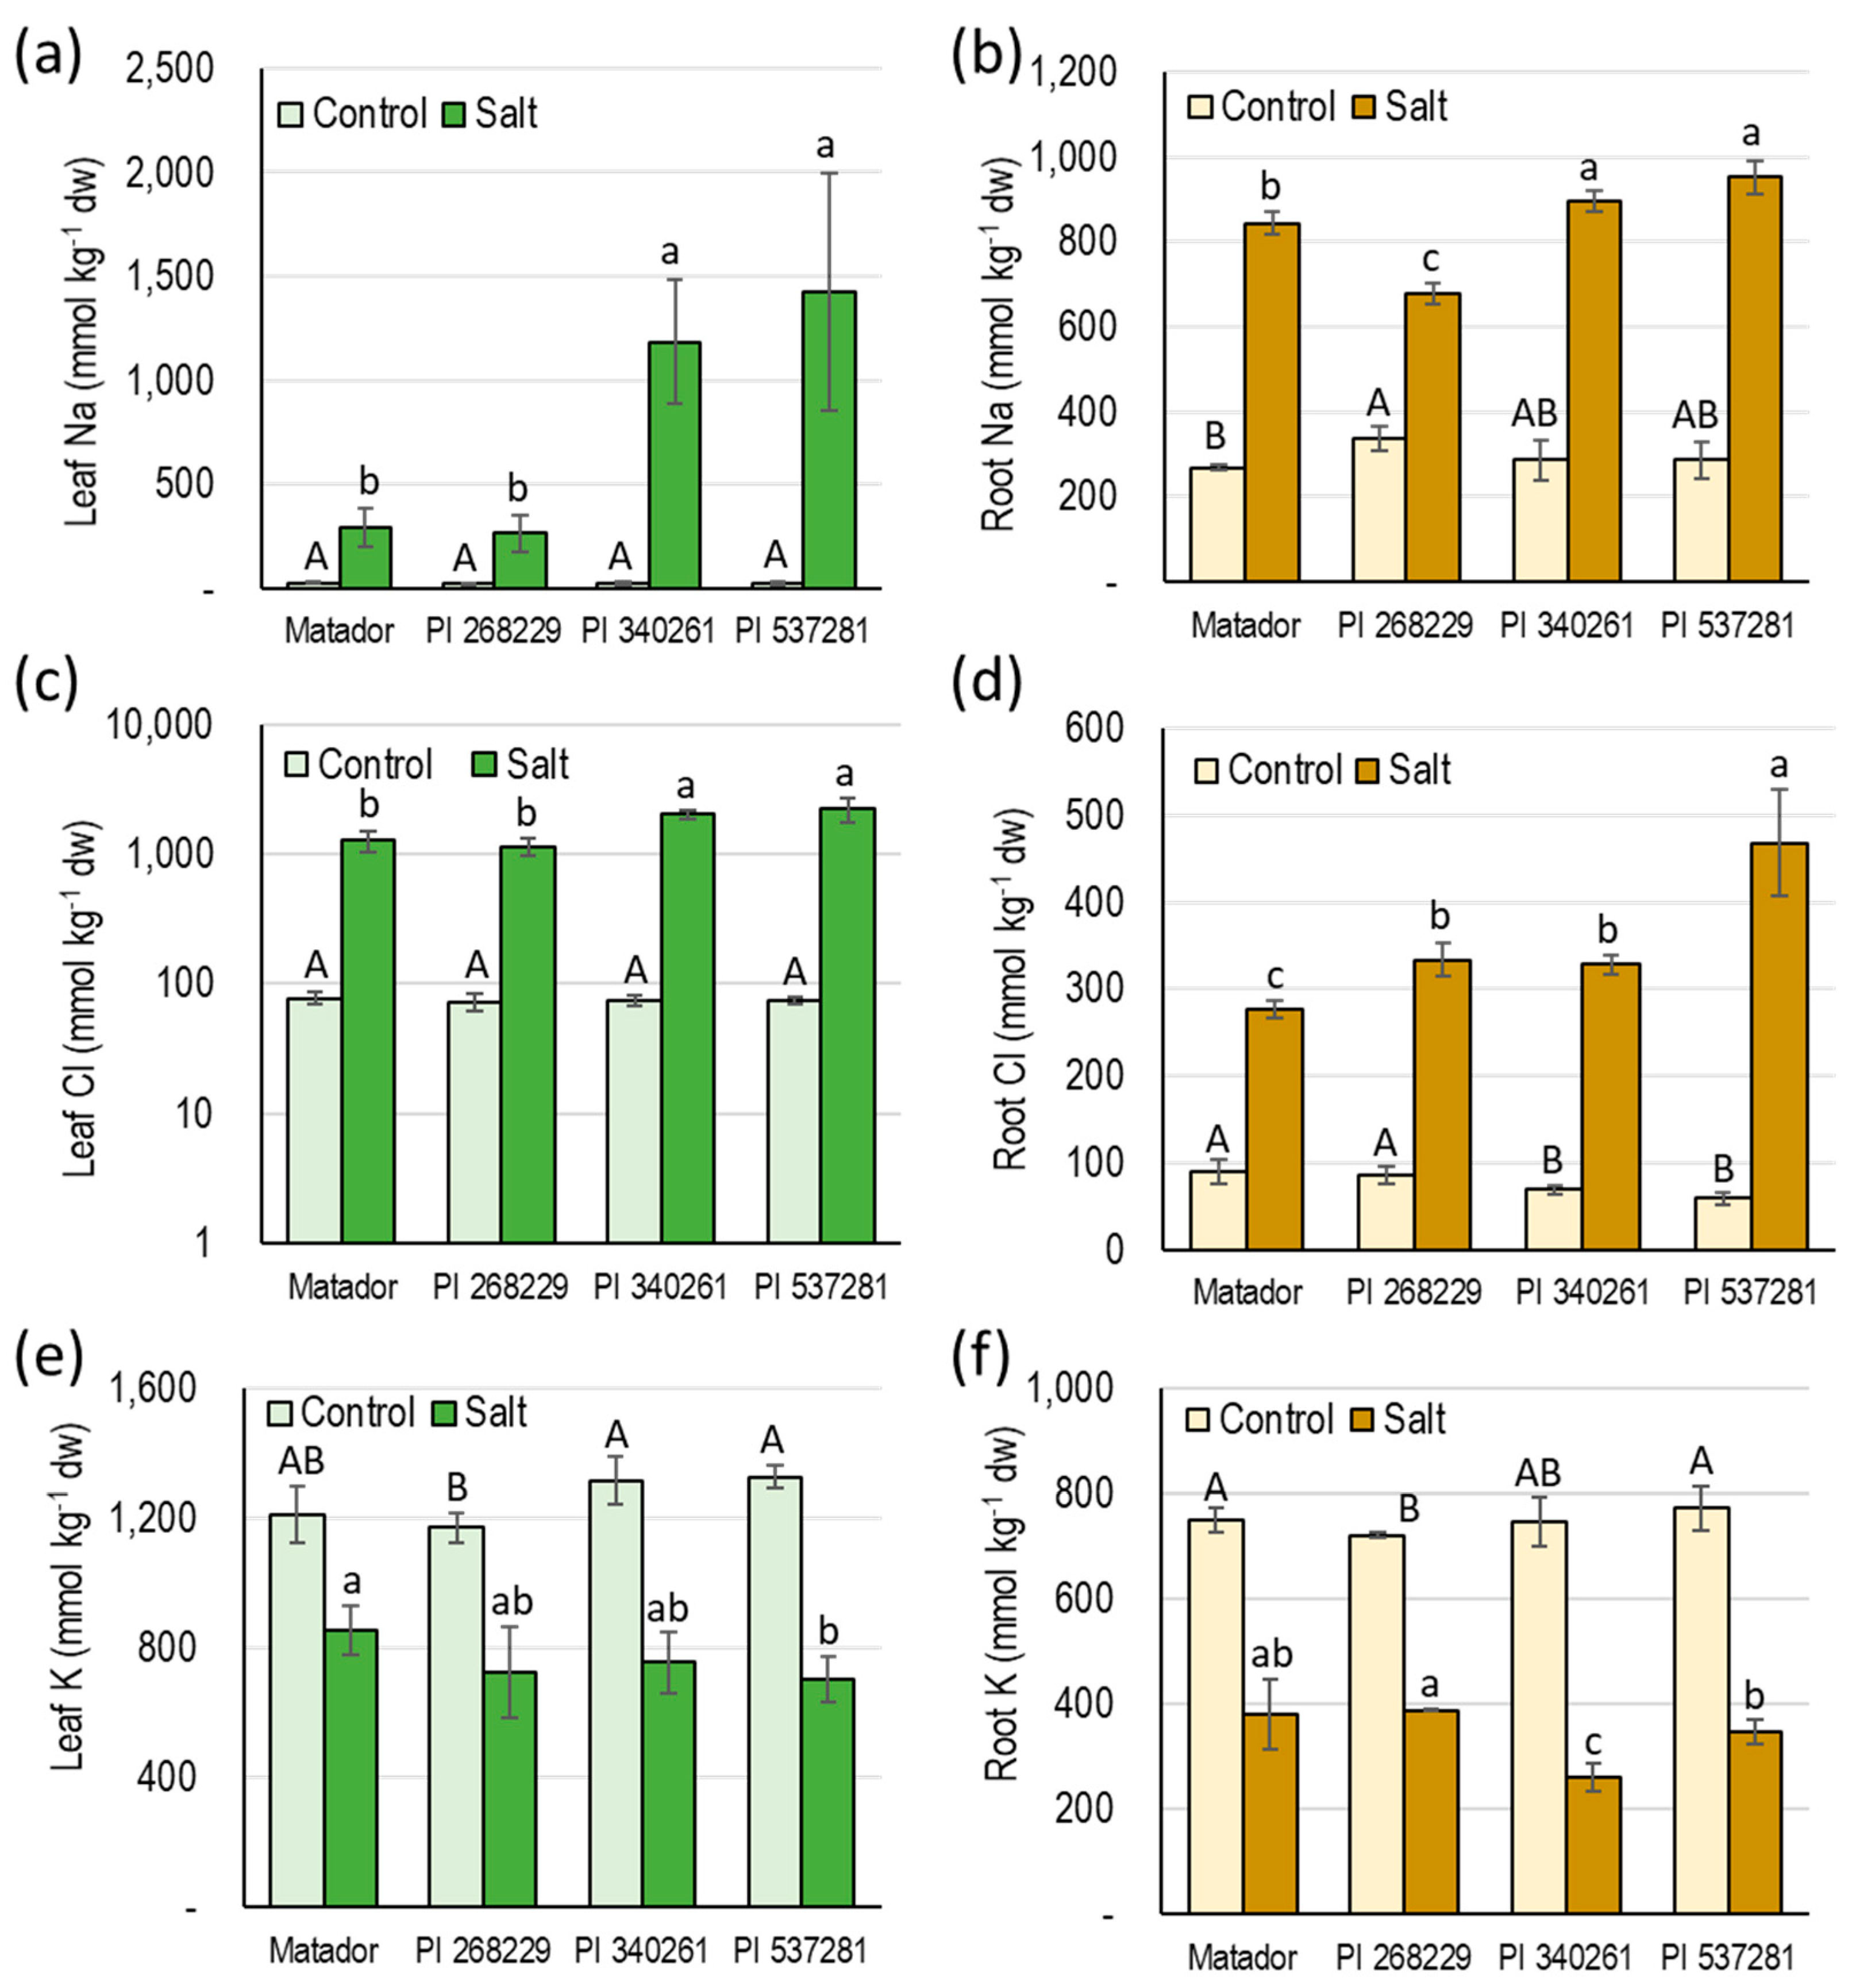
Figure 4.
Expression of genes involved in Na+ transport in the roots of the four guar genotypes irrigated with control and saline irrigation waters (n = 3). (a) SOS1. (b) NHX1. (c) SOS2. (d) AKT1. (e) SOS3. (f) HKT1. Error bars represent standard errors.
Figure 4.
Expression of genes involved in Na+ transport in the roots of the four guar genotypes irrigated with control and saline irrigation waters (n = 3). (a) SOS1. (b) NHX1. (c) SOS2. (d) AKT1. (e) SOS3. (f) HKT1. Error bars represent standard errors.
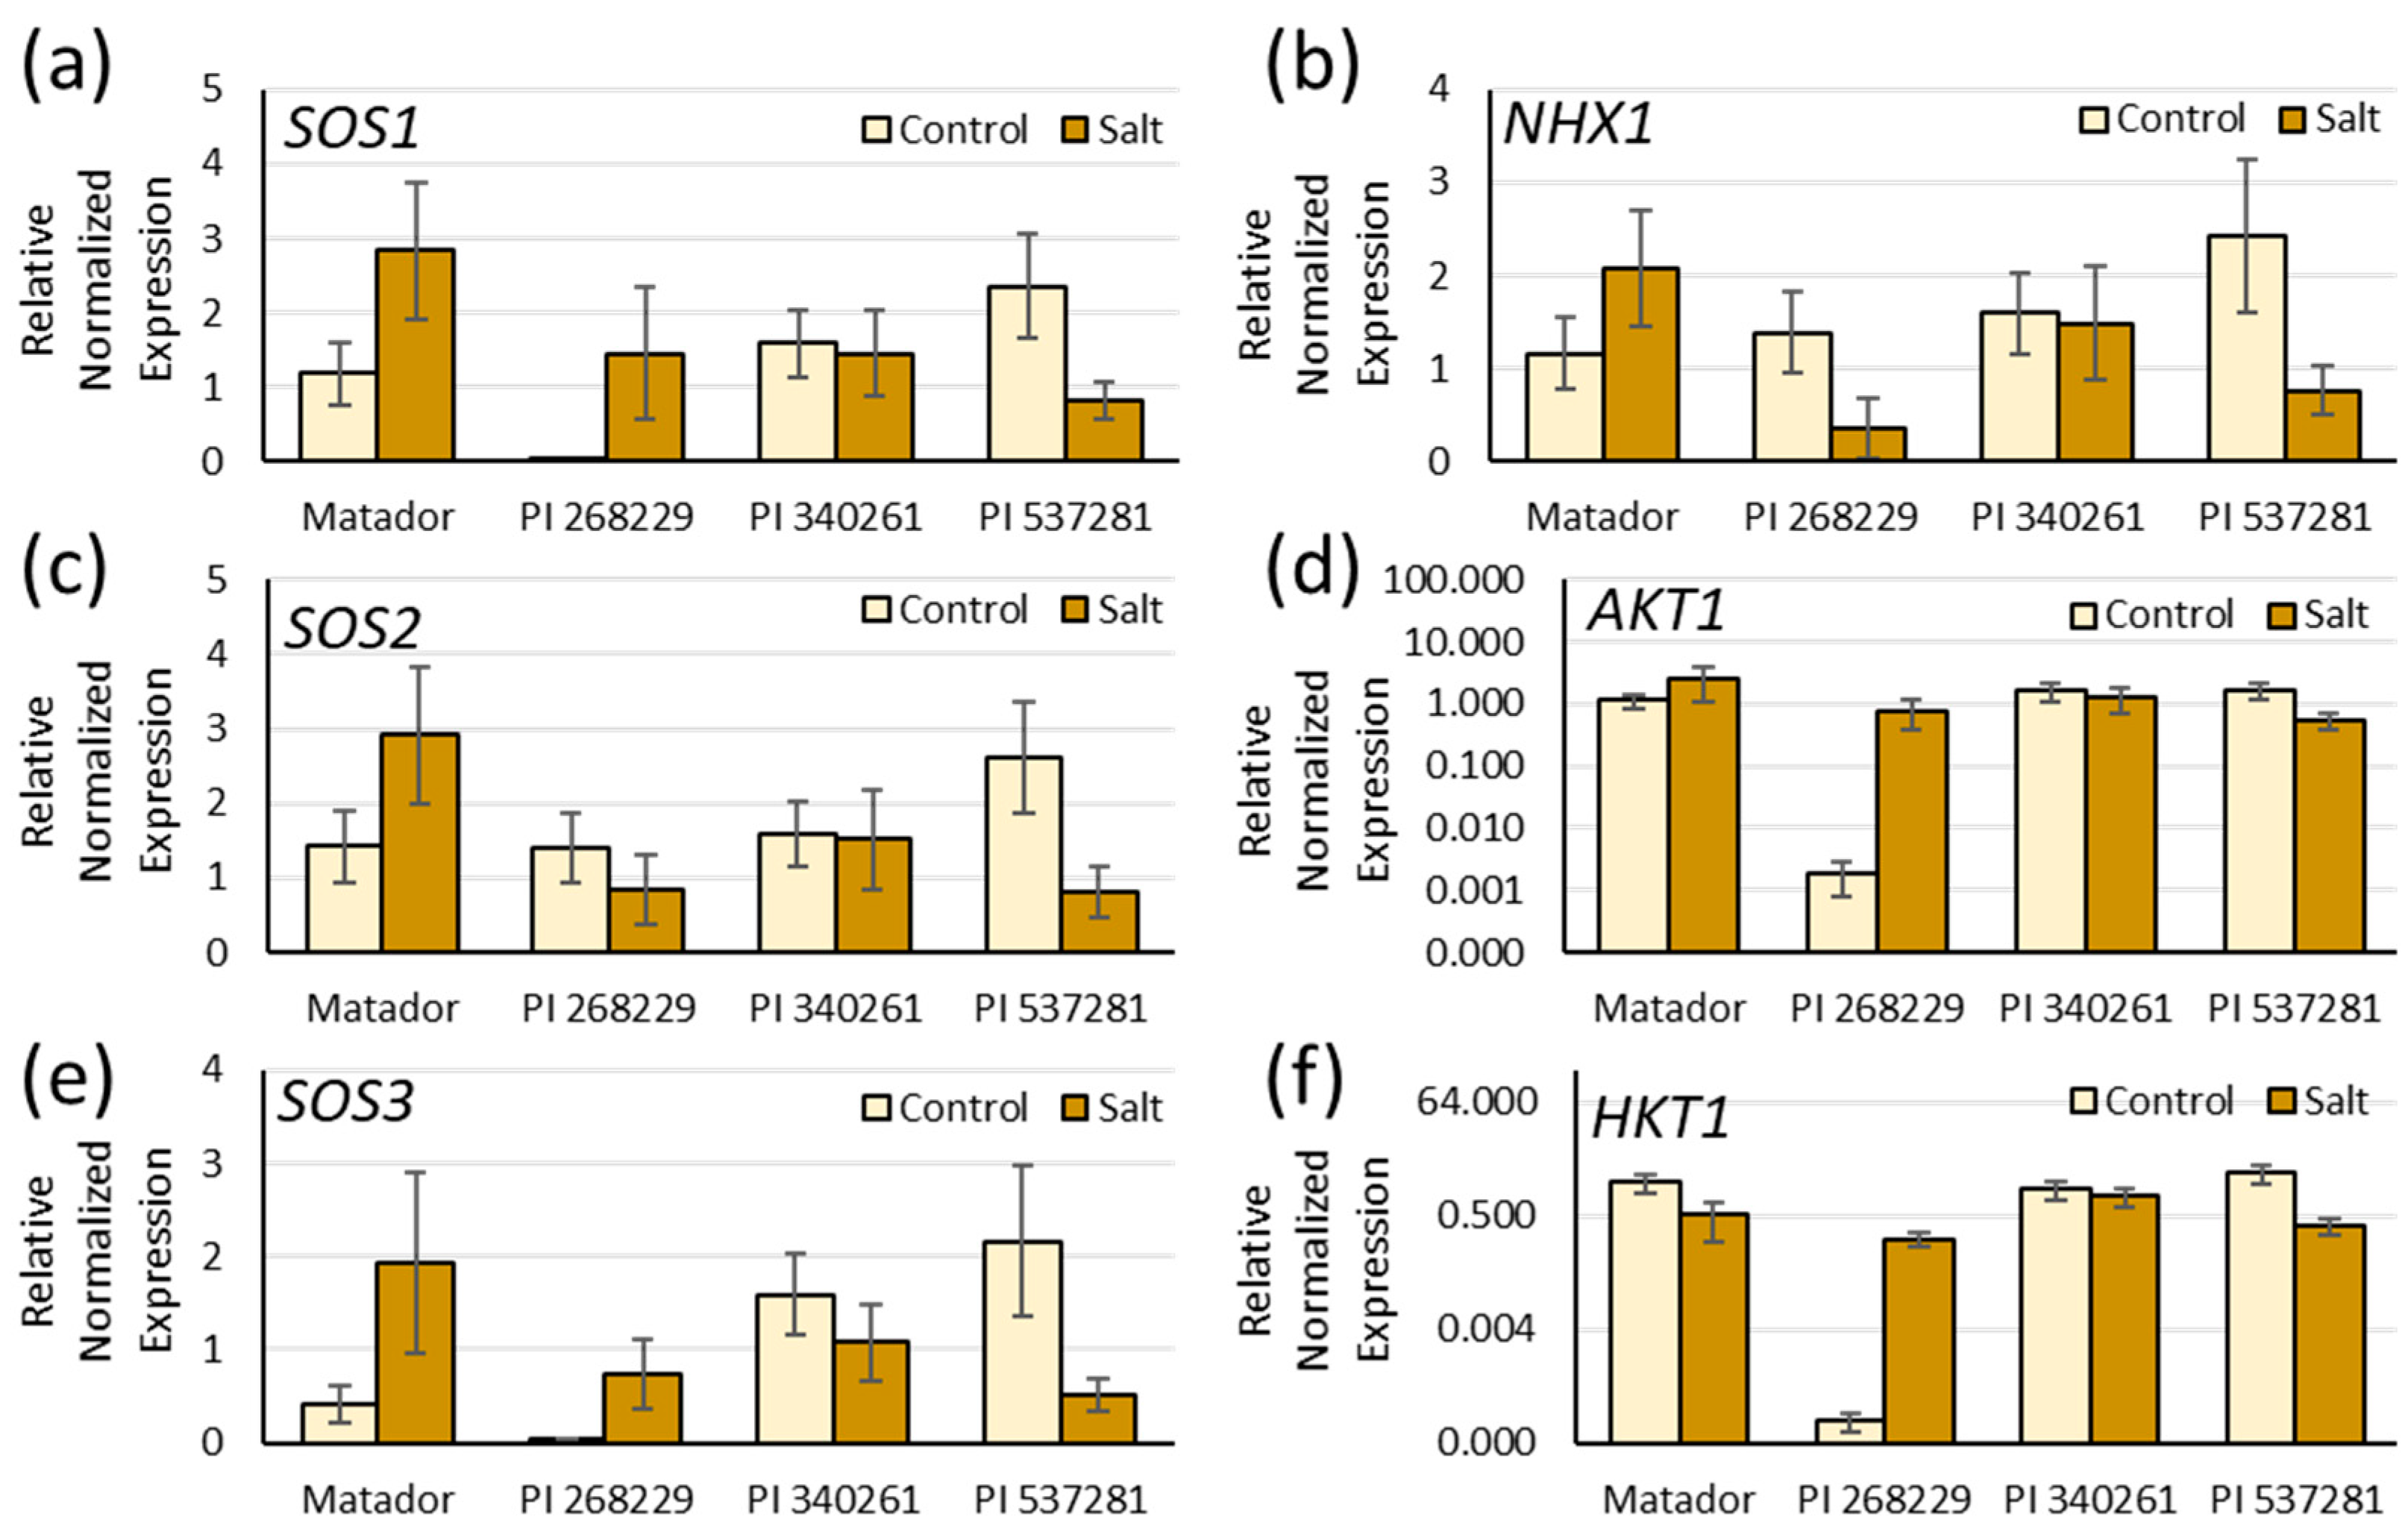
Figure 5.
Expression of genes involved in Cl− transport in the roots of the four guar genotypes irrigated with control and saline irrigation waters (n = 3). (a) ALMT9. (b) CLCc. (c) CCC. (d) NPF2.5. Error bars represent standard errors.
Figure 5.
Expression of genes involved in Cl− transport in the roots of the four guar genotypes irrigated with control and saline irrigation waters (n = 3). (a) ALMT9. (b) CLCc. (c) CCC. (d) NPF2.5. Error bars represent standard errors.
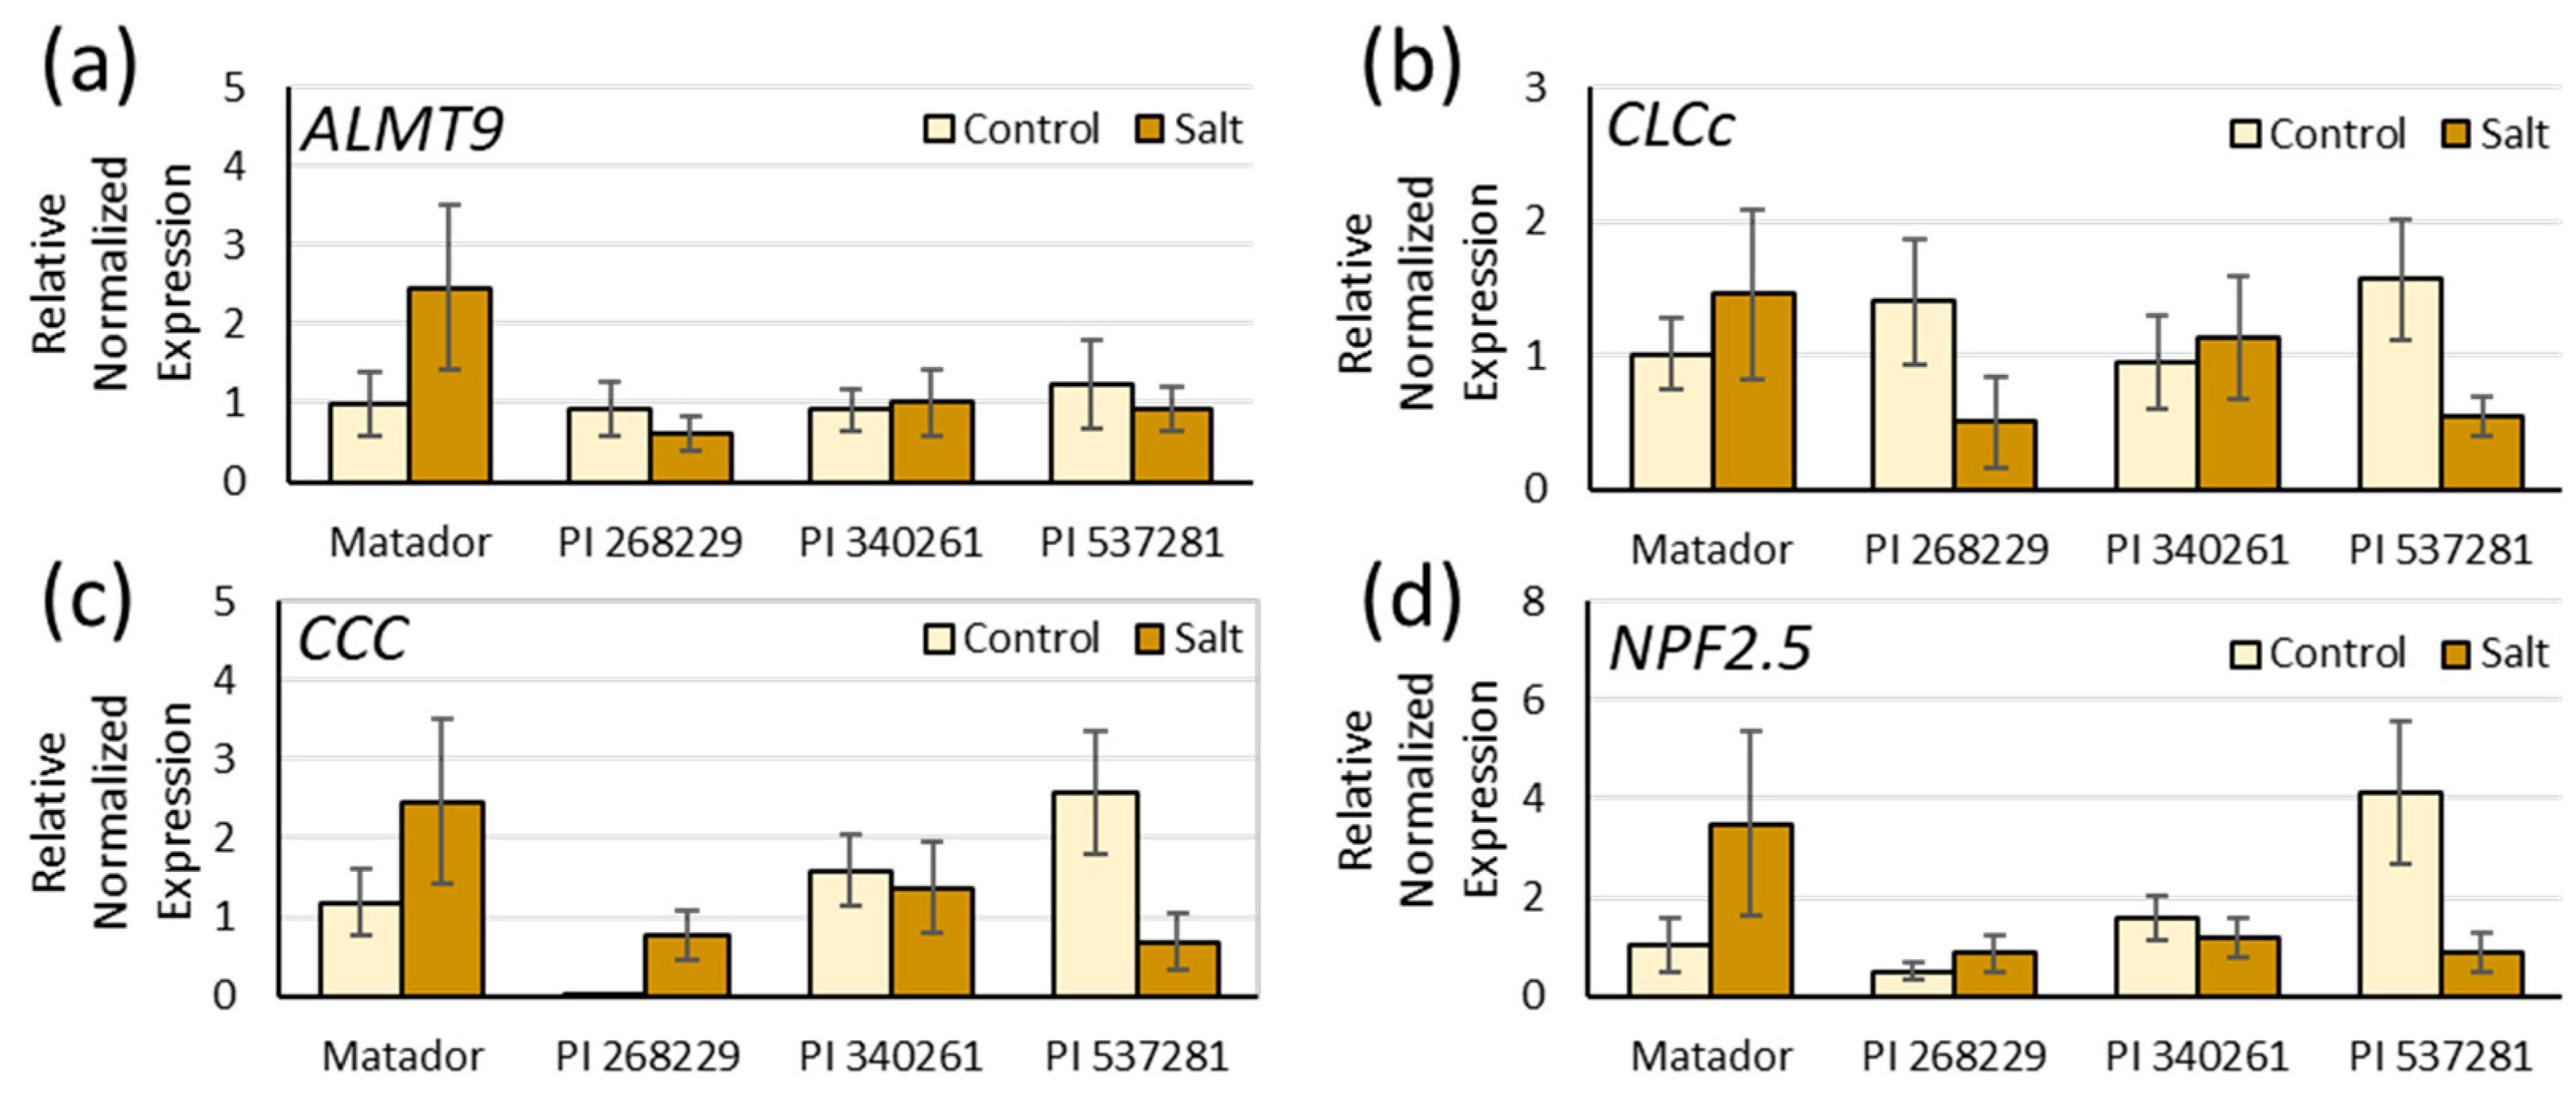
Figure 6.
Relationship of leaf K-salinity/K-control with STI stem length, and STI root length. (a) Relationship between leaf K-salinity/K-control and STI stem length. (b) Relationship between leaf K-salinity/K-control and STI root length.
Figure 6.
Relationship of leaf K-salinity/K-control with STI stem length, and STI root length. (a) Relationship between leaf K-salinity/K-control and STI stem length. (b) Relationship between leaf K-salinity/K-control and STI root length.

Table 1.
Composition of irrigation water.
| Treatment | ECiw (dS m−1) | Ion Concentration (mmolc L−1) | |||||||
|---|---|---|---|---|---|---|---|---|---|
| Cl− | SO42− | NO3− | PO43− | Na+ | K+ | Ca2+ | Mg2+ | ||
| Control | 1.46 | 1.41 | 1.44 | 5.39 | 1.5 | 1.88 | 6.59 | 3.35 | 2.1 |
| Saline | 13.65 | 128.35 | 27.32 | 5.39 | 1.5 | 106.88 | 6.59 | 29.6 | 23 |
Table 2.
Statistical analyses of different traits studied for four guar varieties.
| S. No. | Trait | p-Value |
|---|---|---|
| 1 | Single plant above-ground dry biomass (g) | 0.419 |
| 2 | Clusters per plant | 0.001 * |
| 3 | Pods per plant | 0.176 |
| 4 | Pods per cluster | 0.210 |
| 5 | Total pod weight per plant (g) | 0.256 |
| 6 | Pod width (mm) | 0.751 |
| 7 | Pod length (cm) | 0.157 |
| 8 | Pod thickness (mm) | 0.456 |
| 9 | Seeds per pod | 0.369 |
| 10 | Seeds per plant | 0.179 |
| 11 | Seed weight per plant (g) | 0.352 |
| 12 | 100-seed Weight (g) | 0.146 |
| 13 | Single plant harvest index | 0.664 |
| 14 | Dry above-ground biomass kg/ha | 0.447 |
| 15 | Seed yield kg/ha | 0.123 |
| 16 | Harvest index (kg/ha) | 0.471 |
| 17 | Plant height 65 days after planting (cm) | 0.094 |
| 18 | Plant width 65 days after planting (cm) | 0.767 |
| 19 | Branch count 65 days after planting | 0.049 * |
| 20 | Plant count per meter 50 days after planting | 0.993 |
| 21 | Plant height (cm) | 0.249 |
* represents statistically significance at p ≤ 0.05.
Publisher’s Note: MDPI stays neutral with regard to jurisdictional claims in published maps and institutional affiliations. |
© 2021 by the authors. Licensee MDPI, Basel, Switzerland. This article is an open access article distributed under the terms and conditions of the Creative Commons Attribution (CC BY) license (https://creativecommons.org/licenses/by/4.0/).
Share and Cite
MDPI and ACS Style
Sandhu, D.; Pallete, A.; Pudussery, M.V.; Grover, K.K. Contrasting Responses of Guar Genotypes Shed Light on Multiple Component Traits of Salinity Tolerance Mechanisms. Agronomy 2021, 11, 1068. https://doi.org/10.3390/agronomy11061068
AMA Style
Sandhu D, Pallete A, Pudussery MV, Grover KK. Contrasting Responses of Guar Genotypes Shed Light on Multiple Component Traits of Salinity Tolerance Mechanisms. Agronomy. 2021; 11(6):1068. https://doi.org/10.3390/agronomy11061068
Chicago/Turabian StyleSandhu, Devinder, Andrew Pallete, Manju V. Pudussery, and Kulbhushan K. Grover. 2021. "Contrasting Responses of Guar Genotypes Shed Light on Multiple Component Traits of Salinity Tolerance Mechanisms" Agronomy 11, no. 6: 1068. https://doi.org/10.3390/agronomy11061068
Note that from the first issue of 2016, this journal uses article numbers instead of page numbers. See further details here.