Research on Extraction of Compound Fault Characteristics for Rolling Bearings in Wind Turbines


Abstract
1. Introduction
2. Multipoint Optimal Minimum Entropy Deconvolution Adjusted (MOMEDA)
3. The 1.5-Dimensional Teager Kurtosis Spectrum
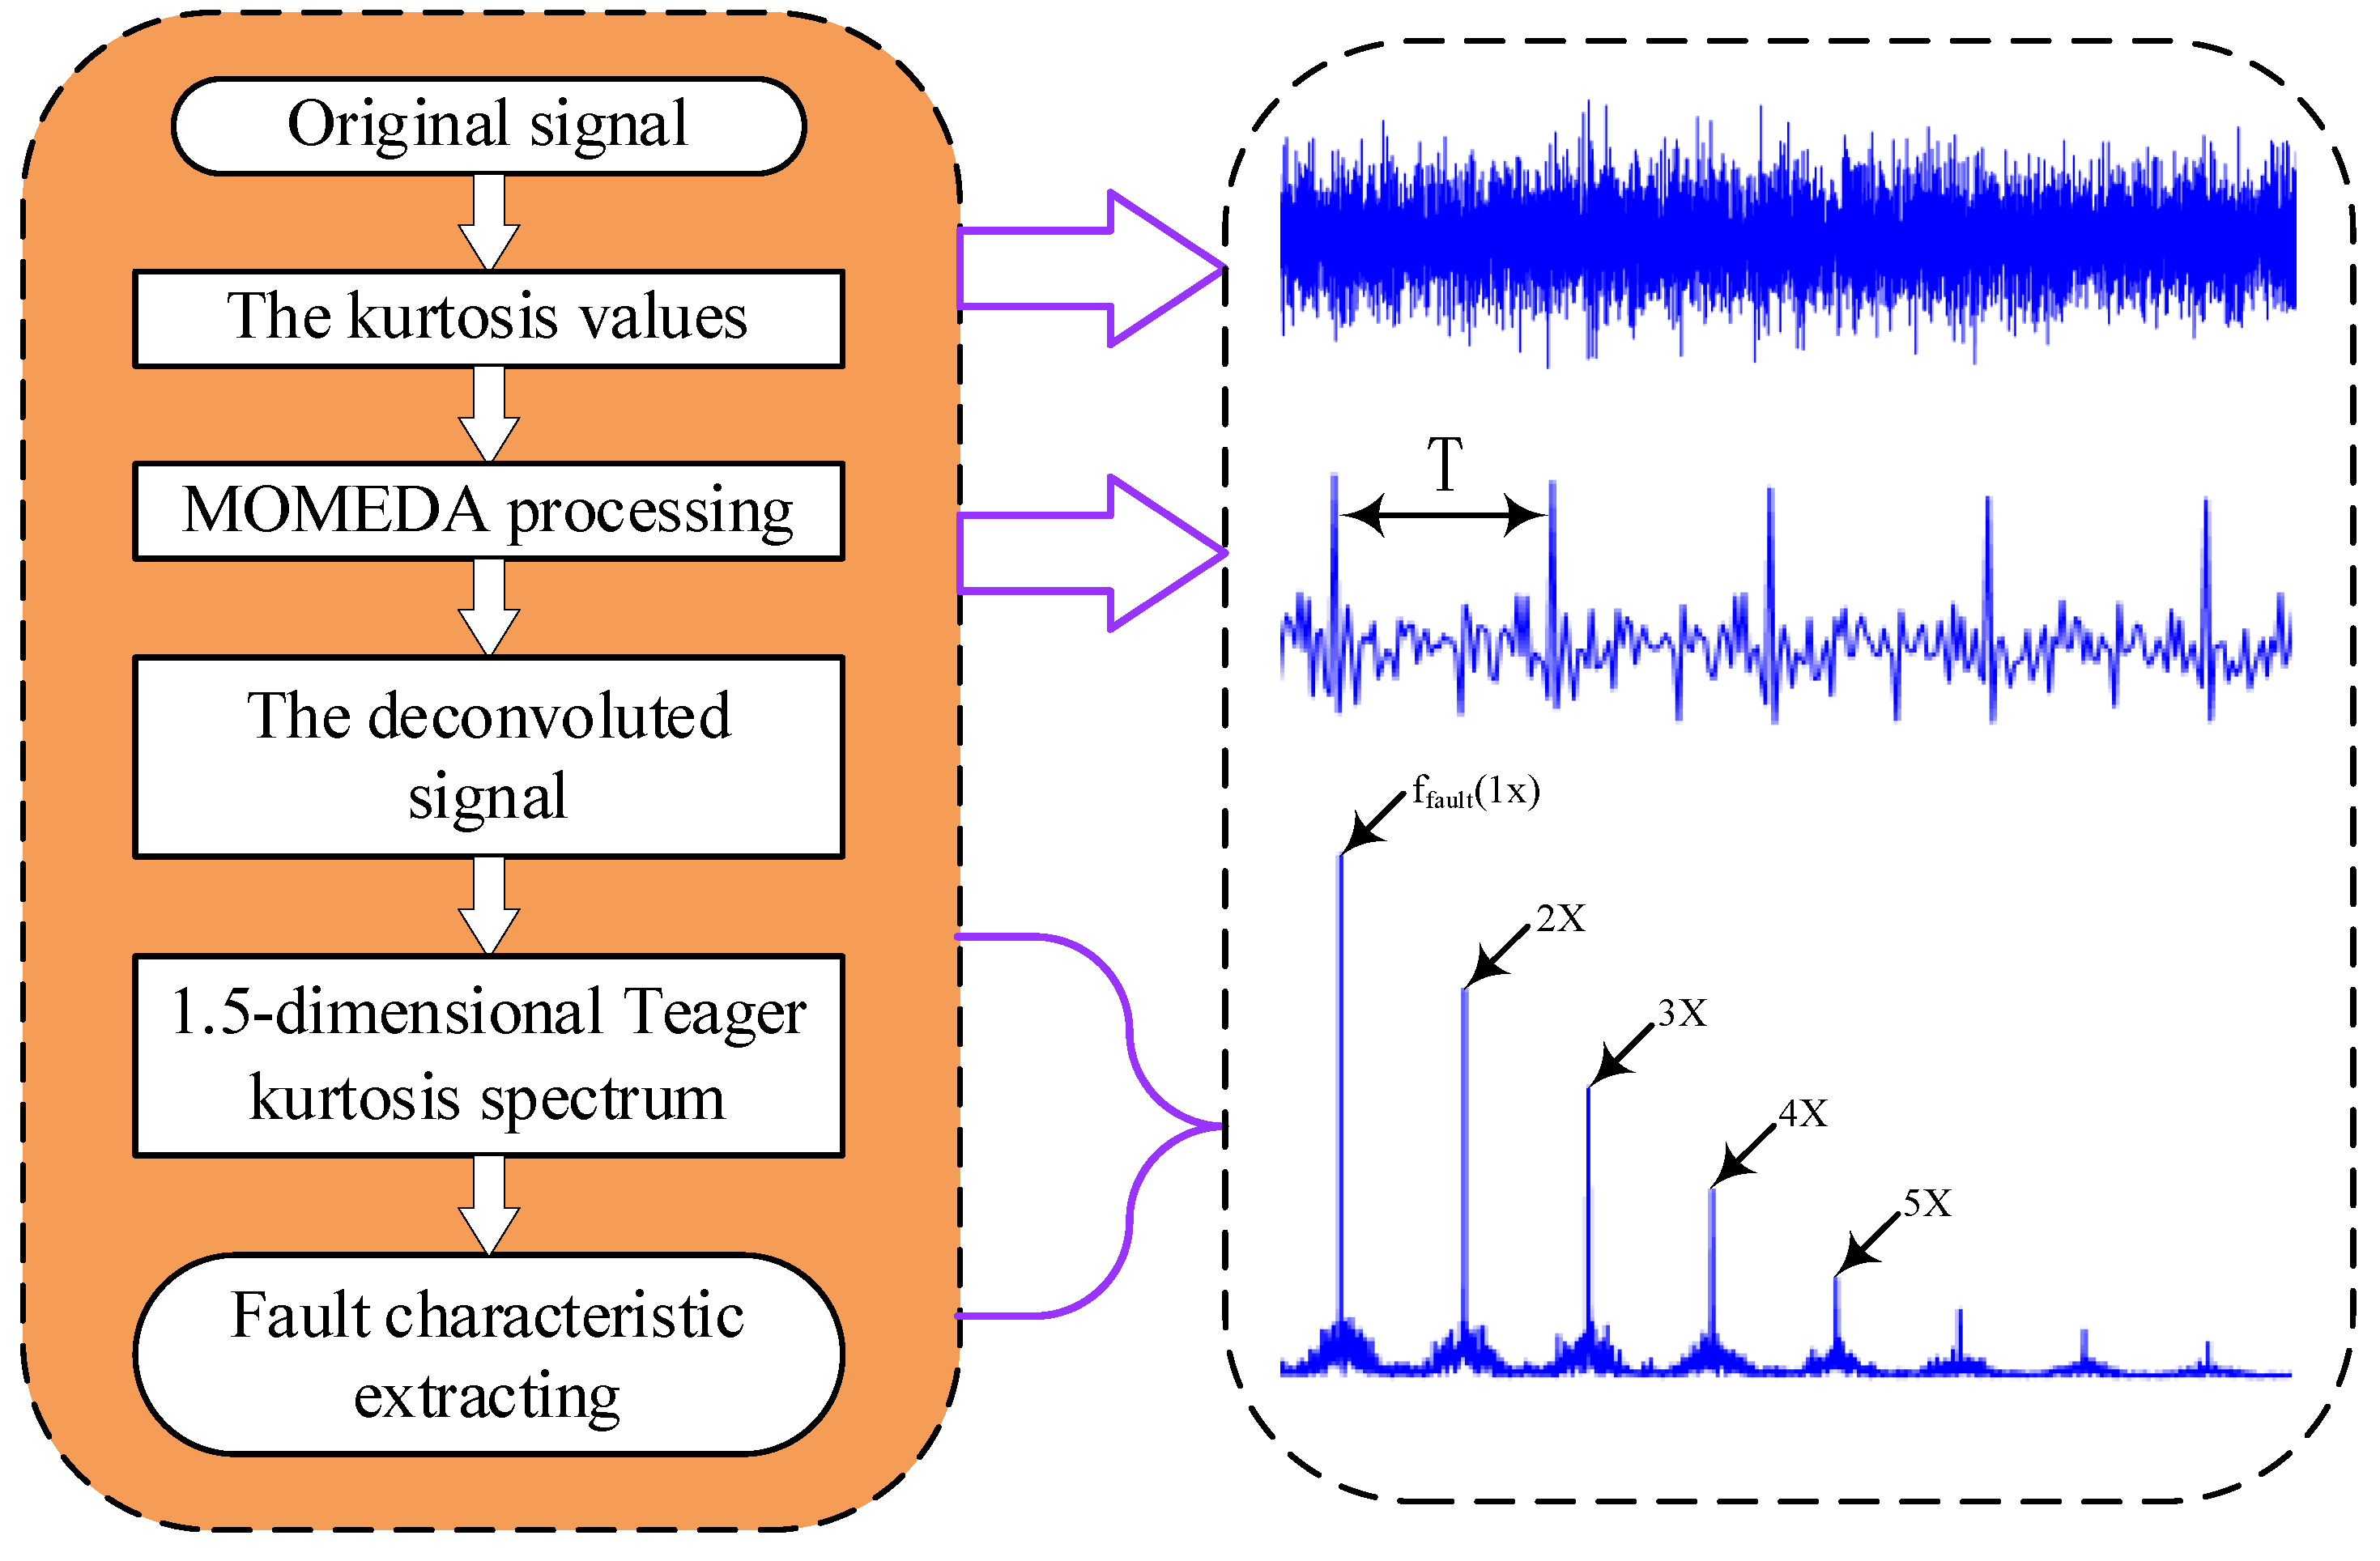
4. Fault Feature Extraction Process
5. Case Analysis
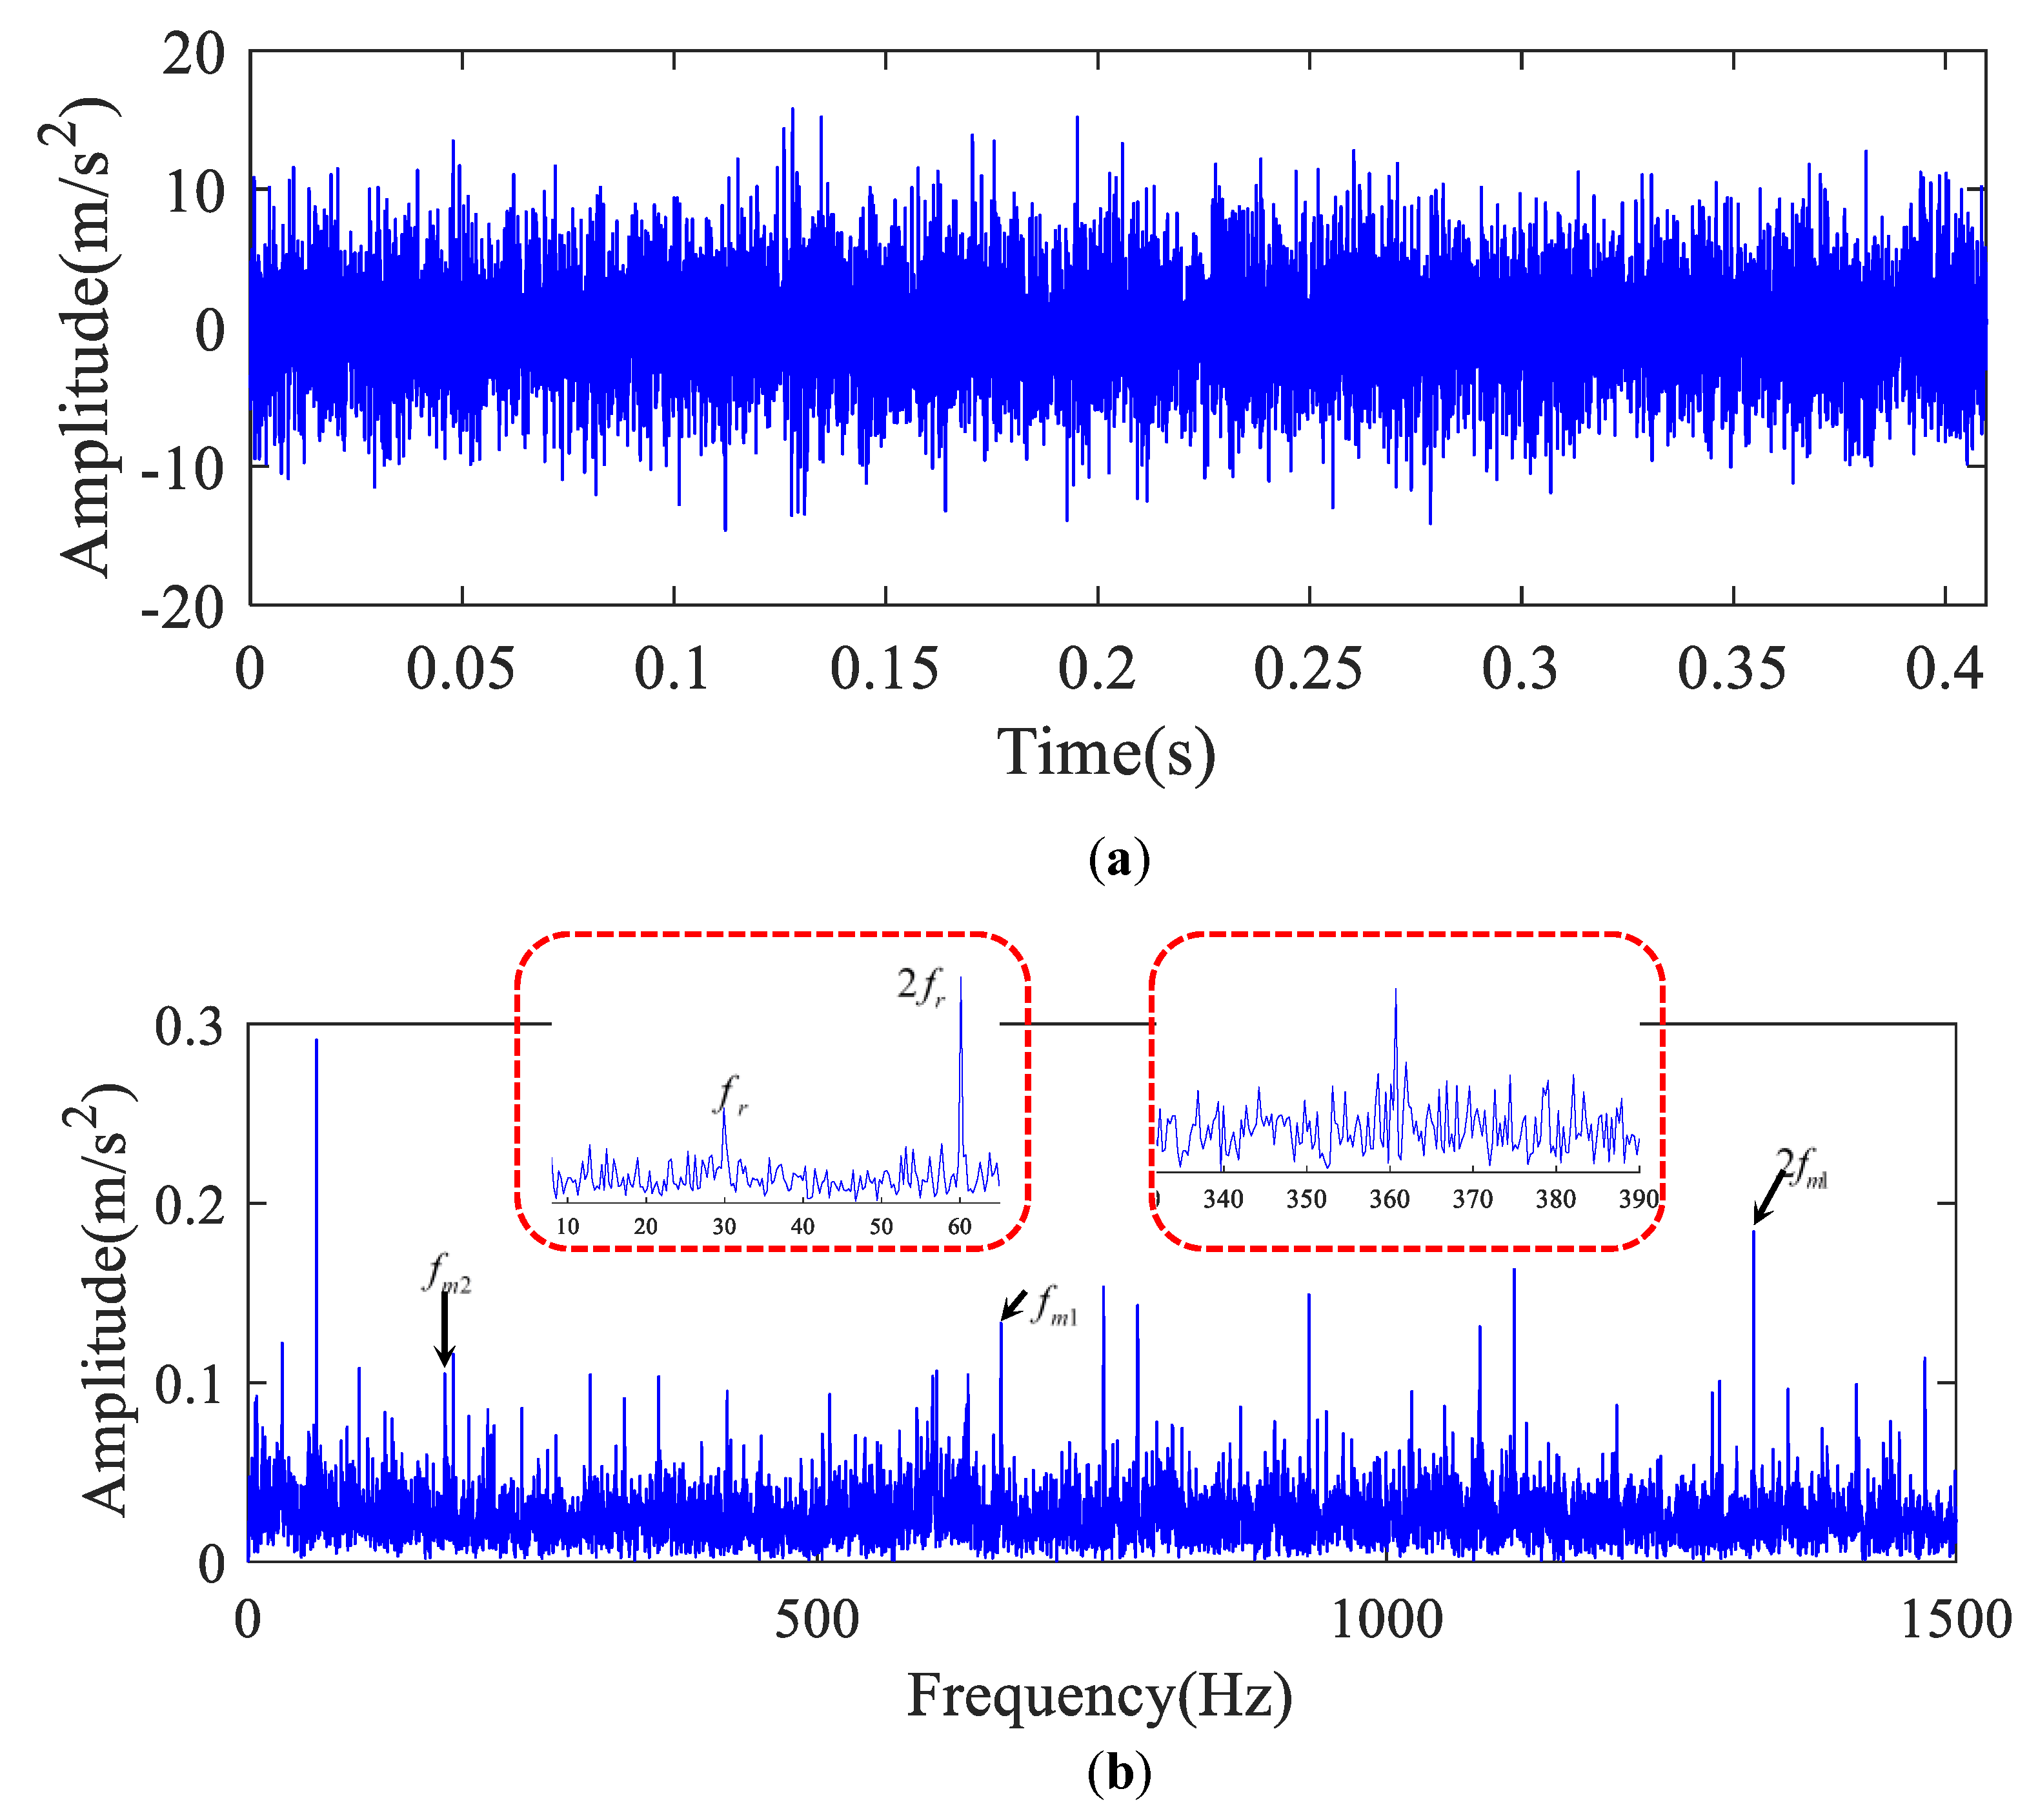
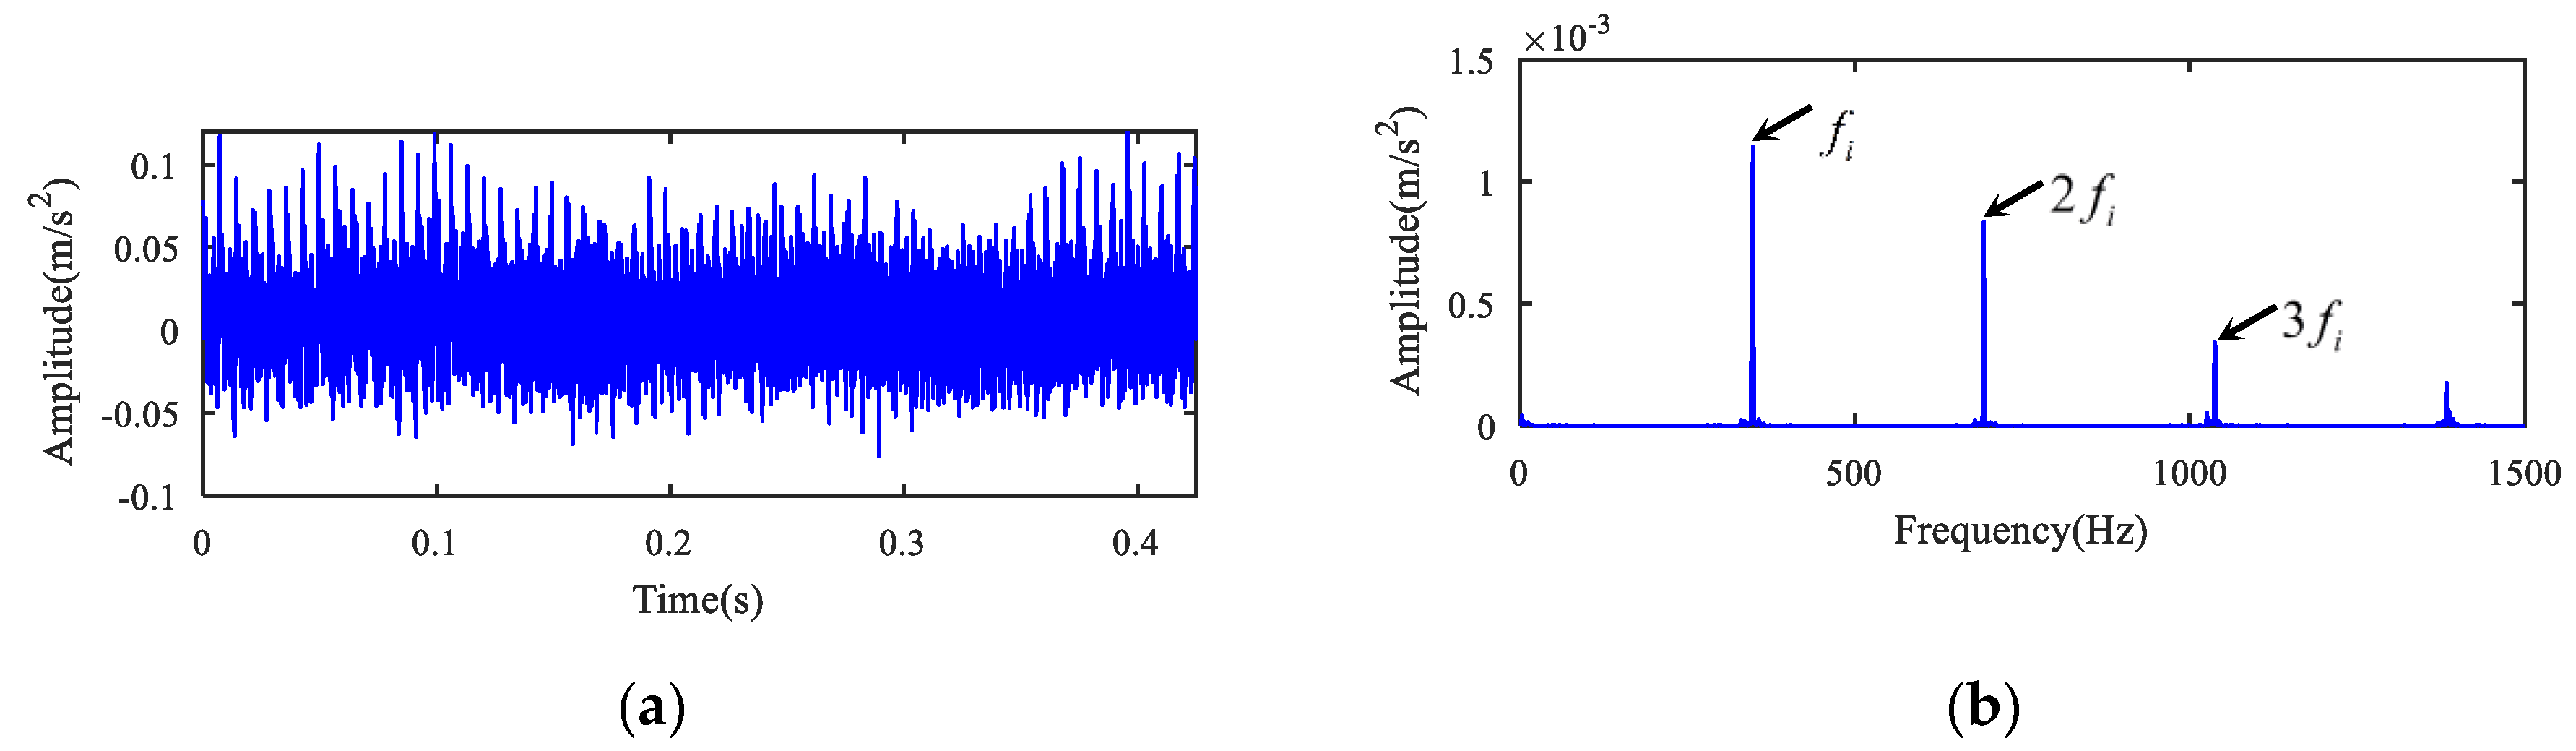
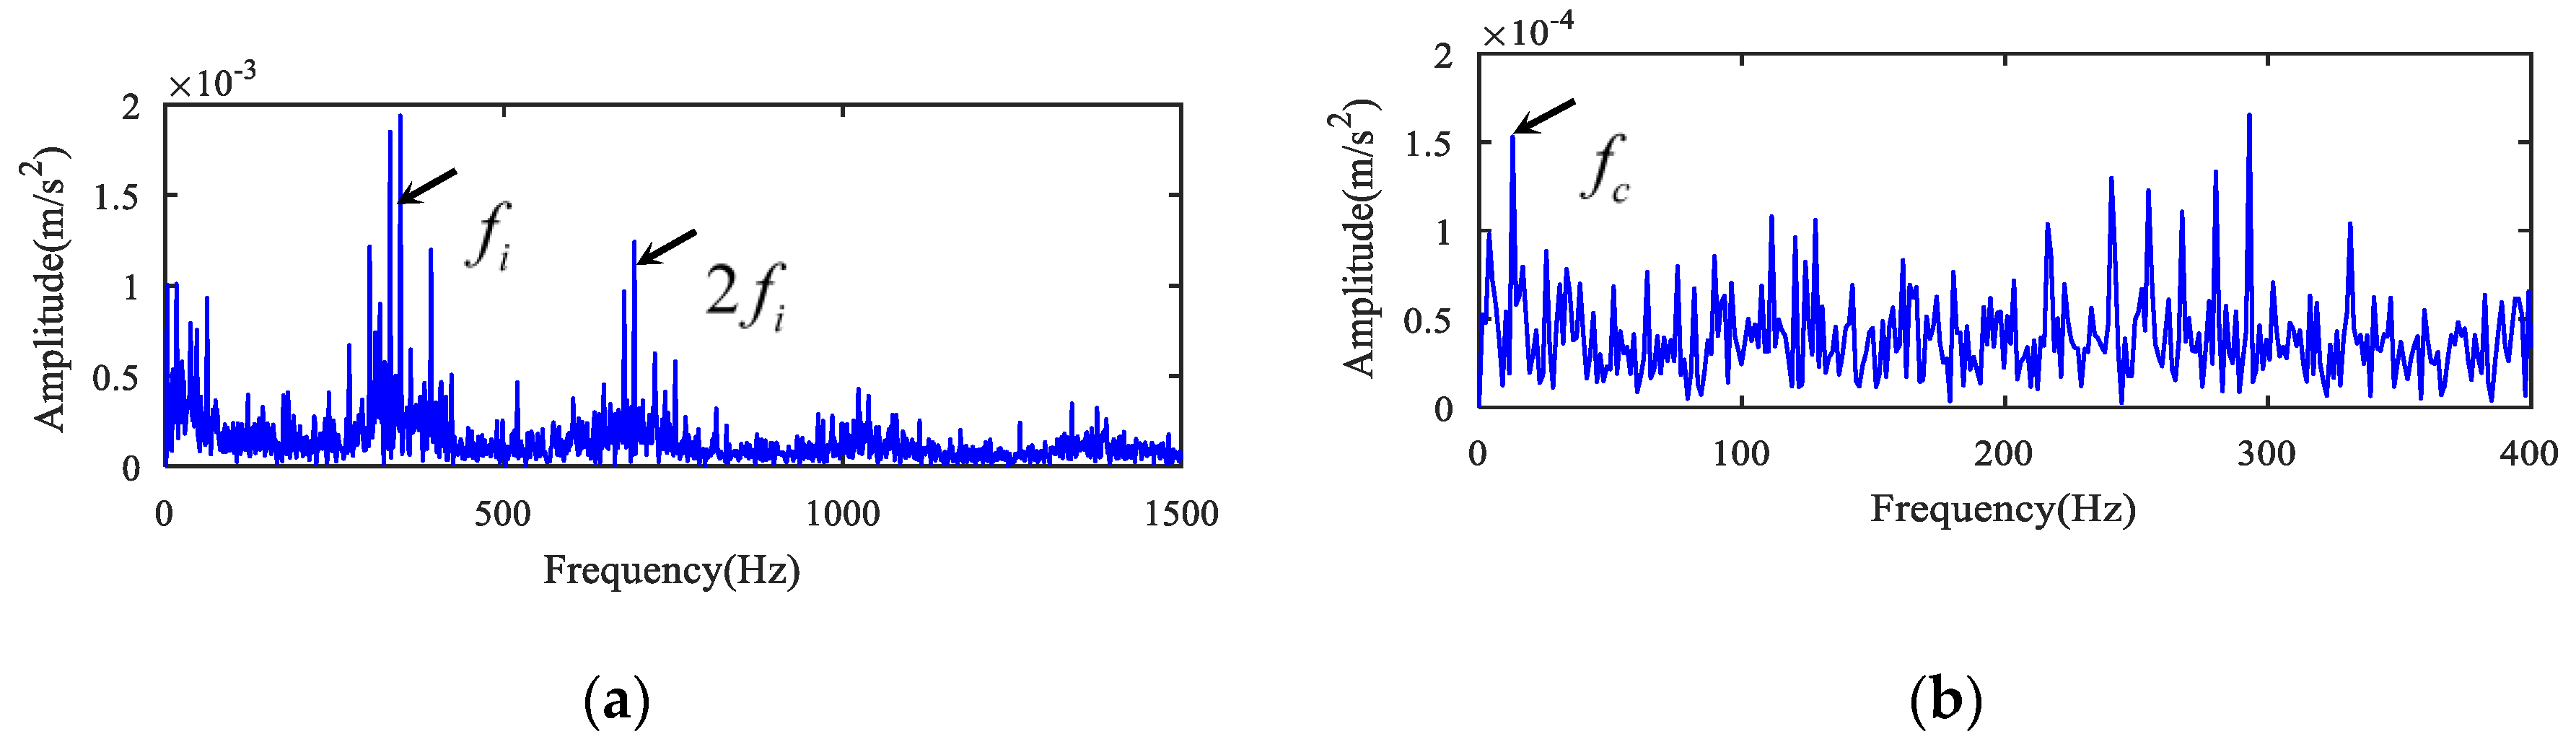
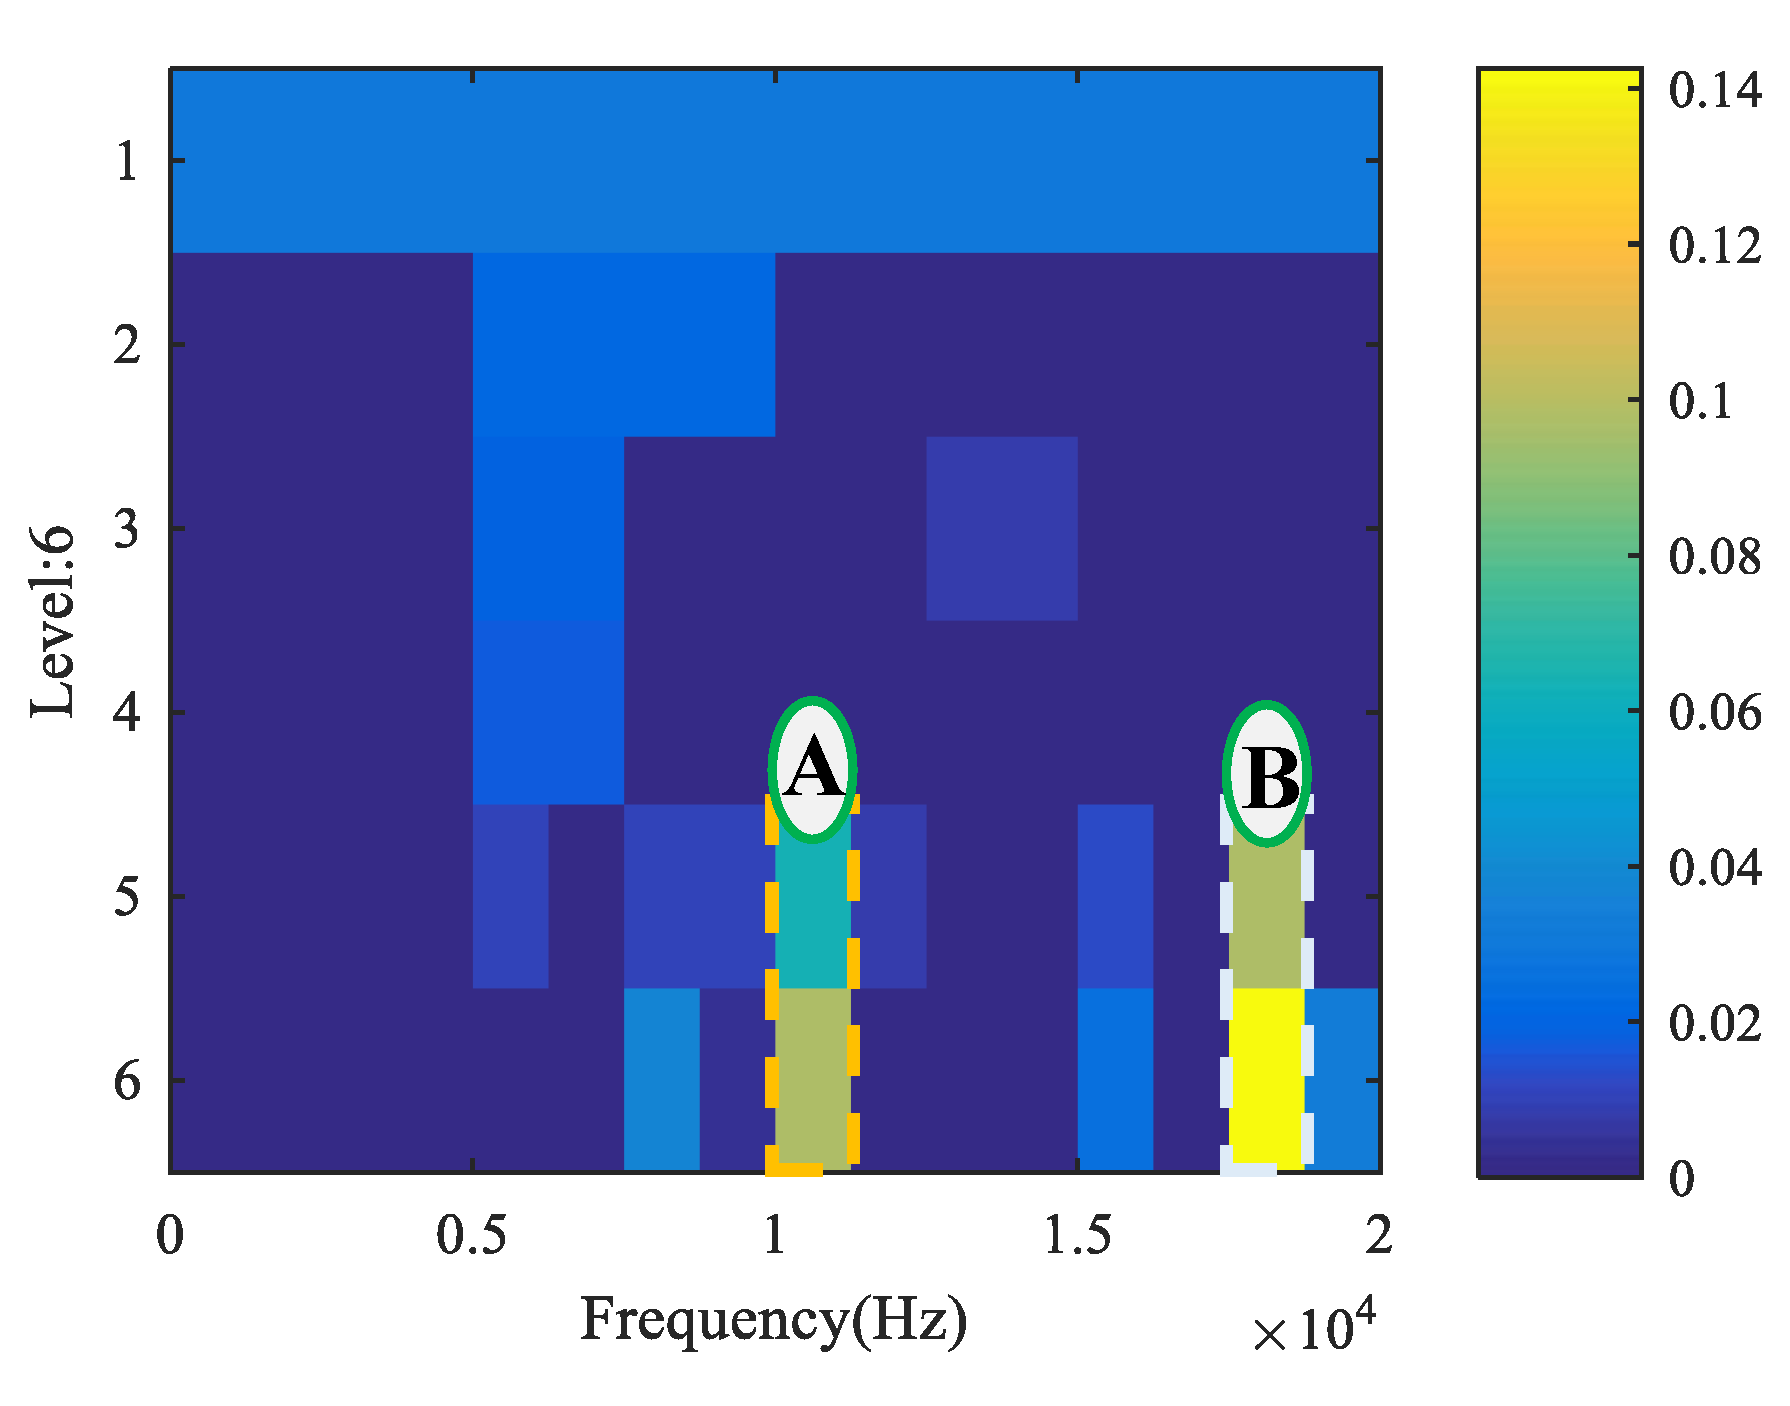
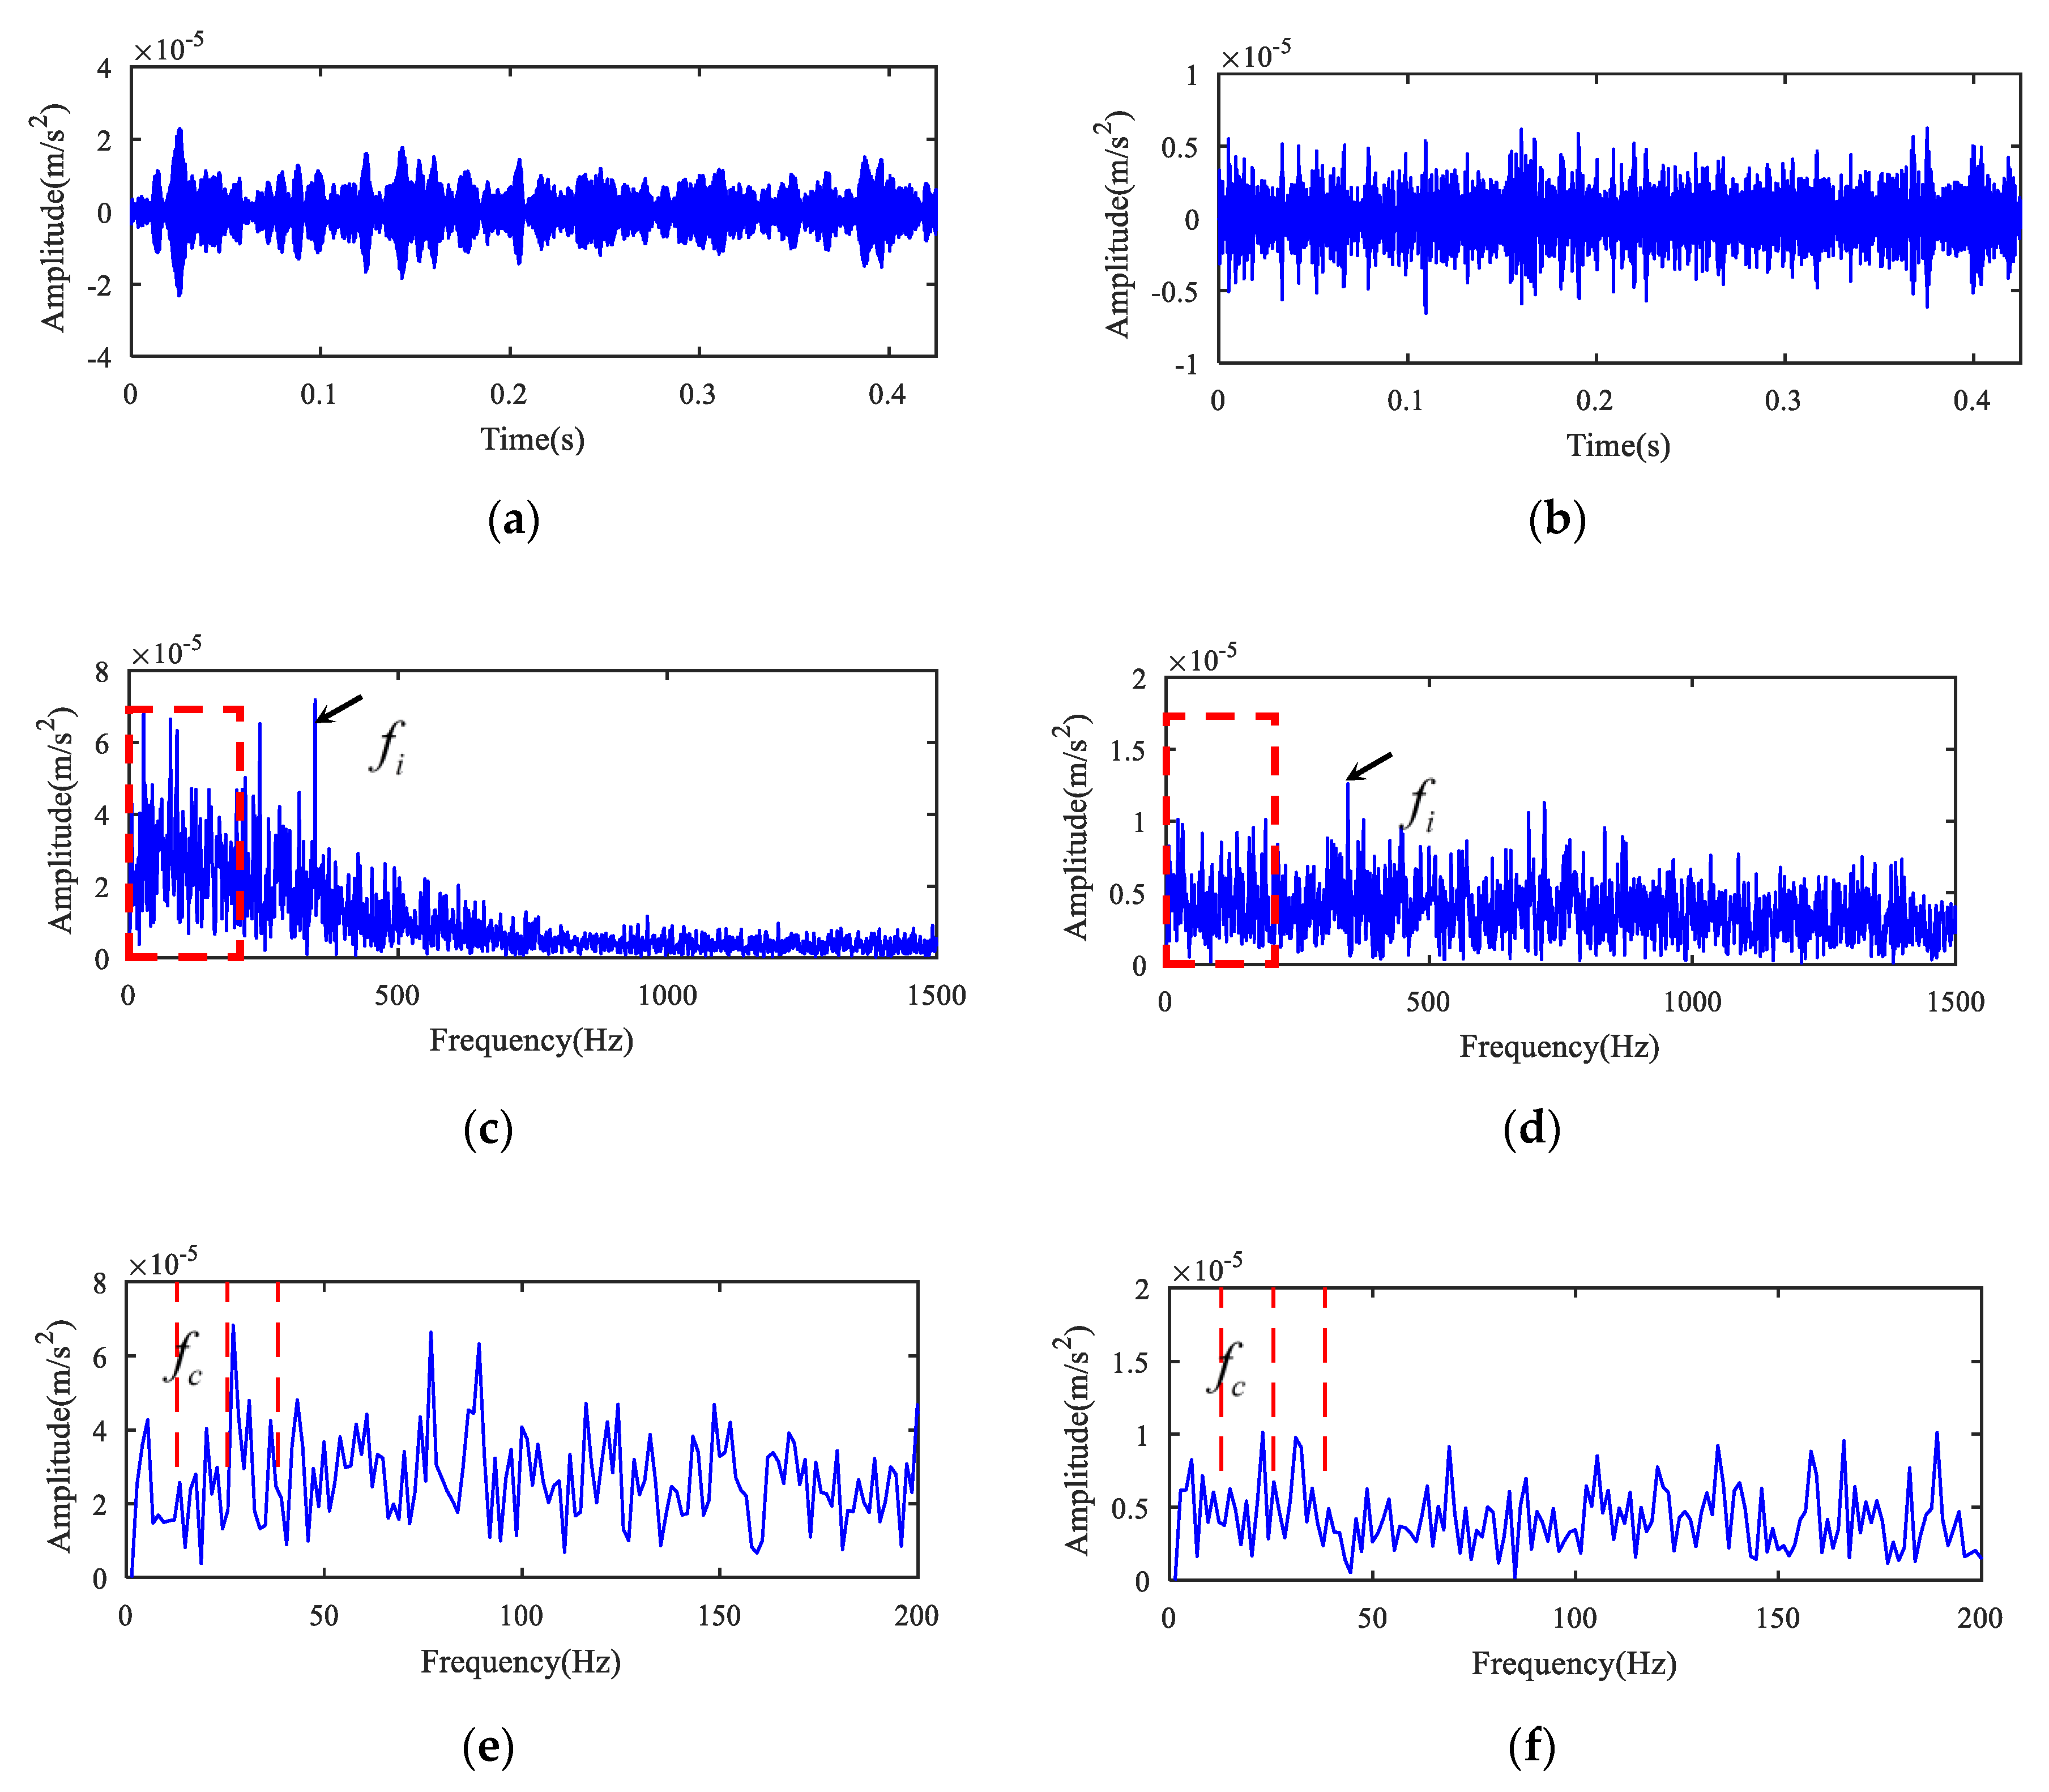
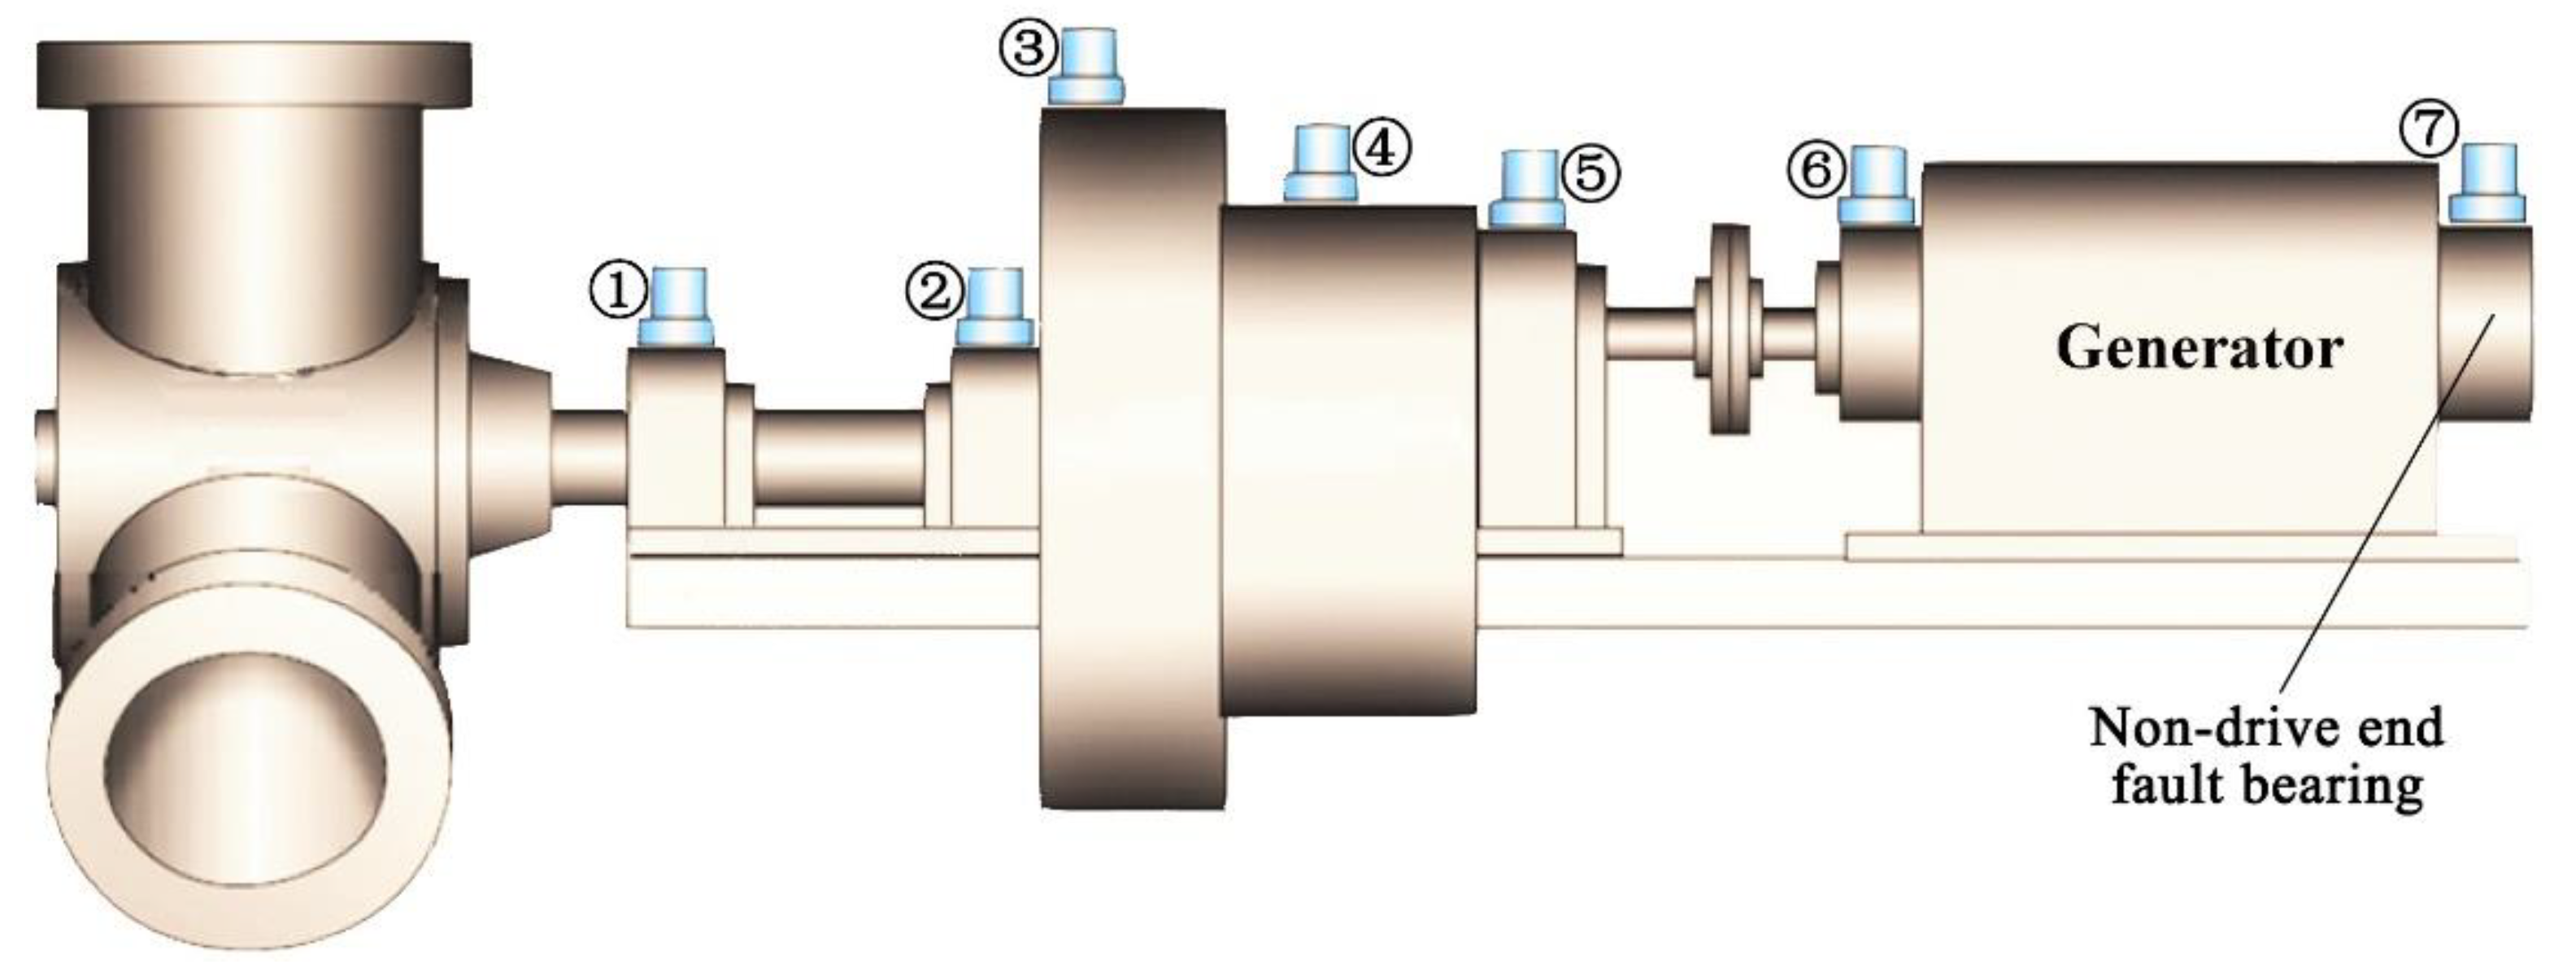
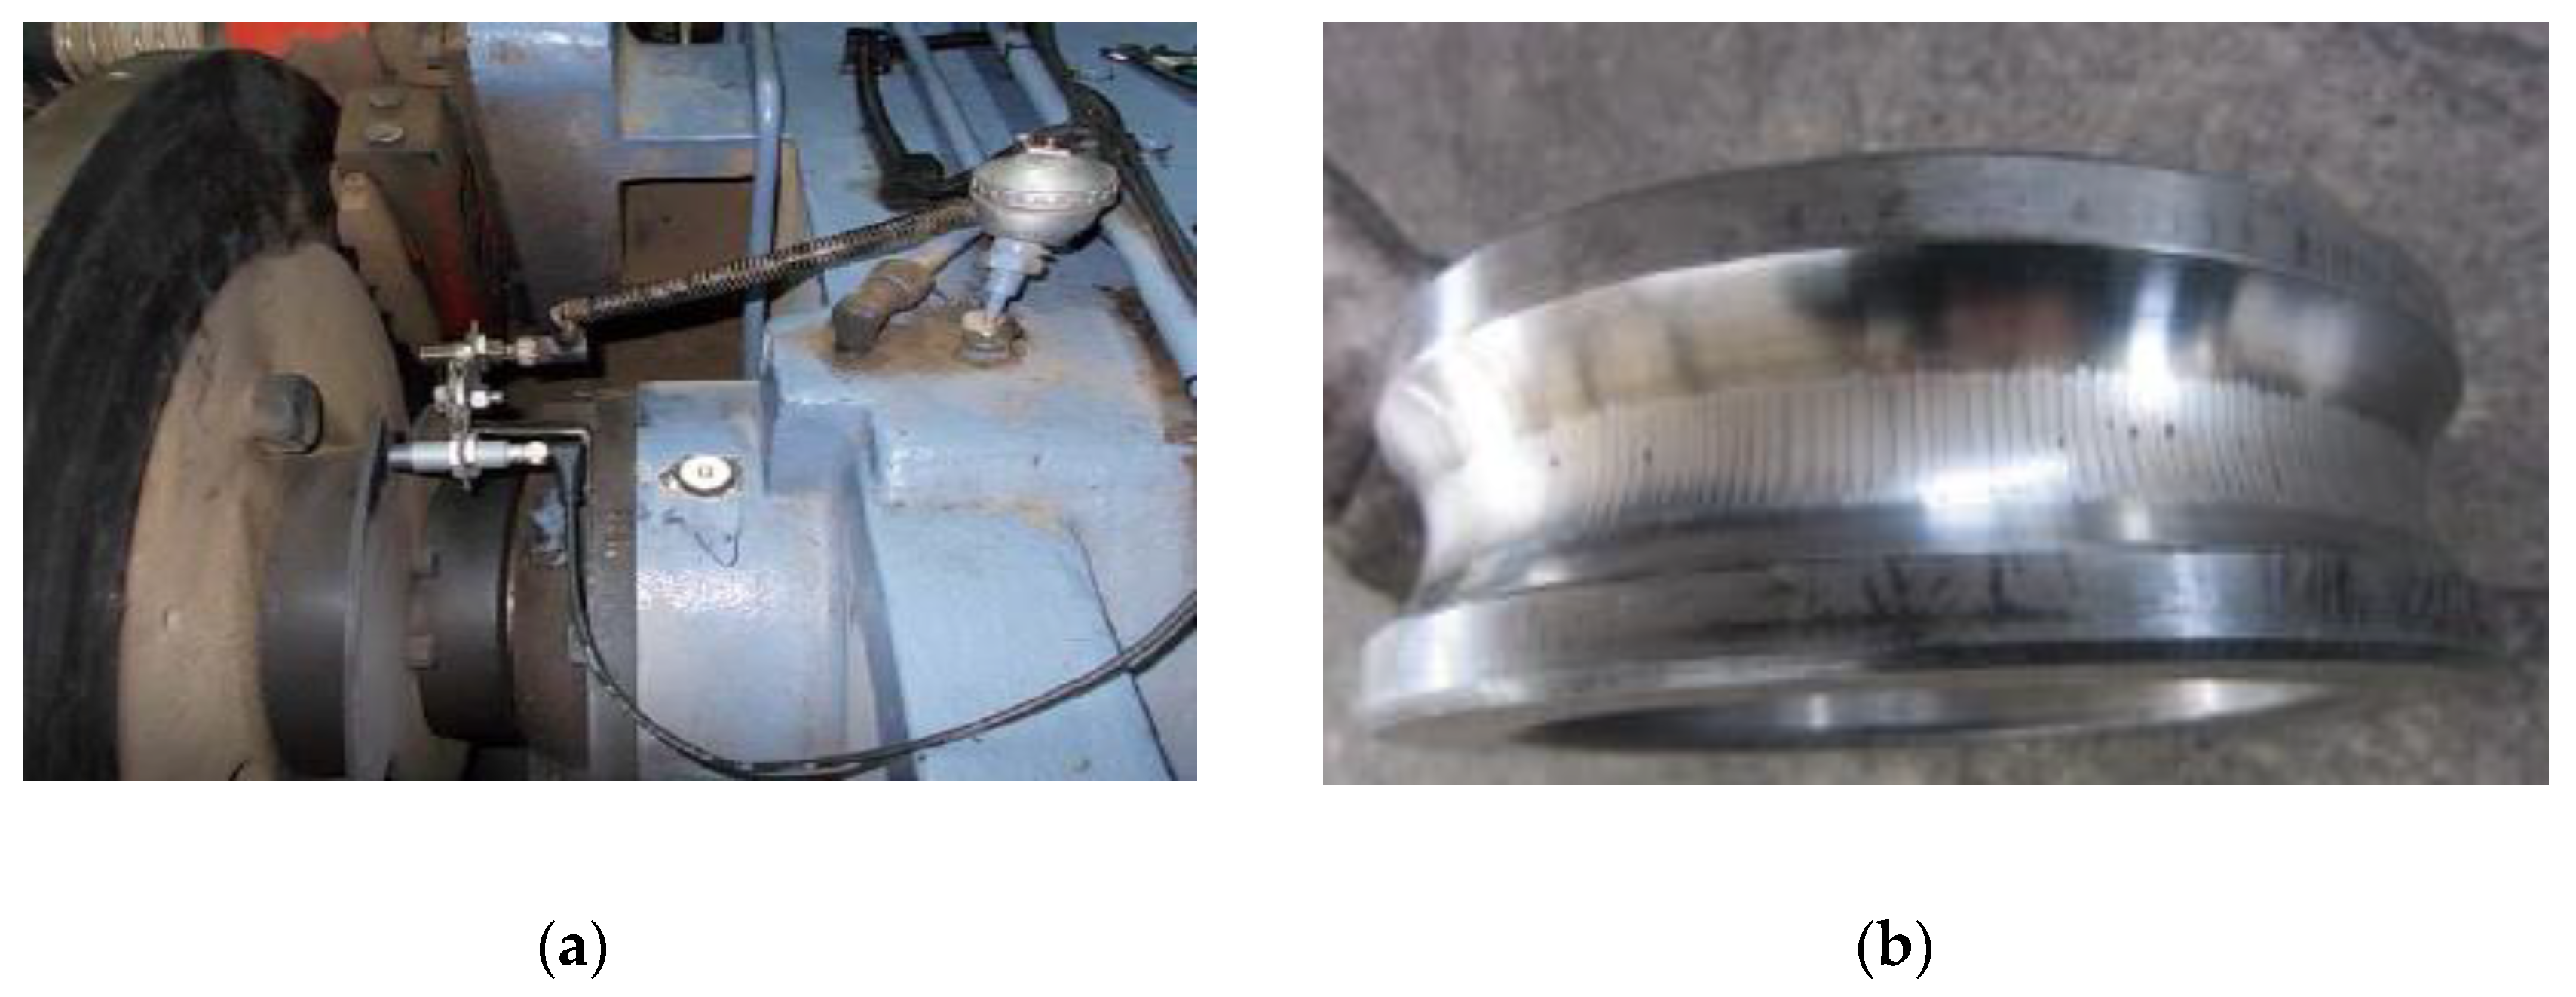
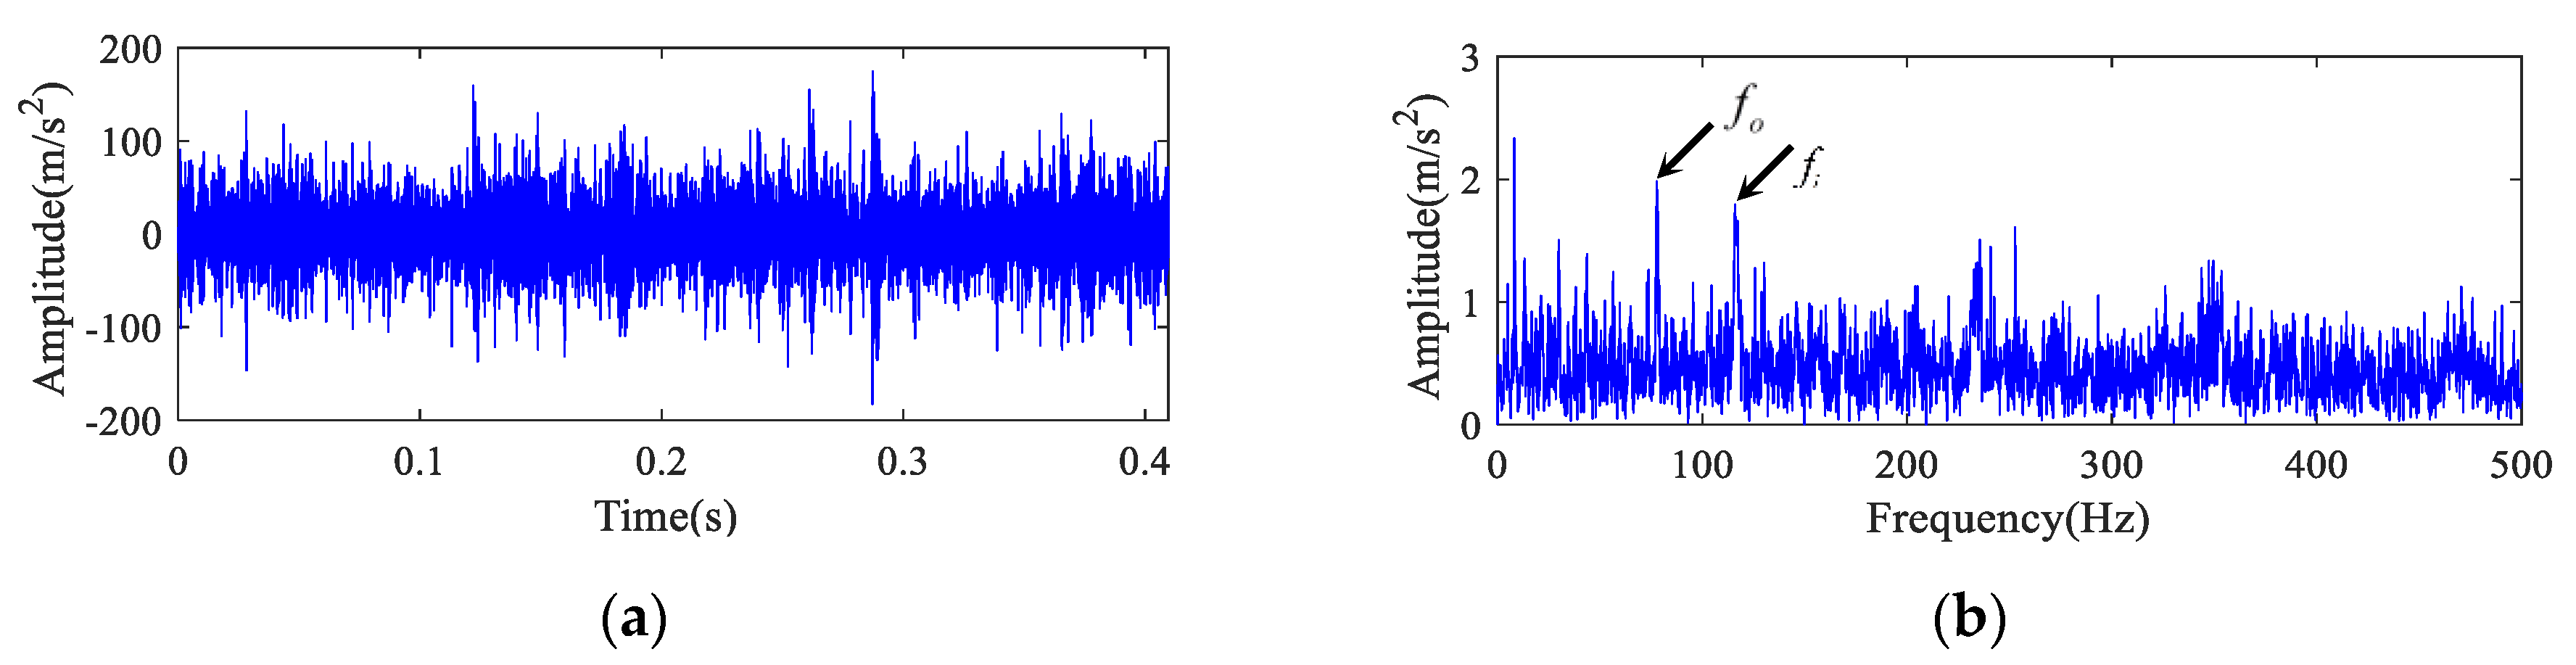
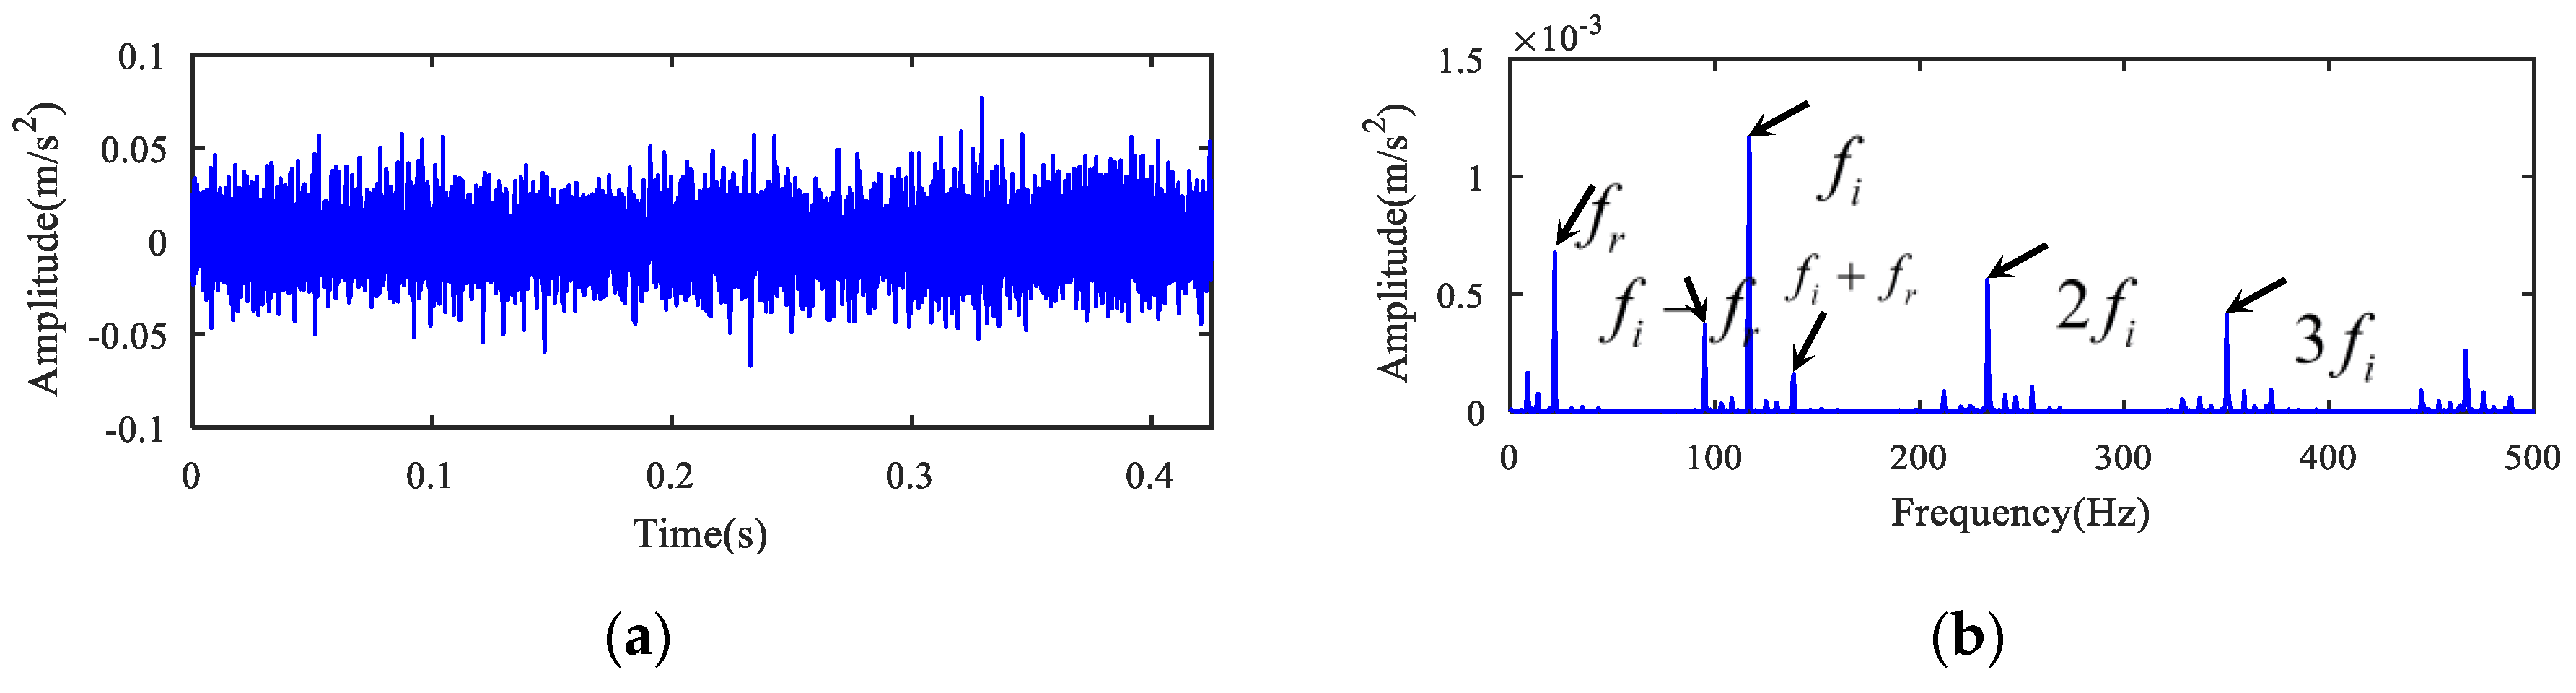
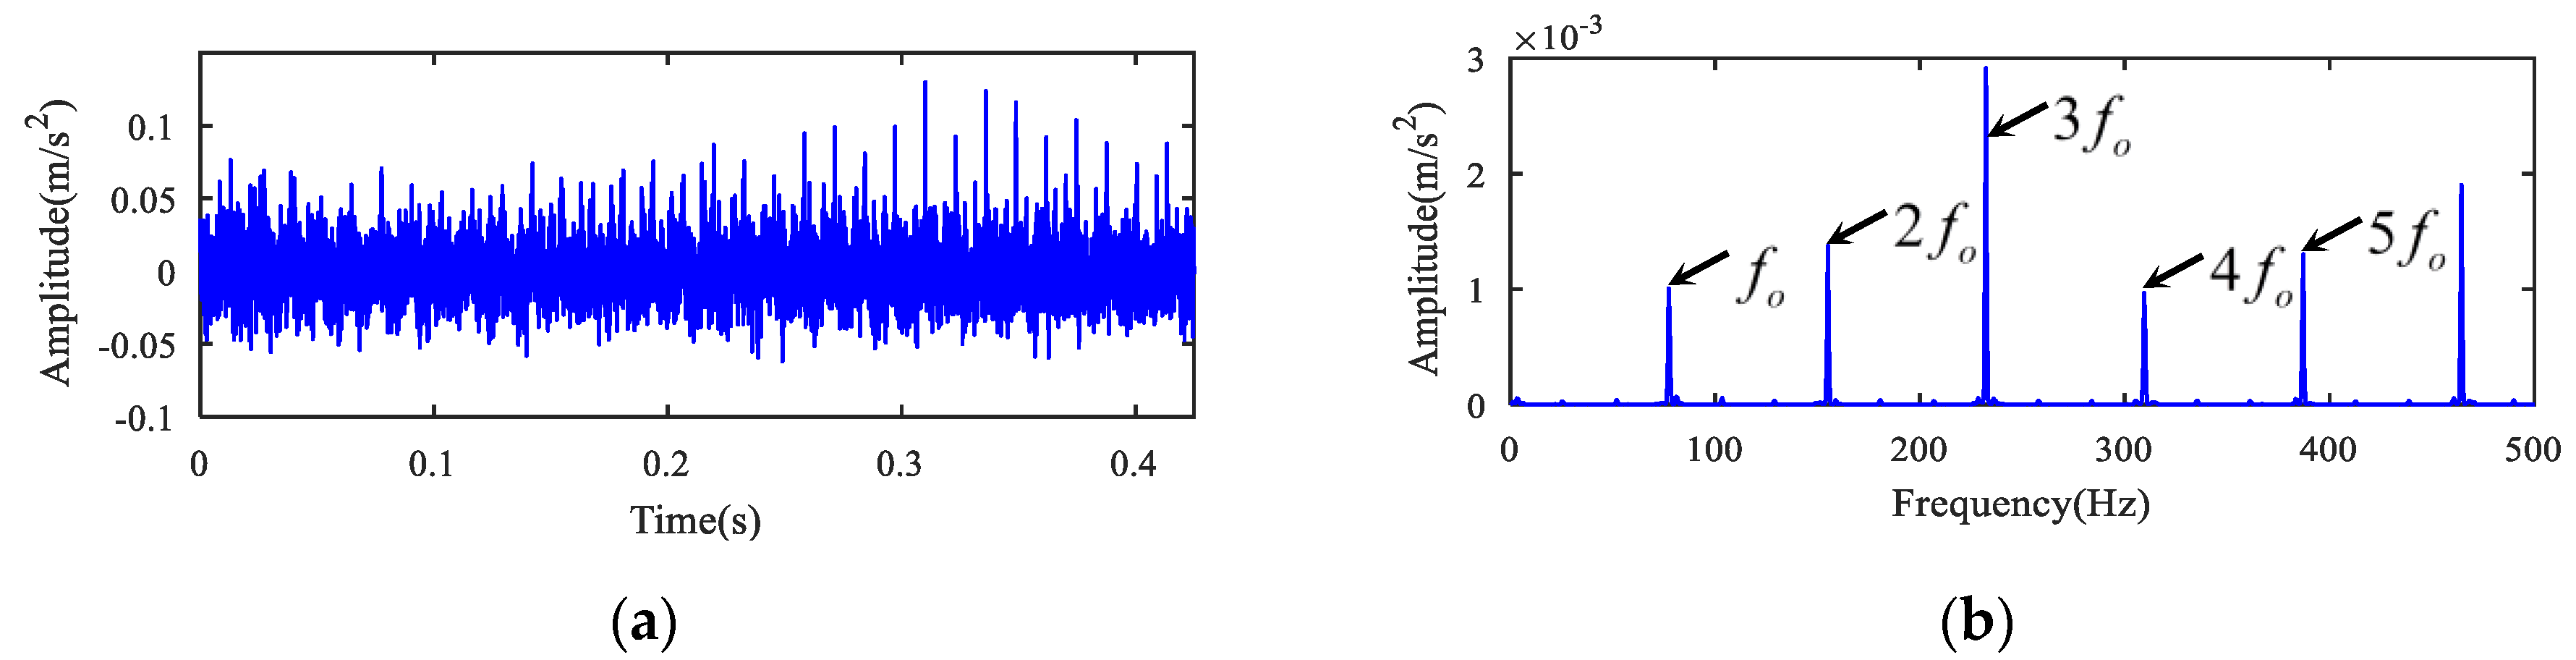
5.1. Case 1
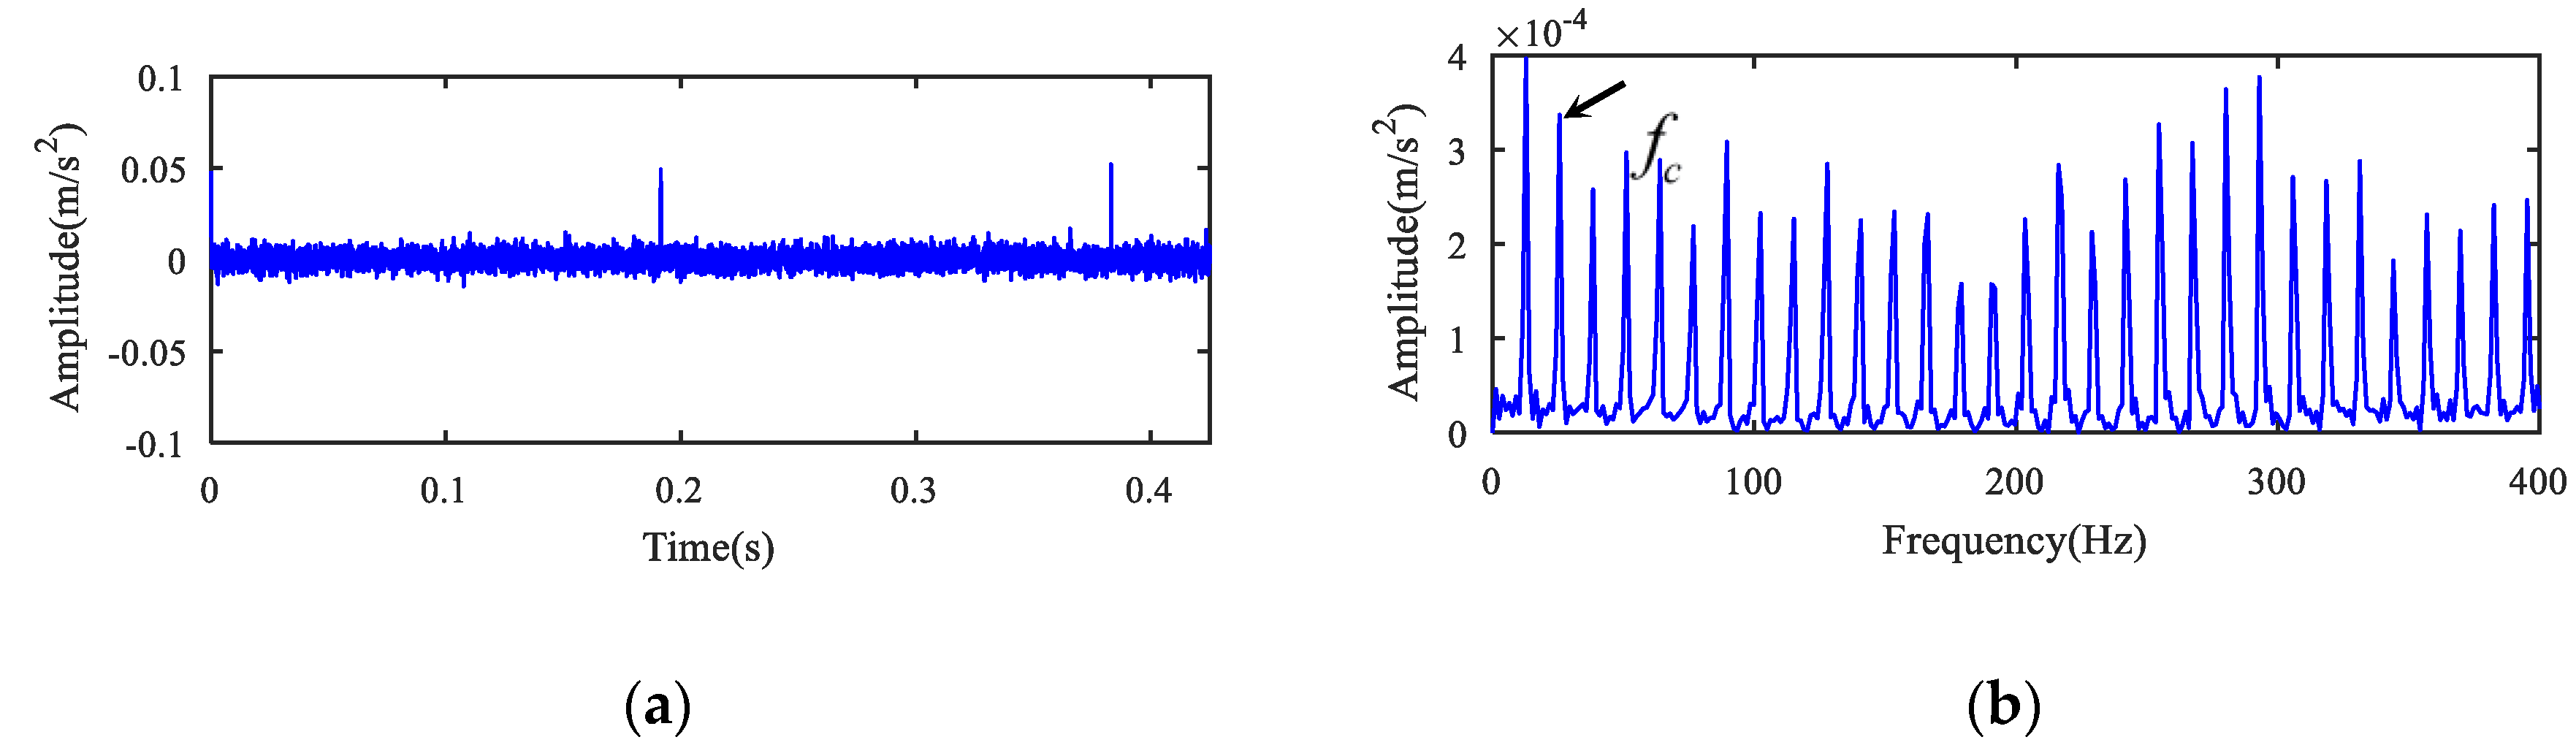
5.2. Case 2
6. Conclusions
Author Contributions
Funding
Acknowledgments
Conflicts of Interest
References
- Liu, W.; Tang, B.; Han, J.; Lu, X.; Hu, N.; He, Z. The structure healthy condition monitoring and fault diagnosis methods in wind turbines: A review. Renew. Sustain. Energy Rev. 2015, 44, 466–472. [Google Scholar] [CrossRef]
- Teng, W.; Ding, X.; Zhang, Y.; Liu, Y.; Ma, Z.; Kusiak, A. Application of cyclic coherence function to bearing fault detection in a wind turbine generator under electromagnetic vibration. Mech. Syst. Signal Process. 2017, 87, 279–293. [Google Scholar] [CrossRef]
- Hu, A.; Bai, Z.; Lin, J.; Xiang, L. Intelligent condition assessment of industry machinery using multiple type of signal from monitoring system. Measurement 2020, 149, 107018. [Google Scholar] [CrossRef]
- Peeters, C.; Guillaume, P.; Helsen, J. A comparison of cepstral editing methods as signal pre-processing techniques for vibration-based bearing fault detection. Mech. Syst. Signal Process. 2017, 91, 354–381. [Google Scholar] [CrossRef]
- Yan, X.; Jia, M.; Xiang, L. Compound fault diagnosis of rotating machinery based on OVMD and a 1.5-dimension envelope spectrum. Meas. Sci. Technol. 2016, 27, 075002. [Google Scholar] [CrossRef]
- Zhang, X.; Zhou, J. Multi-fault diagnosis for rolling element bearings based on ensemble empirical mode decomposition and optimized support vector machines. Mech. Syst. Signal Process. 2013, 41, 127–140. [Google Scholar] [CrossRef]
- Hu, A.; Xiang, L.; Zhang, Y. Experimental study on the intrawave frequency modulation characteristic of rotor rub and crack fault. Mech. Syst. Signal Process. 2019, 118, 209–225. [Google Scholar] [CrossRef]
- He, S.; Chen, J.; Zhou, Z.; Zi, Y.; Wang, Y.; Wang, X. Multifractal entropy based adaptive multiwavelet construction and its application for mechanical compound-fault diagnosis. Mech. Syst. Signal Process. 2016, 76, 742–758. [Google Scholar] [CrossRef]
- Xue, Y.; Dou, D.; Yang, J. Multi-fault diagnosis of rotating machinery based on deep convolution neural network and support vector machine. Measurement 2020, 156, 107571. [Google Scholar] [CrossRef]
- Hao, Y.; Song, L.; Cui, L.; Wang, H. A three-dimensional geometric features-based SCA algorithm for compound faults diagnosis. Measurement 2019, 134, 480–491. [Google Scholar] [CrossRef]
- Ding, C.; Zhao, M.; Lin, J.; Jiao, J. Multi-objective iterative optimization algorithm based optimal wavelet filter selection for multi-fault diagnosis of rolling element bearings. ISA Trans. 2019, 88, 199–215. [Google Scholar] [CrossRef] [PubMed]
- Li, C.; Sánchez, R.-V.; Zurita, G.; Cerrada, M.; Cabrera, D. Rolling element bearing defect detection using the generalized synchrosqueezing transform guided by time–frequency ridge enhancement. ISA Trans. 2016, 60, 274–284. [Google Scholar] [CrossRef] [PubMed]
- Yan, X.; Jia, M.; Zhang, W.; Zhu, L. Fault diagnosis of rolling element bearing using a new optimal scale morphology analysis method. ISA Trans. 2018, 73, 165–180. [Google Scholar] [CrossRef] [PubMed]
- Kong, Y.; Wang, T.; Feng, Z.; Chu, F. Discriminative dictionary learning based sparse representation classification for intelligent fault identification of planet bearings in wind turbine. Renew. Energy 2020, 152, 754–769. [Google Scholar] [CrossRef]
- He, D.; Wang, X.; Li, S.; Lin, J.; Zhao, M. Identification of multiple faults in rotating machinery based on minimum entropy deconvolution combined with spectral kurtosis. Mech. Syst. Signal Process. 2016, 81, 235–249. [Google Scholar] [CrossRef]
- Sawalhi, N.; Randall, R.B.; Endo, H. The enhancement of fault detection and diagnosis in rolling element bearings using minimum entropy deconvolution combined with spectral kurtosis. Mech. Syst. Signal Process. 2007, 21, 2616–2633. [Google Scholar] [CrossRef]
- Endo, H.; Randall, R.B. Enhancement of autoregressive model based gear tooth fault detection technique by the use of minimum entropy deconvolution filter. Mech. Syst. Signal Process. 2007, 21, 906–919. [Google Scholar] [CrossRef]
- Jiang, R.; Dong, G.; Chen, J.; Liu, T.; Xiao, W. The weak fault diagnosis and condition monitoring of rolling element bearing using minimum entropy deconvolution and envelop spectrum. Proc. Inst. Mech. Eng. Part C: J. Mech. Eng. Sci. 2012, 227, 1116–1129. [Google Scholar] [CrossRef]
- McDonald, G.L.; Zhao, Q.; Zuo, M.J. Maximum correlated Kurtosis deconvolution and application on gear tooth chip fault detection. Mech. Syst. Signal Process. 2012, 33, 237–255. [Google Scholar] [CrossRef]
- Cheng, Y.; Zhou, N.; Zhang, W.; Wang, Z. Application of an improved minimum entropy deconvolution method for railway rolling element bearing fault diagnosis. J. Sound Vib. 2018, 425, 53–69. [Google Scholar] [CrossRef]
- McDonald, G.L.; Zhao, Q. Multipoint Optimal Minimum Entropy Deconvolution and Convolution Fix: Application to vibration fault detection. Mech. Syst. Signal Process. 2017, 82, 461–477. [Google Scholar] [CrossRef]
- Kachenoura, A.; Albera, L.; Bellanger, J.J.; Senhadji, L. Nonminimum Phase Identification Based on Higher Order Spectrum Slices. IEEE Trans. Signal Process. 2008, 56, 1821–1829. [Google Scholar] [CrossRef][Green Version]
- Maragos, P.; Kaiser, J.; Quatieri, T. Energy separation in signal modulations with application to speech analysis. IEEE Trans. Signal Process. 1993, 41, 3024–3051. [Google Scholar] [CrossRef]


| Name | |||||
|---|---|---|---|---|---|
| Frequency/Hz | 30 | 660 | 172.5 | 345.3 | 12.75 |
| L | 2 | 3 | 4 | 5 | 6 | 7 | 8 | 9 | 10 | 11 | 12 | 13 | 14 | 15 |
|---|---|---|---|---|---|---|---|---|---|---|---|---|---|---|
| K1 | 132.10 | 122.80 | 118.70 | 100.42 | 79.45 | 67.26 | 58.75 | 52.66 | 49.92 | 46.49 | 42.87 | 41.32 | 40.20 | 38.59 |
| K2 | 2904.2 | 2106.1 | 1655.2 | 1316.7 | 942.0 | 1206.0 | 1360.2 | 866.4 | 611.4 | 494.6 | 429.3 | 385.6 | 353.1 | 327.5 |
| Fault Features | Advantages | Disadvantages | |
|---|---|---|---|
| SK + MED | Invisible and noisy | Prominent fundamental frequency | Cannot separate the composite fault features |
| MOMEDA | Visible and clear | Eliminating interference | Can separate composite fault features |
| Bearing Type | SKF 6330M.C3 |
|---|---|
| Inner ring failure frequency | 116.7 Hz |
| Outer ring failure frequency | 77.4 Hz |
| Rolling element failure characteristic frequency | 51 Hz |
| Cage failure characteristic frequency | 8.6 Hz |
| L | 2 | 3 | 4 | 5 | 6 | 7 | 8 | 9 | 10 | 11 | 12 | 13 | 14 | 15 |
|---|---|---|---|---|---|---|---|---|---|---|---|---|---|---|
| K1 | 84.00 | 82.88 | 74.38 | 57.36 | 43.19 | 37.32 | 37.14 | 38.08 | 38.41 | 38.42 | 38.42 | 38.72 | 39.19 | 39.05 |
| K2 | 417.12 | 452.85 | 311.59 | 216.84 | 151.71 | 101.80 | 67.33 | 45.69 | 33.13 | 27.96 | 27.00 | 28.38 | 30.44 | 31.94 |
| Fault Features | Advantages | Disadvantages | |
|---|---|---|---|
| SK + MED | Visible inner race fault frequency | Prominent fundamental frequency | Cannot separate the composite fault features |
| MOMEDA | Visible inner and outer race fault frequencies | Eliminates interference | Can separate composite fault features |
© 2020 by the authors. Licensee MDPI, Basel, Switzerland. This article is an open access article distributed under the terms and conditions of the Creative Commons Attribution (CC BY) license (http://creativecommons.org/licenses/by/4.0/).
Share and Cite
Xiang, L.; Su, H.; Li, Y. Research on Extraction of Compound Fault Characteristics for Rolling Bearings in Wind Turbines. Entropy 2020, 22, 682. https://doi.org/10.3390/e22060682
Xiang L, Su H, Li Y. Research on Extraction of Compound Fault Characteristics for Rolling Bearings in Wind Turbines. Entropy. 2020; 22(6):682. https://doi.org/10.3390/e22060682
Chicago/Turabian StyleXiang, Ling, Hao Su, and Ying Li. 2020. "Research on Extraction of Compound Fault Characteristics for Rolling Bearings in Wind Turbines" Entropy 22, no. 6: 682. https://doi.org/10.3390/e22060682
APA StyleXiang, L., Su, H., & Li, Y. (2020). Research on Extraction of Compound Fault Characteristics for Rolling Bearings in Wind Turbines. Entropy, 22(6), 682. https://doi.org/10.3390/e22060682