The performance of the different entropy and scaling methods, the inter-scale ordinal distance and benchmark features were compared for mental workload assessment. Comparison was done for different levels of physical workload, thus allowing for the robustness of the features to be assessed relative to increases in movement artifacts and changing dynamics of the heart rate brought on by physical activity. We first compared the performance of the different combinations of entropy and scaling approaches for different activity levels. The best performing algorithms were then compared to the performance of ordinal distance scale similarity measure and benchmark features. Additionally, we performed feature fusion where all the different feature sets were combined to test for feature set complementarity.
3.1. Comparing Different Multi-Scale Entropy Algorithms
We calculated the accuracy (
) for different activity levels with the combinations of the three entropy measures and five scaling algorithms.
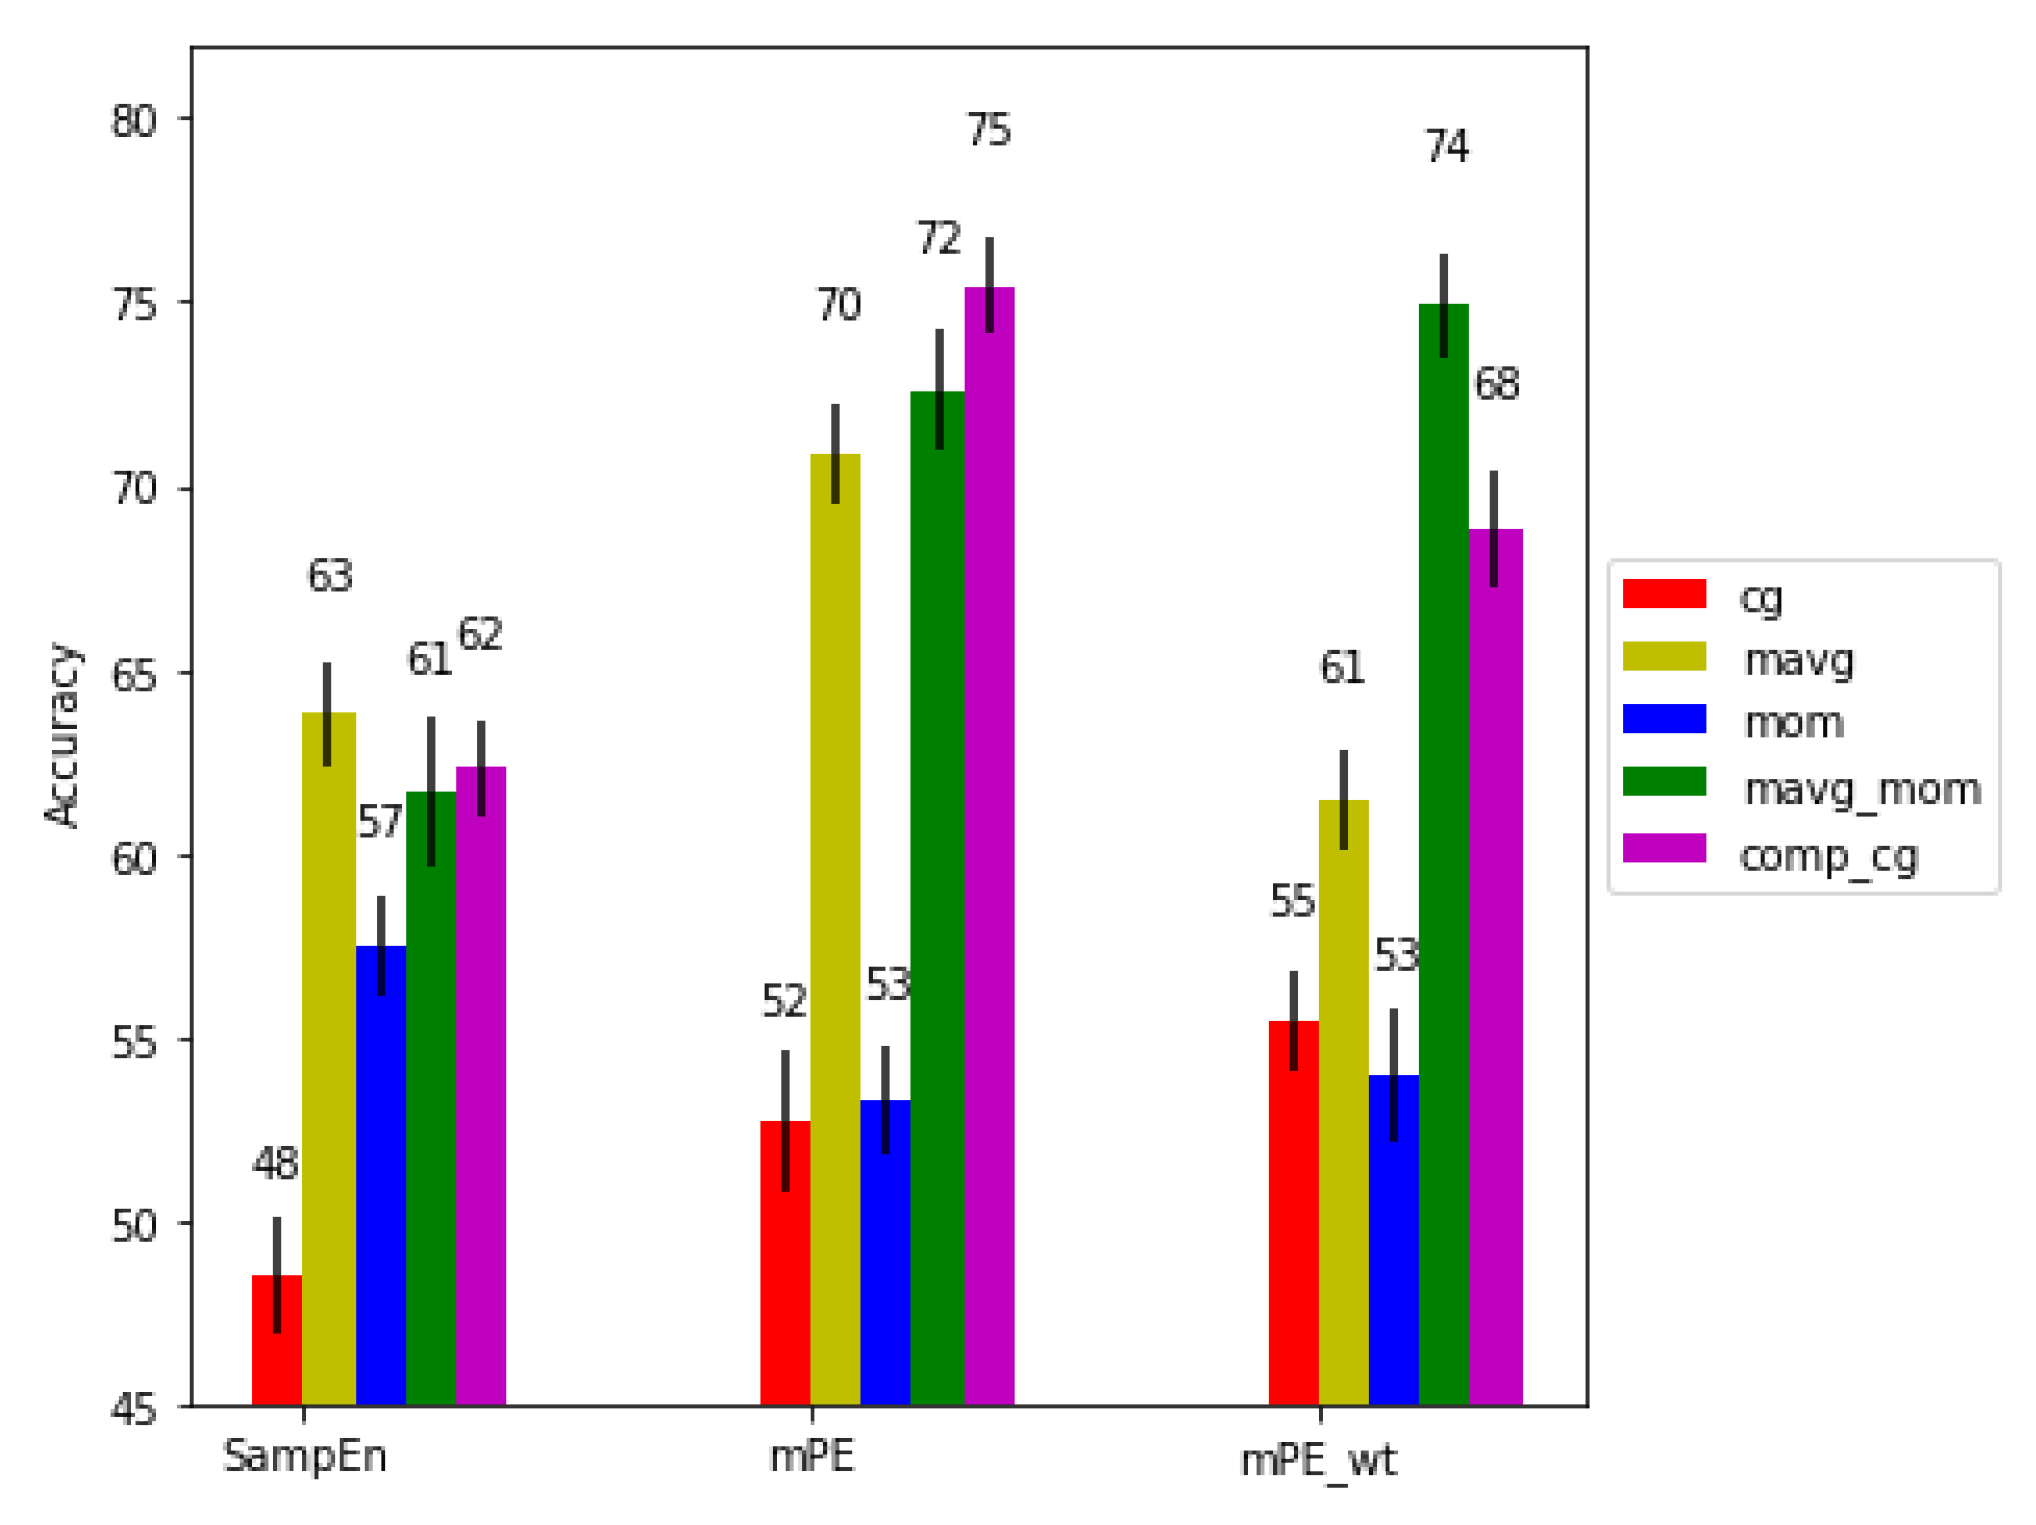
Figure 6,
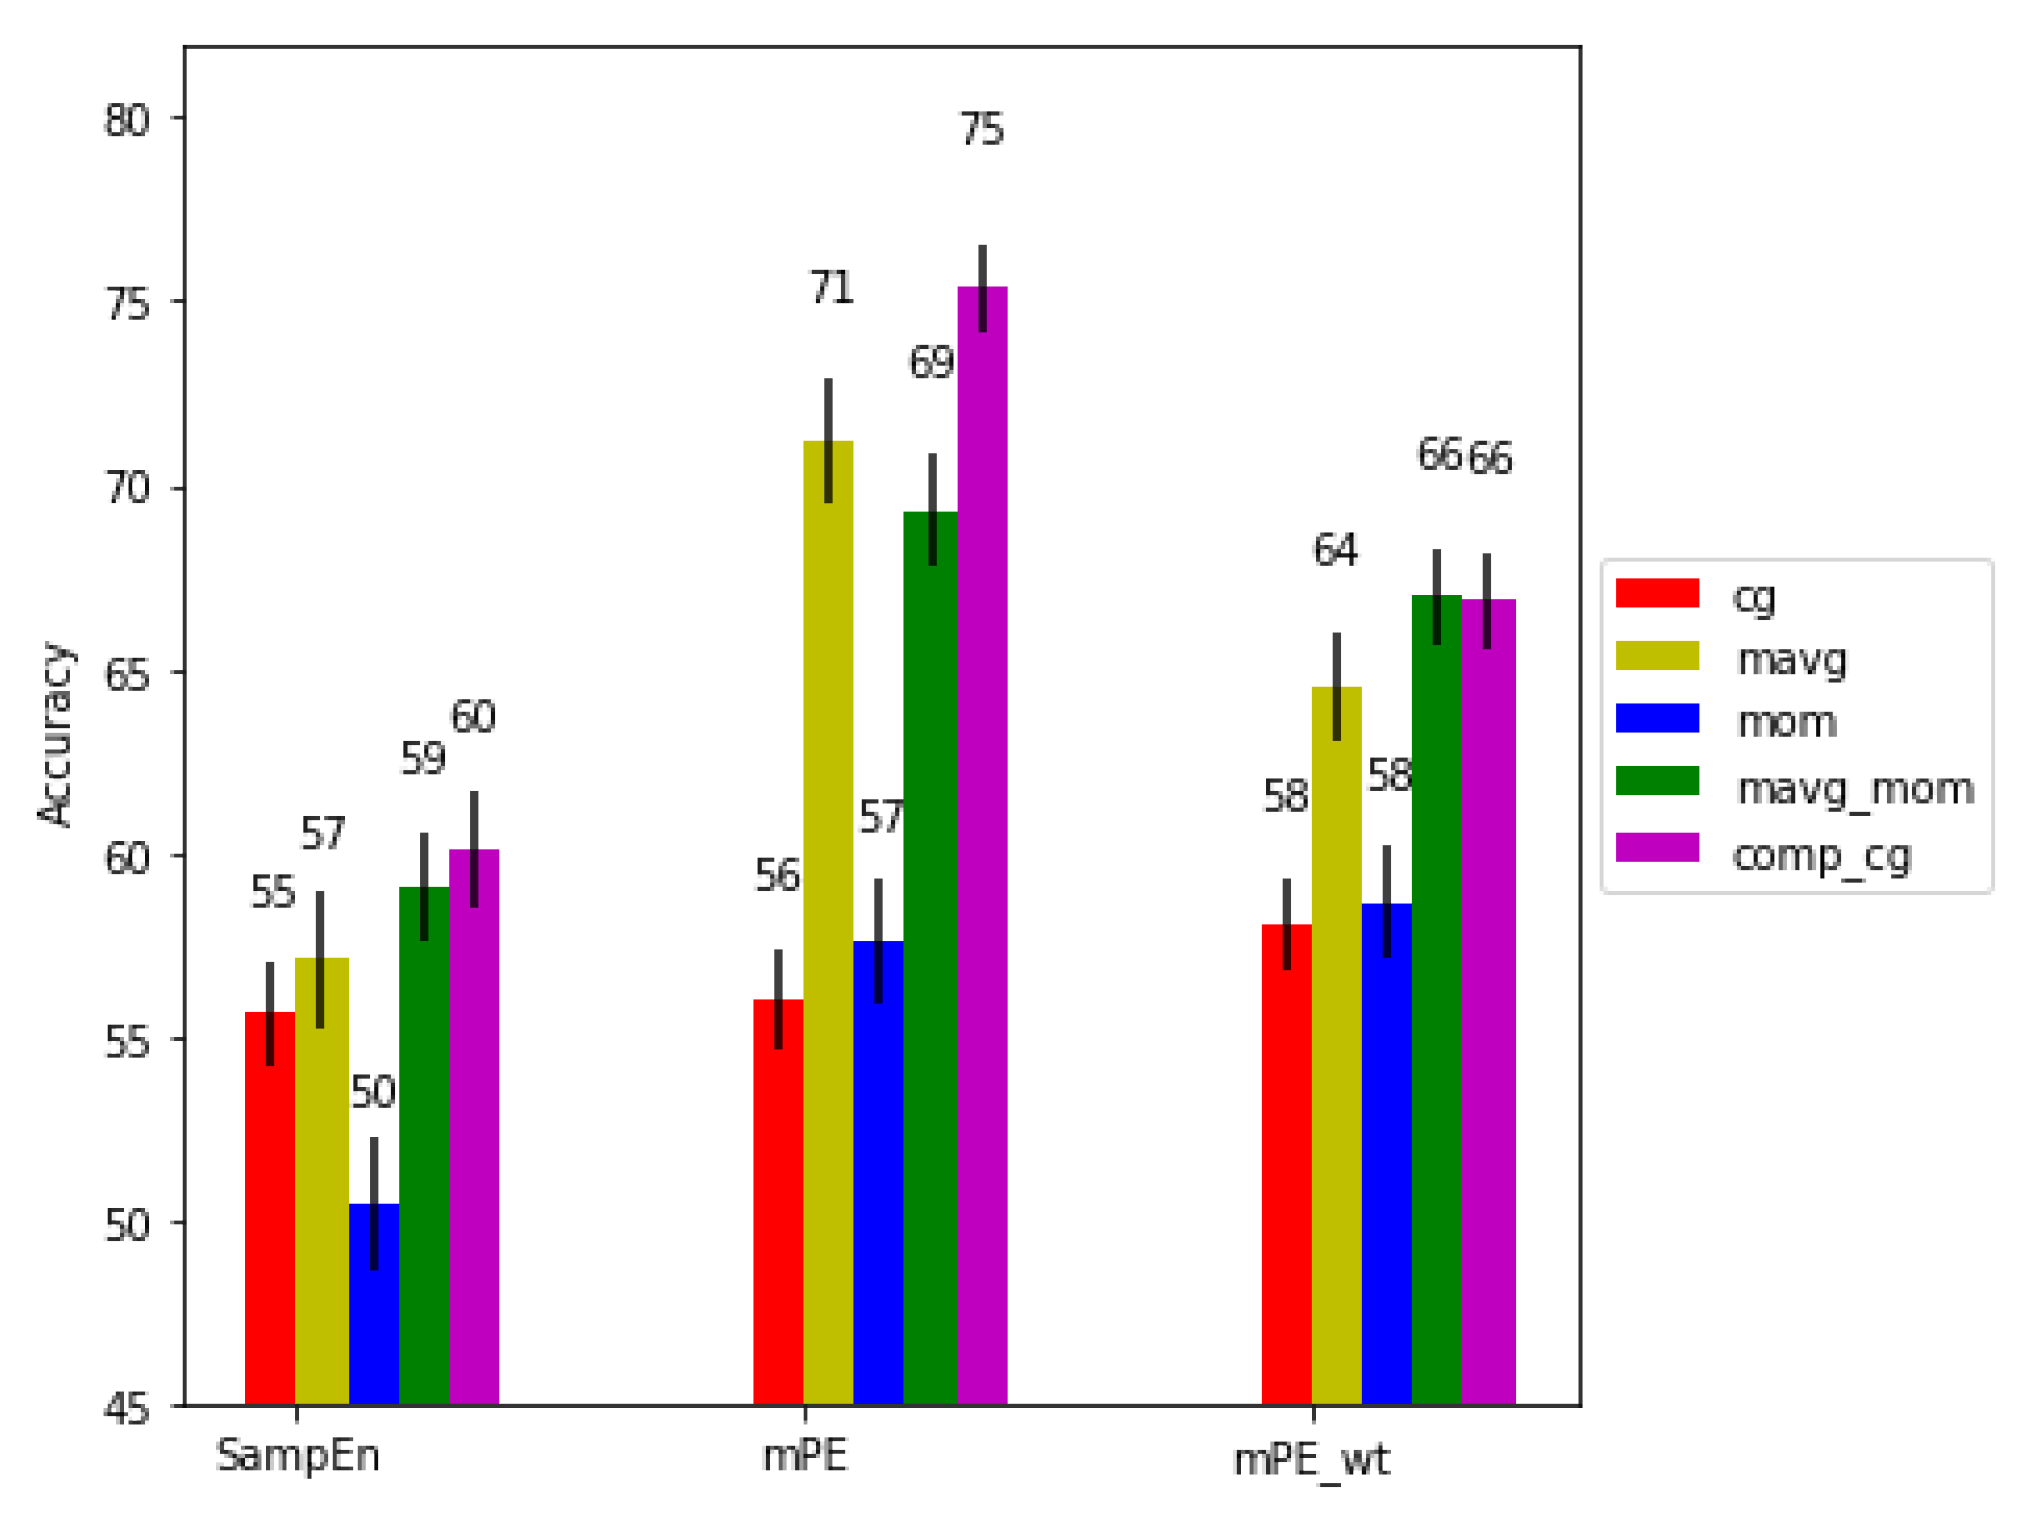
Figure 7 and
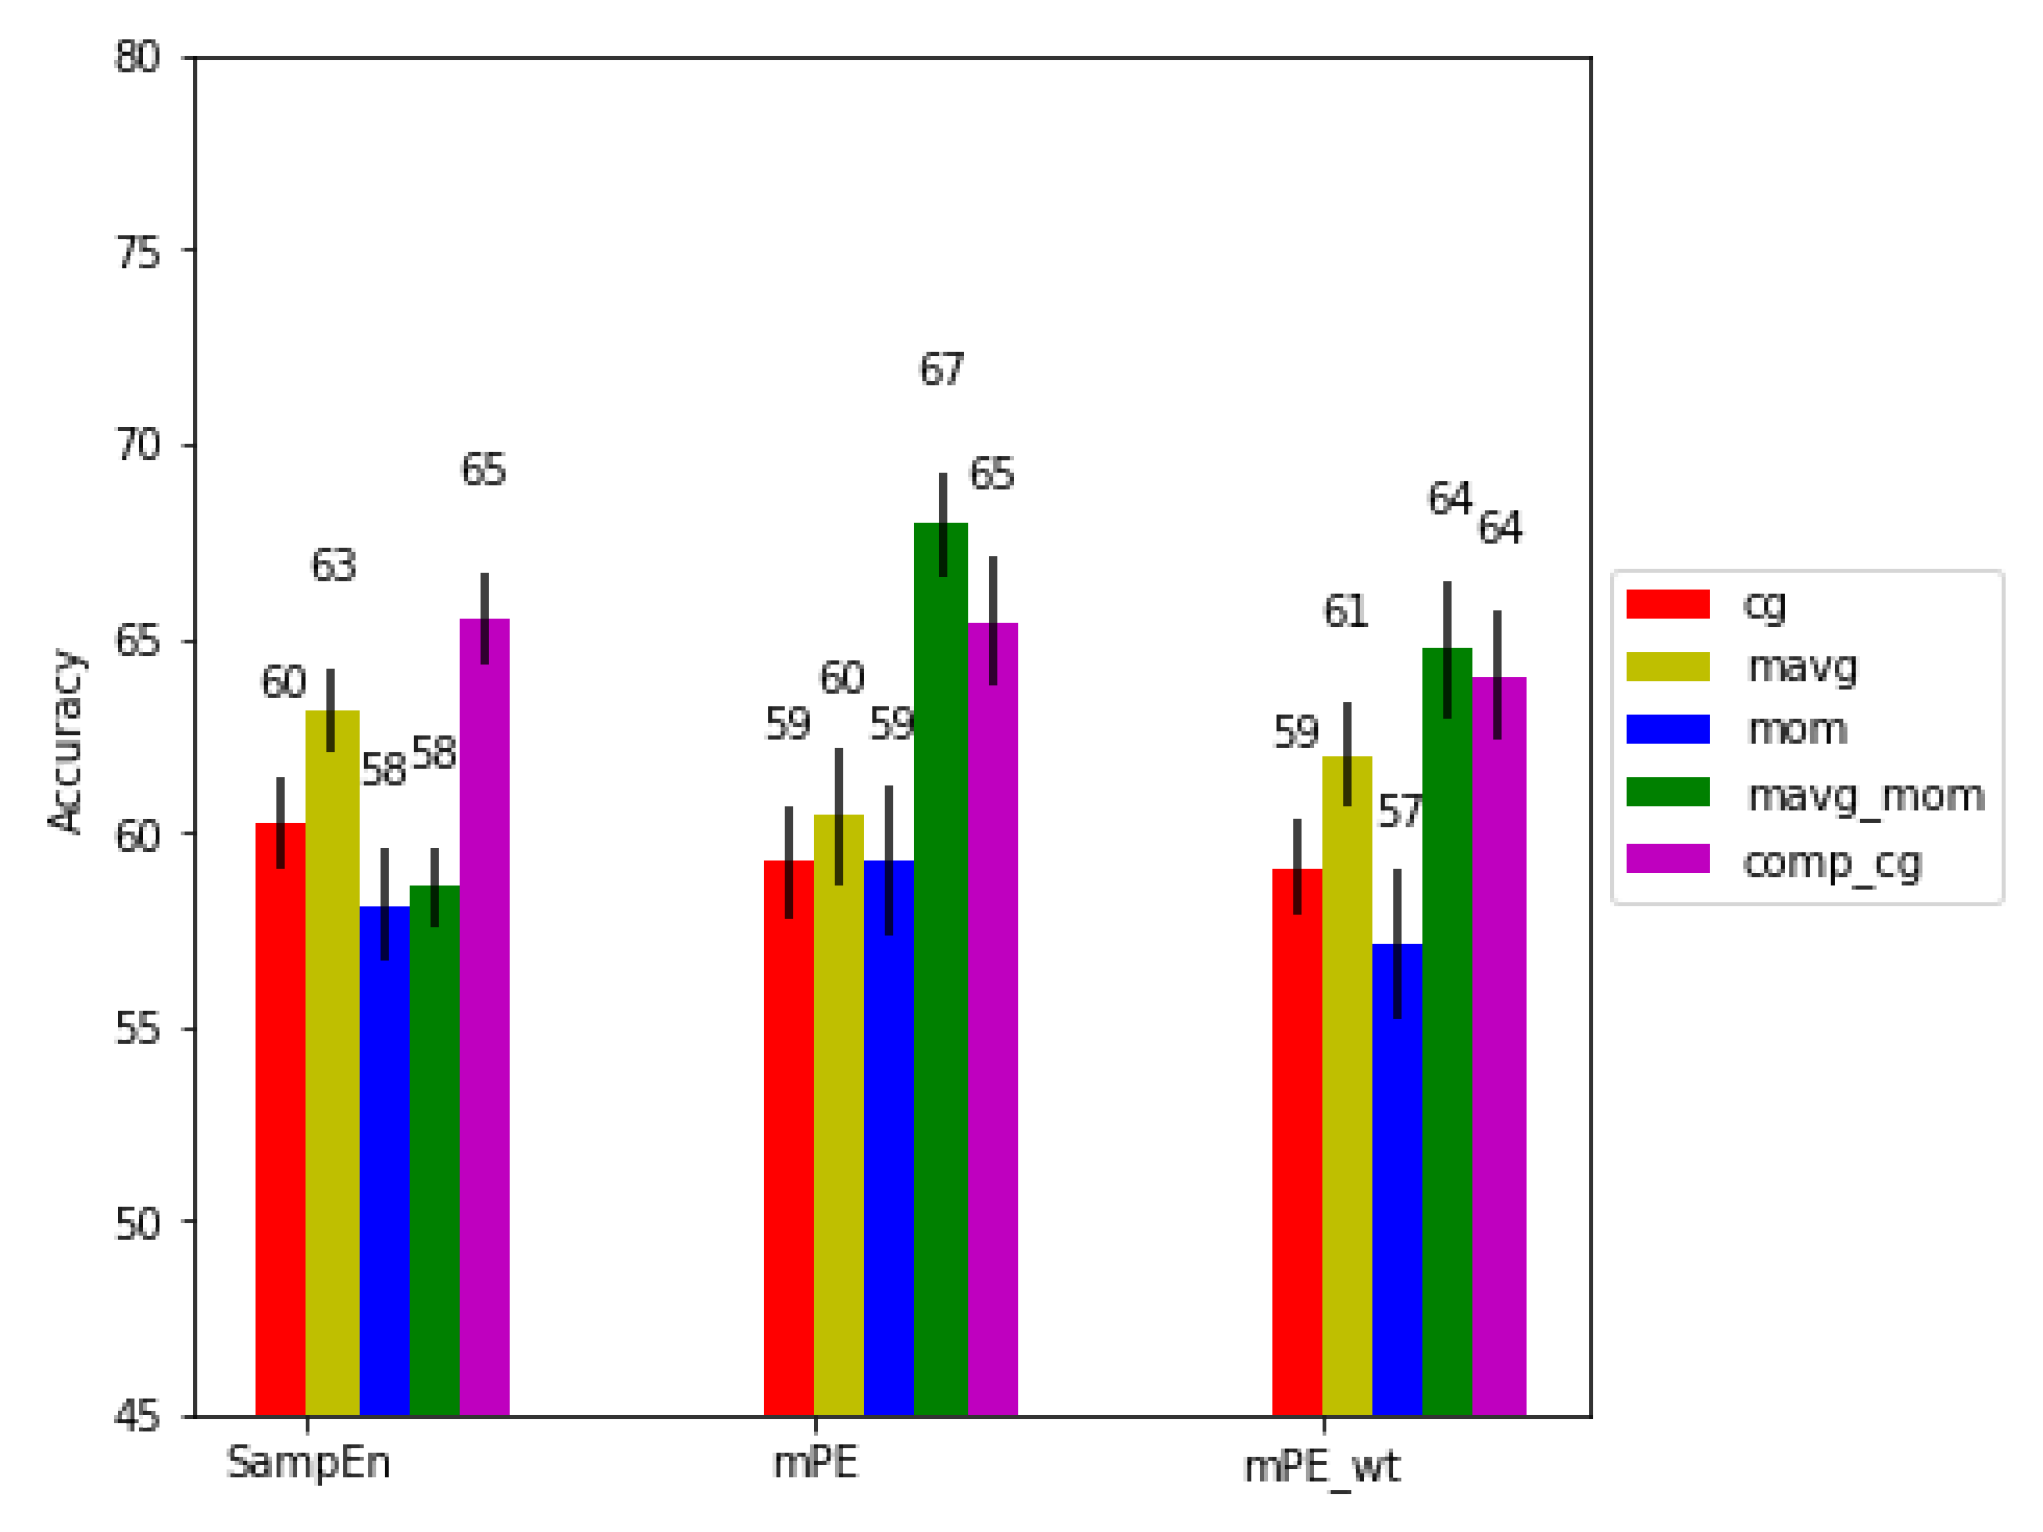
Figure 8 show the performance of the algorithms for no, medium and high physical activity levels, respectively. As can be seen, generally across all physical activity cases and for all entropy algorithms, the short time moving average based scaling (
and
) and composite based scaling (
) methods outperform coarse graining based approaches (
,
). It can also be seen that the modified permutation entropy based on second moment based scaling methods (
and
) (referred to as generalized permutation entropy in [
24]) typically achieve higher predictive power across all physical workload cases, hence indicating the importance of volatility series of the
series, as well as
series. Lastly, the modified permutation entropy based algorithms (
and
) performs better than sample entropy based methods.
Specifically, looking at the performance of the features across different physical activity level conditions, it can be seen for the no physical activity condition that with ( and ) achieved significantly higher performance than most of the other methods. Moreover, by including the amplitude information into the via the measure, a drop in performance is seen for the moving average scaled series, but the best performance for the volatility scaled series is achieved with our proposed moving average scaling of the second moment (). These results suggest that amplitude information of the volatility series is important for mental workload assessment.
For the medium physical activity level condition, we observe similar performance trends to the no physical activity condition with ( scaling) achieving significantly higher performance than the other methods. Interestingly, incorporating the amplitude information in this condition leads to a decrease in performance for both and . This could be due to the changing cardiac dynamics during physical activity.
Finally, for the high physical activity level condition, we see an overall drop in performance compared to the other two physical activity levels. We observe that the performance is comparable to and for certain scaling methods (, and ). We also see a drop in performance for when using compared to scaling, though this is not observed for and , both of which show improvement on using the scaling. Overall, we achieve the best performance using the modified permutation entropy for proposed short time second moment calculation and , using the , i.e., excluding the amplitude information. Higher performance without incorporating amplitude information (not using ) in both medium and high physical activity level conditions could be due to higher noise in the RR series arising from misdetections in the QRS complex caused by movement artifacts. As is sensitive to such artifacts, ignoring the amplitude information is better in such cases. Overall, with and achieved the best results, with based scaling giving significantly higher results than all the other methods tested ().
Moreover, as [
24] emphasizes the complementary nature of the volatility series, we further investigate the fusion of
and
base scaling methods using the
algorithm, as these resulted in consistently better performance across all three physical activity conditions.
Table 3 shows the results of fusion for the different physical activity levels. As can be seen, for the no and medium physical activity levels, fusion gave a significant
improvement of
in accuracy and
in f1-score and
accuracy and
f1-score, respectively, over the best performing
+
algorithm. However, no improvement was seen for high physical activity level. Such findings corroborate those of [
24].
3.2. Gauging Performance Against the Benchmark
Here, we compare the performance of the best performing algorithms from
Section 3.1 with the benchmark features. We further perform feature fusion of the two sets to further explore their complementary.
Table 4,
Table 5 and
Table 6 shows the benchmark, inter-scale ordinal distance, and best performing multi-scale entropy methods and their fusion for no, medium and high physical activity levels, respectively. In the tables, ‘nof’ indicates number of features used in each case.
As can be seen, for the no physical activity condition, both multi-scale entropy and the inter-scale ordinal distance features perform significantly better than the benchmark with improvements of in accuracy and in f1-score and in accuracy and in f1-score, respectively. Additionally, fusion provides significant () improvements of accuracy and f1-score over the multi-scale features alone.
Similarly for medium physical activity levels, both multi-scale entropy and the inter-scale ordinal distance features performed significantly better than the benchmark with improvements of
in accuracy and
in f1-score and
in accuracy and
in f1-score, respectively. In this case, the inter-scale ordinal distance features performed significantly better (
) than the multi-scale entropy features. Fusion also improved performance significantly (
) and results in gains of
accuracy and
f1-score over the inter-scale ordinal distance features. Lastly, for the high physical activity level condition, both multi-scale entropy and the inter-scale ordinal distance features performed significantly better than the benchmark with improvements of
in accuracy and
in f1-score and
in accuracy and
in f1-score, respectively. Again, the inter-scale ordinal distance features performed significantly better (
) than the multi-scale entropy features. Additionally, fusion gave a significant (
) improvement of
accuracy and
f1-score over the inter-scale ordinal distance features. The improvement in performance achieved with fusion for all three activity levels further corroborates the results of [
24].
3.3. Feature Ranking
Feature importance was computed based on the outcomes of feature selection across the five cross validation steps, repeated 50 times. The top 20 features were selected for every fold. As such, the frequency of occurrence of a given feature in the top feature set was calculated over the 250 iterations. Features appearing more than
were further ranked according to their frequency of occurrence (
) for no, medium and high physical activity levels. These values are reported in
Table 7,
Table 8 and
Table 9, respectively, along with the feature names.
As can be seen, for the no physical activity condition, we observe that three of the eight top-ranked features are from the inter-scale ordinal distance feature set with interaction of different scales with
being the case for two of the three
features. Additionally, one multi-scale
features show up in the most frequent set with composite scaling based entropy of
, Additionally, we see four benchmark features in the top feature set, with three statistical features as well as the ratio of low to high frequency (lf/hf). A consistent decrease in the mean of RR has been reported in the literature with increased mental stress, a similar trend in the standard deviation of RR intervals could explain the overall importance of the coefficient of variation which is a ratio of the two [
41]. Similarly, an increase in the
ratio was reported for increased mental workload across various studies [
41]. We also observed that one of the proposed feature was calculated over the
series (
feature), reflecting the presence of long-term correlations and complexity in the magnitude difference of RR series as noted in [
29]. The presence of the different feature sets along with the benchmark features further corroborates the complementary nature of the features.
Similarly, looking at medium physical activity level conditions, we observe that of the 12 most frequent features, five were from inter-scale ordinal distance features with interactions between and with other scales. Further, additionally six multi-scale features showed up in the most frequent set with composite scaling based entropy of the original time series () (same as for with as well), along with and as well as of second moment from and . Additionally, scales for the of second moment also shows up in the top features for both the RR and dRR series. We only have one benchmark feature (mean RR) in this case among the top features, thus suggesting their sensitivity to movement artifacts. One of features were calculated on the series.
Lastly, for the high physical activity level conditions, of the top 10 most occurring features, we observed that two features are from the inter-scale ordinal distance features, five features are from the multi-scale entropy with composite scaling based entropy of the scales , , and as well as of second moment from . Interestingly, no entropy feature from the original time series () was seen in the top features. We also observed three benchmark features in the top set, with both normalized low and high frequency along with mean of absolute first difference.
Mental workload has reported a drop in HRV features [
45,
46] attributed to sympathetic activation and/or para-sympathetic withdrawal [
45,
46,
47,
48]. Time and frequency domain HRV features were focused on characterizing the balance between these two systems. However, a lack of clear unbalance of the ANS due to mental workload has been reported in the literature [
49]. This has shifted focus on the use of non-linear descriptors based on complex systems approach to better characterize the fractal RR time series [
15]. These methods often characterize the complexity of the RR time series [
50]. Recent studies indicate that this complexity is a result of both sympathetic and parasympathetic components of the ANS [
51]. A recent study [
49] has shown correlation dimension, which measures the fractal self-similarity of signal, decrease to comparable pathological values during mental workload inducing tasks, which indicates an suppression of the parasympathetic activity in the heart [
52] and breakdown of long term correlations in the RR series [
14] which can be quantified by complexity at higher scales [
26].
A few studies have looked at the effects of exercise on HRV features. [
53] reported an increase in overall complexity due to walking (4 km/hr) along with a significant increase in normalized low frequency power and a decrease in normalized high frequency power. A similar trend for low intensity exercise was reported in [
54] with a contradictory increase in the high frequency component with increased exercise intensity on a bicycle. This increase has further been explained by the influence of breathing on heart rate (respiratory sinus arrhythmia (RSA)) which has a strong high frequency component during high intensity exercise [
55]. Interestingly, when looking at the non-linear properties of the heart rate for high intensity exercise, entropy (
) decreases while complexity is still retained at different scales [
56], something that can be exploited by multi-scale entropy measure.
The scaling process for the multi-scale entropy algorithm is equivalent to low pass filtered frequency bands with decreasing bandwidth with increasing scales [
57]. This scaling can be achieved by different types of scaling operations. For our study we have focused on two methods, namely composite coarse graining and moving average scaling methods. Given the presence of two distinct frequency regions in the heart rate due to parasympathetic activity (corresponding to high frequency fluctuations in the RR series) and sympathetic activity (corresponding to lower frequency fluctuations) [
13], the multiscale entropy algorithm represents the complexity of the overall series due to interaction of both sympathetic and parasympathetic systems at lower scales, while representing the complexity of lower frequency component (mostly due to sympathetic activity) at higher scales. Furthermore, the inter-scale ordinal distance feature tries to quantify the complex interaction between the different frequency regions.
In keeping with the above variations in ANS balance with mental workload and exercise we observe a scale
show importance for no physical workload case which captures more lower frequency information compared to original scale. With medium physical activity further contributing to the increase lower frequency components in mental workload we observe entropy of higher scale of
to
(capturing low frequency information) show up in the top feature sets. Finally for high physical activity where high frequency components show important contribution due to the influence of RSA to the heart rate we see both low (
and
) and high (
,
and
) scales for entropy show significance in the top feature set. Additionally we see the normalized high and low frequency components among the top features which show significance during exercise [
53]. We hypothesize that the RSA component which usually causes cardio-respiratory coherence is disrupted due to added mental workload [
58] making these features important for distinguishing between the two states. The inter-scale ordinal distance feature also shows significance for all three physical activity levels hinting at non-linear interaction between the different frequency regions. The presence of features from the
series show the importance of complementary non-linear information present in the series which should be further investigated. Finally, the importance of generalized entropy features calculated on the volatility series hints at the multifractal characteristics holding vital information regarding mental workload. The link between generalized entropy and multifractal heart rate characteristics has been hypothesized in [
24].

 ,
, 


