Abstract
Owing to the complexity of the ocean background noise, underwater acoustic signal denoising is one of the hotspot problems in the field of underwater acoustic signal processing. In this paper, we propose a new technique for underwater acoustic signal denoising based on complete ensemble empirical mode decomposition with adaptive noise (CEEMDAN), mutual information (MI), permutation entropy (PE), and wavelet threshold denoising. CEEMDAN is an improved algorithm of empirical mode decomposition (EMD) and ensemble EMD (EEMD). First, CEEMDAN is employed to decompose noisy signals into many intrinsic mode functions (IMFs). IMFs can be divided into three parts: noise IMFs, noise-dominant IMFs, and real IMFs. Then, the noise IMFs can be identified on the basis of MIs of adjacent IMFs; the other two parts of IMFs can be distinguished based on the values of PE. Finally, noise IMFs were removed, and wavelet threshold denoising is applied to noise-dominant IMFs; we can obtain the final denoised signal by combining real IMFs and denoised noise-dominant IMFs. Simulation experiments were conducted by using simulated data, chaotic signals, and real underwater acoustic signals; the proposed denoising technique performs better than other existing denoising techniques, which is beneficial to the feature extraction of underwater acoustic signal.
1. Introduction
With the development of ocean scientific technology, the use and protection of the oceans have attracted more extensive attention. Because of the complexity of the marine environment and the time-varying nature of the underwater acoustic channel, it is more difficult to detect and reduce the noise of underwater acoustic signals [1,2]. Therefore, the research on underwater acoustic signal processing method and its application are very essential and important in the field of underwater acoustic. Underwater acoustic signals not only are nonlinear, non-stationary, and non-Gaussian, but also chaos and fractal, traditional signal processing methods based on the classic Fourier analysis are not suitable for underwater acoustic signals such as short-time Fourier transform, Fourier transform, Wigner–Ville, and wavelet transform [3,4]. Therefore, finding a suitable method is the key to analysis underwater acoustic signal.
EMD and its improved algorithms are suitable for analyzing nonlinear, non-stationary, and non-Gaussian signals. Furthermore, EMD and its improved algorithms are self-adaptive and based on characteristic time scale of the data itself. However, EMD has the phenomena of mode mixing due to intermittency, which hinders the development and application of EMD [5]. In order to reduce its influence, many improved algorithms are presented such as EEMD, complementary EEMD (CEEMD), and complete EEMD with adaptive noise (CEEMDAN) [6,7,8]. The proposed method follows a study of the statistical characteristics of white noise, involves a noise-assisted analysis, and adds white noise of a uniform frequency distribution into EMD to avoid mode mixing. EEMD is a noise-assisted analysis algorithm to avoid mode mixing by adding white noise. However, this improved algorithm raises two new problems, one is the difference in IMF numbers and the other is the introduction of extra noise. CEEMD can avoid adding extra noise using positive and negative white noises, however, it still cannot make the number of IMF consistent by each decomposition. CEEMDAN can solve this problem because it only decomposes the first IMF for each decomposition; it has better decomposition effect and lower computational cost than EEMD and CEEMD.
EMD and its improved algorithms are widely used in different fields [9,10,11]. In the field of fault diagnosis, a fault detection and diagnosis algorithm is proposed based on EEMD and the particle swarm optimization algorithm previous reported [12]. In a previous paper [13], a new health degradation monitoring and early fault diagnosis for rolling bearing signal is proposed using CEEMDAN and improved multi-scale entropy. In another past paper [14], a fault diagnosis algorithm for planetary gear is put forward based on CEEMDAN, PE, and an adaptive neuro-fuzzy inference system. In the field of medicine, CEEMDAN is carried out toanalyze heart rate variability in electrocardiogram (ECG) signals [15]. In addition, the EMD algorithm was used for analyzing focal electroencephalogram (EEG) signals and 3D EEG signals [16,17]. In the underwater acoustic area, EMD and EEMD algorithms are carried out for extracting the characteristics of underwater acoustic signals [1,18]. In conclusion, a large number of studies have proved the effectiveness and feasibility of the EMD and its improved algorithms.
In recent years, many denoising methods based on EMD and its improved algorithms have been proposed [19,20]. In a previous paper [21], a denoising algorithm for gear signals is proposed based on CEEMDAN, PE and peak filtering, the IMF spectra are obtained by CEEMDAN, and the PEs of IMFs are calculated to identify whether the IMFs require denoising by peak filtering, the filtered and the others IMFs are reconstructed finally. In a previous paper [22], a ECG signal denoising algorithm is put forward using CEEMDAN and wavelet threshold denoising. In addition, denoising algorithms for the impact signal and friction signal are proposed using CEEMDAN combined with fuzzy entropy and MI in past papers [23,24]. However, there has been no previous studies on underwater acoustic signal denoising based on CEEMDAN as far as we know [25,26]. Moreover, among the existing denoising algorithms, IMFs are usually divided into two parts: noise IMFs and real IMFs, and there are some limitations in this division.
In this paper, a hybrid denoising algorithm for underwater acoustic signals is presented by taking advantage of CEEMDAN, MI, PE, and wavelet threshold denoising. Compared with the existing denoising algorithms, the proposed algorithm divides IMFs into three parts, which is beneficial to signal denoising. This paper is organized as follows: Section 2 is the basic methods of CEEMDAN, MI, PE, and wavelet threshold denoising; in Section 3, the underwater acoustic signal denoising technique is presented; in Section 4, Section 5 and Section 6, the proposed denoising algorithm is applied to simulated data, chaotic signals, and real underwater acoustic signals respectively; finally, Section 7 is the conclusion.
2. Methods
2.1. CEEMDAN
CEEMDAN, as an improved algorithm of EMD and EEMD, can adaptively decompose complex signal into IMFs in order. The specific steps of CEEMDAN are summarized as follows [8]:
- (1)
- Add white noise to the target signal :
- (2)
- Decompose by EMD to obtain the first IMF and residual mode :
- (3)
- Obtain the first IMF of CEEMDAN by calculating the mean of :
- (4)
- Obtain the residual mode of :
- (5)
- Decompose white noise by EMD:where represents the -th IMF of the -th white noise, represents the residual mode of the -th white noise. is defined as a set which includes the -th IMF of , is expressed as:
- (6)
- Construct signal and decompose it by EMD (only decompose the first IMF):
- (7)
- Obtain the second IMF and residual mode of CEEMDAN:
- (8)
- Obtain and repeat step (6) and (7), and are expressed as:
- (9)
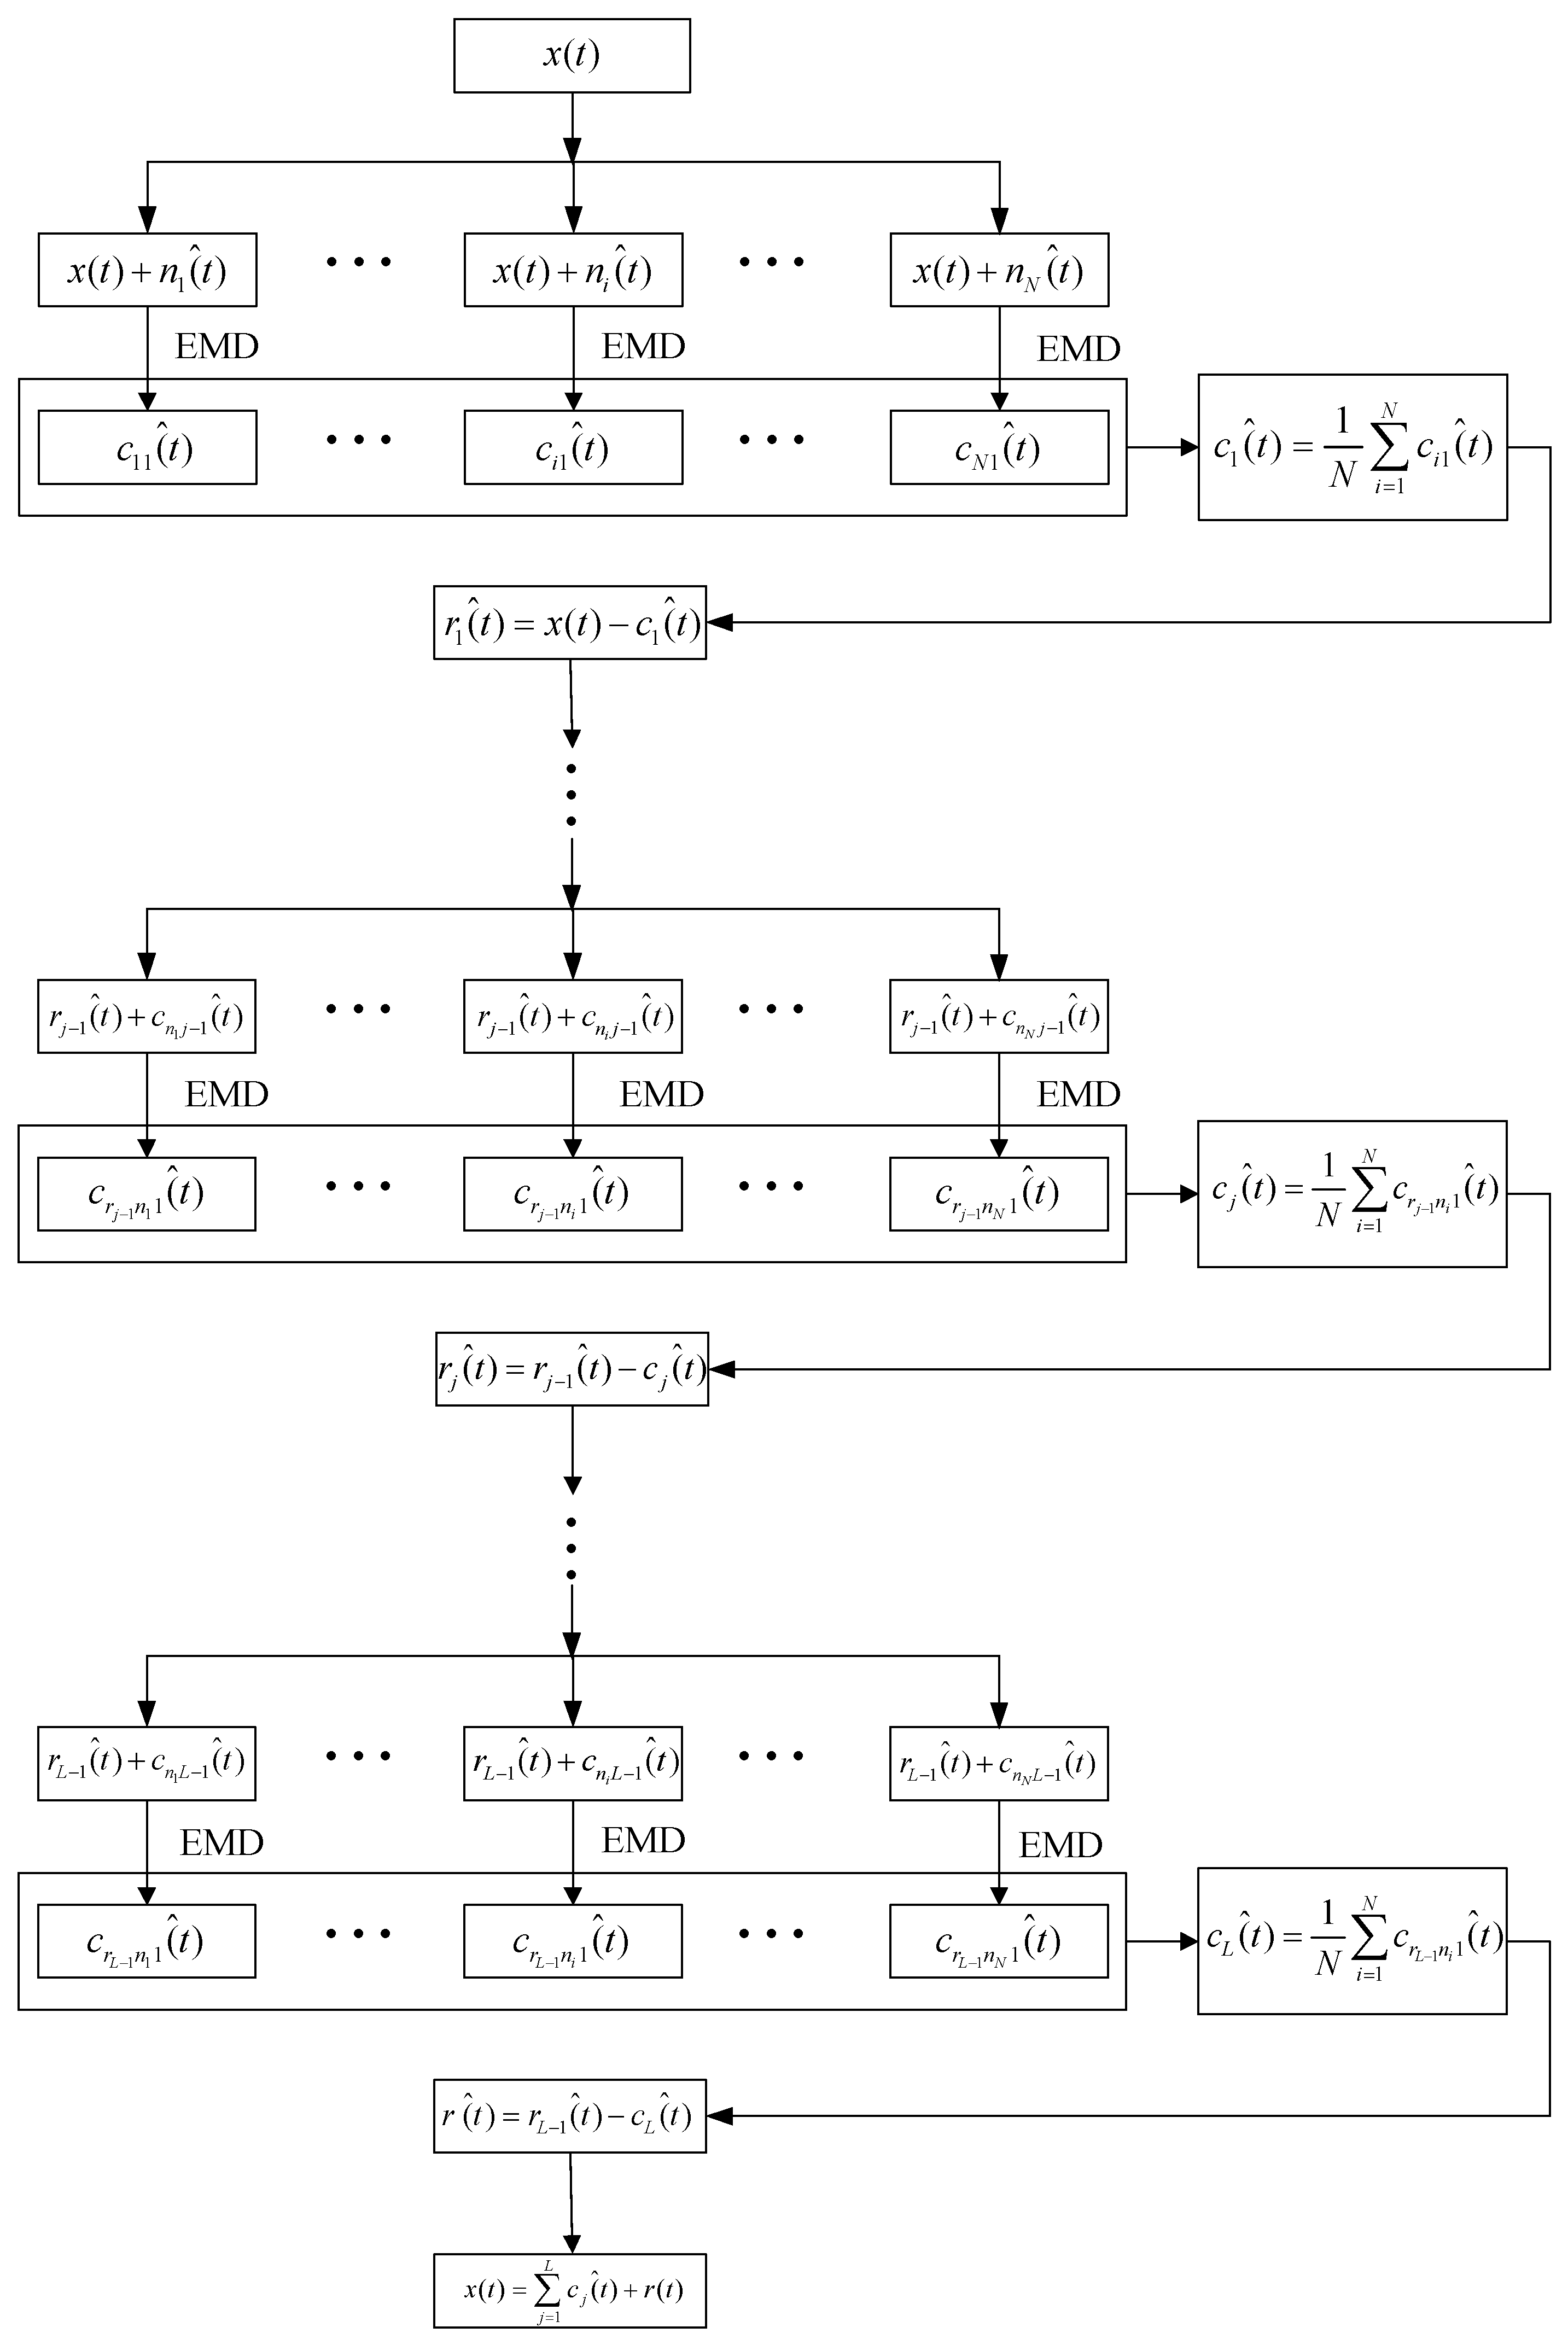
- is expressed as:where represents the number of IMF by CEEMDAN, represents the residual mode. The flow chart of CEEMDAN is designed in Figure 1.
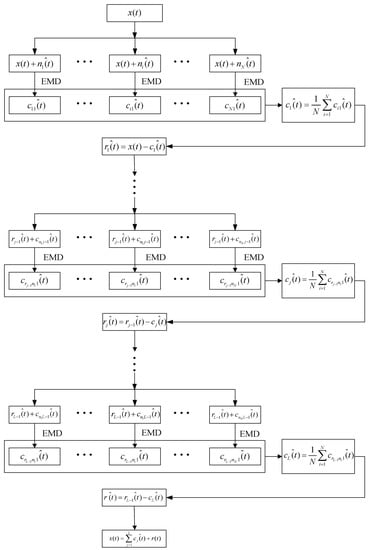 Figure 1. The flow chart of complete ensemble empirical mode decomposition with adaptive noise (CEEMDAN).
In this paper, we chose the CEEMDAN algorithm for the following reasons:
- (1)
- CEEMDAN has better decomposition effect and lower computational cost than EEMD and CEEMD.
- (2)
- CEEMDAN is suitable for analyzing non-linear, non-stationary and non-Gaussian signals, in theory, it can decompose all signals.
- (3)
- CEEMDAN is self-adaptive and based on characteristic time scale of the data itself without basis function.
2.2. MI
For two discrete random variables and , the MI can be defined as [27]:
where is the joint probability distribution function of and , and are the marginal probability distribution functions of and , respectively.
The MI of continuous random variables can be expressed as a double integral:
In probability theory and information theory, the mutual information of two random variables represents a measure of the interdependence of variables. If and are independent, . In addition, the symmetry of MI can be expressed as:
Furthermore, the MI can also be expressed as:
where and are informationentropy, and are conditional entropy, is joint entropy of and .
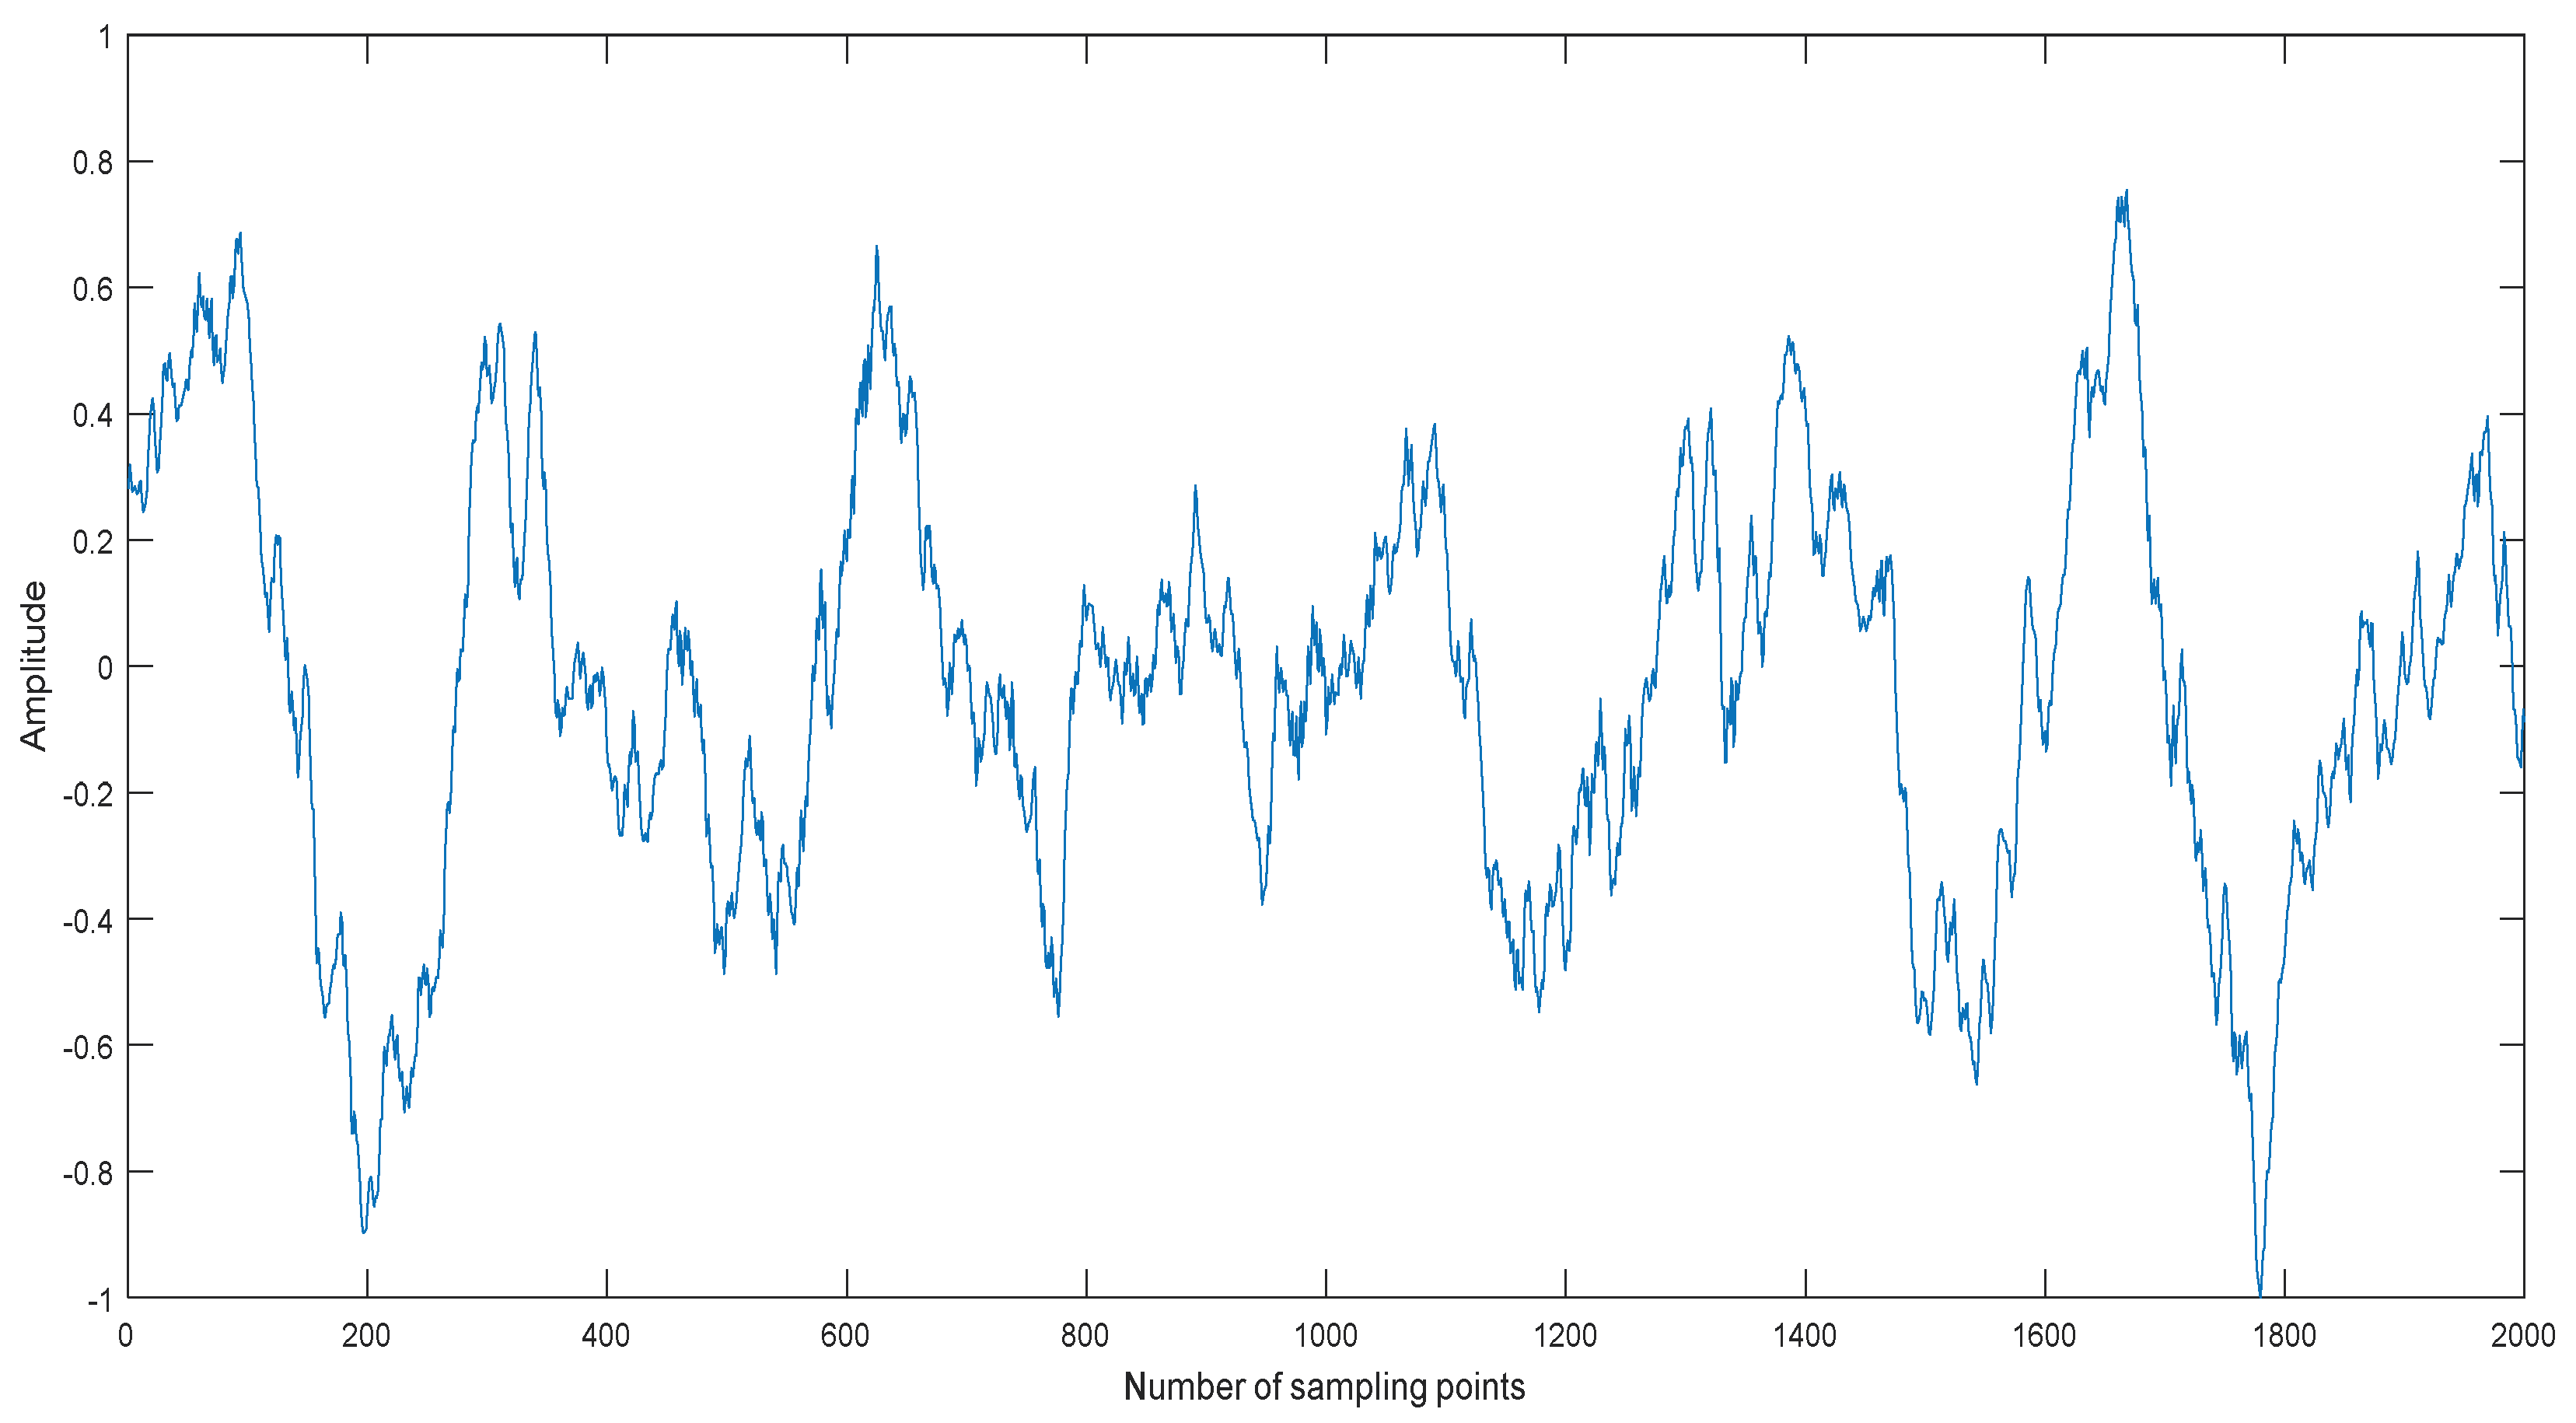
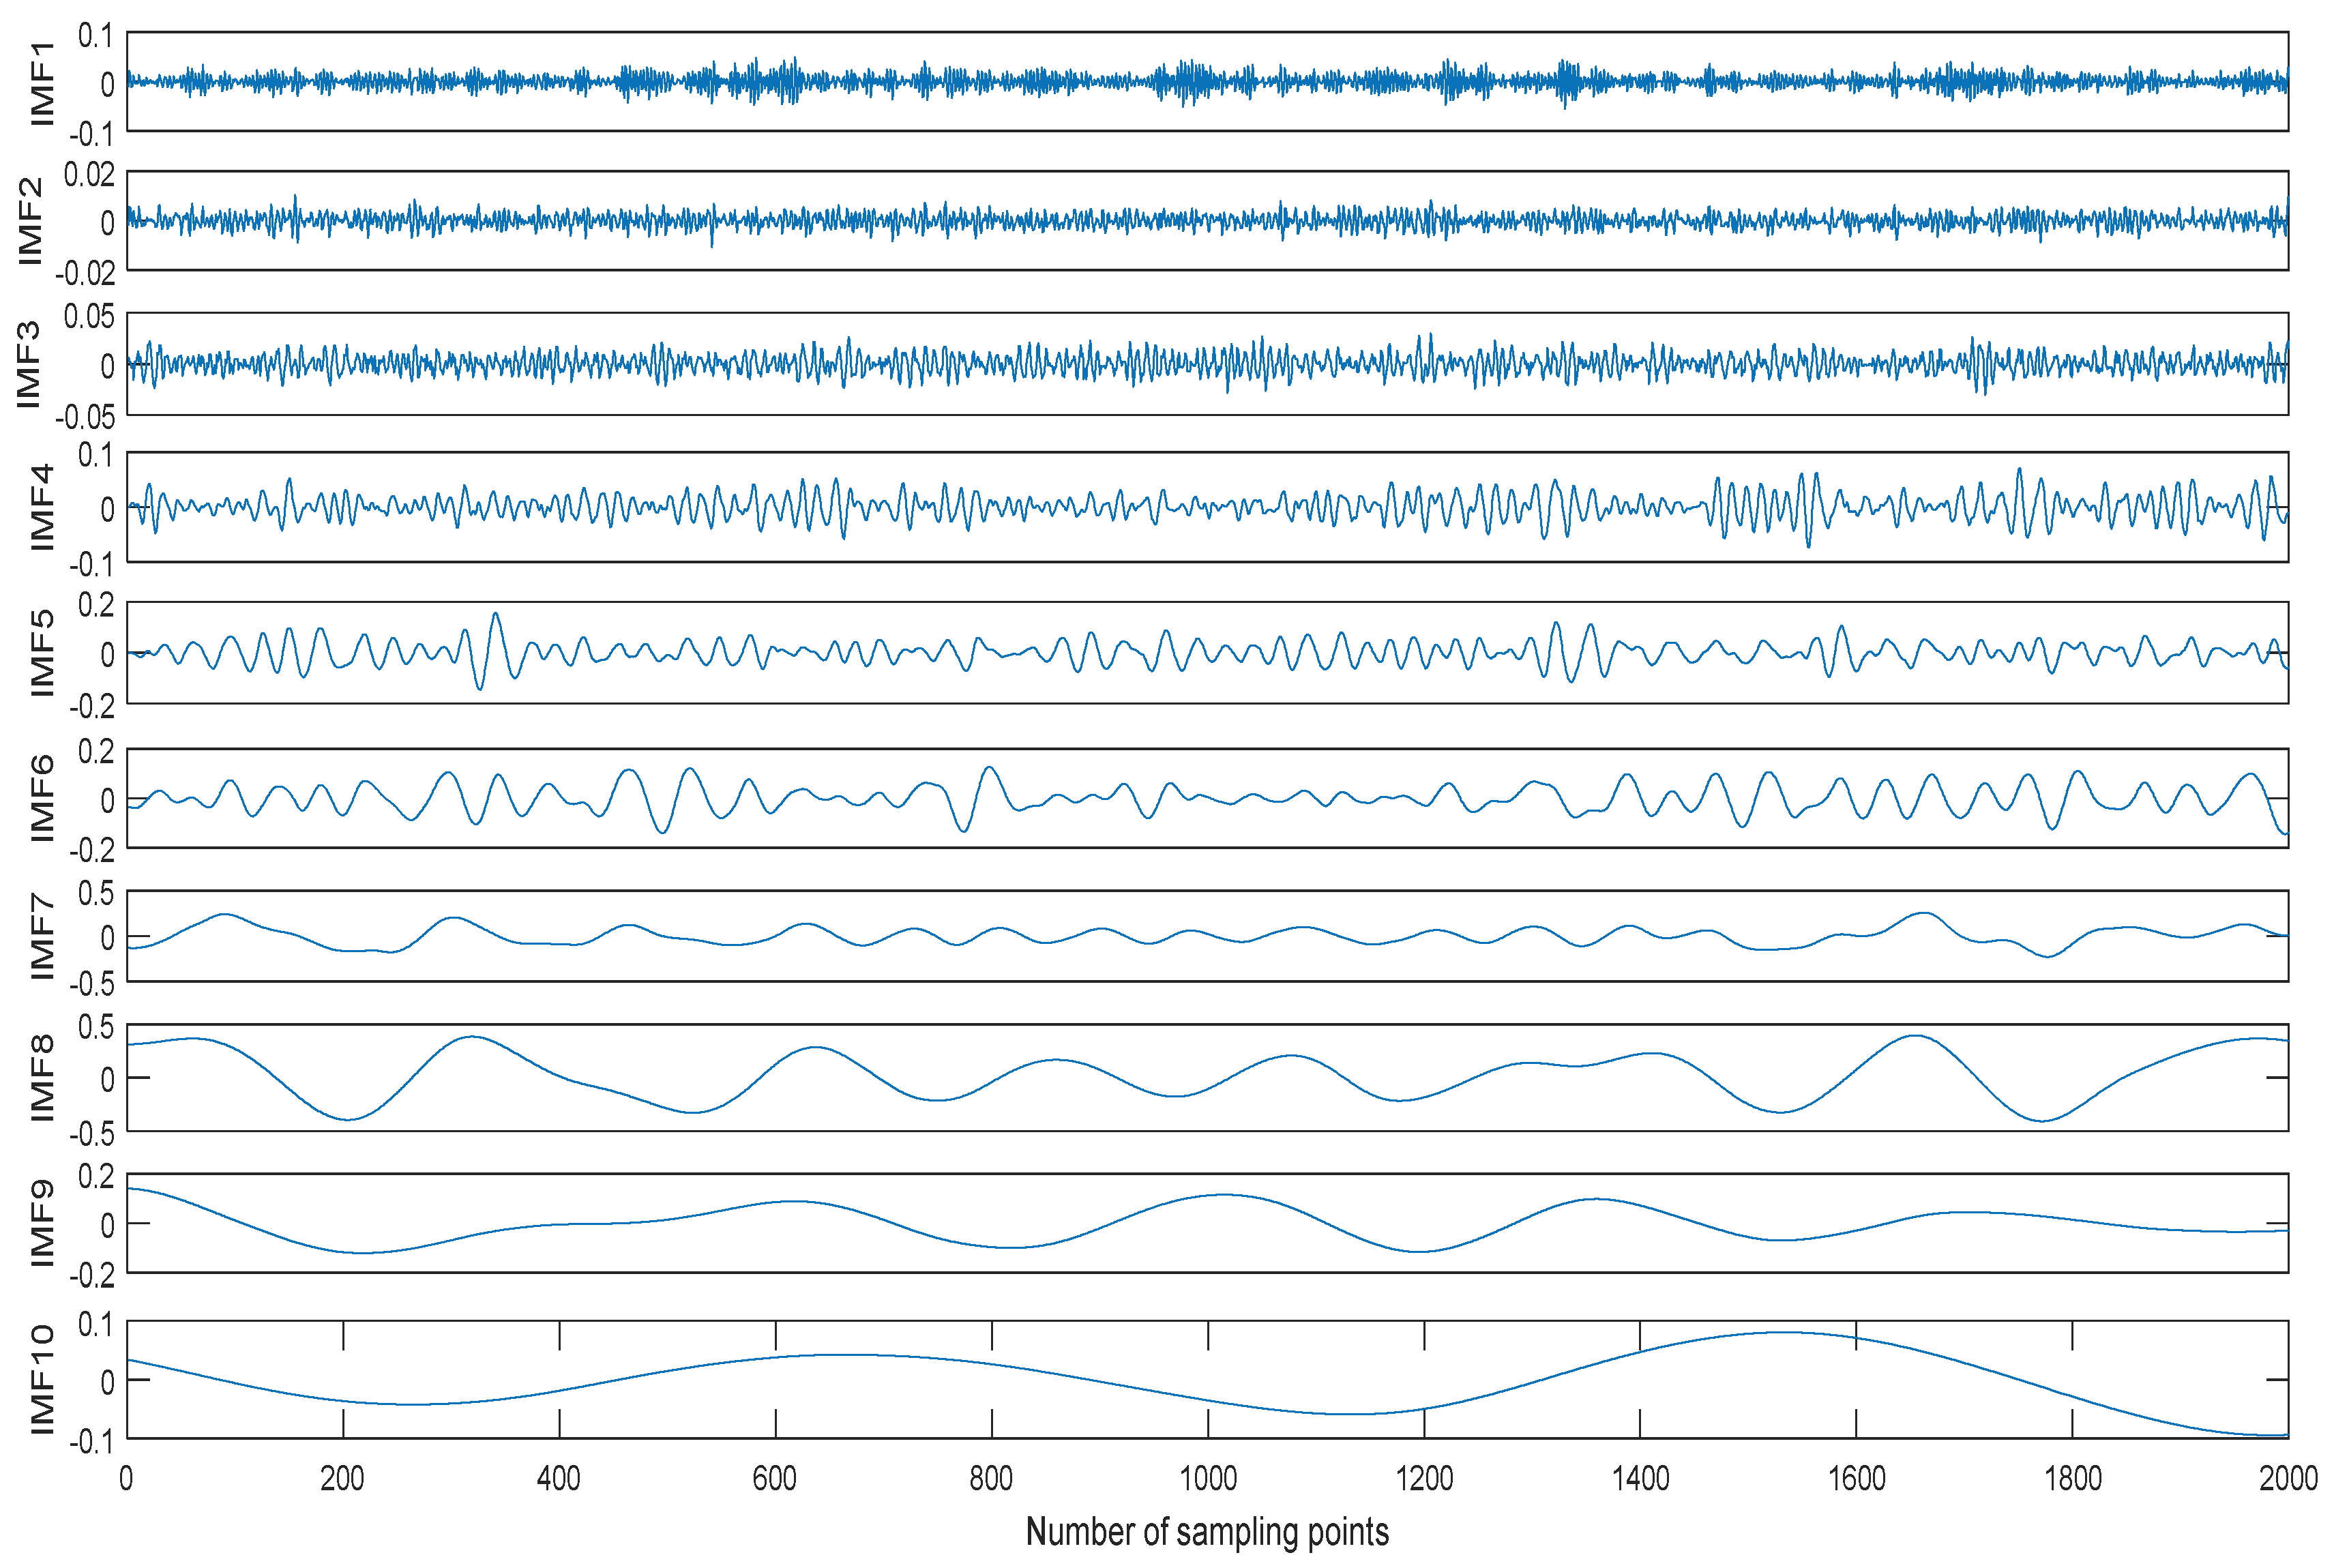
Usually the MIs between noise IMFs are different from ones between non-noise IMFs. We take a ship signal as an example. The normalized ship signal is shown as shown in Figure 2, the sampling frequency and the number of sampling points are 44.1 kHz and 2000, respectively. The decomposition result of the ship signal by CEEMDAN is shown in Figure 3. The center frequency distribution of IMFs and the MIs of two neighboring IMFs are shown in Table 1 and Table 2, where MIi represents the MI of IMFi and IMFi+1. As shown in Table 1 and Table 2, the center frequency decreases with the increase of IMF, the first three MI of IMFs are obviously less than the other ones of IMFs. According to the prior information of ship signal, its main frequency range is less than 5000Hz, the first three IMFs are noise IMFs, which is consistent with the judgment of MI. Therefore, we can use MI to identify noise IMFs in this paper, when the MI of IMFi and IMFi+1 increases, obviously more than the former MIs, the former i − 1 IMFs are considered as noise IMFs.
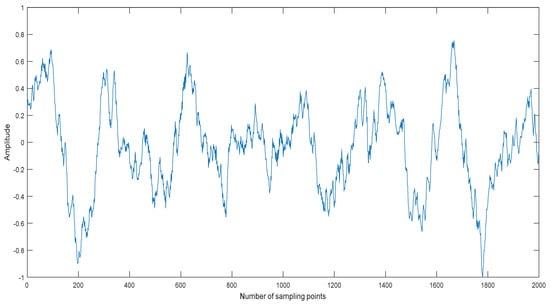
Figure 2.
The normalized ship signal.
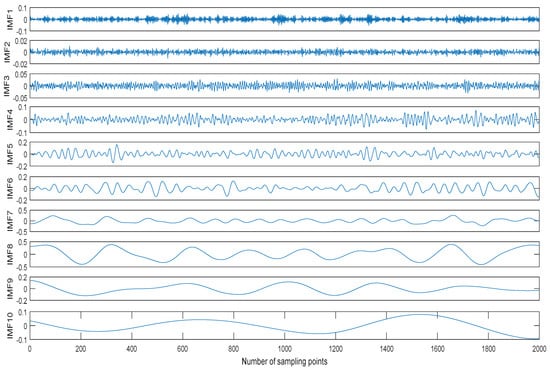
Figure 3.
The decomposition result of the ship signal by CEEMDAN.

Table 1.
The center frequency distribution of intrinsic mode functions (IMFs).
Table 2.
The mutual informations (MIs) of two neighboring IMFs.
2.3. PE
PE is proposed by Bandt in [24]. The brief process of PE is as follows [28]:
- (1)
- Reconstruct time series :where and are the time lag and embedding dimension.
- (2)
- Rearrange each row vectorin ascending order:
- (3)
- Obtain a symbol-sequence for each row vector as:
- (4)
- Define PE as:where is the probability of one symbol-sequence.
- (5)
- Define normalized PE as:
More detail about PE was described previously [29]. In this study, we set and according to the suggestiondescribed previously [30]. In a previous paper [21], PE is used to identify noisy IMF. Therefore, in this paper, we choose PE to identifynoise-dominant IMF.
2.4. Wavelet Threshold Denoising
Signal denoising is an important research direction of signal processing. The wavelet transform has multi-resolution characteristics. One-dimensional noisy time series can be expressed as follows [31]:
where is original signal, isnoise signal, is noisy signal.
Assuming that is Gaussian white noise, is usually represented as a low-frequency signal in practical engineering applications. Therefore, we can use the following methods to reduce noise. The specific steps are as follows:
- (1)
- A proper wavelet basis function and decomposition level are selected to perform wavelet decomposition on the noisy signal.
- (2)
- Threshold is performed by selecting an appropriate threshold method for high frequency coefficients at different decomposition scales.
- (3)
- The low frequency coefficient of wavelet decomposition and the thresholdhigh frequency coefficient of different scales are used to reconstruct.
Wavelet thresholding with different thresholds usually has three methods: denoising by default threshold, denoising with specified threshold, and forcing threshold. Among them, denoising with a specified threshold is divided into soft threshold and hard threshold. In this paper, a soft threshold method is selected to estimate threshold.
3. Denoising Algorithm for Underwater Acoustic Signal
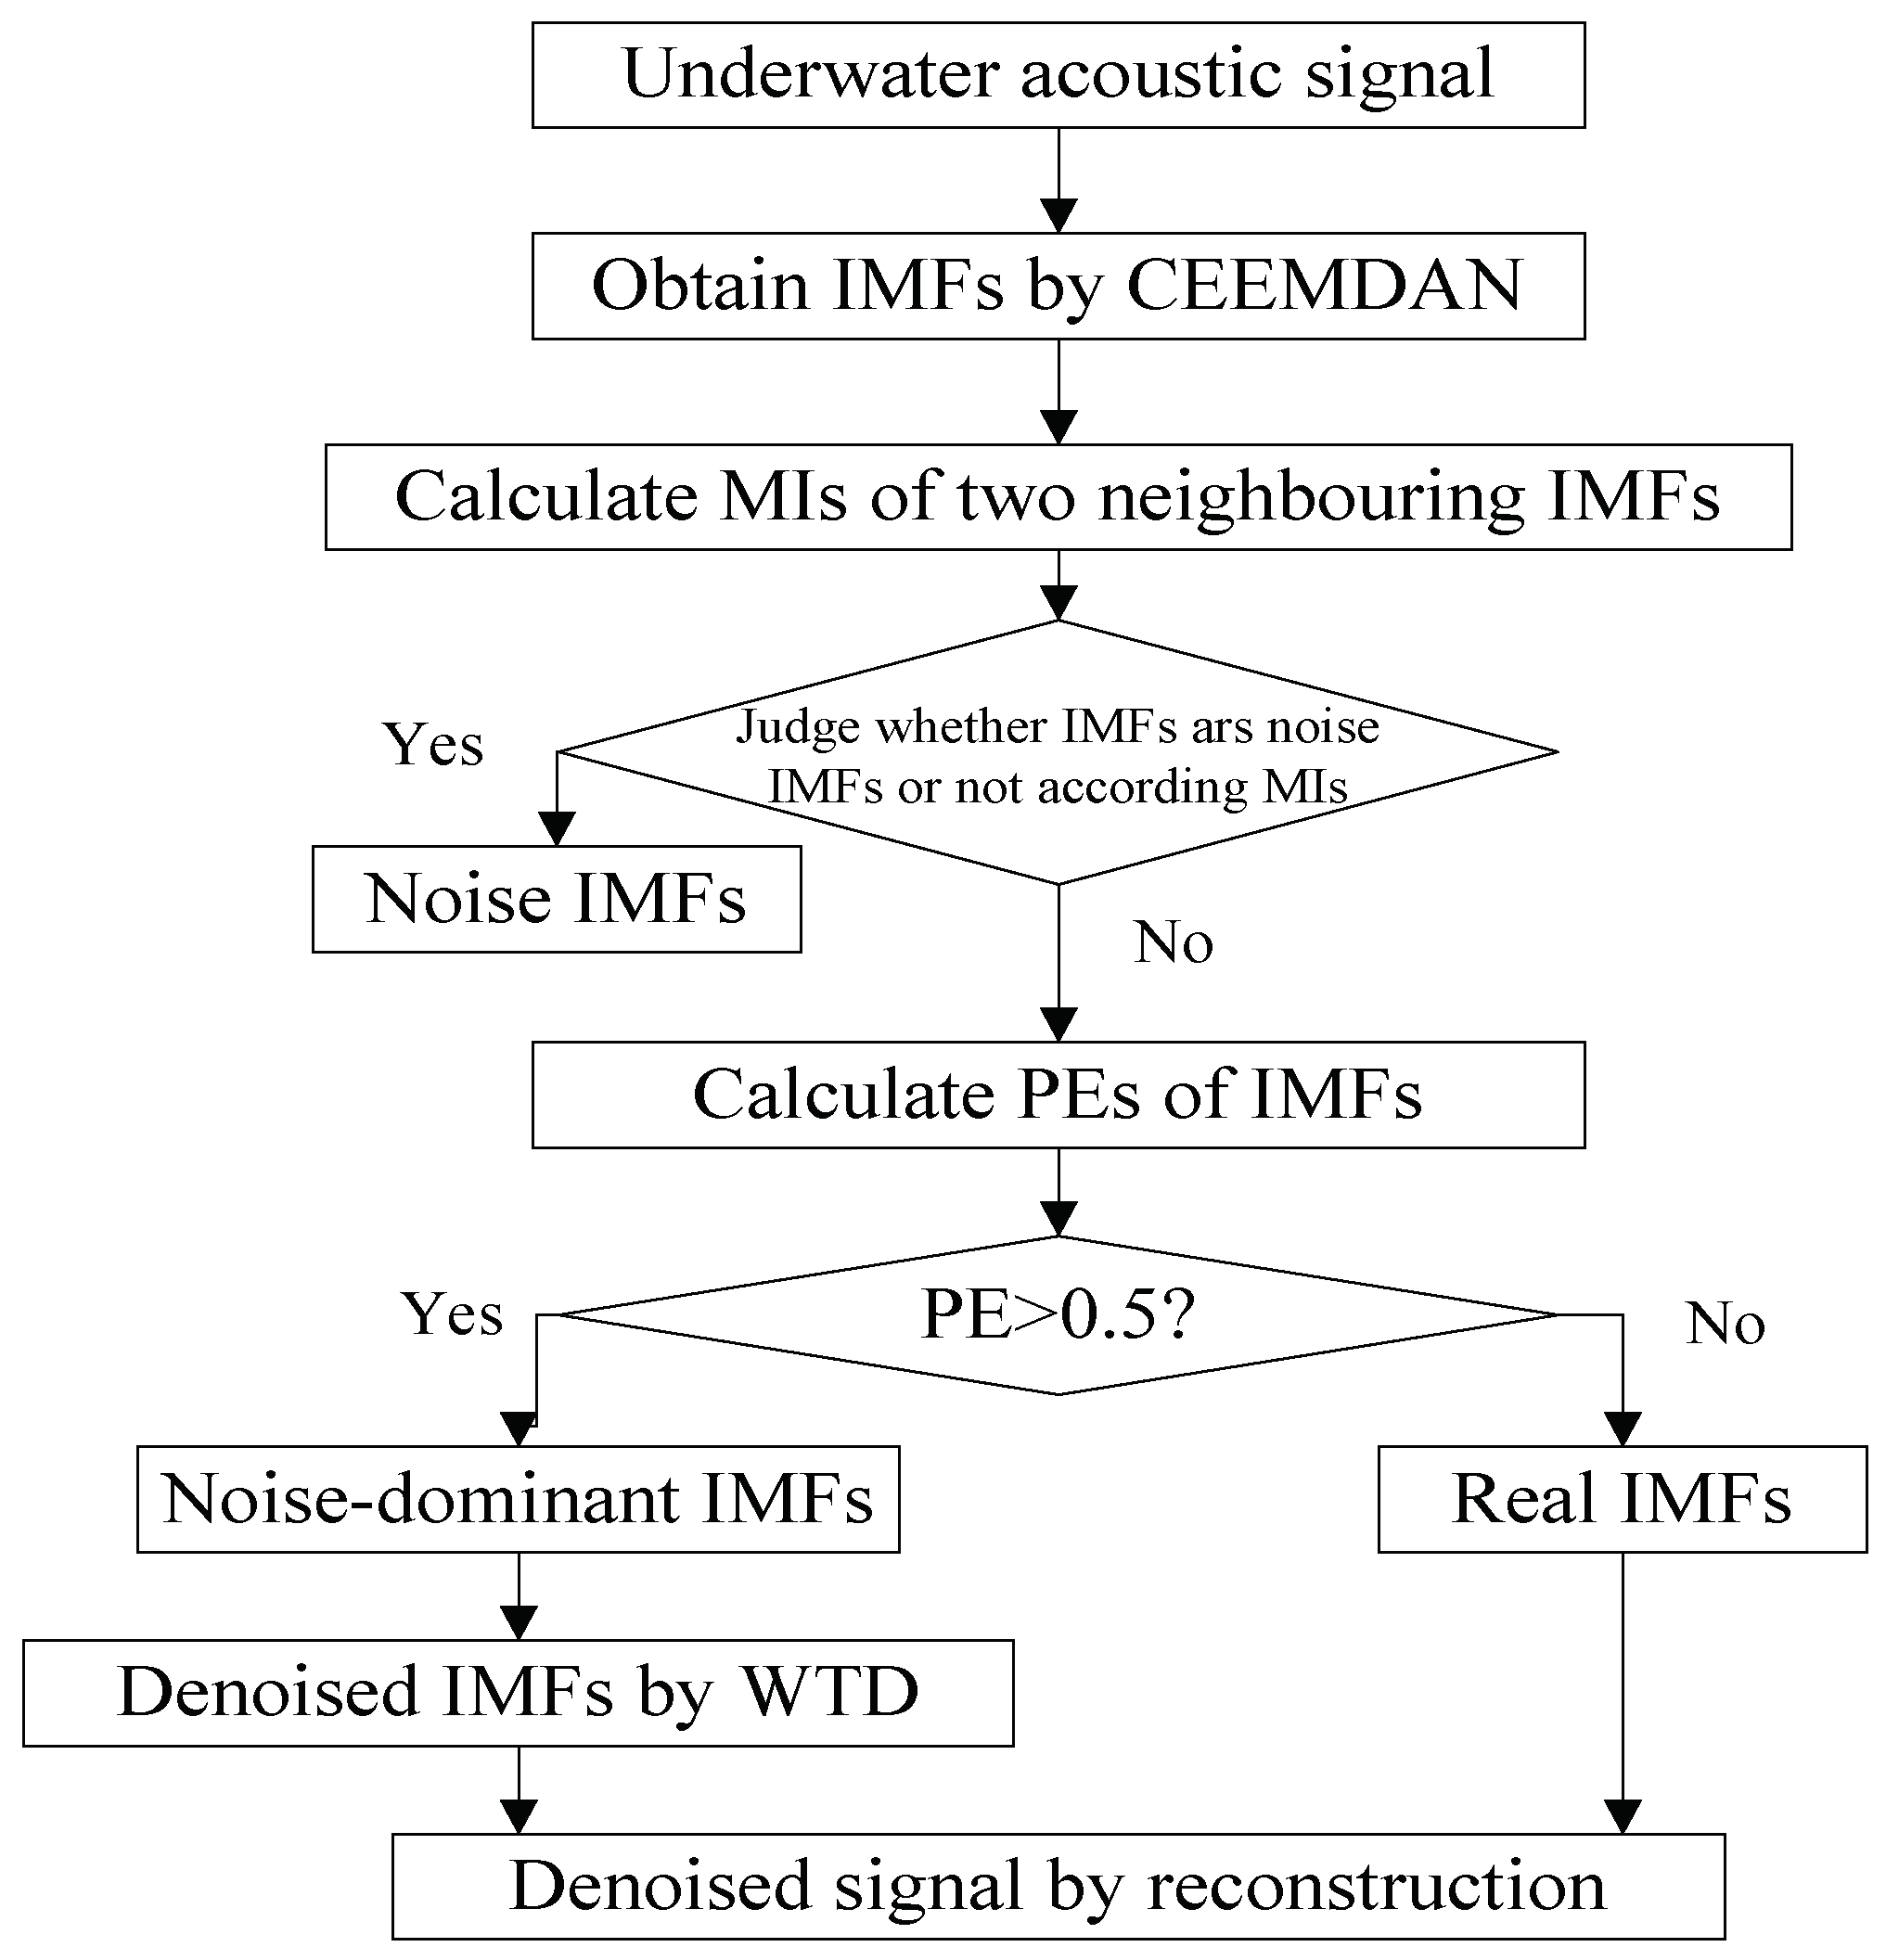
The proposed denoising algorithm for underwater acoustic signal is designed in Figure 4. The specific procedures are summarized as follows:

Figure 4.
The flow chart of the proposed denoising algorithm for underwater acoustic signal.
- (1)
- The underwater signal is decomposed by CEEMDAN, we can obtain a lot of IMFs, which contain noise IMFs, noise-dominant IMFs, and real IMFs.
- (2)
- Calculate MIs of two neighboring IMFs in ascending order.
- (3)
- Identify noise IMF according to MIs. If the MI of the -th IMF and -th IMF increases obviously than the former MIs, the former IMFs are considered as noise IMFs.
- (4)
- Screen out noise IMFs and calculate the PEs of the other IMFs.
- (5)
- Identify noise-dominant IMF according to PEs. If the PE of IMF is more than 0.5, weconsider it as noise-dominant IMF, otherwise real IMF.
- (6)
- Denoise noise-dominant IMFs by wavelet threshold denoising (WTD). We use the wavelet soft threshold denoising for noise-dominant IMFs, wavelet basis function, and decomposition level are db4 and 4, respectively.
- (7)
- The denoised signal can be obtain by reconstructing denoised noise-dominant IMFs and real IMFs.
4. Denoising for Simulation Signal
4.1. CEEMDAN for Simulation Signal
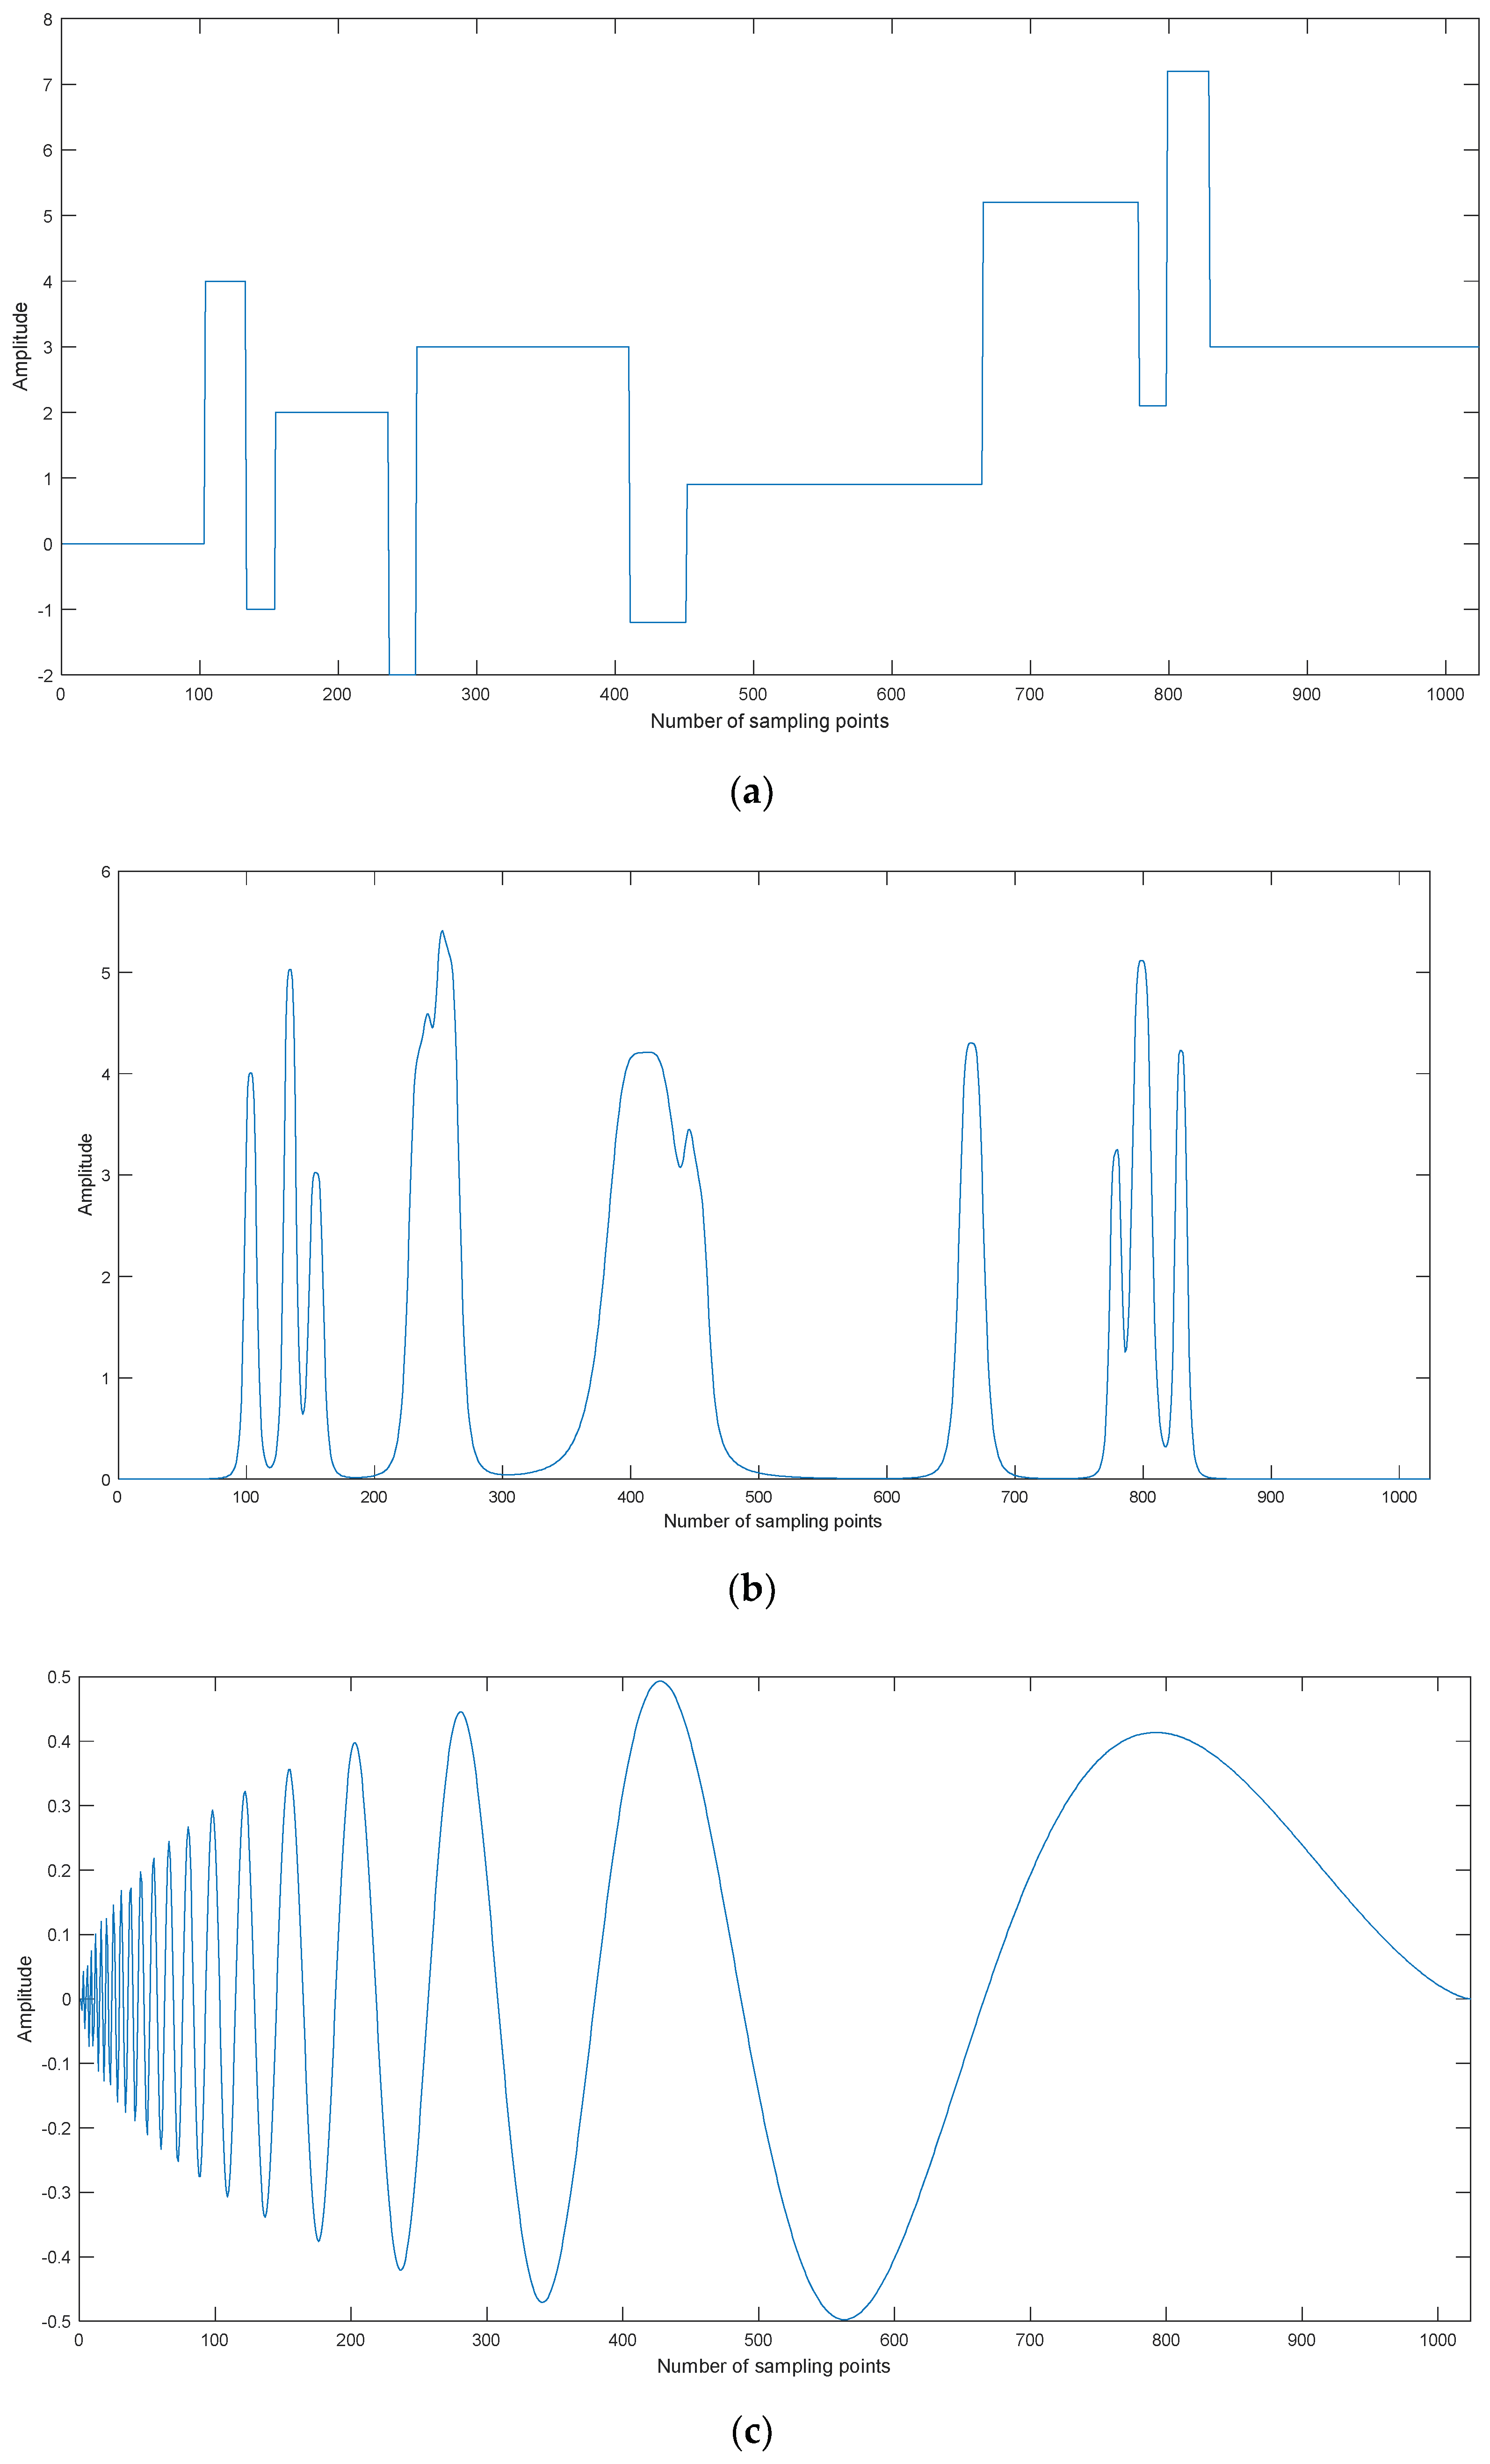
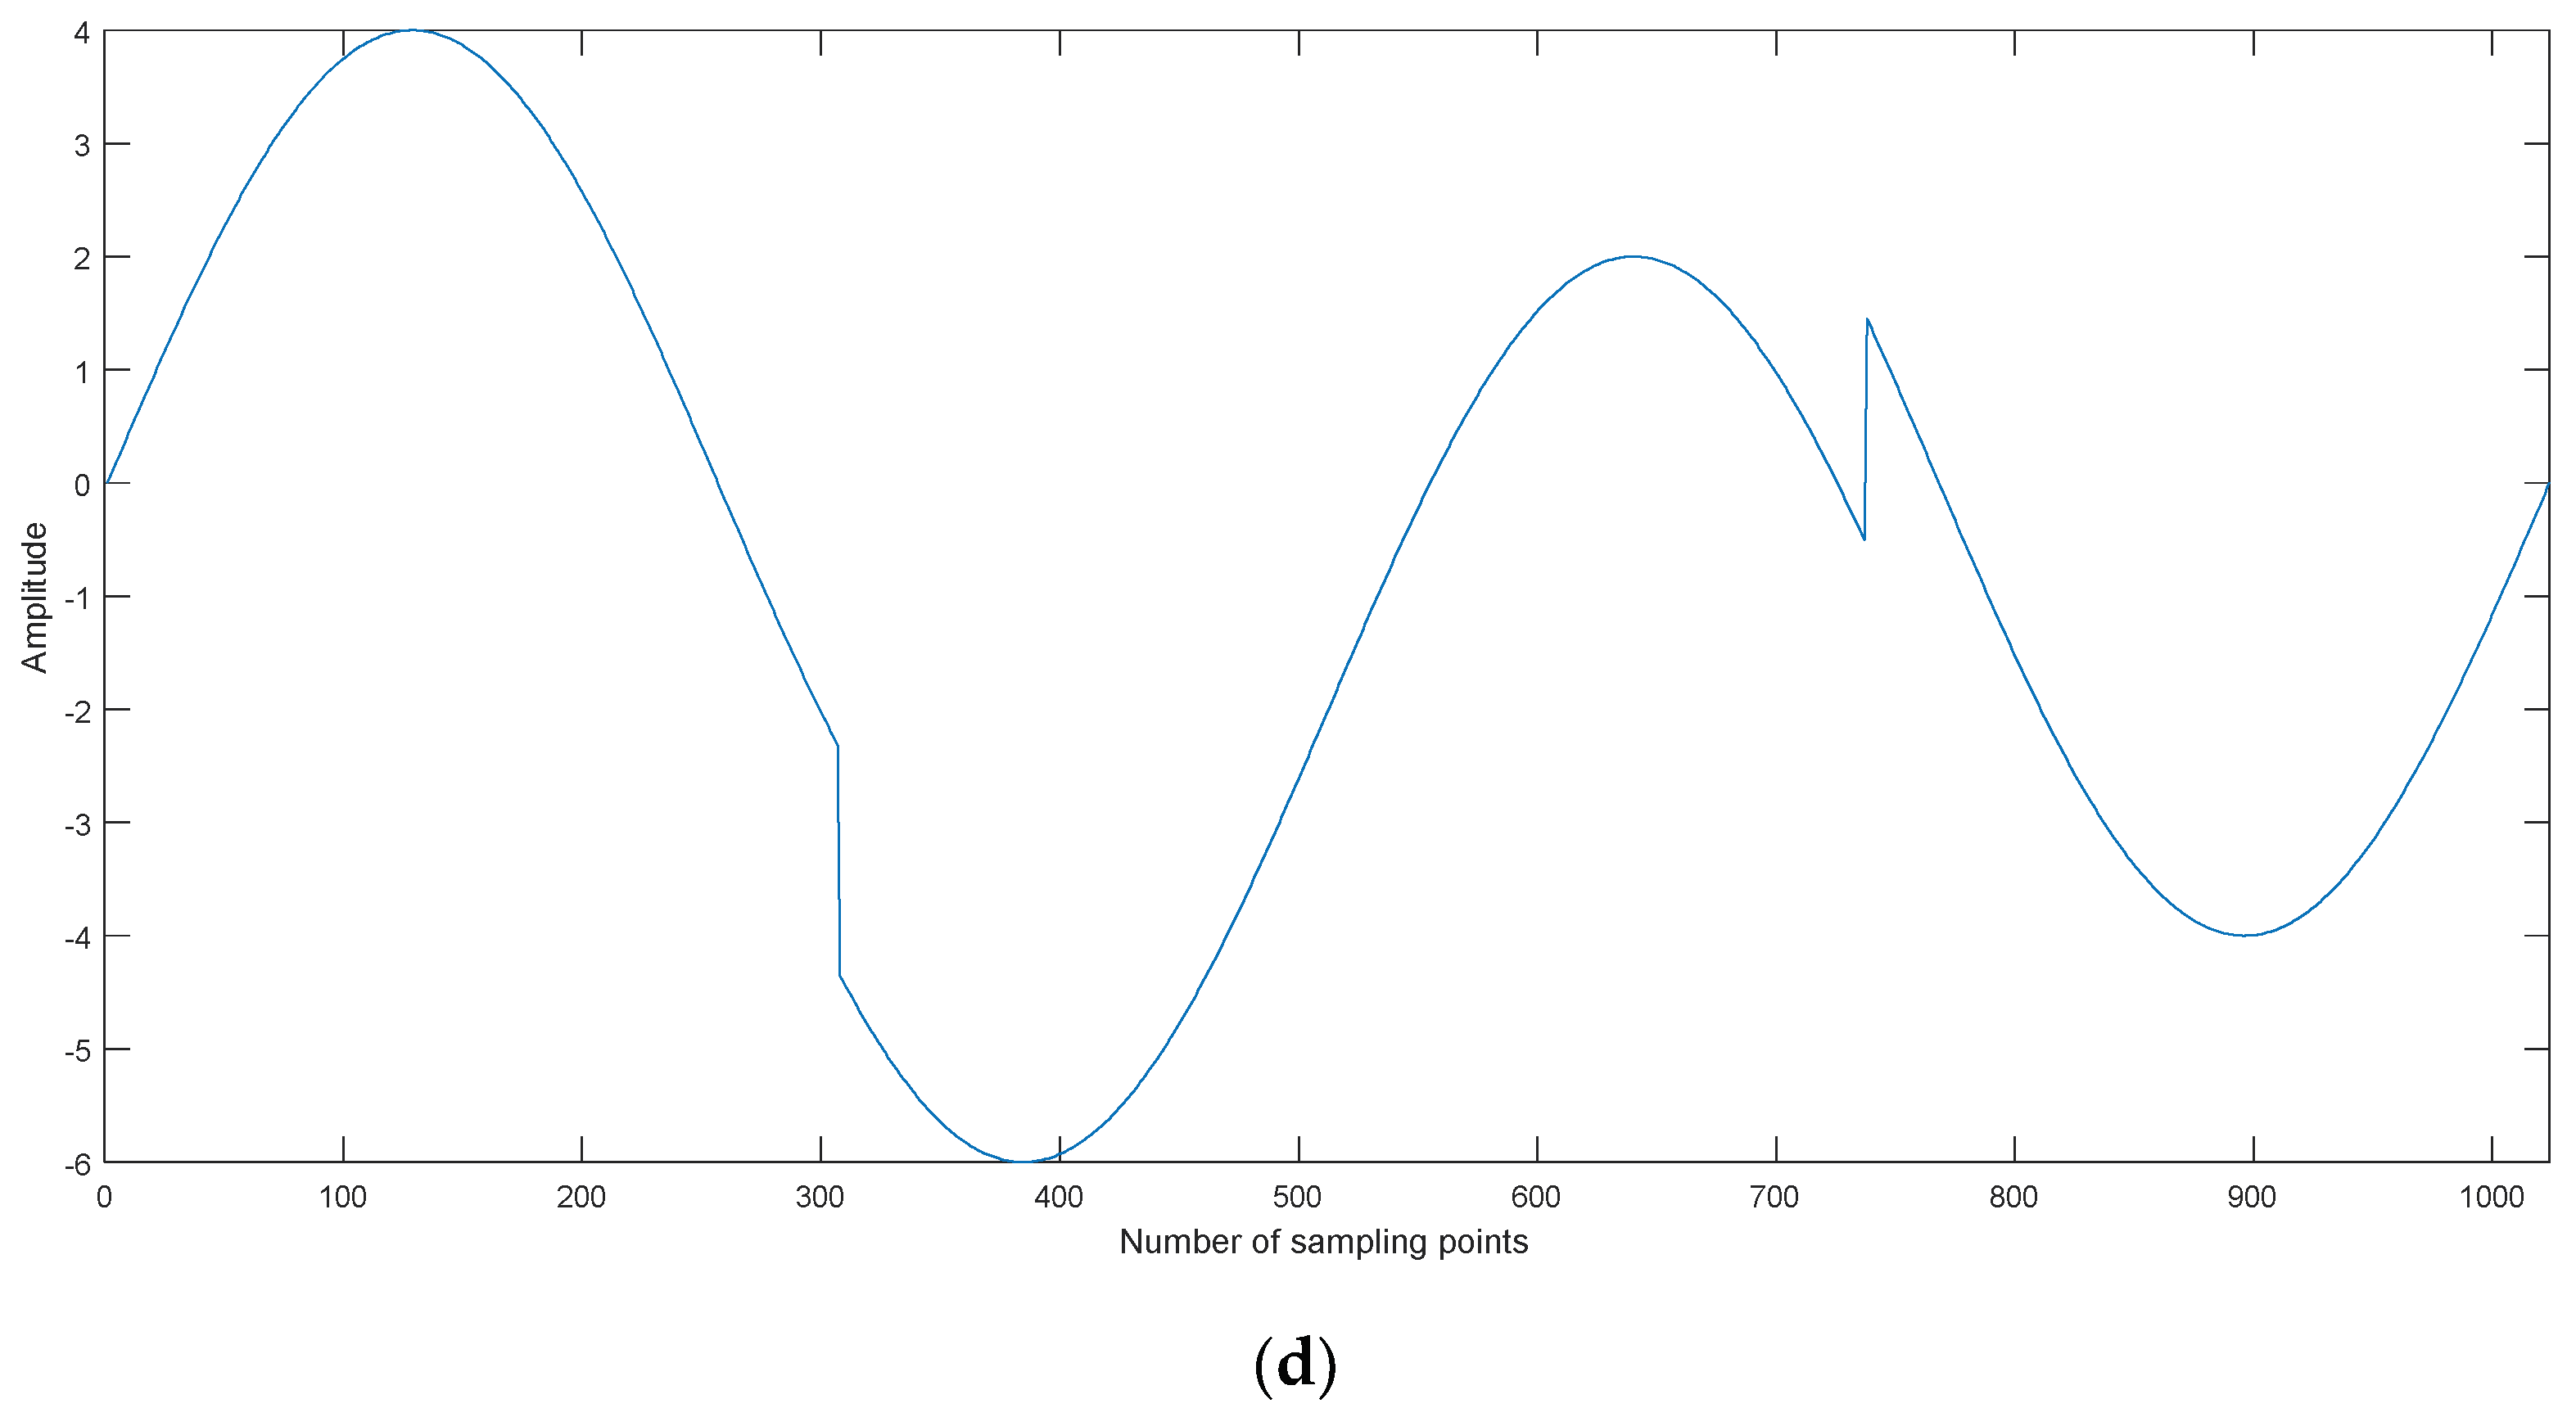
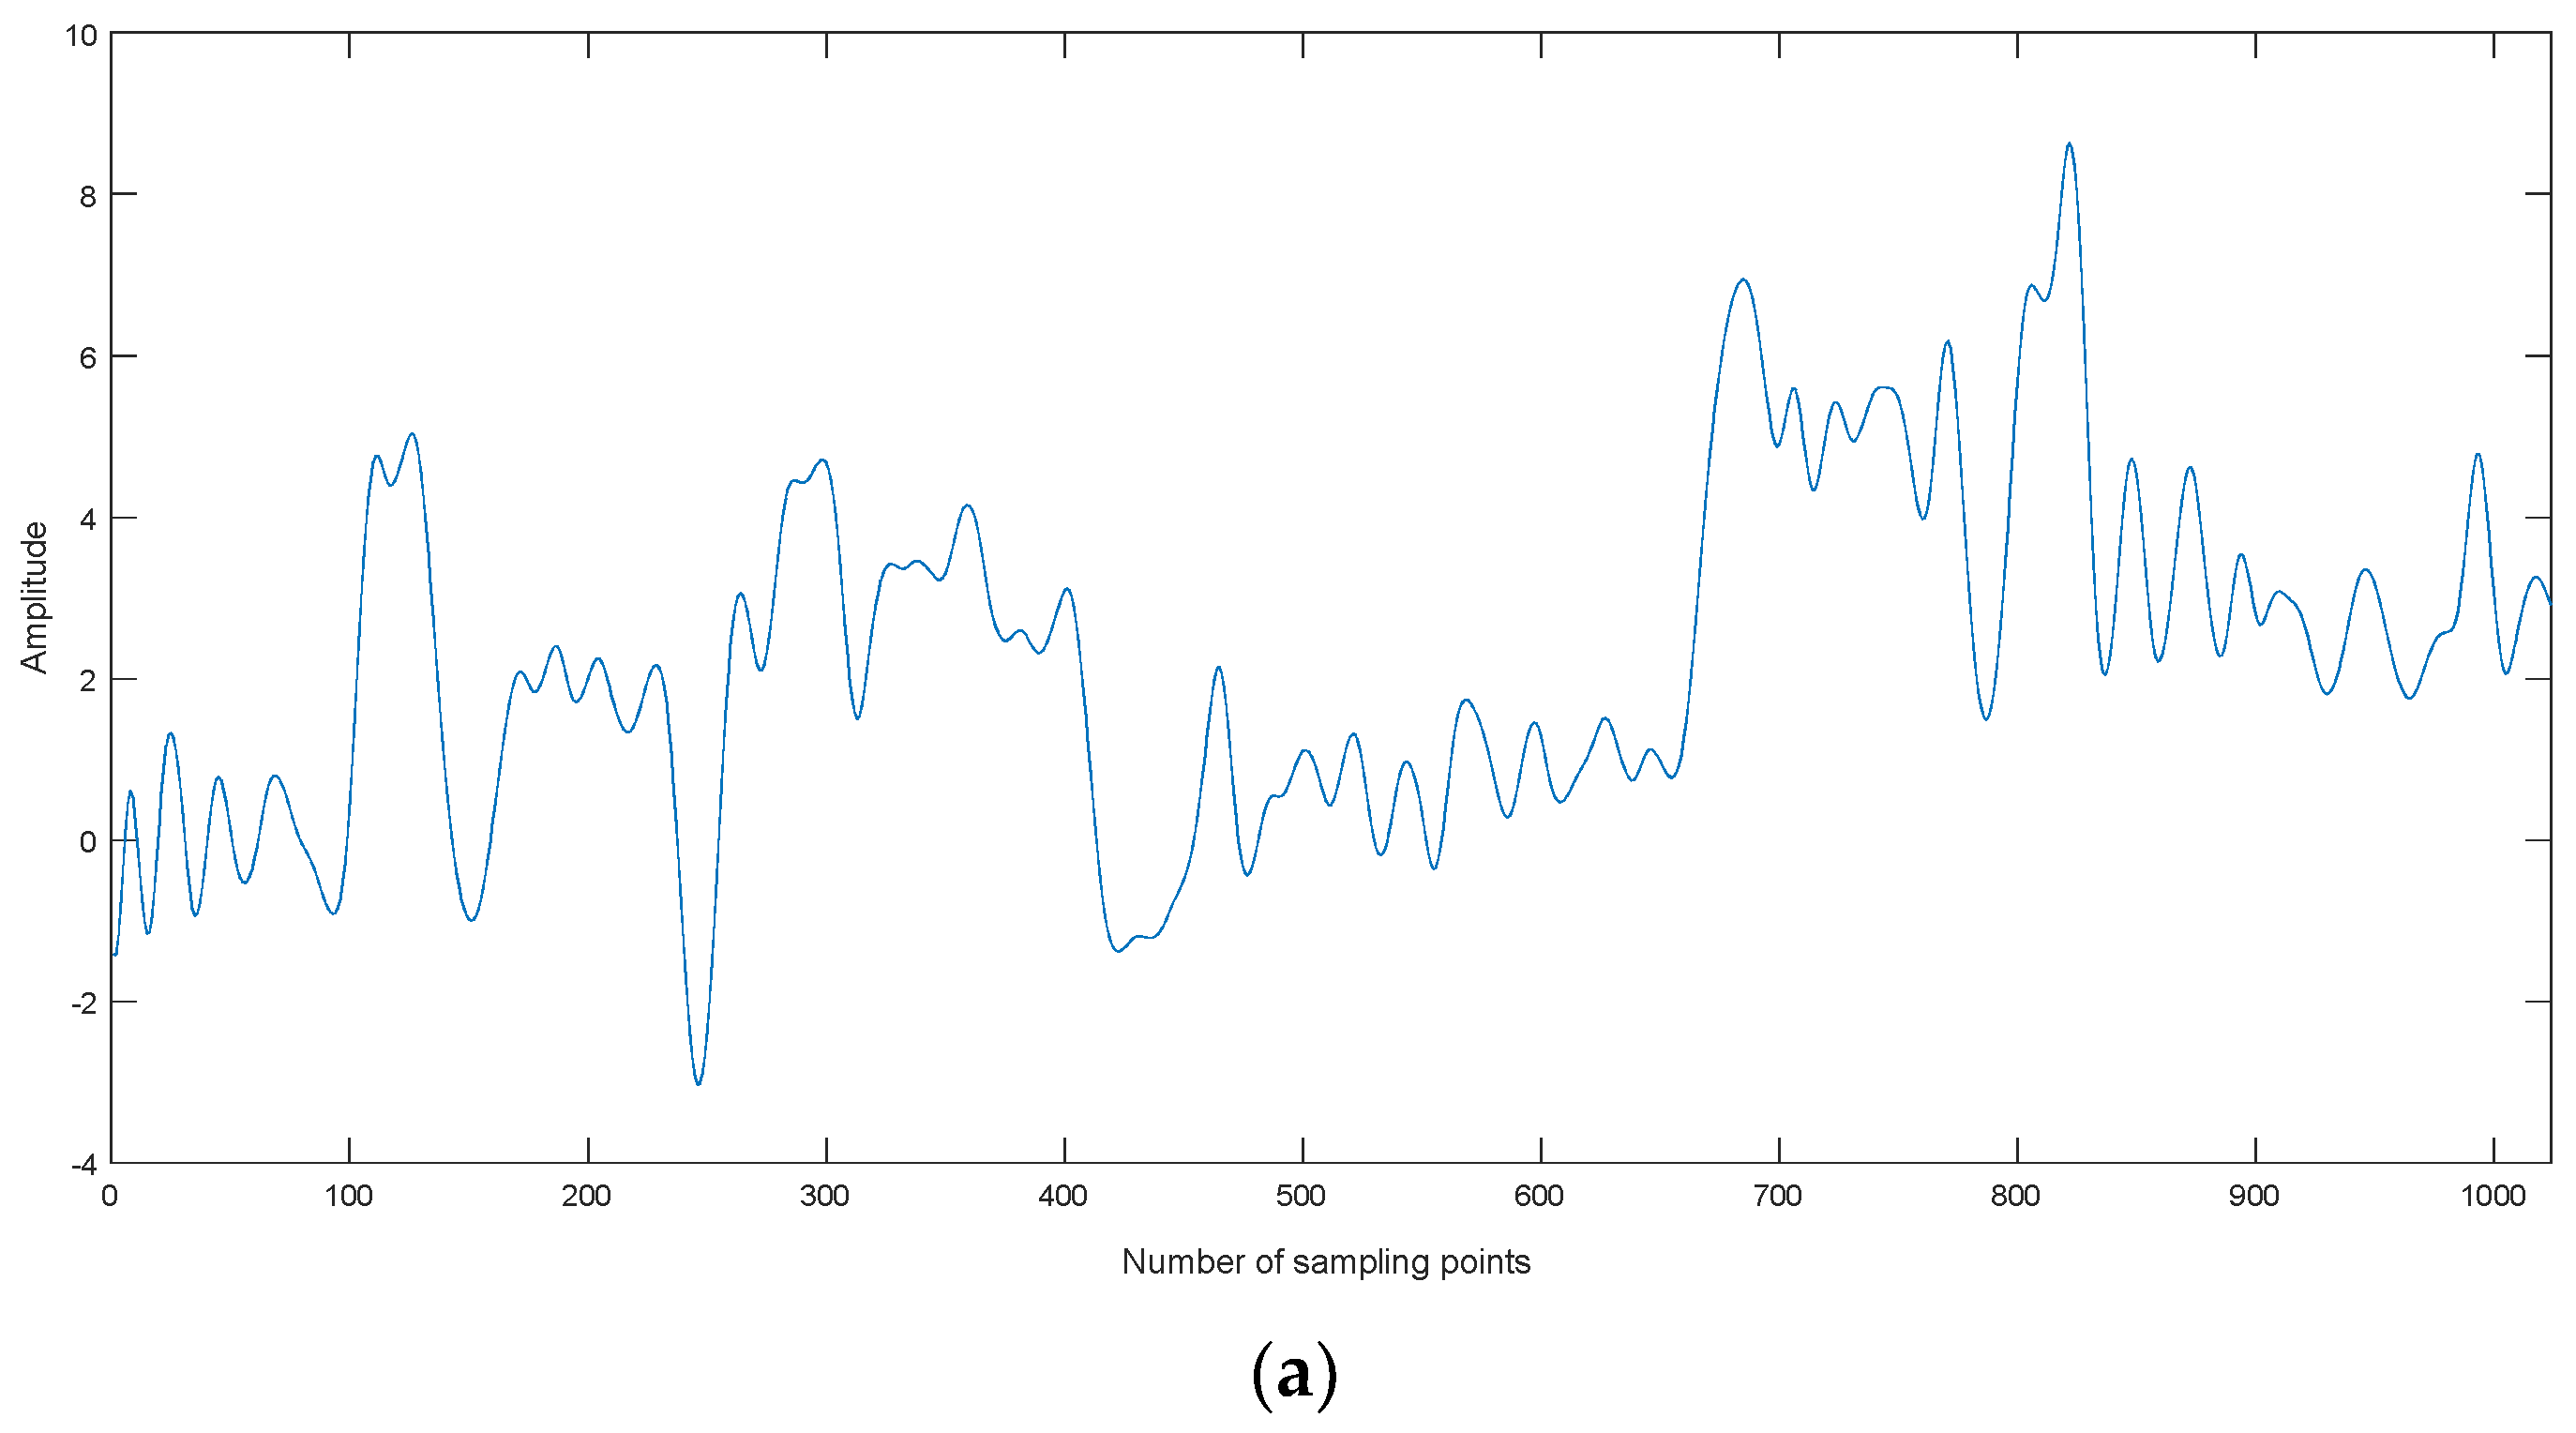
Four kinds of simulation signals are selected for denoising, namely, Blocks, Bumps, Doppler, and Heavysine, as shown in Figure 5. The sampling frequency and data lengthare 1 kHz and 1024, respectively.
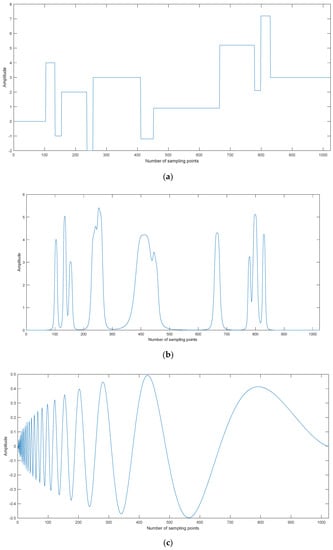
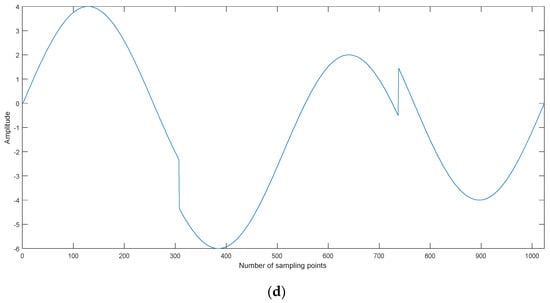
Figure 5.
The time-domain waveforms for simulation signals. (a) Blocks, (b) Bumps, (c) Doppler, and (d) Heavysine.
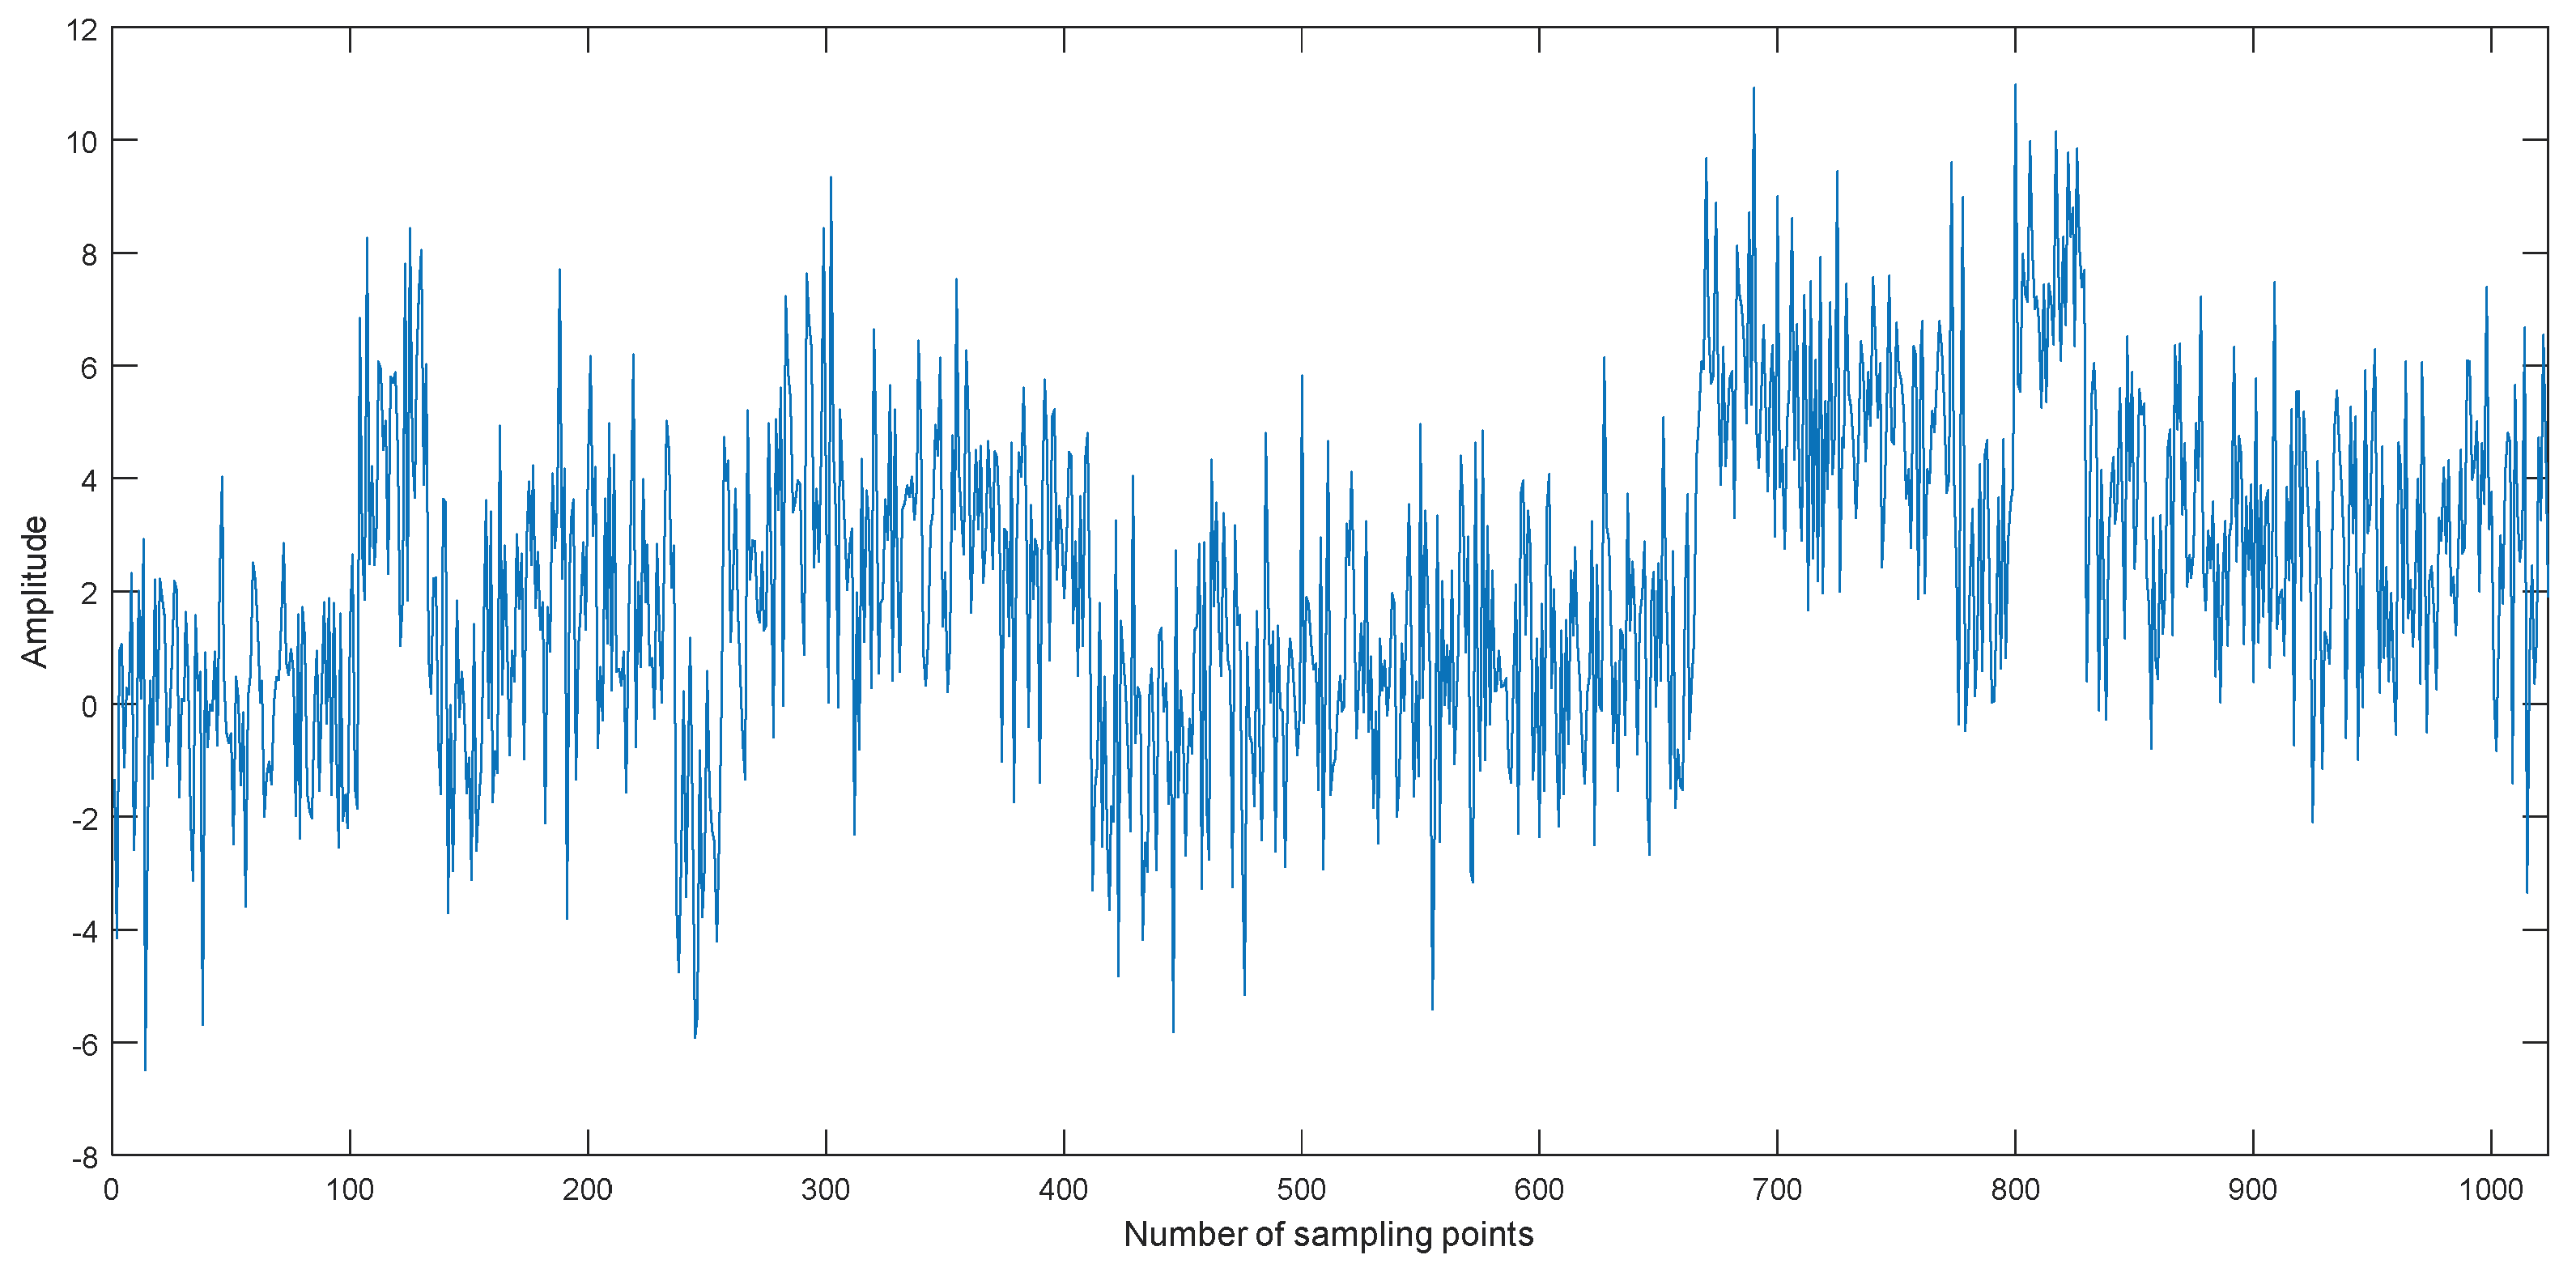
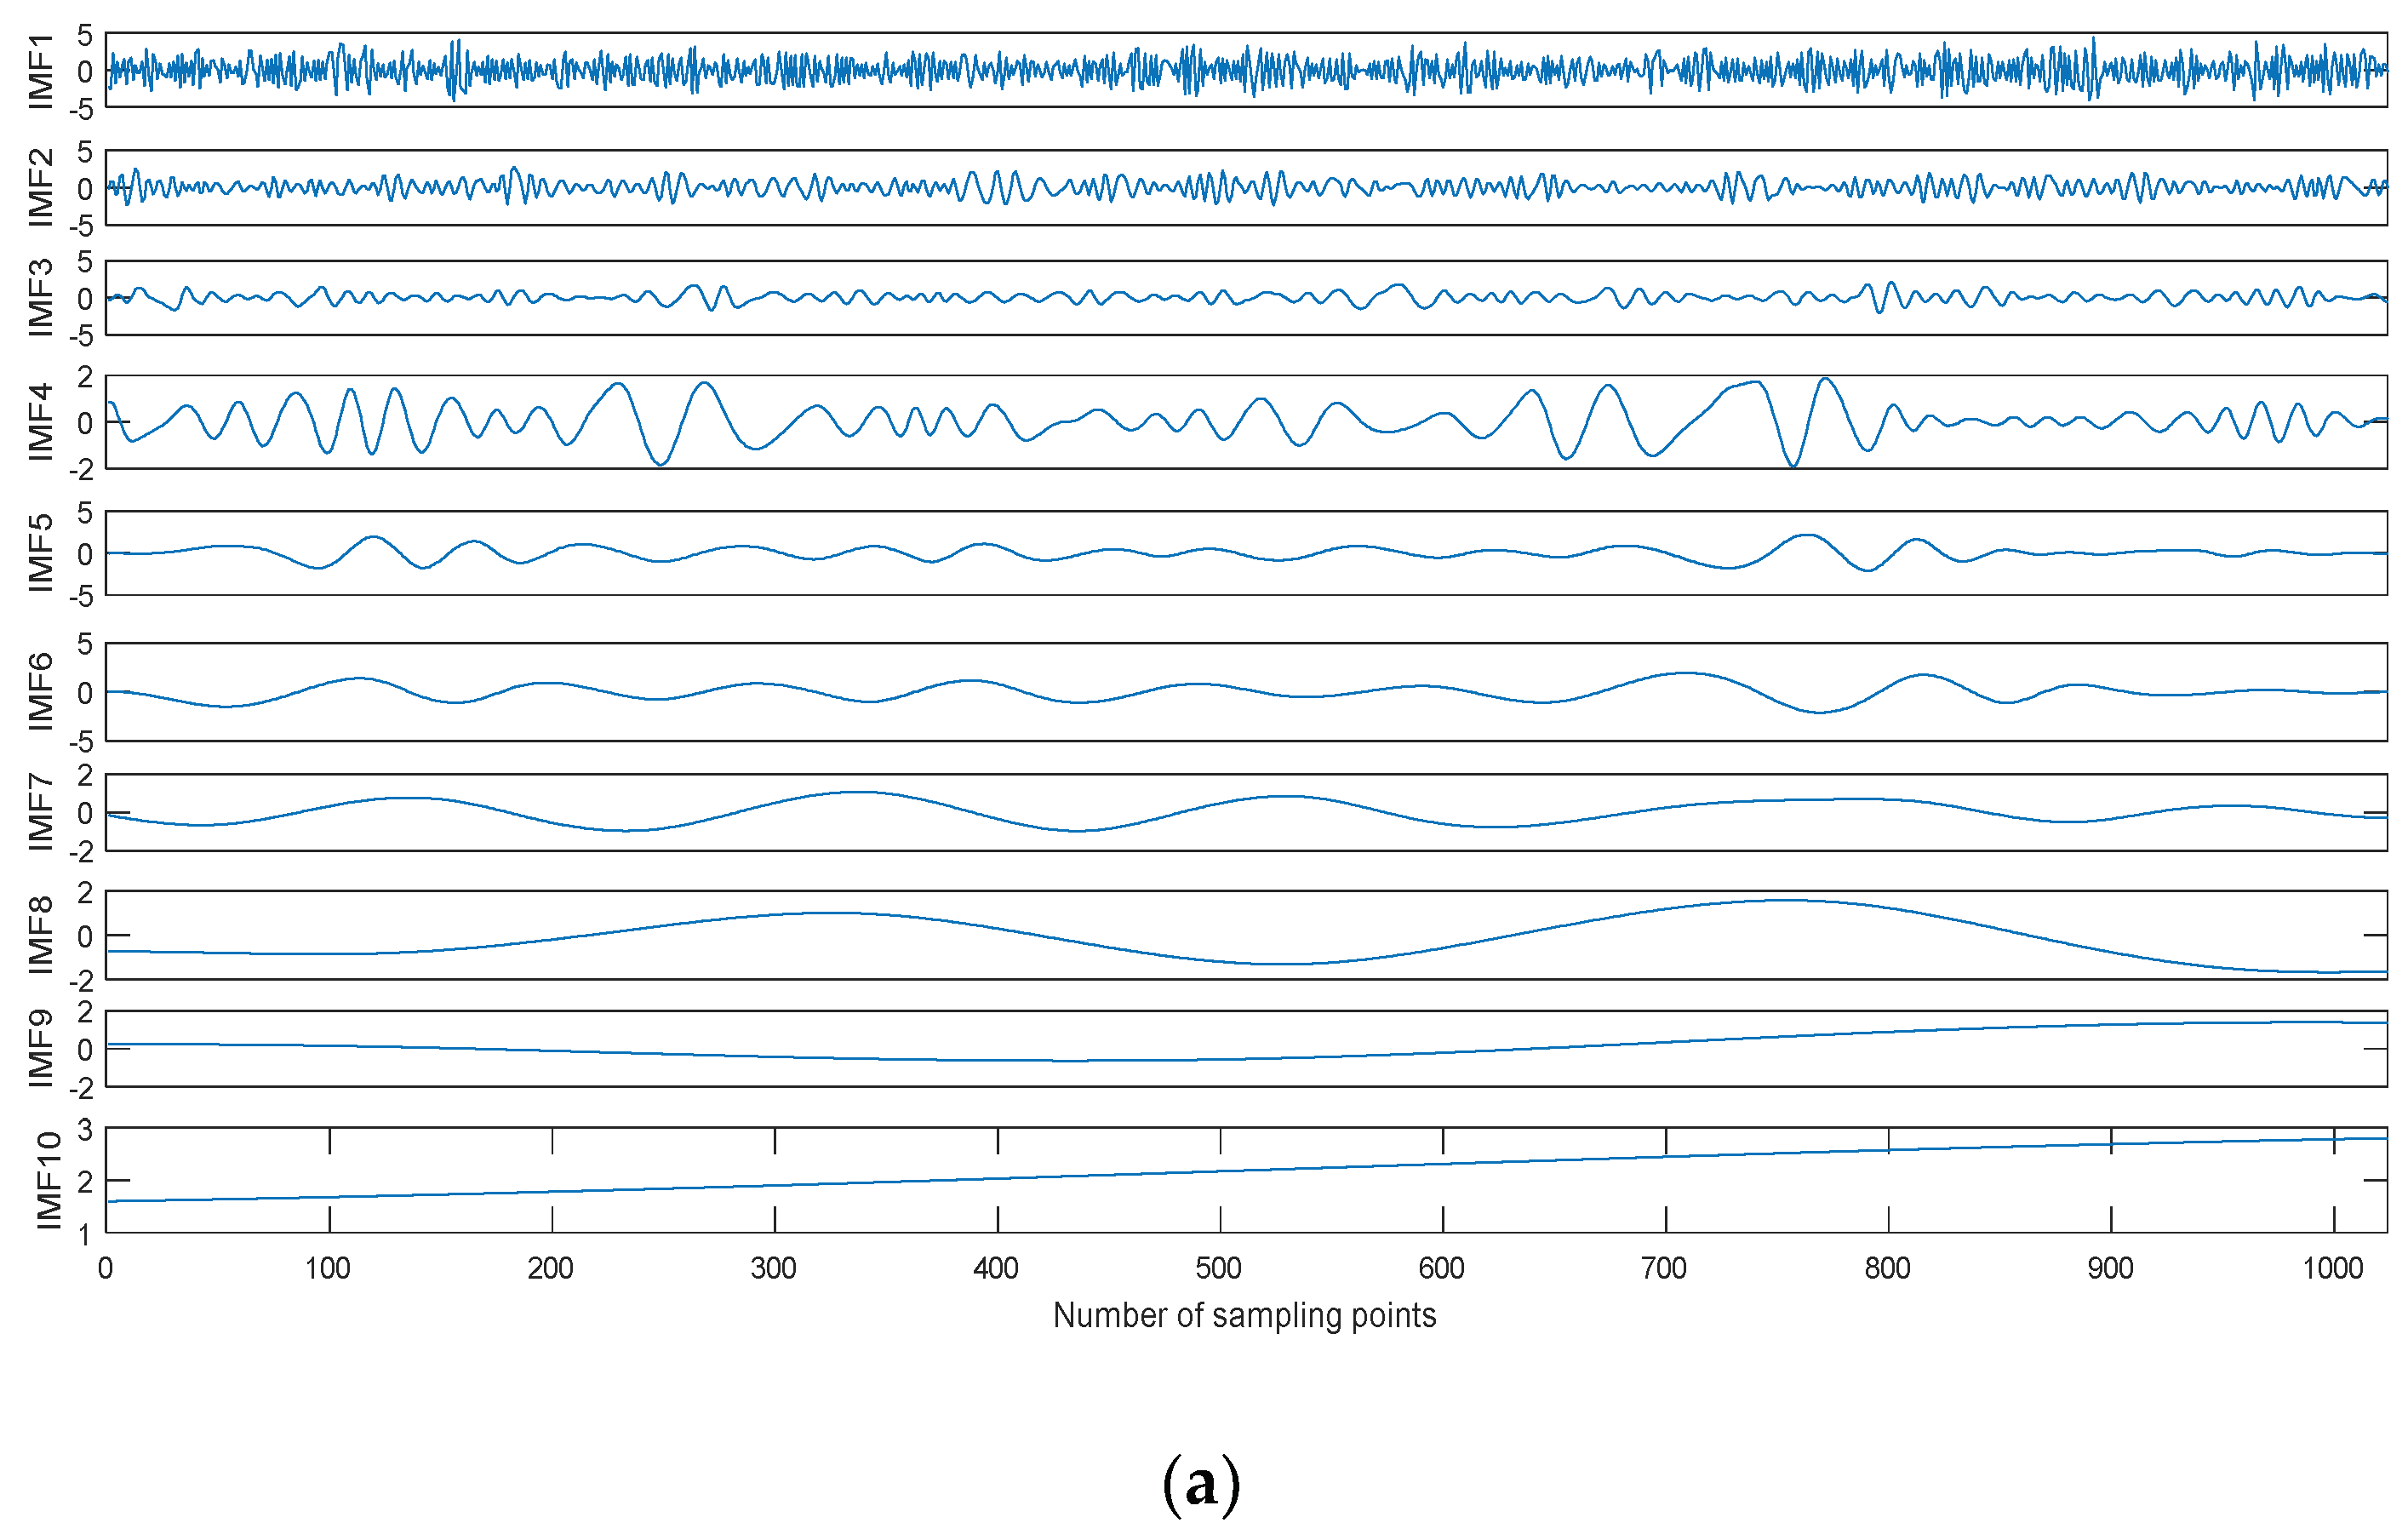
Taking the Blocks signal as an example, we can obtain the noisy Blocks signal with 0 dB signal-to-noise ratio (SNR) by adding Gaussian white noise. The time-domain waveform of the noisy Blocks signal with 0 dB is shown in Figure 6, and the decomposition result is shown in Figure 7. As shown in Figure 6, the Blocks signal has been completely submerged in noise. The noisy Blocks signal is decomposed using EMD, EEMD, and CEEMDAN.As shown in Figure 7, ten IMFs are obtained by three kinds of methods, however, there are some differences for different decomposition methods. IMF1 of each decomposition methods represent the shortest oscillation period, typically a noise component or the high frequency components.
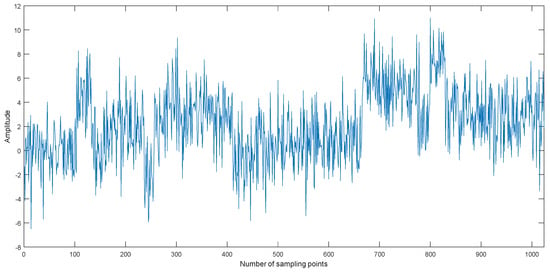
Figure 6.
The time-domain waveform of the noisy Blocks signal with 0 dB.
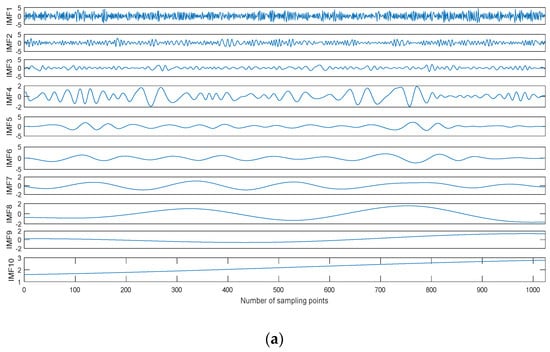
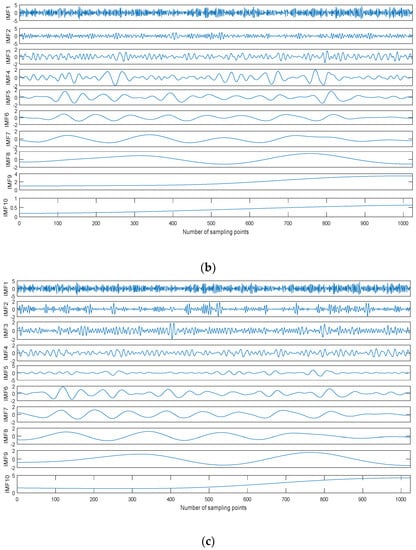
Figure 7.
The decomposition result of the noisy Blocks signal with 0 dB. (a) Empirical mode decomposition (EMD), (b) Ensemble EMD (EEMD), and (c) CEEMDAN.
4.2. Identifying Noise IMFs
In order to observe the effect of noise IMFs on denoising effect, we define the signal as follows:
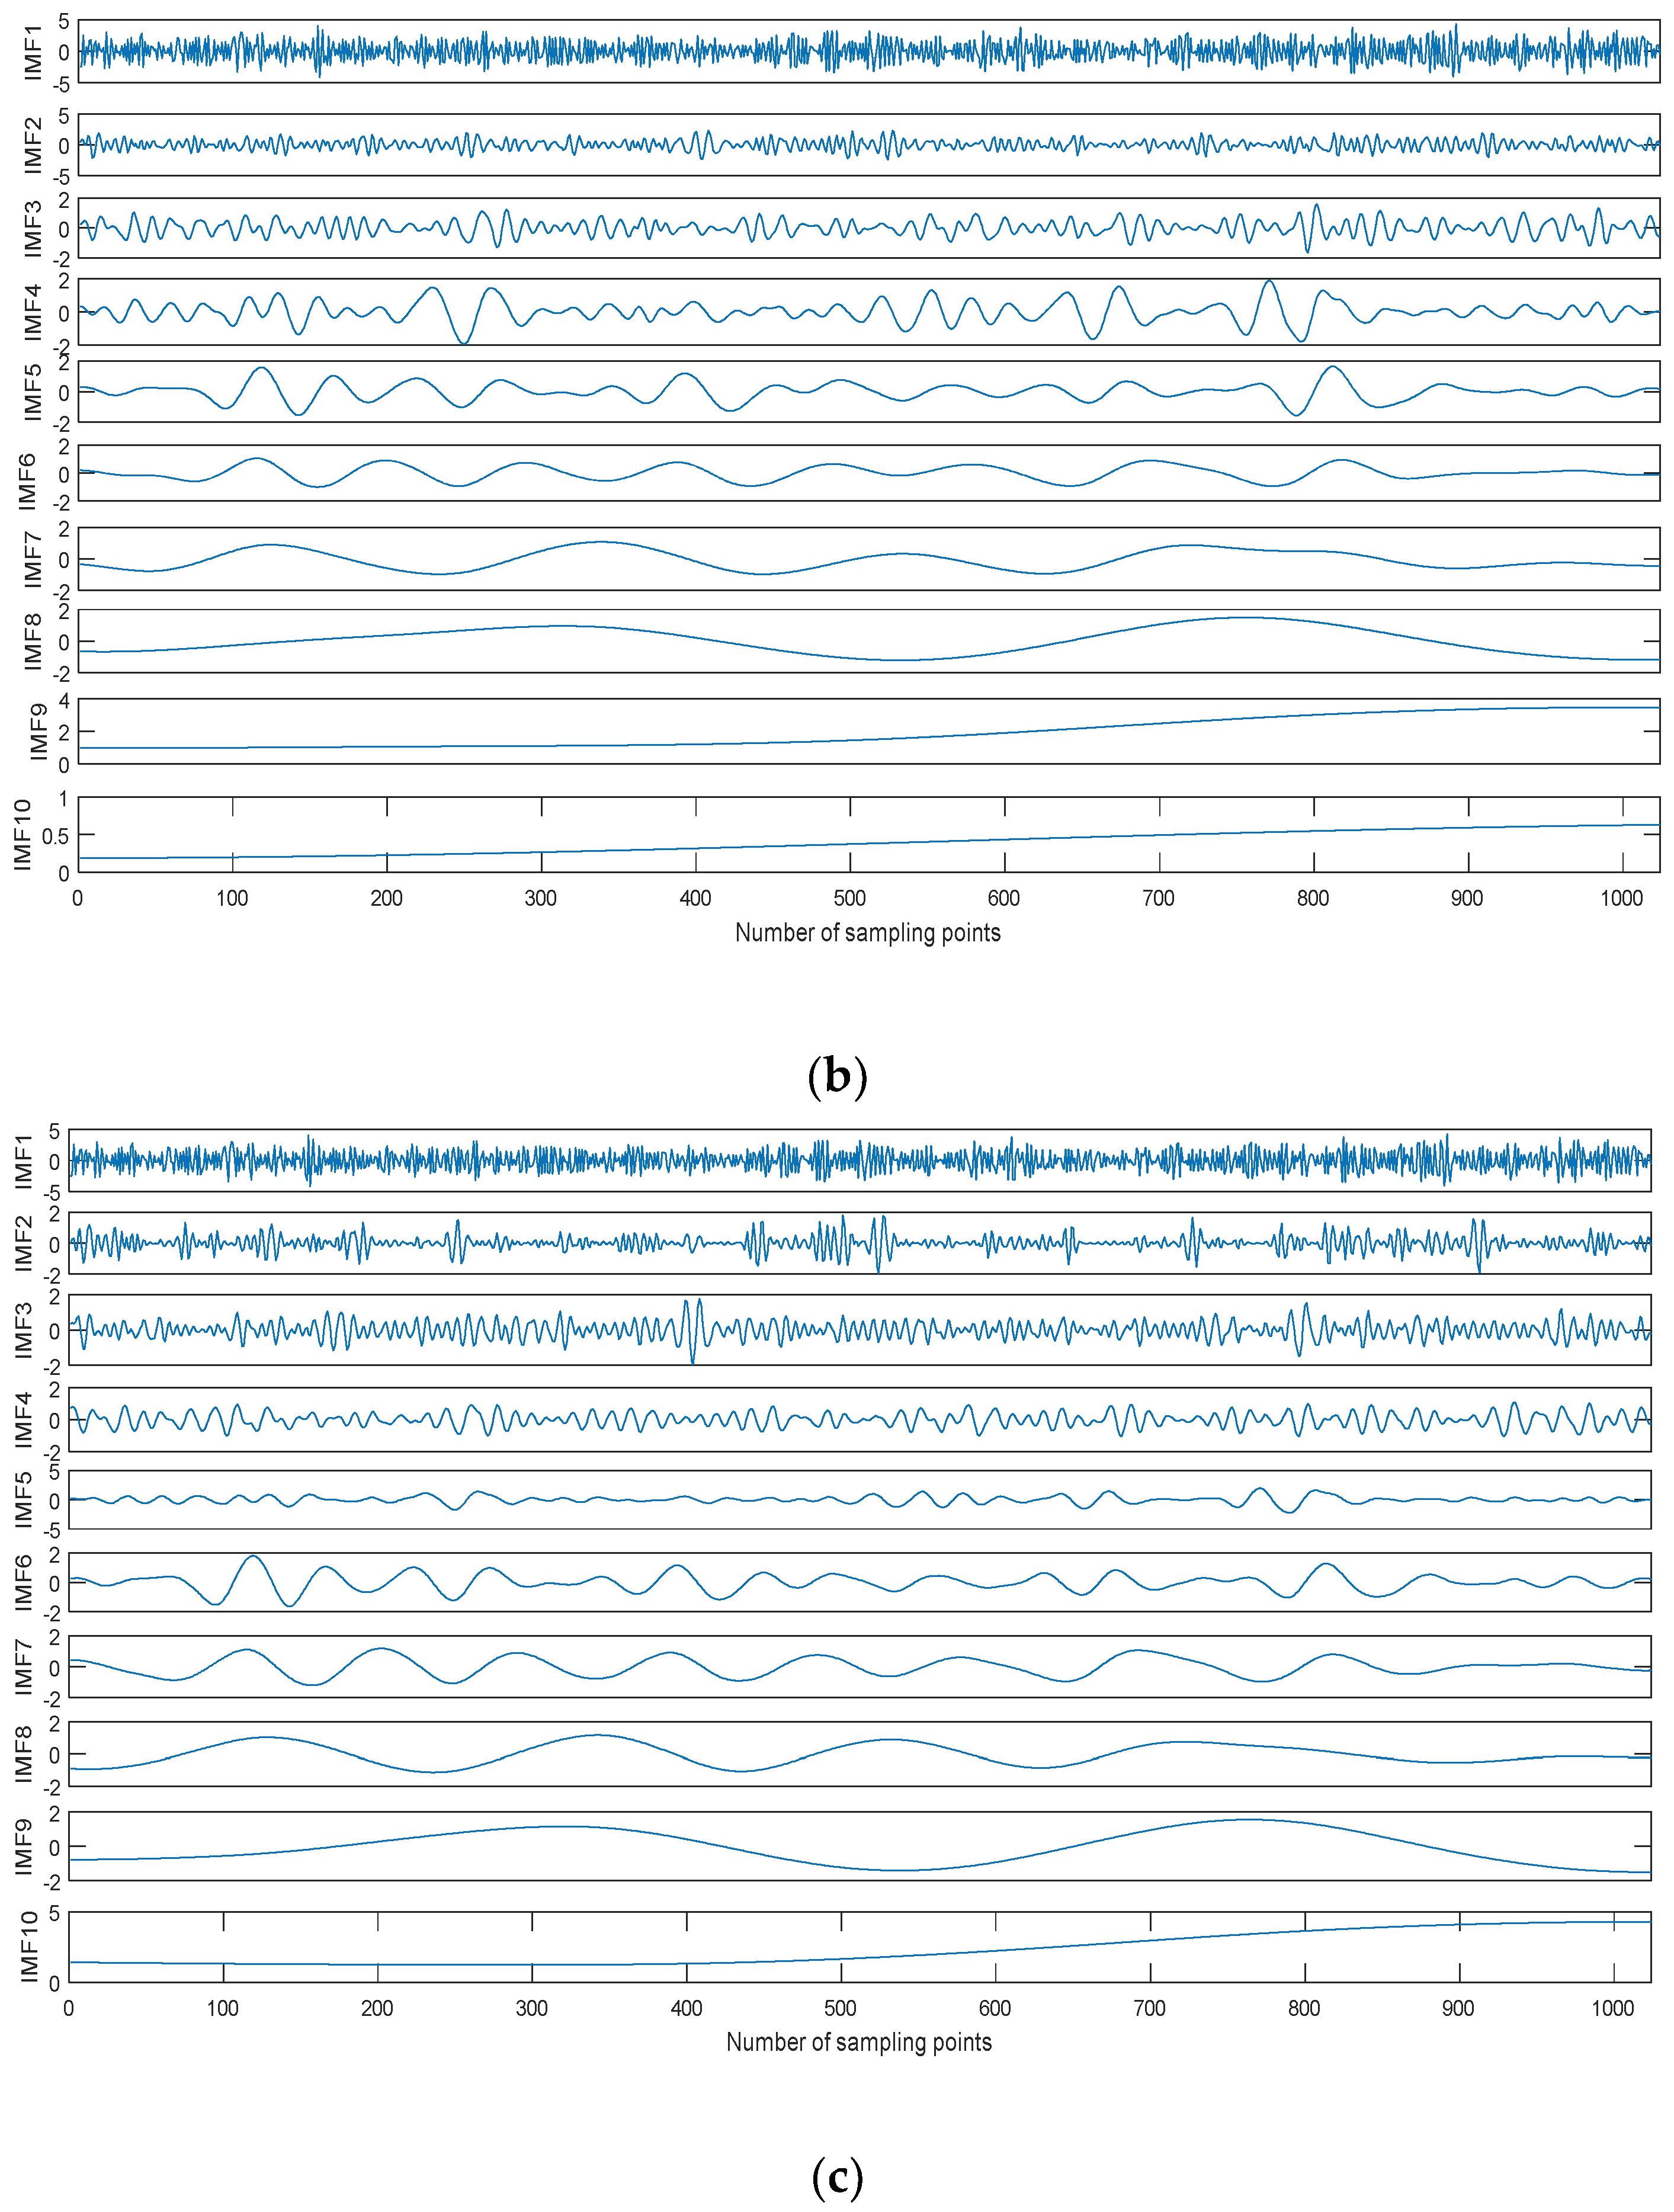
where and represent the noisy signal and the number of IMF by CEEMDAN, is the restructured signal by removing the first IMFs. For the noisy Blocks signal with 0 dB SNR, the six kinds of reconstructed signals are shown in Figure 8 using different decomposition methods.As shown in Figure 8, the noise IMFs is eliminated and the reconstructed signal becomes more smoothwith the increasing of . When is larger than a certain value, the non-noise IMF is eliminatedand the reconstructed signal is obviously different from the original signal. Therefore, how to identify noise IMFs is the key problem for denoising.
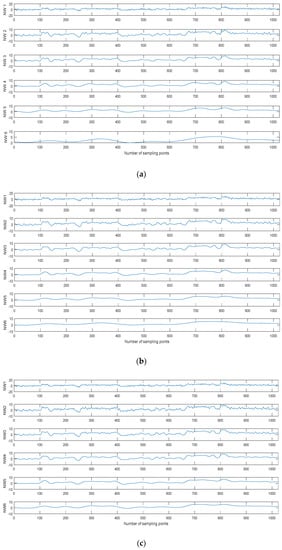
Figure 8.
The six kinds of reconstructed signals by different decomposition methods. (a) EMD, (b) EEMD, and (c) CEEMDAN.
MIs of two neighboring IMFs can expressed as:
where represents the MI of and . Usually, MI of two noise IMFs is obviously less than the MI of two non-noise IMFs. Therefore, when increases obviously, the former IMFs can be judged as noise IMFs.
For the noisy Blocks signal with 0 dB SNR, MIs of two neighboring IMFs by different decomposition methods are shown in Table 3. As shown in Table 3, is more than the former ones for EMD and EEMD, we can judge the first three IMFs as noise IMFs. Similarly, the first four IMFs are noise IMFs for CEEMDAN.
Table 3.
MIs of two neighboring IMFs by different decomposition methods.
4.3. Identifying Noise-Dominant IMFs
Noise-dominant IMFs can be identified according to PEs of non-noise IMFs. For the noisy Blocks signal with 0 dB SNR, PEs of non-noise IMFs are shown in Table 4. As shown in Table 4, the PE of IMF5 is more than 0.5, IMF5 is the noise-dominant IMF for CEEMDAN; real IMFs are the last five IMFs.
Table 4.
PEs of non-noise IMFs.
4.4. Denoising for Noise-Dominant IMFs and Reconstruction
The wavelet soft-threshold denoising is applied to IMF5, the wavelet basis function and decomposition level are db4 and 4, respectively. The denoised Blocks signal is obtainedby reconstructing denoised IMF5 and real IMFs. The denoising results are shown in Figure 9. Denoising methods using MI combined with EMD, EEMD, and CEEMDAN are called EMD-MI, EEMD-MI, and CEEMDAN-MI, theproposed denoising method is calledCEEMDAN-MI-PE.
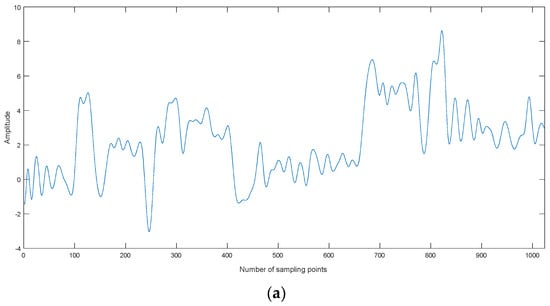
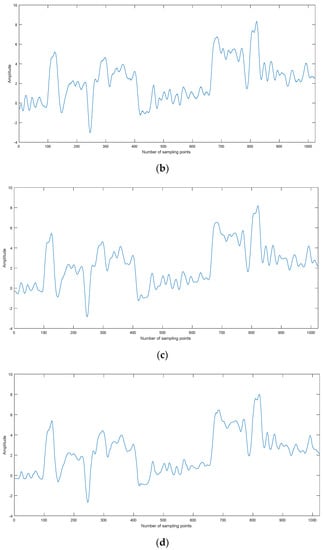
Figure 9.
The denoising results for different methods. (a) EMD-MI, (b) EEMD-MI, (c) CEEMDAN-MI, and (d) CEEMDAN-MI-PE.
The parameters of different denoising methods are shown in Table 5. As shown in Table 5, theproposed denoising method has lower root mean square error (RMSE) and higher SNR, which outperforms other three denoising methods.
Table 5.
Comparison of the parameters of different denoising methods.
4.5. Comparison of Different Denoising Methods
4.5.1. Wavelet Denoising
The wavelet soft-threshold denoising (WSTD) is applied to four kinds of noisy signals with different SNR, wavelet basis function is db4, decomposition level is from 1 to 6. WSTD results are shown in Table 6. As shown in Table 6, SNRs of the four kinds of signals increase with the increasing of decomposition levels. When the decomposition level increases to a certain value, the SNR reaches a maximum. For Doppler and Heavysine signals, when the decomposition level is 5, the denoising results are optimal. For Blocks and Bumps signals with different SNRs, the optimal denoising effects are distributed in different decomposition levels.
Table 6.
(a) wavelet soft-threshold denoising (WSTD) results for Blocks signal. (b) WSTD results for Bumps signal. (c) WSTD results for Doppler signal. (d) WSTD results for Heavysine signal.
4.5.2. Comparison of Denoising Effect
Four kinds of signals with different SNRs are denoised by EMD-MI, EEMD-MI, CEEMDAN-MI, CEEMDAN-MI-PE, and WSTD. Denoising results of different methods are shown in Table 7, where WSTD denoising results are optimal values in Table 6. All the results of SNRs and RMSEs are the mean of 500 simulations. As shown in Table 7, the CEEMDAN-MI is better than EMD-MI, EEMD-MI, and WSTD, the CEEMDAN-MI-PE has lower RMSE and higher SNR, which has a better performance than the other four denoising methods.
Table 7.
(a) Denoising results of different methods for Blocks signal. (b) Denoising results of different methods for Bumps signal. (c) Denoising results of different methods for Doppler signal. (d) Denoising results of different methods for Heavysine signal.
5. Denoising for Chaotic Signal
Underwater acoustic signals have the chaotic characteristic, a typical Lorenz chaotic system is used to test the effectiveness of the CEEMDAN-MI-PE denoising algorithm.
The Lorenz system can be expressed as:
where is 10, is 8/3, is 28.
The Runge–Kutta iteration method is used to calculate the component with a step length of 0.01.The x component signal with a length of 2000 points is selected as Lorenz signal, and the Lorenz noisy signal with different SNR are obtained for CEEMDAN-MI-PE denoising.
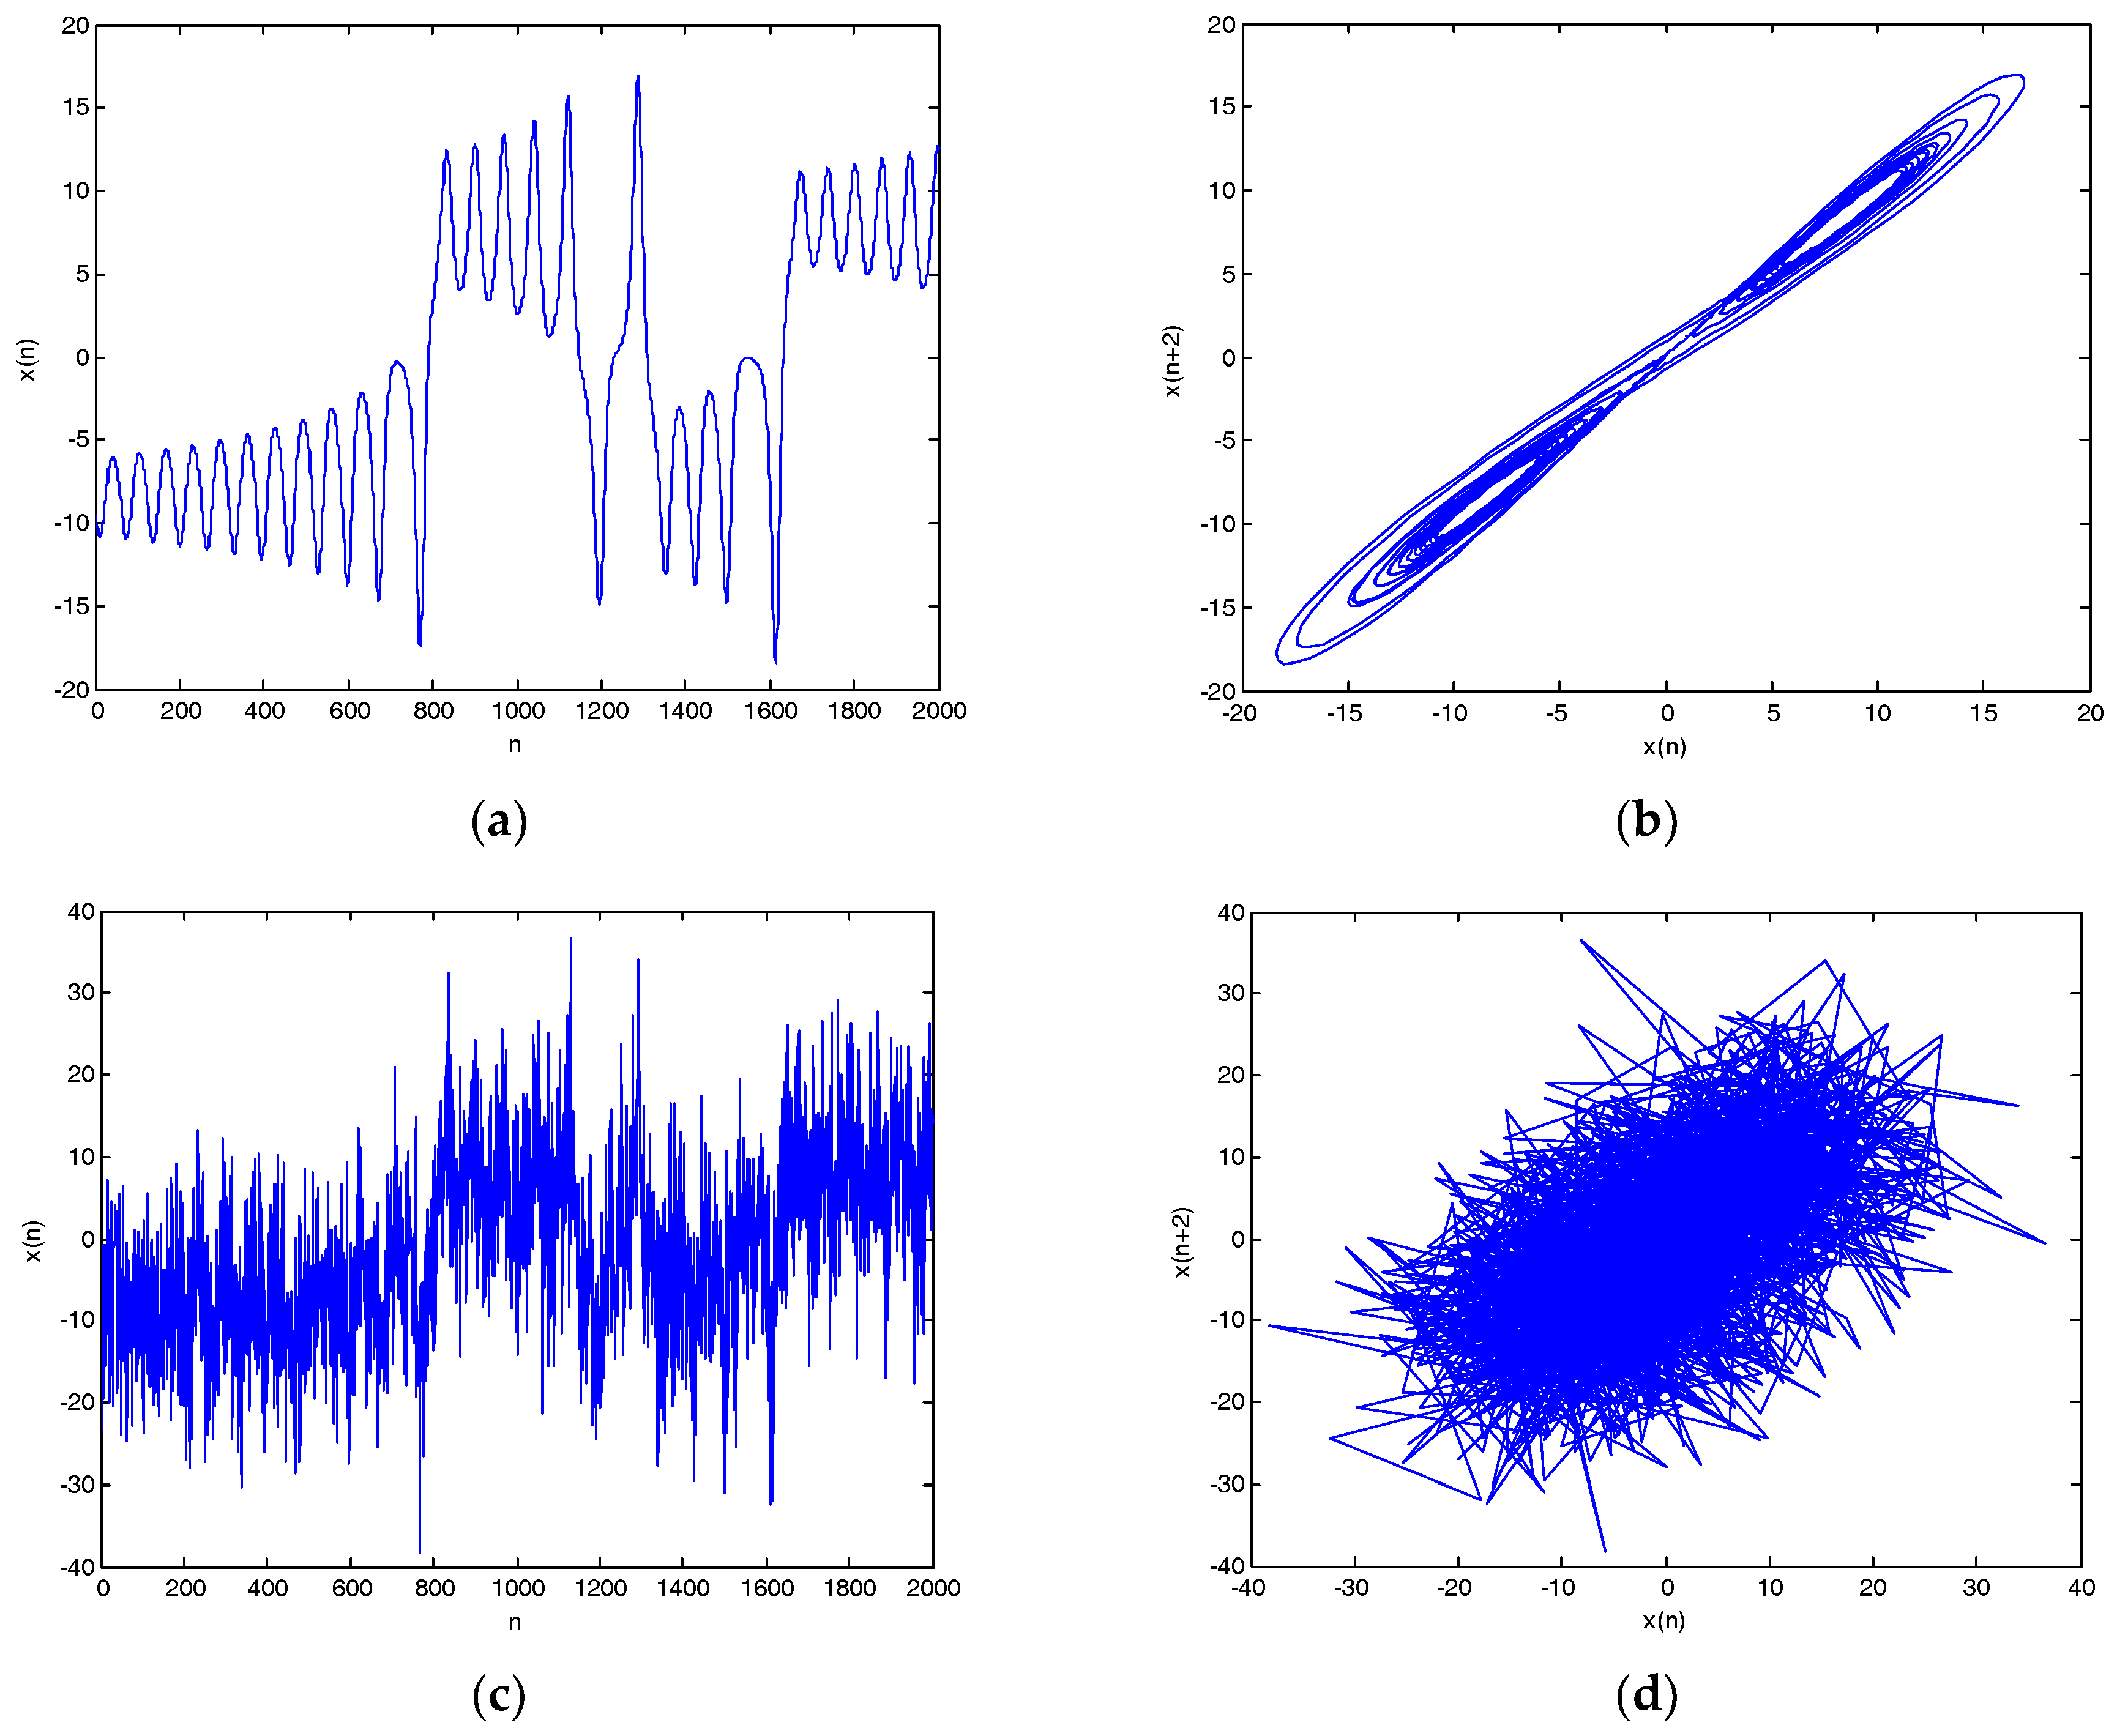
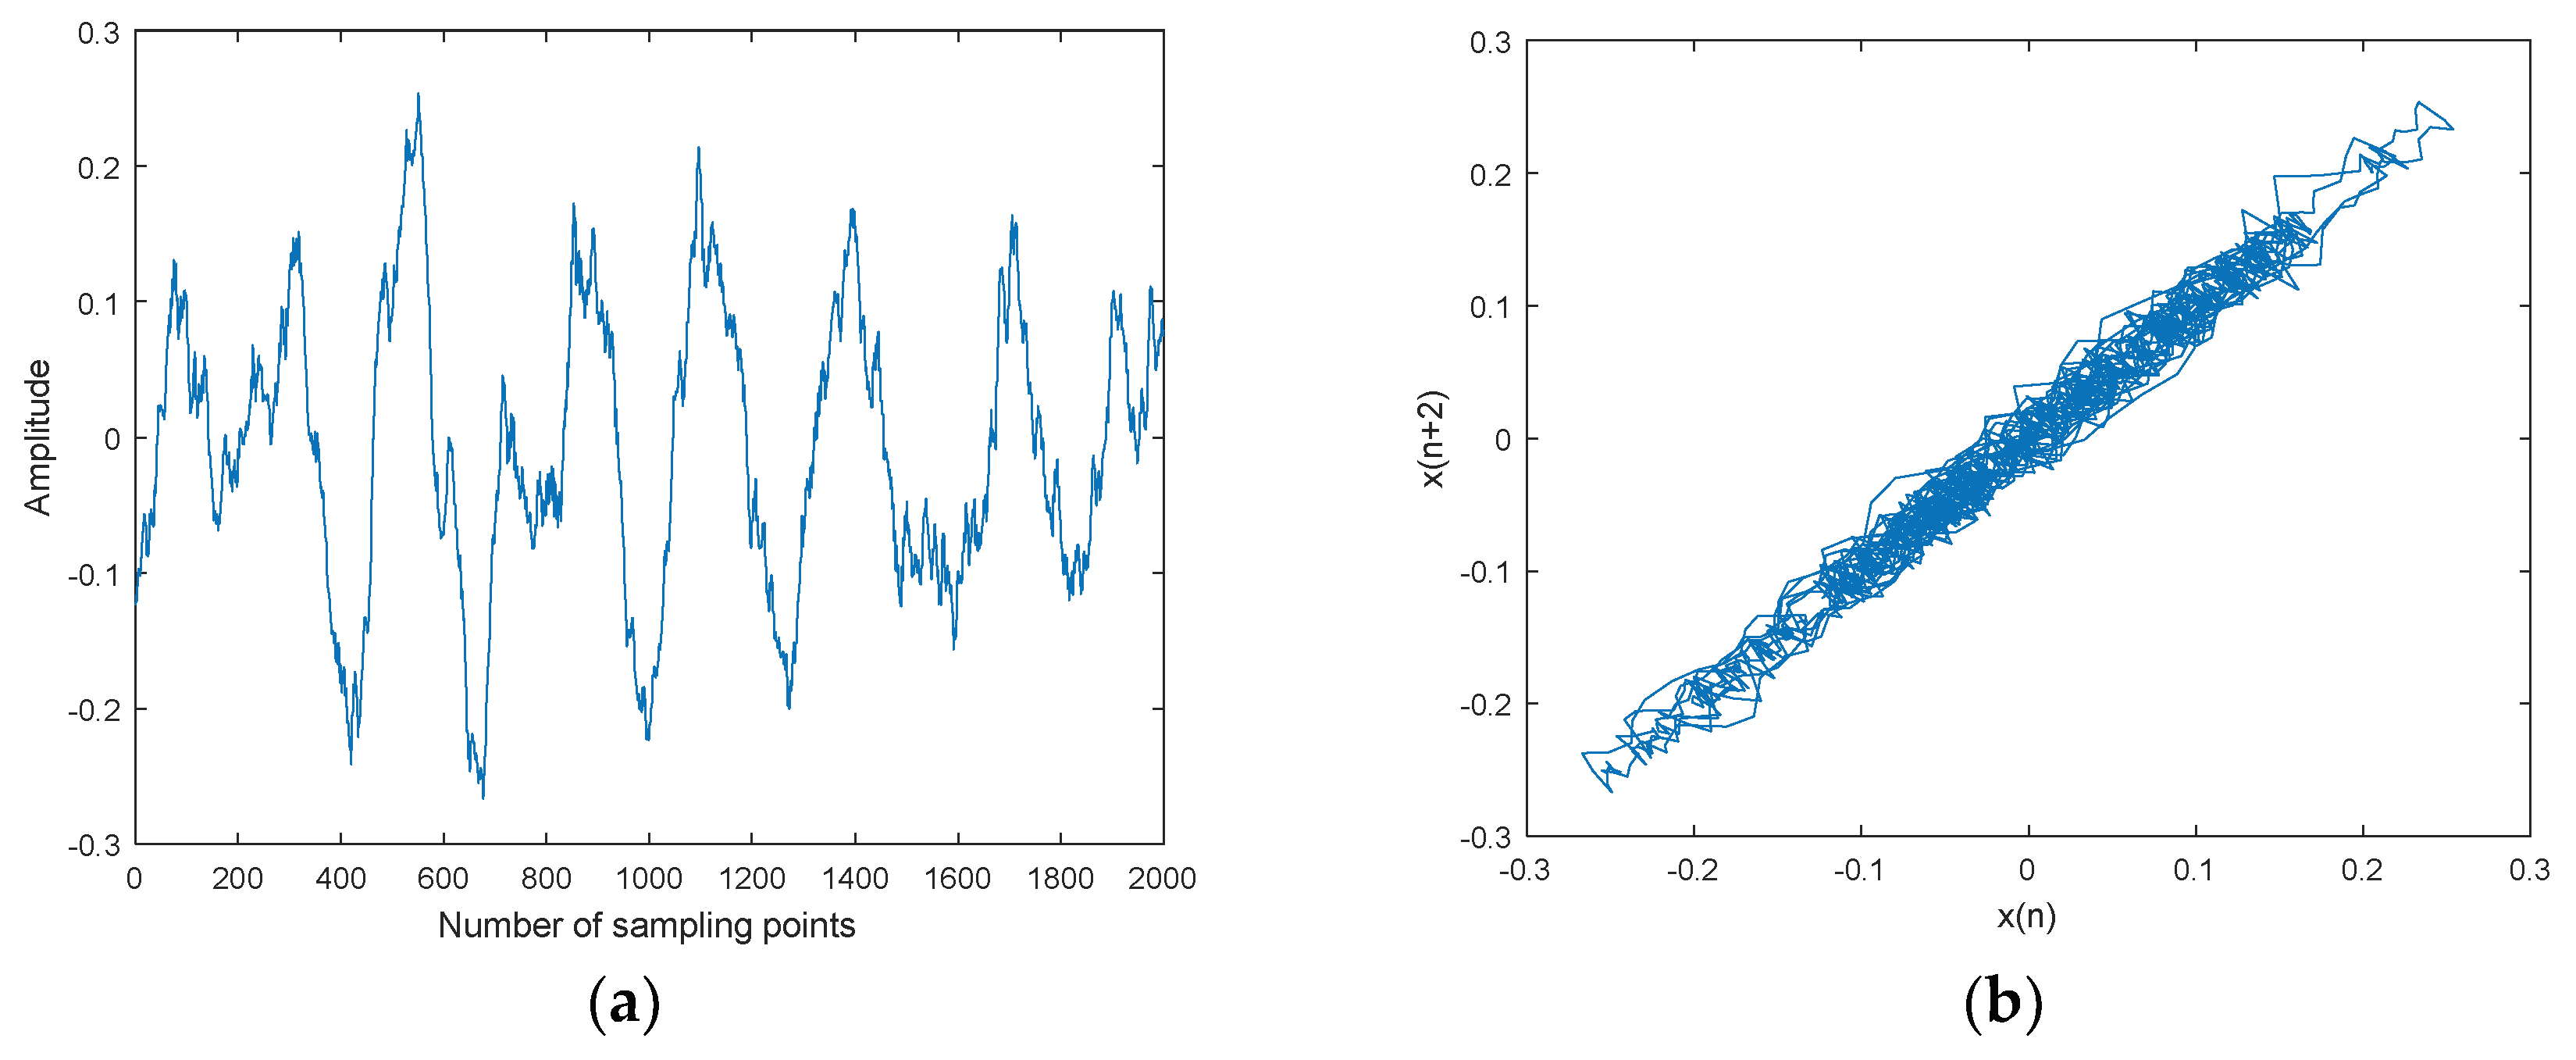
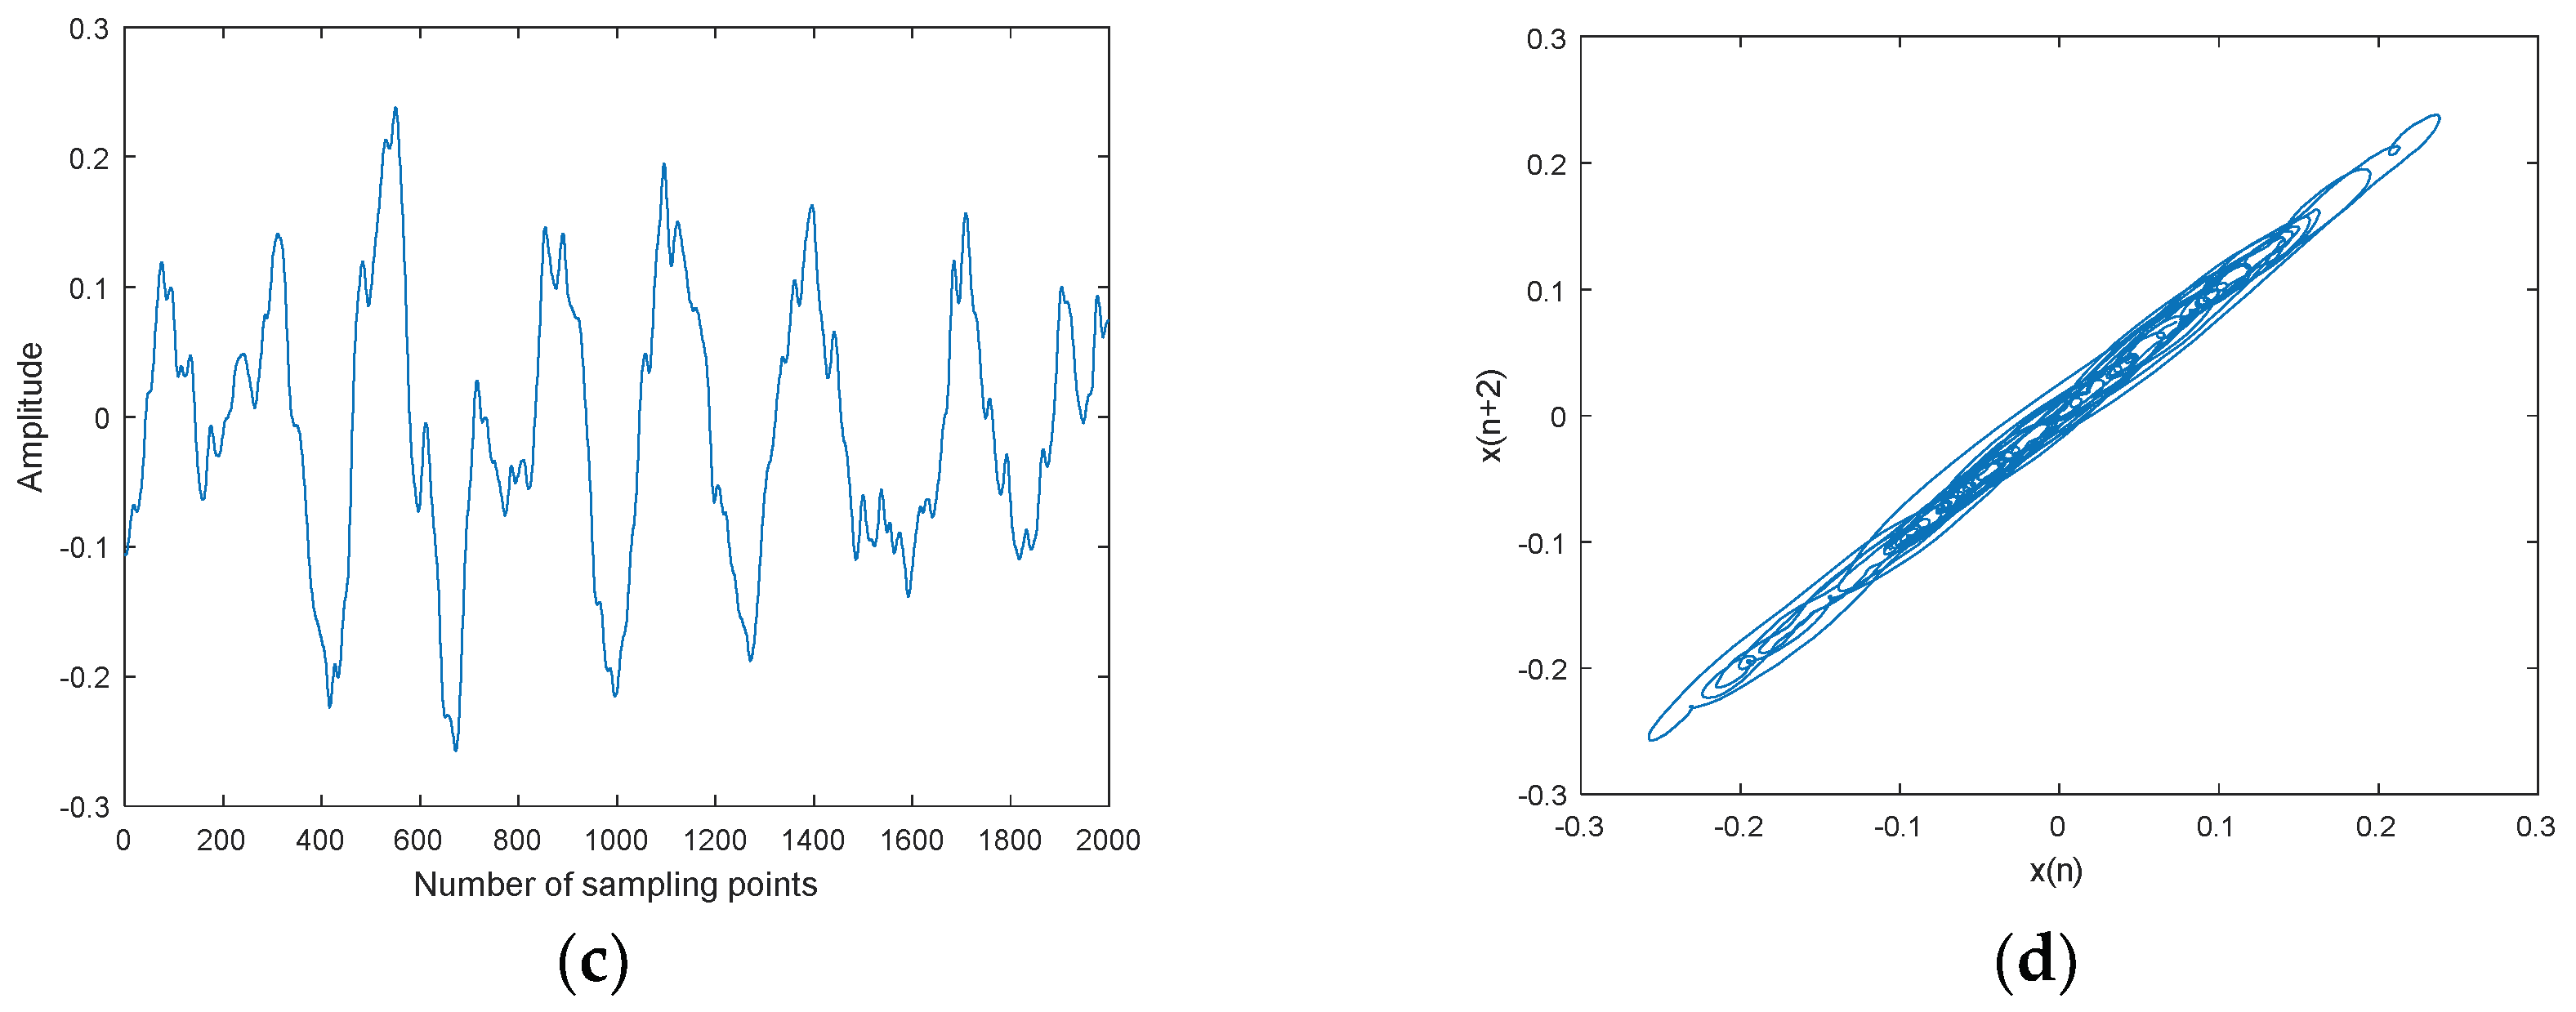
Lorenz noisy and denoised signals with different SNRs and their chaotic attractor trajectories are shown in Figure 10. As shown in Figure 10, denoised Lorenz signals and their chaotic attractor trajectories by CEEMDAN-MI-PE are close to Lorenz signal and its attractor trajectory, the denoised chaotic attractor trajectories are more smooth and regular.
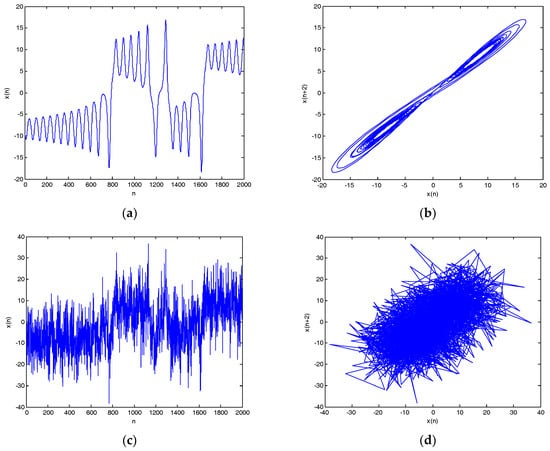
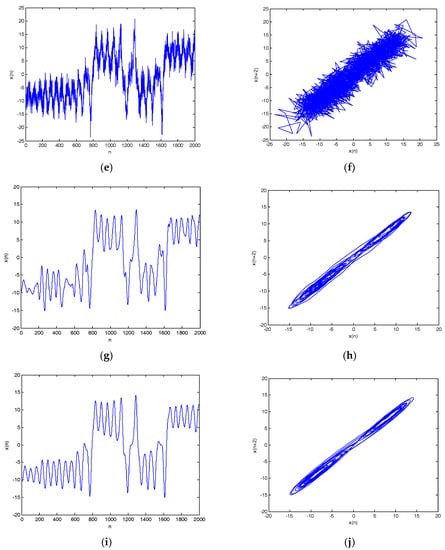
Figure 10.
Lorenz noisy and denoised signals with different SNRs and their attractor trajectories. (a) Lorenz signal, (b) Lorenz attractor trajectory, (c) Lorenz noisy signal with 0 dB, (d) Noisy attractor trajectory with 0 dB, (e) Lorenz noisy signal with 10 dB, (f) noisy attractor trajectory with 10 dB, (g) denoised Lorenz signal with 0 dB, (h) denoised attractor trajectory (0 dB), (i) denoised Lorenz signal with 10 dB, and(j) denoised attractor trajectory (10 dB).
Denoising results of different SNR by CEEMDAN-MI-PE are shown in Table 8. As shown in Table 8, the SNR and RMSE are improved evidently, the proposed denoising method enhances the SNR more than 10 dB. Overall, the above results show that the CEEMDAN-MI-PE method is suitable for chaotic signals.
Table 8.
Denoising results of different signal-to-noise ratio (SNR).
6. Denoising for Underwater Acoustic Signal
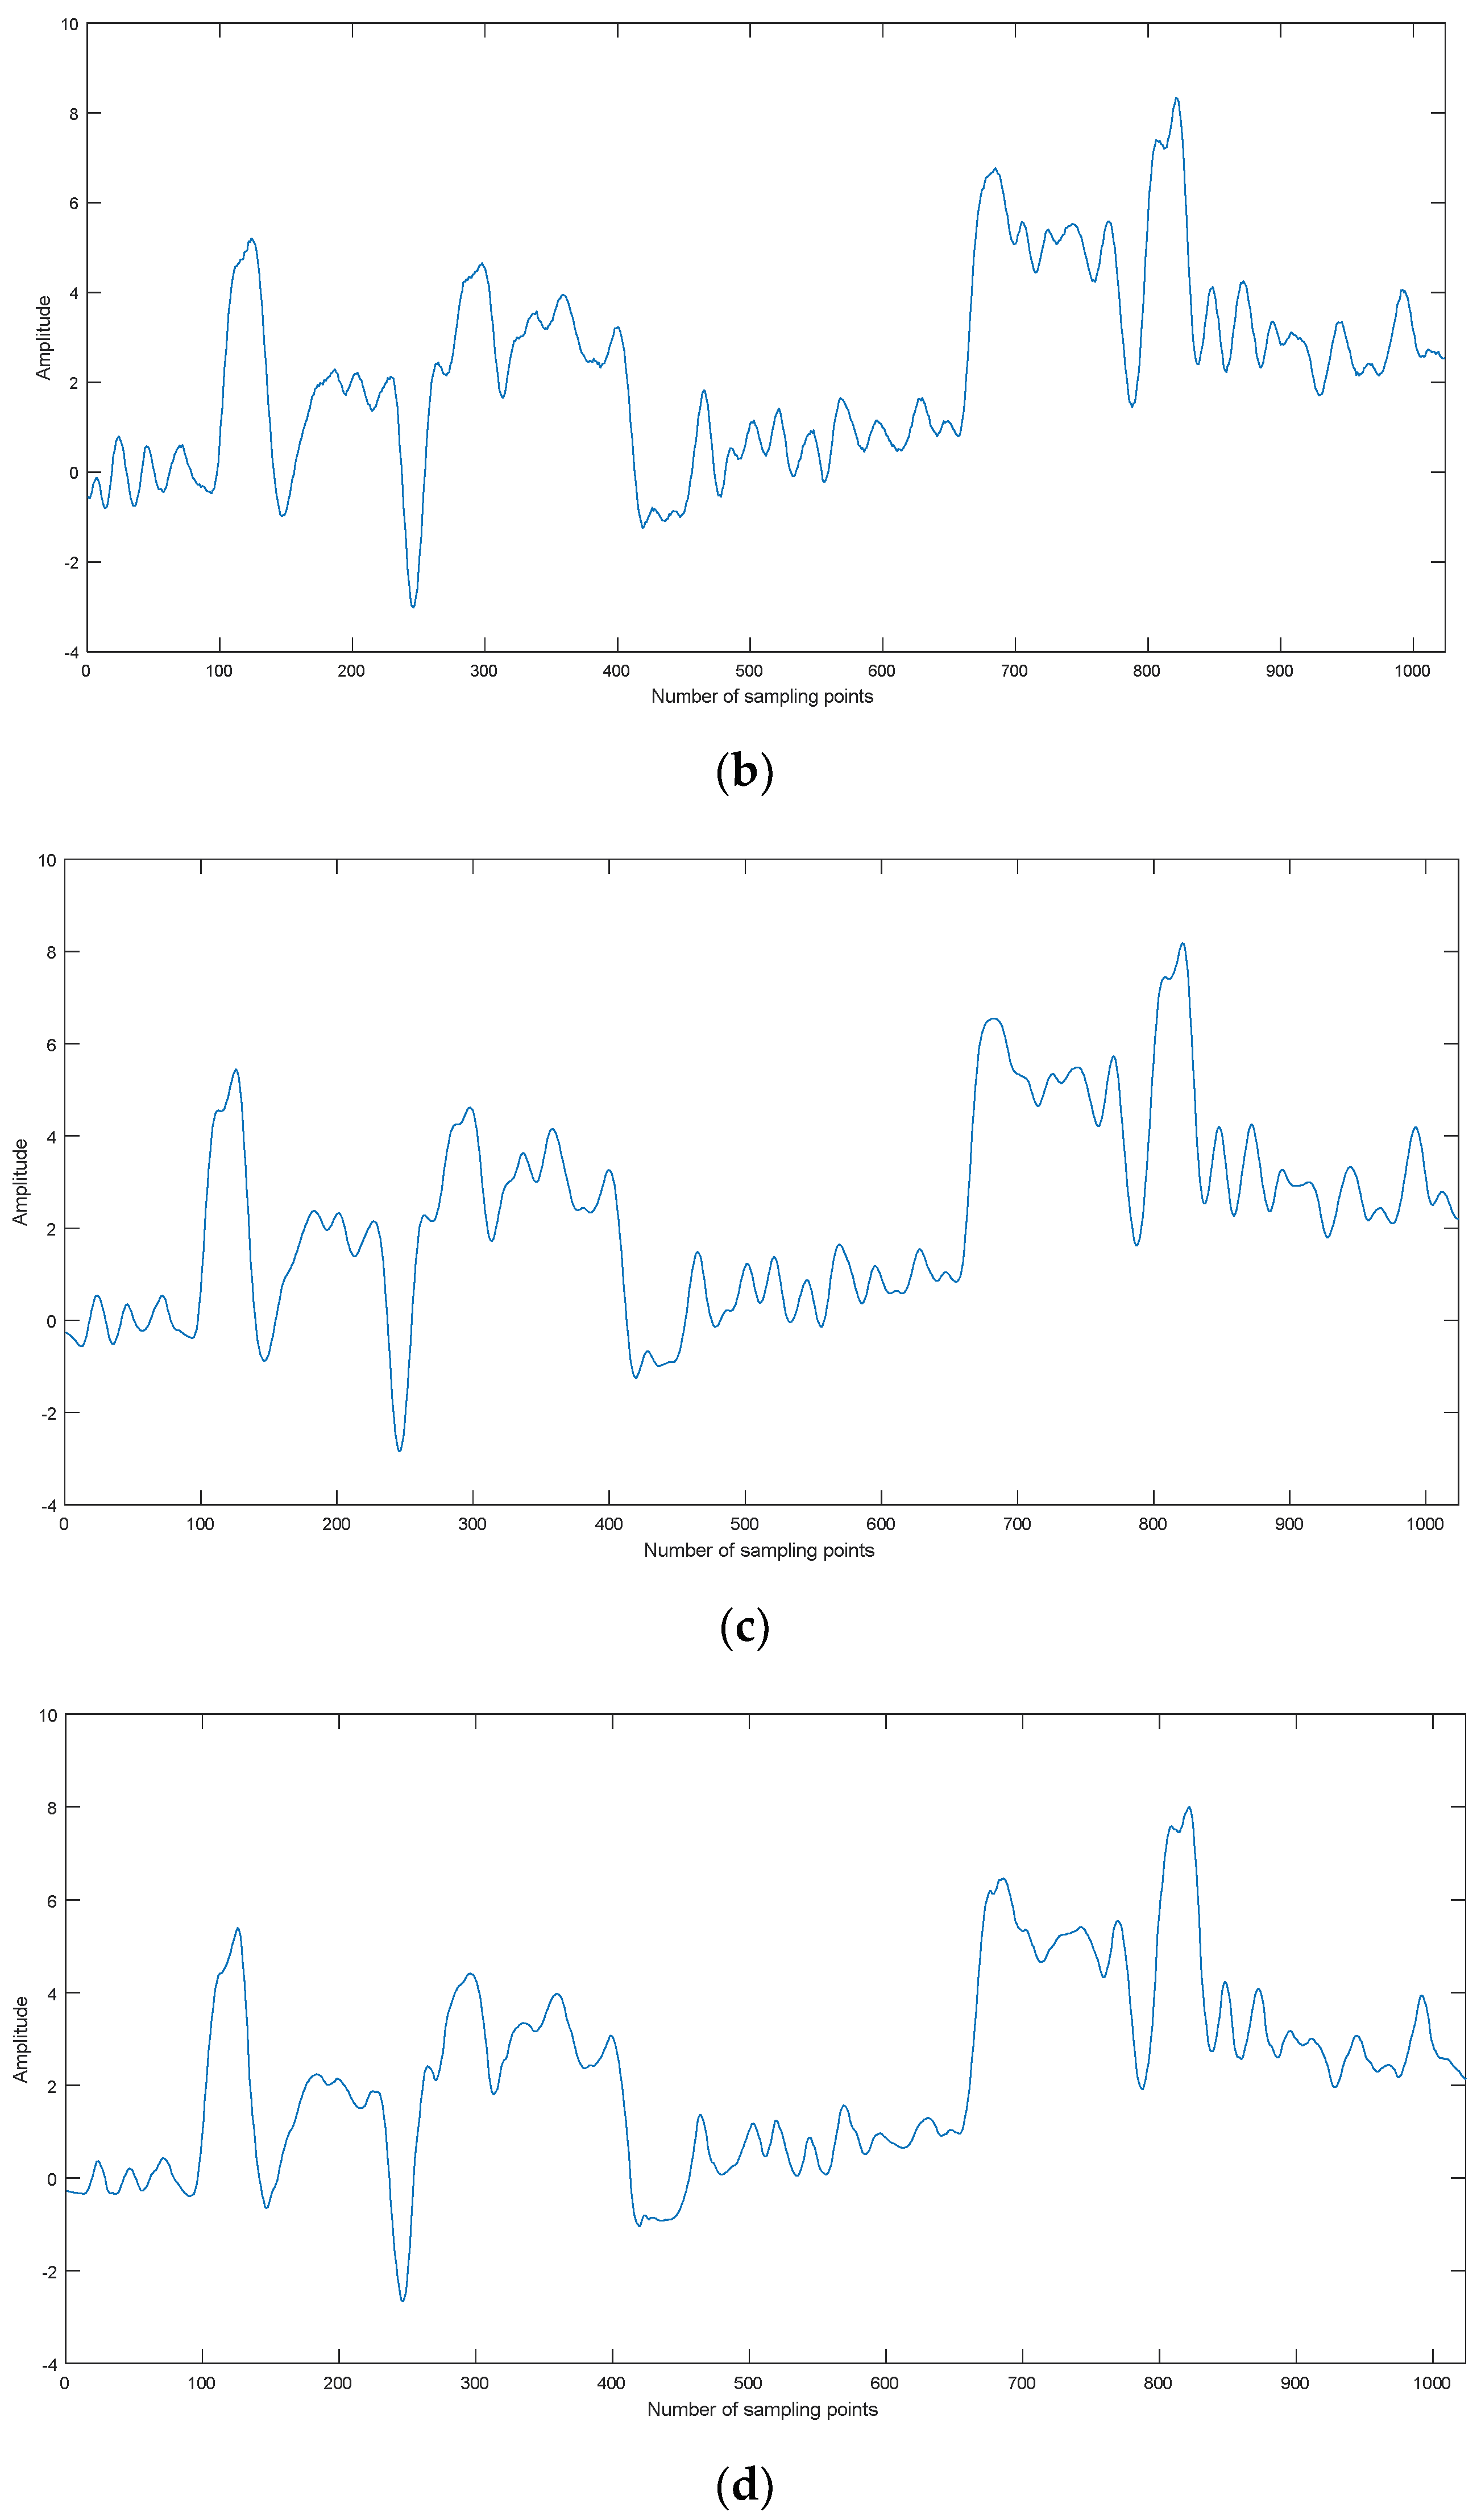
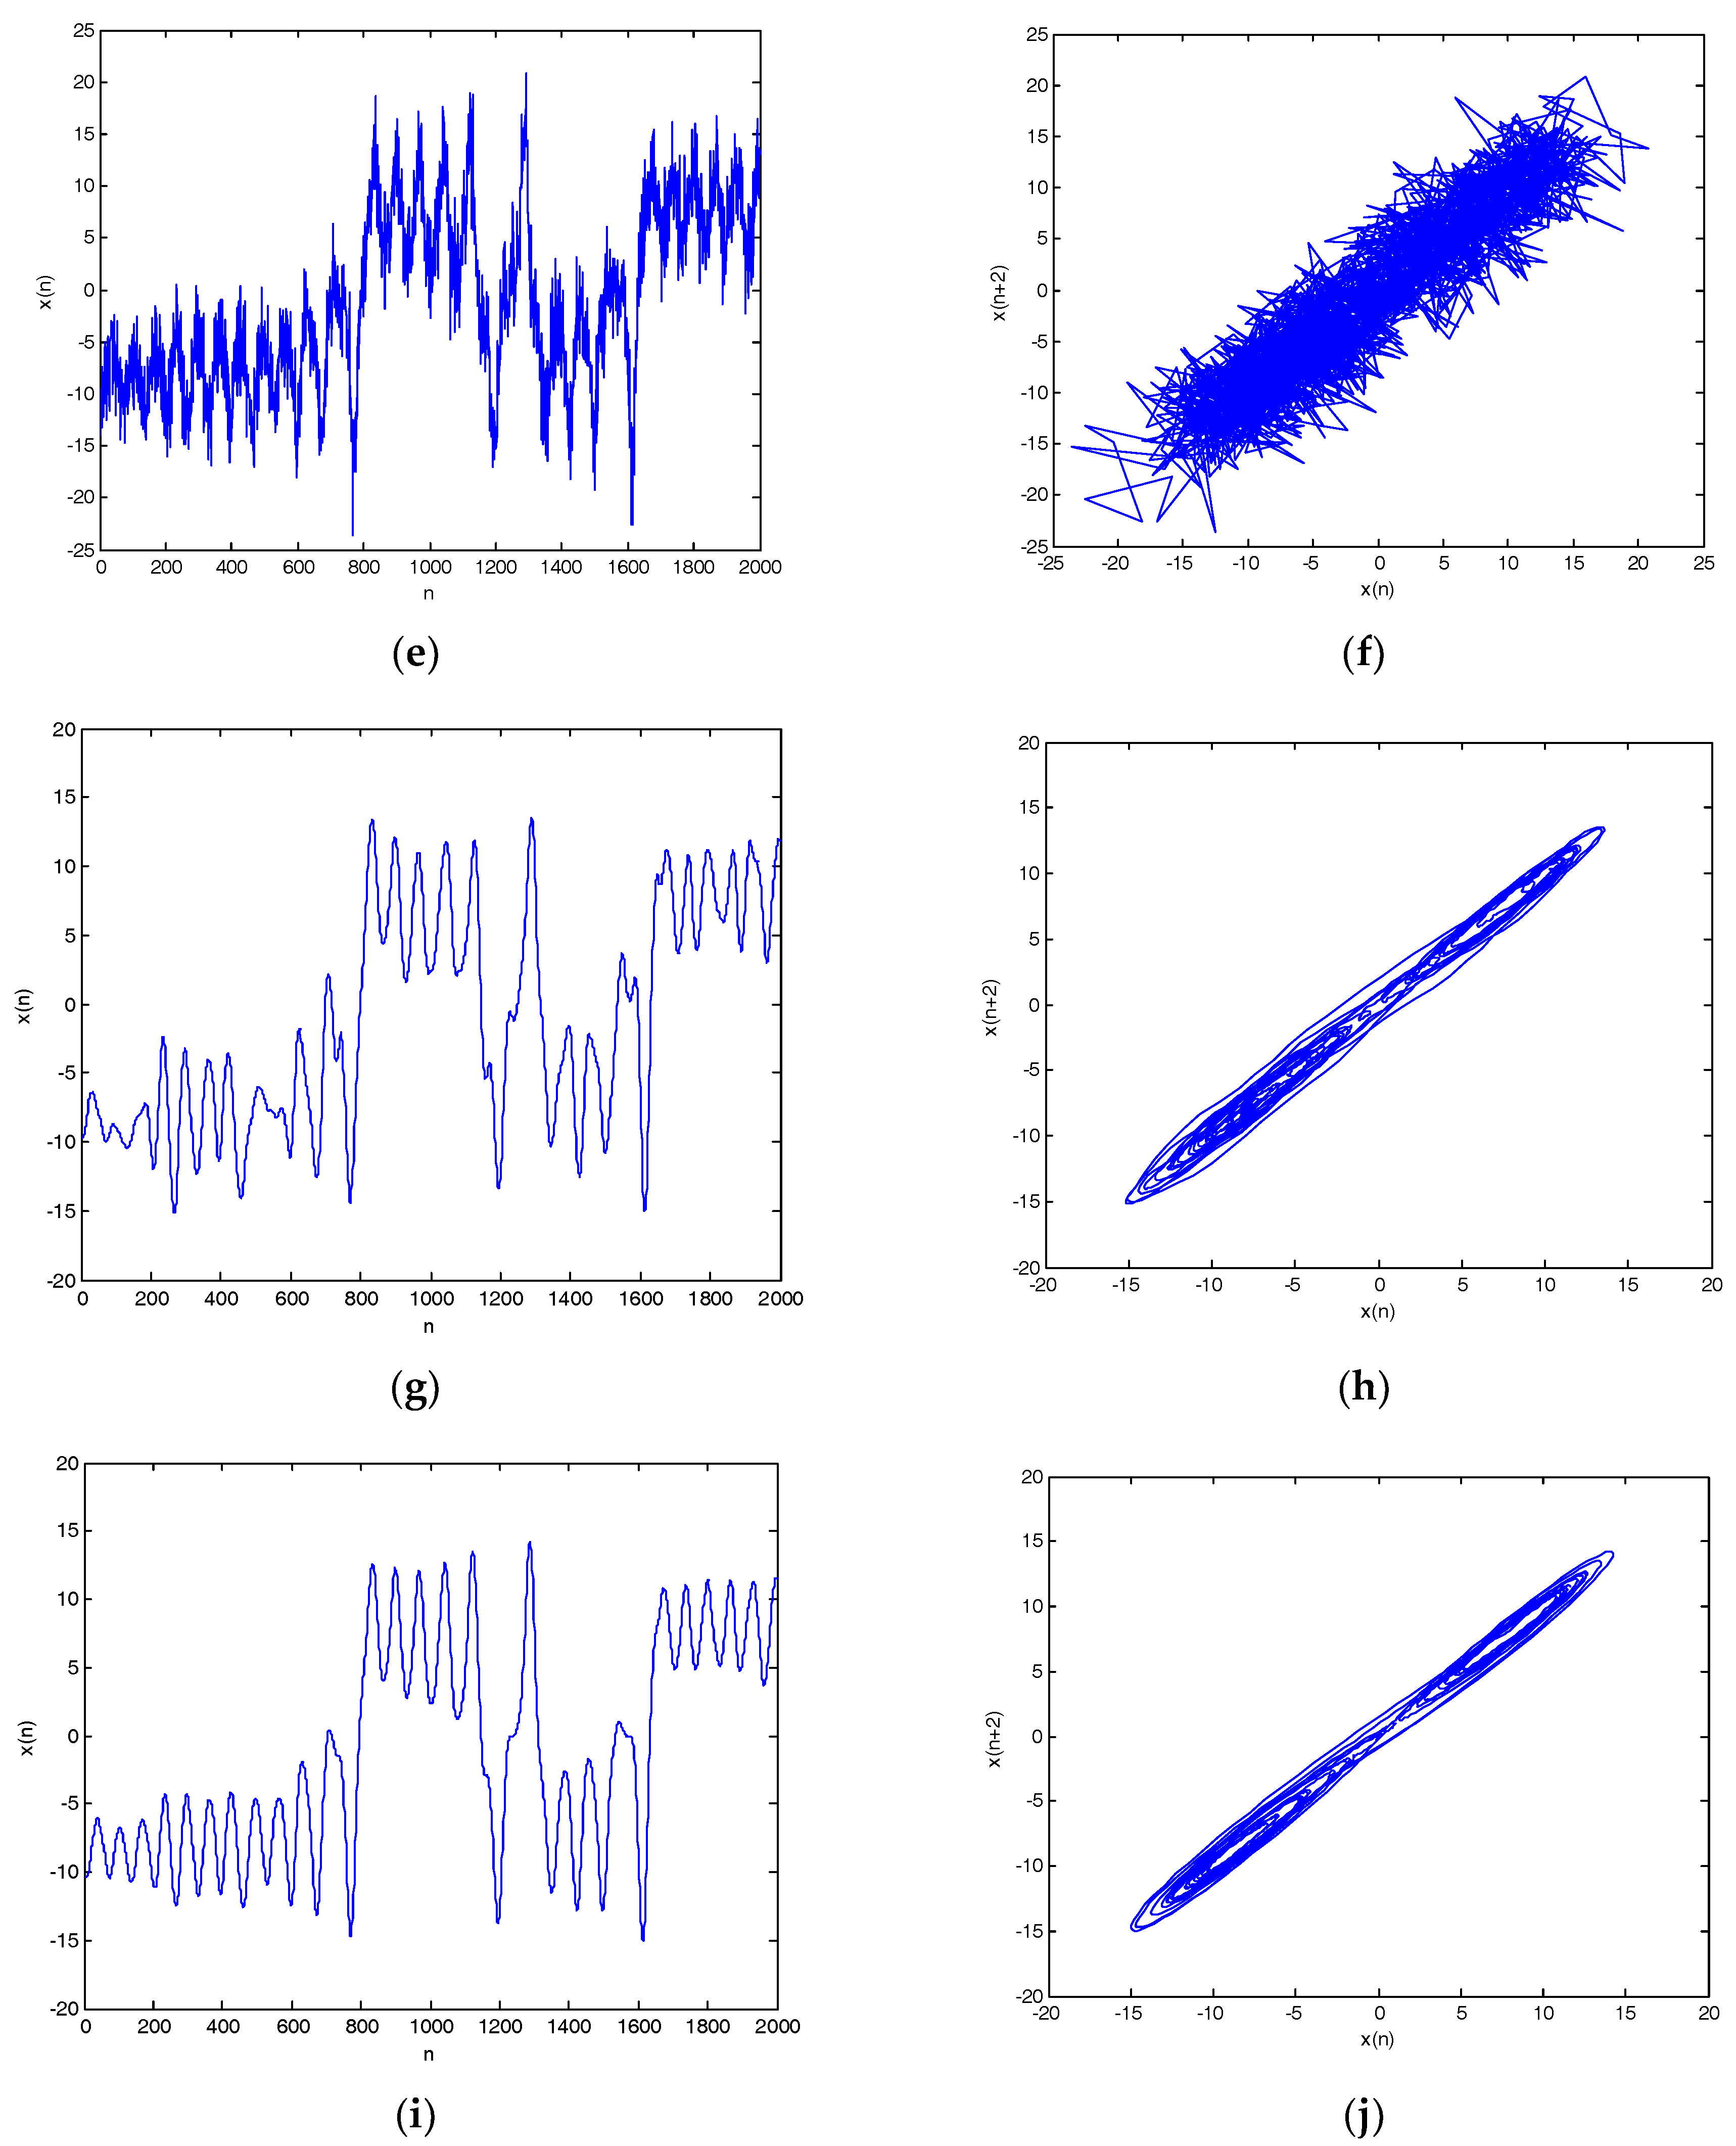
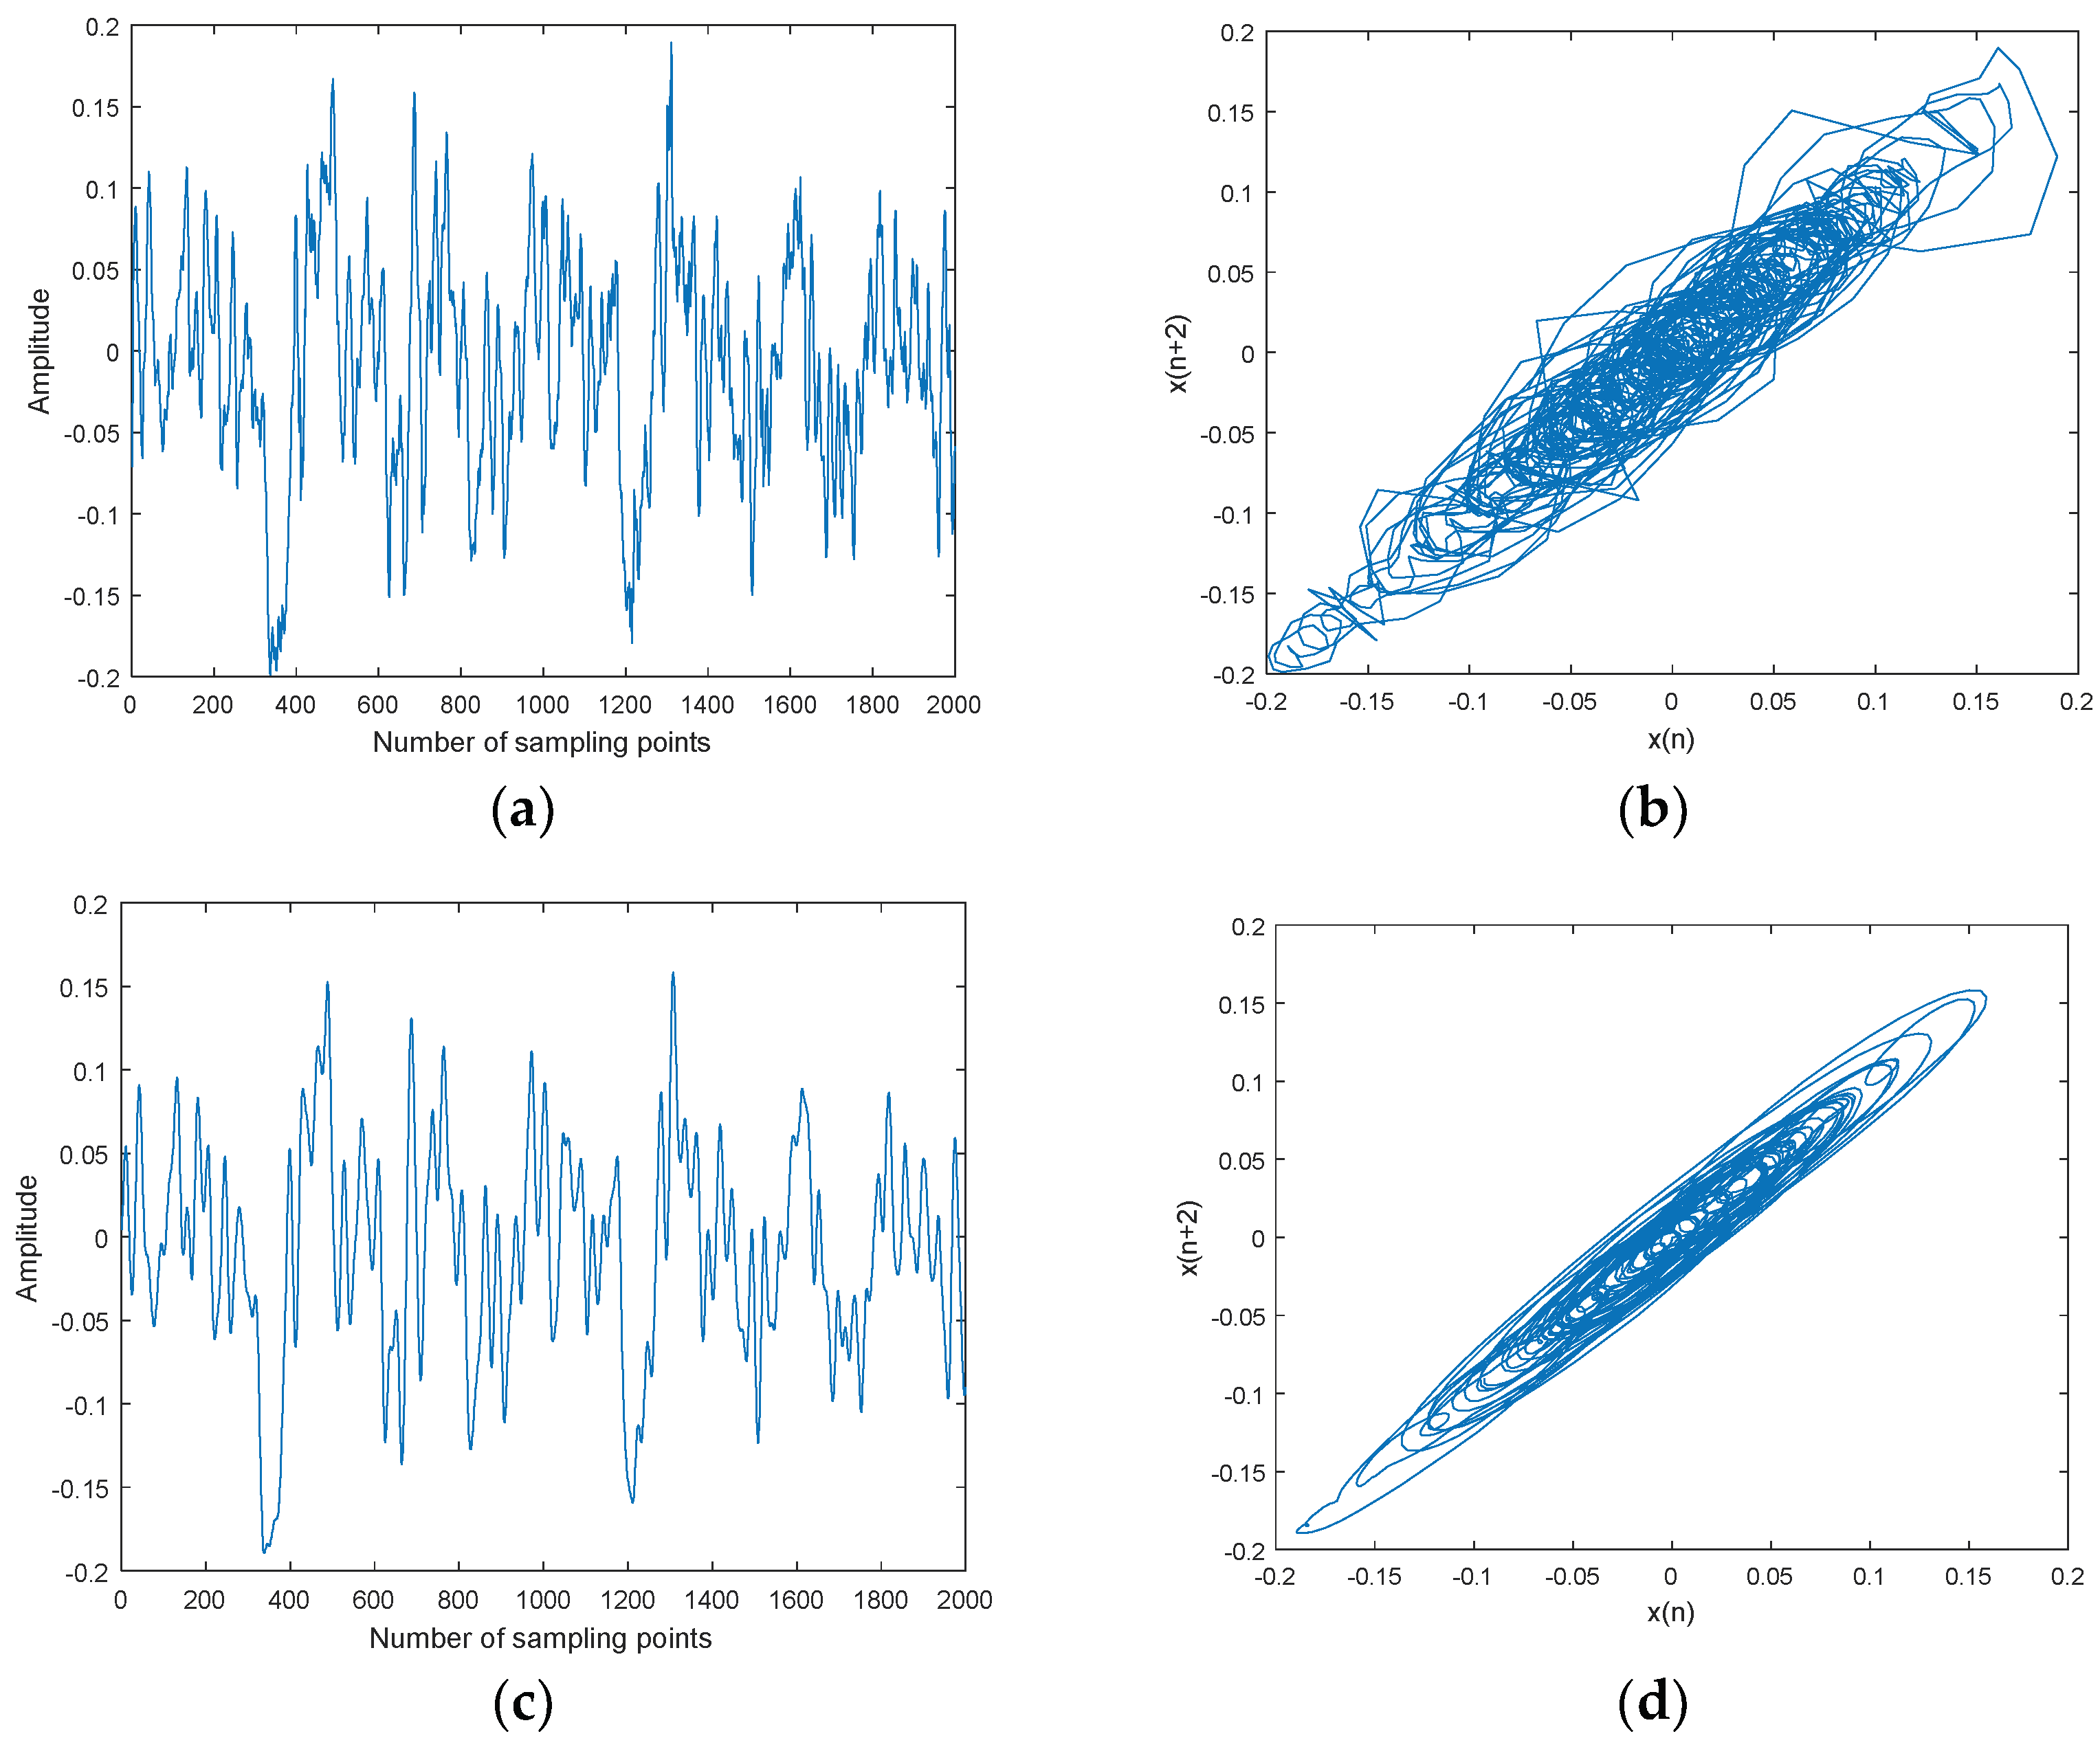
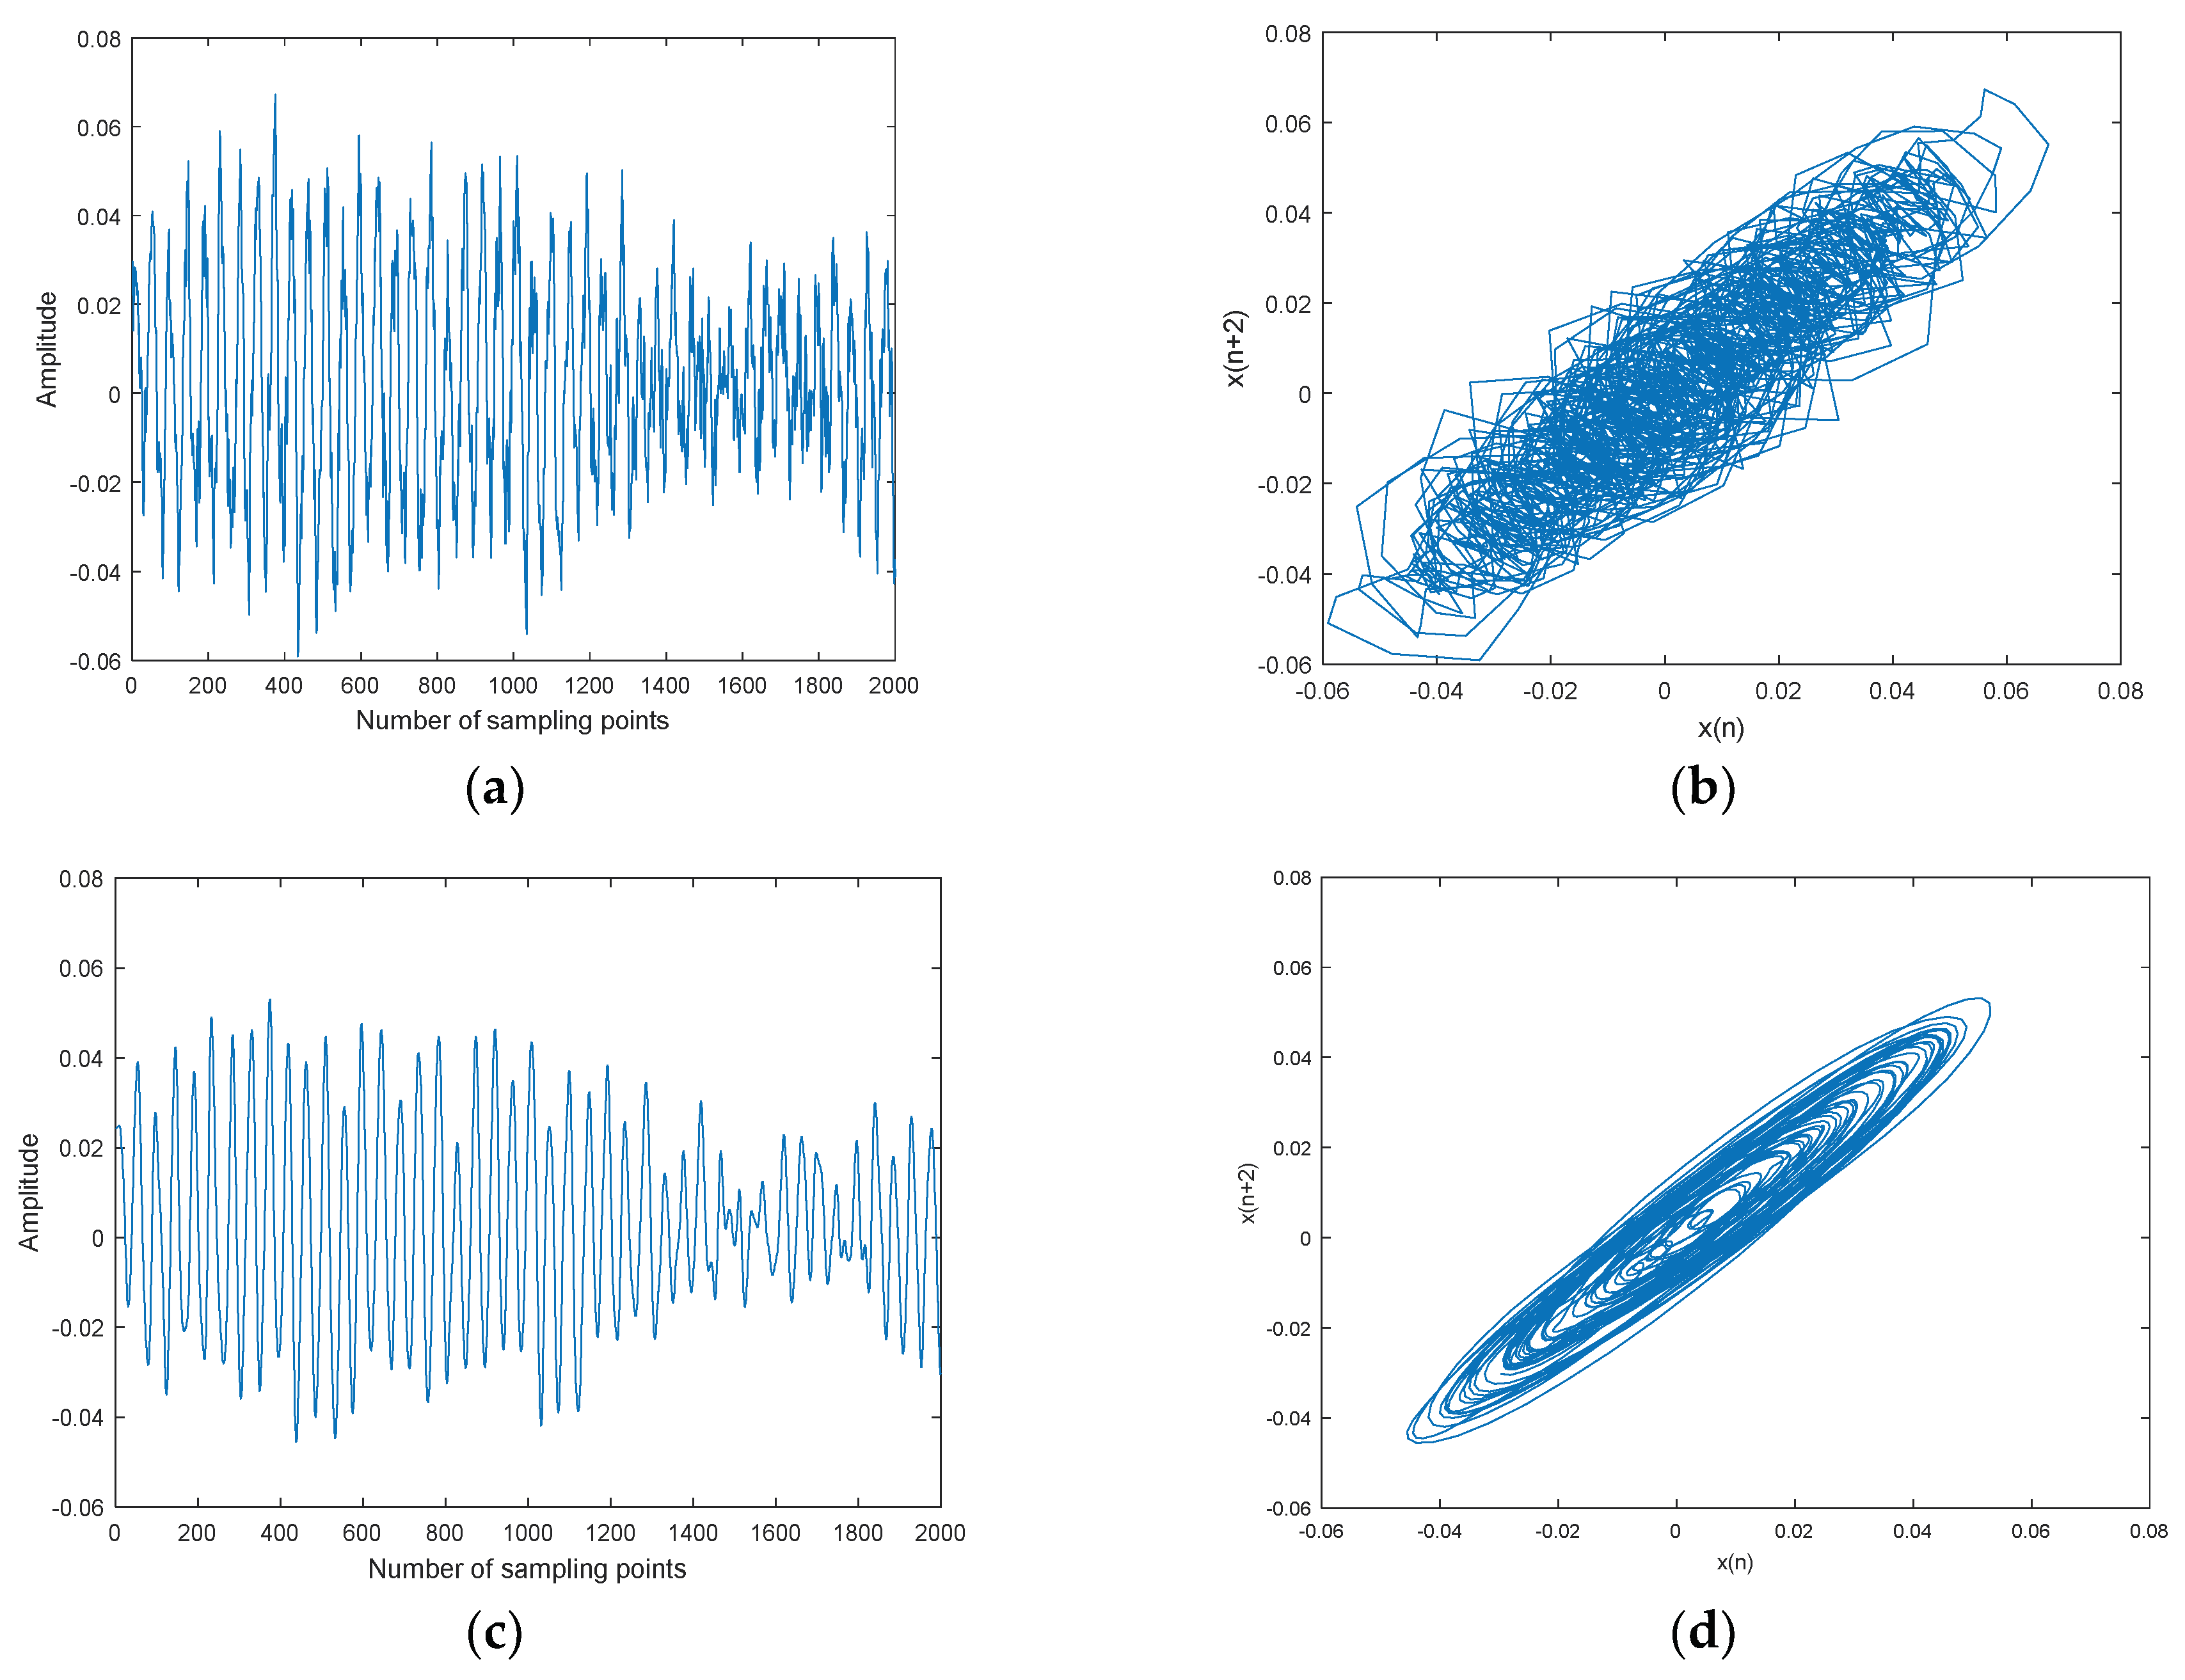
The CEEMDAN-MI-PE denoising is applied to three kinds of underwater acoustic signals, namely ship-1, ship-2, and ship-3. Three kinds of ship signals were recorded by calibratedomnidirectional hydrophones at a depth of 29 m in the South China Sea. During recording, there wereno observed disturbances from biological or man-made sources. The distance between the ship andhydrophone was about 1 km. The sampling frequency was set as 44.1 kHz. Ship signals and denoised ship signals and their attractor trajectories are shown in Figure 11, Figure 12 and Figure 13. As shown in Figure 11, Figure 12 and Figure 13, ocean background noiseis included in original ship signal, high frequency noise is removed effectively by CEEMDAN-MI-PE, denoised attractor trajectories of ship signals are more regular than original ones.
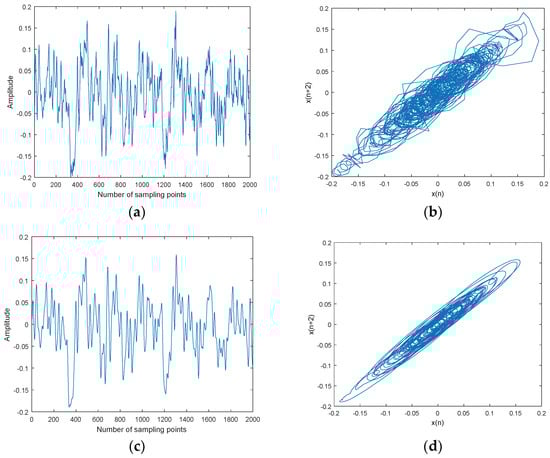
Figure 11.
Ship-1 and denoised Ship-1 signals and their attractor trajectories. (a) Ship-1, (b) attractor trajectory for ship-1, (c) denoised Ship-1, and (d) attractor trajectory for denoised ship-1.
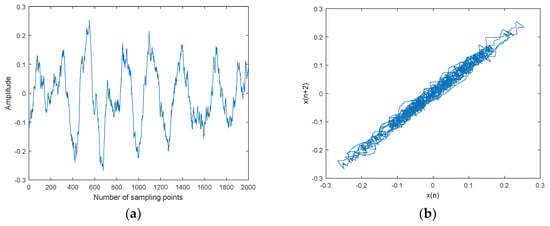
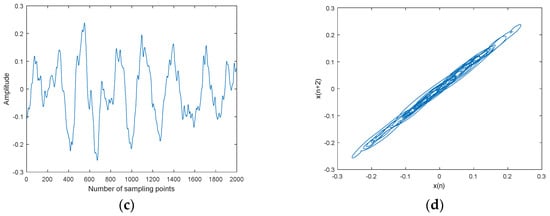
Figure 12.
Ship-2 and denoised Ship-2 signals and their attractor trajectories. (a) Ship-2, (b) attractor trajectory for ship-2, (c) denoised Ship-2, (d) attractor trajectory for denoised ship-2.
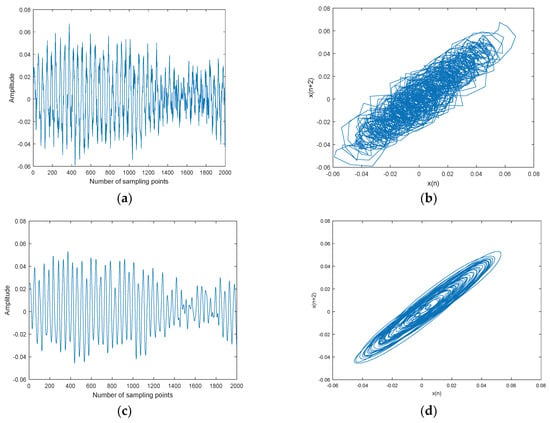
Figure 13.
Ship-3 and denoised Ship-3 signals and their attractor trajectories. (a) Ship-3, (b) attractor trajectory for ship-3, (c) denoised Ship-3, (d) attractor trajectory for denoised ship-3.
Denoising results of different ships by CEEMDAN-MI-PE are shown in Table 9. Two kinds of PE were used to evaluate the effect of denoising. PE can represent the complexity of time series. A new PE (NPE) was proposed in a previous paper [32], and is interpreted as the distance to noise, which shows a reverse trend to PE. As shown in Table 9, the PE after denoising is less than the one before denoising, which means that the complexity is reduced by denoising; the NPE after denoising is more than the one before denoising, which means that the distance to noise is increased by denoising. In summary, the above results show that the CEEMDAN-MI-PE method is effective and suitable for underwater acoustic signals.
Table 9.
Denoising results of different ships by CEEMDAN-MI-PE.
7. Conclusions
To improve the denoising effect of underwater acoustic signal, a new denoising method is proposed based on CEEMDAN, MI, PE, and WSTD. CEEMDAN is used to decompose noisy signal into IMFs, noise IMFs, and noise-dominant IMFs which can be identified by MI and PE, WSTD is used for denoising noise-dominant IMFs. The innovations and conclusions of the proposed denoising method are as follows:
- (1)
- CEEMDAN, as an adaptive decomposition algorithm, is introduced for underwater acoustic signal denoising.
- (2)
- Compared with existing denoising methods, IMFs by CEEMDAN are divided into three parts (noise IMFs, noise-dominant IMFs, and real IMFs) for the first time.
- (3)
- Four kinds of signals (Blocks, Bumps, Doppler, and Heavysine) with different SNRs are denoised by EMD-MI, EEMD-MI, CEEMDAN-MI, CEEMDAN-MI-PE, and WSTD, the proposed denoising method has lower RMSE and higher SNR, which has a better performance.
- (4)
- For chaotic signals with different SNR and underwater acoustic signals, the CEEMDAN-MI-PE is also an effective denoising method, which is beneficial to the subsequent processing of underwater acoustic signals.
Author Contributions
Y.L. and Y.L. conceived and designed the research; Y.L. and X.C. performed the experiments; J.Y. and H.Y. analyzed the data; Y.L. and L.W. wrote the manuscript.
Funding
This work was supported by Natural Science Foundation of China (No. 51709228 and No. 11574250).
Conflicts of Interest
The authors declare no conflict of interest.
References
- Li, Y.X.; Li, Y.A.; Chen, Z.; Chen, X. Feature extraction of ship-radiated noise based on permutation entropy of the intrinsic mode function with the highest energy. Entropy 2016, 18, 393. [Google Scholar] [CrossRef]
- Tucker, J.D.; Azimi-Sadjadi, M.R. Coherence-based underwater target detection from multiple disparatesonar platforms. IEEE J. Ocean Eng. 2011, 36, 37–51. [Google Scholar] [CrossRef]
- Li, Y.; Li, Y.; Chen, X.; Yu, J. A novel feature extraction method for ship-radiated noise based on variational mode decomposition and multi-scale permutation entropy. Entropy 2017, 19, 342. [Google Scholar]
- Wang, S.G.; Zeng, X.Y. Robust underwater noise targets classification using auditory inspired time-frequency analysis. Appl. Acoust. 2014, 78, 68–76. [Google Scholar] [CrossRef]
- Huang, N.E.; Shen, Z.; Long, S.R.; Wu, M.C.; Shi, H.H.; Zheng, Q.A.; Yen, N.; Tung, C.C.; Liu, H.H. The empirical mode decomposition and the Hilbert spectrum for nonlinear and non-stationary time series analysis. Proc. R. Soc. Lond. 1998, 454, 903–995. [Google Scholar] [CrossRef]
- Wu, Z.; Huang, N.E. Ensemble empirical mode decomposition: A noise-assisted data analysis method. Adv. Adapt. Data Anal. 2009, 1, 1–41. [Google Scholar] [CrossRef]
- Yeh, J.R.; Shieh, J.S.; Huang, N.E. Complementary ensemble empirical mode decomposition: A novel noise enhanced data analysis method. Adv. Adapt. Data Anal. 2010, 2, 135–156. [Google Scholar] [CrossRef]
- Torres, M.E.; Colominas, M.A.; Schlotthauer, G.; Flandrin, P. A complete ensemble empirical mode decomposition with adaptive noise. In Proceedings of the 2011 IEEE International Conference on Acoustics, Speech and Signal (ICASSP), Prague, Czech Republic, 22–27 May 2011; pp. 4144–4147. [Google Scholar]
- Gao, B.; Woo, W.L.; Dlay, S.S. Single channel blind source separation using EMD-subband variable regularized sparse features. IEEE Trans. Audio Speech Lang. Process. 2011, 19, 961–976. [Google Scholar] [CrossRef]
- Bi, F.; Li, L.; Zhang, J.; Ma, T. Source identification of gasoline engine noise based on continuous wavelet transform and EEMD–Robust ICA. Appl. Acoust. 2015, 100, 34–42. [Google Scholar] [CrossRef]
- Li, N.; Yang, J.; Zhou, R.; Liang, C. Determination of knock characteristics in spark ignition engines: An approach based on ensemble empirical mode decomposition. Meas. Sci. Technol. 2016, 27, 045109. [Google Scholar] [CrossRef]
- Lee, D.H.; Ahn, J.H.; Koh, B.H. Fault detection of bearing systems through EEMD and optimization algorithm. Sensors 2017, 17, 2477. [Google Scholar] [CrossRef] [PubMed]
- Lv, Y.; Yuan, R.; Wang, T.; Li, H.; Song, G. Health degradation monitoring and early fault diagnosis of a rolling bearing based on CEEMDAN and improved MMSE. Materials 2018, 11, 1009. [Google Scholar] [CrossRef] [PubMed]
- Kuai, M.; Cheng, G.; Pang, Y.; Li, Y. Research of planetary gear fault diagnosis based on permutation entropy of CEEMDAN and ANFIS. Sensors 2018, 18, 782. [Google Scholar] [CrossRef] [PubMed]
- Queyam, A.B.; Pahuja, S.K.; Singh, D. Quantification of feto-maternal heart rate from abdominal ECG signal using empirical mode decomposition for heart rate variability analysis. Technologies 2017, 5, 68. [Google Scholar] [CrossRef]
- Sharma, R.; Pachori, R.B.; Acharya, U.R. Application of entropy measures on intrinsic mode functions for the automated identification of focal electroencephalogram signals. Entropy 2015, 17, 669–691. [Google Scholar] [CrossRef]
- Shih, M.T.; Doctor, F.; Fan, S.Z.; Jen, K.K.; Shieh, J.S. Instantaneous 3D EEG signal analysis based on empirical mode decomposition and the hilbert–huang transform applied to depth of anaesthesia. Entropy 2015, 17, 928–949. [Google Scholar] [CrossRef]
- Li, Y.; Li, Y. Feature extraction of underwater acoustic signal using mode decomposition and measuring complexity. In Proceedings of the 2018 15th International Bhurban Conference on Applied Sciences and Technology (IBCAST), Islamabad, Pakistan, 9–13 January 2018; pp. 757–763. [Google Scholar]
- An, X.; Yang, J. Denoising of hydropower unit vibration signal based on variational mode decomposition and approximate entropy. Trans. Inst. Meas. Control 2016, 38, 282–292. [Google Scholar] [CrossRef]
- Figlus, T.; Gnap, J.; Skrúcaný, T.; Šarkan, B.; Stoklosa, J. The use of denoising and analysis of the acoustic signal entropy in diagnosing engine valve clearance. Entropy 2016, 18, 253. [Google Scholar] [CrossRef]
- Bai, L.; Han, Z.; Li, Y.; Ning, S. A hybrid de-noising algorithm for the gear transmission system based on CEEMDAN-PE-TFPF. Entropy 2018, 20, 361. [Google Scholar] [CrossRef]
- Xu, Y.; Luo, M.; Li, T.; Song, G. ECG signal de-noising and baseline wander correction based on CEEMDAN and wavelet threshold. Sensors 2017, 17, 2754. [Google Scholar] [CrossRef] [PubMed]
- Zhan, L.; Li, C. A comparative study of empirical mode decomposition-based filtering for impact signal. Entropy 2017, 19, 13. [Google Scholar] [CrossRef]
- Li, C.; Zhan, L.; Shen, L. Friction signal denoising using complete ensemble EMD with adaptive noise and mutual information. Entropy 2015, 17, 5965–5979. [Google Scholar] [CrossRef]
- Li, Y.; Li, Y.; Chen, X.; Yu, J. Denoising and feature extraction algorithms using npe combined with vmd and their applications in ship-radiated noise. Symmetry 2017, 9, 256. [Google Scholar] [CrossRef]
- Li, Y.; Li, Y.; Chen, X.; Yu, J. Research on ship-radiated noise denoising using secondary variational mode decomposition and correlation coefficient. Sensors 2018, 18, 48. [Google Scholar]
- Kvålseth, T.O. On normalized mutual information: measure derivations and properties. Entropy 2017, 19, 631. [Google Scholar] [CrossRef]
- Zanin, M.; Gómez-Andrés, D.; Pulido-Valdeolivas, I.; Martín-Gonzalo, J.A.; López-López, J.; Pascual-Pascual, S.I.; Rausell, E. Characterizing normal and pathological gait through permutation entropy. Entropy 2018, 20, 77. [Google Scholar] [CrossRef]
- Gao, Y.; Villecco, F.; Li, M.; Song, W. Multi-Scale permutation entropy based on improved LMD and HMM for rolling bearing diagnosis. Entropy 2017, 19, 176. [Google Scholar] [CrossRef]
- Bandt, C.; Pompe, B. Permutation entropy: A natural complexity measure for time series. Phys. Rev. Lett. 2002, 88, 174102. [Google Scholar] [CrossRef] [PubMed]
- Wang, X.; Xu, J.; Zhao, Y. Wavelet based denoising for the estimation of the state of charge for lithium-ion batteries. Energies 2018, 11, 1144. [Google Scholar] [CrossRef]
- Bandt, C. A new kind of permutation entropy used to classify sleep stages from invisible EEG microstructure. Entropy 2017, 19, 197. [Google Scholar] [CrossRef]
© 2018 by the authors. Licensee MDPI, Basel, Switzerland. This article is an open access article distributed under the terms and conditions of the Creative Commons Attribution (CC BY) license (http://creativecommons.org/licenses/by/4.0/).