Article

Effect of Time and Temperature on Physicochemical and Microbiological Properties of Sous Vide Chicken Breast Fillets

by
Hossein Haghighi
1,*,†,
Anna Maria Belmonte
1,†,
Francesca Masino
1,2,
Giovanna Minelli
1,2,
Domenico Pietro Lo Fiego
1,2 and
Andrea Pulvirenti
1,2
1
Department of Life Sciences, University of Modena and Reggio Emilia, 42122 Reggio Emilia, Italy
2
Interdepartmental Research Centre BIOGEST-SITEIA, University of Modena and Reggio Emilia, 42124 Reggio Emilia, Italy
*
Author to whom correspondence should be addressed.
Share first authorship.
Appl. Sci. 2021, 11(7), 3189; https://doi.org/10.3390/app11073189
Submission received: 25 February 2021 / Revised: 25 March 2021 / Accepted: 30 March 2021 / Published: 2 April 2021

Abstract

:
Temperature and time are two critical parameters in sous vide cooking which directly affect eating quality characteristics and food safety. This study aimed to evaluate physicochemical and microbiological properties of sous vide chicken breast fillets cooked at twelve different combinations of temperature (60, 70, and 80 °C) and time (60, 90, 120, and 150 min). The results showed that cooking temperature played a major role in the moisture content, cooking loss, pH, a* color value, shear force, and thiobarbituric acid reactive substances (TBARS). Increasing cooking temperature caused an increase in cooking loss, lipid oxidation, TBARS, and pH, while moisture content was reduced (p < 0.05). Cooking time played a minor role and only moisture content, cooking loss, and a* color value were affected by this parameter (p < 0.05). Total mesophilic aerobic bacteria, Psychrotrophic bacteria, and Enterobacteriaceae were not detected during 21 days of storage at 4 °C. Cooking at 60 °C for 60 min showed the optimum combination of temperature and time for sous vide cooked chicken breast fillets. The result of this study could be interesting for catering, restaurants, ready-to-eat industries, and homes to select the optimum combination of temperature and time for improving the eating quality characteristics and ensuring microbiological safety.

Graphical Abstract

1. Introduction

Meat plays a key role in human nutrition and evolution thanks to its components, including proteins and essential micronutrients such as Zn, Se, Fe, vitamin A, vitamin B12, and folate [1,2]. Most often, raw meat is subjected to various cooking methods such as boiling in water, grilling, steaming, microwave radiation, and sous vide to enhance its digestibility, sensory characteristic, and to improve its hygienic quality [3,4,5]. In each type of cooking method, several changes occur as a consequence of heating, such as denaturation, aggregation, and degradation of proteins, fiber shrinkage, and collagen solubilization [5,6,7]. The bio-accessibility of nutrients also can be affected during the cooking process mainly due to the degradation of vitamins, amino acids, and minerals [8]. Therefore, selecting an appropriate cooking method is a critical step before consumption which directly affects physicochemical, textural, and microbiological properties. Among different cooking methods, sous vide cooking has received considerable attention from catering, restaurants, ready-to-eat industries, and homes [9,10]. This technique provides more efficient heat transfer from water to food compared to other cooking methods [11], resulting improvement in eating quality characteristics such as texture, tenderness, juiciness, color, flavor, and also provides high nutritional value [6,12,13]. Besides, this technique is simple to apply for cooking different kinds of food (e.g., meat, cereals, legumes, etc.) [14]. The term “sous vide” is a French word that refers to the uniform cooking of food inside the food grade and heat-stable vacuumed pouches incubated in a circulating water bath with monitored conditions of temperature and time followed by chilled storage [15,16]. Sous vide cooking has been reported to enhance the quality attributes, inhibiting off-flavors from lipid oxidation, reducing aerobic bacteria and the risk of post-cooking contamination during storage [9,17,18,19]. Besides, it is beneficial for preserving vitamins, antioxidant compounds, essential amino acids, and unsaturated fatty acids during solubilization, volatilization, and high-temperature application [11,15].
Selecting the right temperature and time combinations plays an important role in sous vide cooking to reduce the risk of overcooking, loss of volatile compounds, and heat-sensitive nutrients [8]. In this context, the effect of cooking temperature and time in sous vide has been reported on the physicochemical properties and eating quality of pork [20,21,22,23], lamb [7], beef [24,25], turkey [26,27], and chicken [28,29,30]. Sánchez del Pulgar et al. [23] found that sous vide pork cheeks cooked at 60 °C had lower water losses, more moisture content, more lightness (L*), and redness (a*) compared to those cooked at 80 °C. Roldán et al. [7] reported that sous vide lamb loins cooked at 60 °C had the highest lightness and redness compared to those cooked at 70 and 80 °C. Besides, increasing cooking temperature caused an increase in cooking loss and a decrease in moisture content. However, the interaction between time and temperature was only effective on microstructural properties. Bıyıklı et al. [26] found that sous vide turkey cutlet cooked at 65 °C had a lower cooking loss, thiobarbituric acid reactive substances (TBARS), and pH compared to those cooked at 70 °C and 75 °C. Besides, the cooking loss, fat content, and pH were increased by increasing cooking time from 20 min to 60 min.
According to the United Nations Food and Agriculture Organization (FAO), poultry meat is the second most widely eaten meat in the world after pork. It is estimated that global poultry consumption will reach 133 million tons by 2024. This is mainly due to the high consumer demands for a healthier diet with high protein content, good amino acid composition, low levels of fat and cholesterol, as well as lower selling price [31]. Because of these features, poultry meat, including chicken breast fillets, has received much attention recently. To the best of our knowledge, literature concerning the combinations of temperature and time on physicochemical and microbiological properties of sous vide chicken breast fillets is still limited. Therefore, the focus of this research was to evaluate the effect of these parameters on eating quality characteristics such as moisture content, cooking loss, lipid oxidation, pH, shear force, color, and microbial safety of sous vide chicken breast fillets.

2. Materials and Methods

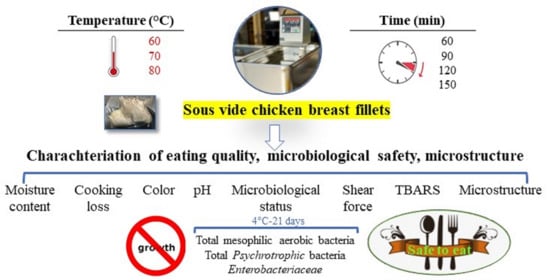
2.1. Experimental Design

Fresh skinless and boneless raw chicken breasts were purchased from the local market (Reggio Emilia, Italy) supplied by the same producer within 24 h postmortem and transported to the Department of Life Sciences, University of Modena and Reggio Emilia, Italy using a thermocol box filled with ice and used immediately. Surface fat was trimmed off and samples were cut into pieces with 125 ± 5 g weight and 2.5 ± 0.2 cm thickness. Samples were randomly assigned into the 13 groups. Twelve groups were vacuum-sealed in the food-grade nylon-polyethylene plastic pouches (150 × 200 mm2) using a vacuum sealer (La Grandispensa, Elegen, Reggio Emilia, Italy) with a pump flow rate of 30 L per minute to create 98% vacuum degree inside the pouches. Plastic pouches had wide thermal stability (−40 °C–+120 °C) with O2 permeability of 9 cm3/day m2 (4 °C/80% relative humidity), and water vapor permeability of 1.2 g/day m2 (Joelplas SL, Barcelona, Spain). As a control group, chicken breast fillets sealed in plastic pouches without a vacuum (0% vacuum degree) were boiled at 100 °C for 60 min. The samples were cooked in a sous vide cooker (Elegen, Reggio Emilia, Italy). Three independent replicate trials with two repeats based on different combinations of temperature (60, 70, and 80 °C) and time (60, 90, 120, and 150 min) were analyzed (Table 1). Overall, a total of 78 chicken breast fillets were analyzed (13 groups of samples × 3 independent replicate × 2 repeats). The sous vide chicken breast fillets were cooled in an ice bath for one hour and overnight in the fridge at 2–4 °C. Moisture content, cooking loss, pH, color, TBARS, and shear force were measured the day after the cooking process [7].

2.2. Moisture Content and Cooking Loss

The moisture content and cooking loss were determined according to the AOAC International 950.46 method [32]. The moisture content of the chicken fillets (5 g) was calculated as the percentage of weight loss to a constant weight (Md) after drying in an oven at 105 ± 2 °C and the initial weight (Mi) according to Equation (1):
Moisture content (%): (Mi-Md)/(Mi) × 100
The cooking loss was measured by the weight difference of meat samples (5 g) before (W1) and after cooking (W2) according to Equation (2):
Cooking loss (%): (W1-W2)/(W1) × 100
Moisture content and cooking loss measurements were performed in triplicate.

2.3. pH

The pH value was measured before and after cooking according to the AOAC 981.12 method [32] using a pH meter equipped with a Xerolite electrode (Crison Instrument, Allela, Spain). The pH was determined by blending a 10 g sample with 50 mL distilled water for 60 s in a homogenizer (IKA, Labortechnik, Staufen, Germany). The analysis was performed in triplicate.

2.4. Color

The color of meat samples before and after cooking was measured on the external surface of each fillet with a colorimeter (CR-400, Konica Minolta, Osaka, Japan) equipped with a standard illuminant D65 and 10° observer angle [33]. The results are reported as L* (lightness), a* (redness/greenness), and b* (yellowness/blueness). The instrument was calibrated with a white standard (L* = 99.36, a* = −0.12, b* = −0.06) before each measurement [34]. The average of six measurements at different positions was calculated.

2.5. Warner-Bratzler Shear Force (WBSF)

The WBSF was performed according to Honikel [35] with slight modification. Texture analyzer (Z1.0, Zwick/Roell, Ulm, Germany) with loading cell of 1000 N and crosshead speed 250 mm/min was used to perform shear force analysis on cooked chicken breast fillets (3 × 1.5 × 1 cm3) using a Warner-Bratzler blade [22]. The data was obtained from TestXpert® II 161 (V3.31) software (Zwick/Roell, Ulm, Germany). The maximum peak force (kg) to shear the sample was reported as a shear force. The average of five measurements was recorded.

2.6. Thiobarbituric Acid Reactive Substances (TBARS)

TBARS measurement was carried out based on Siu and Draper [36]. A total of 2.5 g of minced meat sample and 12.5 mL distilled water were homogenized at 9500 rpm for 120 s using an ultra-turrax homogenizer (IKA, Labortechnik, Staufen, Germany). The homogenized sample mixed with 12.5 mL of 10% trichloroacetic acid (TCA) (CAS Number: 76-03-09, Sigma-Aldrich, Milan, Italy) and centrifuged for 20 min at 2000 rpm at 4 °C. The supernatant was filtered by a filter paper (Whatman No. 1). A total of 4 mL of the filtrate aliquots was mixed with 1 mL of 0.06 M 2-thiobarbituric acid (TBA) (CAS Number: 504-17-6, Sigma-Aldrich, Milan, Italy) and the solution was heated in a water bath at 80 °C for 90 min. A distilled water-TCA-TBA reagent was also prepared and presented as a blank. The absorbance at 532 nm was measured in duplicate by a spectrophotometer (Jasco Corporation, Tokyo, Japan). Results were expressed as mg of malondialdehyde (MDA) equivalents/kg sample. The average of three measurements was recorded.

2.7. Microbiological Analyses

Microbiological analysis was performed during the storage at 4 °C for 21 days [20]. For each day (0, 5, 10, 15, and 21 days) of analysis, 10 g sliced chicken breast fillets were collected aseptically, and 90 mL sterile saline solution (0.9% NaCl) was added and homogenized for 2 min in a stomacher (Lab blenders Stomacher 400, Instrument Lab Control, Reggio Emilia, Italy). Appropriate dilutions were made with sterile saline solution and 1 mL was plated onto the culture media. Total mesophilic aerobic bacteria counts were determined after aerobic incubation at 30 °C for 48 h using Plate Count Agar (Biolife, Milan, Italy) in accordance with ISO 4833-1: 2013 [37]. Total Psychrotrophic counts were determined after aerobic incubation at 4 °C for 10 days using Plate Count Agar (Biolife, Milan, Italy) in accordance with ISO 17410: 2019 [38]. Enterobacteriaceae were counted on Violet Red Bile Glucose Agar (Biolife, Milan, Italy) after aerobic incubation at 37 °C for 24 h in accordance with ISO 21528-1: 2017 [39]. The average of three measurements was recorded.

2.8. Statistical Analysis

The experiment was performed in three independent replicates and the number of repeats varied from one analysis to another and was reported in each subsection. The data were analyzed through two-way analysis of variance (ANOVA). The differences between means were compared by Tukey’s post-hoc test (p < 0.05). A principal component analysis (PCA) was then performed to establish the variations and relationships among physicochemical properties of sous vide chicken breast fillets cooked at twelve different combinations of temperature and time. All the analysis was performed in SPSS software (IBM SPSS 20, New York, NY, USA).

3. Results and Discussion

3.1. Moisture Content, Cooking Loss, and pH

Moisture content is one of the important physicochemical characteristics in meat which plays a basic role in the palatability of meat. Moisture content of raw chicken breast fillet 24 h post-mortem is presented in Table 2. Raw meat showed a moisture content of 72.4%. These results were consistent with those obtained by Sanchez Brambila et al. [40].
The moisture content of sous vide chicken breast fillets cooked at different temperature and time combinations ranged from 68.25% to 71.89% (Table 3). Moisture content was affected by cooking temperature, cooking time, and interaction between temperature and time (p < 0.05). As expected, there was a reduction in moisture content by increasing temperature from 60 °C to 80 °C. Control treatment cooked at 100 °C for 60 min showed the lowest moisture content with 68.25% (p < 0.05). Increasing cooking time from 60 min to 150 at higher temperatures (70 and 80 °C) caused a reduction in moisture content (p < 0.05). During cooking, the fluid is released as water and other ingredients such as fat and soluble proteins. Releasing the sarcoplasmic fluid from the muscle fibers results in lower water content at higher temperatures [6,8,41]. Murphy et al. [42] reported that the denaturation of myosin and actin at higher temperatures caused structural changes and changes in porosity of the chicken breast patties which can directly affect the moisture content. This result is in accordance with those obtained for chicken and beef [28,43].
Cooking loss is an important factor to consider because it is directly related to juiciness which could influence the consumer’s perception of the final product [25]. The cooking loss is defined as total liquid and soluble matter lost from the meat during cooking and it is influenced by different factors such as the quality of the raw meat, genetics of the animals, and cooking conditions. This loss relies on the mass transfer process during heat treatment [44]. In this study, cooking loss ranged from 10.23% to 28.08%. Control samples cooked at 100 °C showed the highest cooking loss (p < 0.05). Cooking loss was affected by both cooking temperature and cooking time and it was increased by increasing cooking temperature and time (p < 0.05). Increasing temperature causes denaturation of myofibrillar proteins and the actomyosin complex, resulting in shrinkage of the muscle fiber. Thus, less water can be captured within the protein structures kept by capillary forces [41,45]. Our result is in agreement with previous studies on sous vide cooking on chicken [28], beef [25,43], pork [23], and lamb [7]. According to Purslow et al. [46], the cooking loss is mainly determined by the shrinkage of myofibrillar proteins (40–60 °C), shrinkage of collagen (60–70 °C), and denaturation of actin (70–80 °C). Denaturation of proteins occurs with increasing temperature which causes structural changes and the release of fluid from muscle fiber leading to a decrease in the water holding capacity and higher cooking loss [47].
The pH of raw chicken breast fillet 24 h post-mortem was 5.8 (Table 2). The pH value of sous vide chicken breast fillets cooked at different temperature and time combinations slightly increased and ranged from 6.07 to 6.3. The pH was affected by temperature and the interaction between temperature and time. Increasing temperature from 60 °C to 80 °C caused an increase in pH value. Similarly, Bıyıklı et al. [26] reported that increasing cooking temperature from 65 °C to 75 °C and cooking time from 20 min to 60 min caused an increase in the pH of sous vide turkey cutlet. Becker et al. [20] reported that increasing temperature caused an increase in pH mainly due to the protein denaturation and the change in protein charge.

3.2. Color

The L*, a*, b* values of raw chicken breast fillet 24 h post-mortem were 58.4, 0.8, and 9.1, respectively (Table 2). Color parameters are usually used as an indicator of the doneness of cooked meat which directly impacts the appearance and attractiveness of the product [8,19]. The color is mainly affected inside the muscle by myoglobin content, oxidative state of myoglobin, muscle fiber orientation, space between the muscle fibers, packaging conditions, Millard reactions, and pH [48,49]. Color parameters of chicken breast fillets cooked at different temperature-time combinations are presented in Table 3. The L* value (lightness) was not affected by cooking temperature, time, and their interaction (p > 0.05). A similar result was reported by Park et al. [29] in sous vide chicken breast cooked at different combinations of temperature (60 and 70 °C) and time (60, 120, and 180 min). In contrast to this result, Sánchez del Pulgar et al. [23] reported that sous vide pork cheeks cooked at 60 °C had a higher L* compared to those cooked at 80 °C. The authors concluded that samples cooked at lower temperatures preserved more water during cooking which might be released to the surface during the slicing process before color measurement. On the other hand, the chicken breast color can be classified into pale (L* > 53), dark (L* < 46), and normal (46 < L* < 53) based on the L* value [33]. In our study, sous vide chicken breast fillets in all combinations of temperature and time showed a pale appearance.
The a* value (redness/greenness) ranged from 1.29 to 1.95. The low a*value in poultry meat is mainly due to the presence of white muscle fibers with low myoglobin content [50]. In this study, a* value was affected by cooking temperature and cooking time (p < 0.05). Control samples cooked at 100 °C revealed a lower a* value than those cooked at 60 °C and 70 °C (p < 0.05). A similar result was reported by Naveena et al. [28] and García-Segovia et al. [51]. The pink color in poultry meat is evidence of a poorly cooked product. Holownia et al. [52] defined a subjective pink threshold at a* = 3.8 in chicken breast fillets. In our study, a* values were under this threshold level at all different temperatures and time combinations. In a general context, a* value is conversely linked to the degree of myoglobin thermal denaturation in cooked meat [23]. Myoglobin thermal denaturation happens quickly with increasing temperature which can directly interact with by-products of lipid oxidation leading to a reduction in a* value [50].
The b* value (yellowness/blueness) ranged from 14.65 to 15.64. The b* value was not affected by cooking temperature, time, and their interaction (p > 0.05). In contrast to our result, Park et al. [29] reported that b* value was affected by cooking temperature in sous vide chicken samples cooked at different combinations of temperature (60 and 70 °C) and time (60, 120, and 180 min).

3.3. Lipid Oxidation

A thiobarbituric acid reactive substances (TBARS) test was used to determine secondary lipid oxidation products (e.g., aldehydes) as an indicator of oxidative deterioration [45], off-flavors, and rancidity [13]. Raw meat showed a TBARS value of 0.08 mg/Kg (Table 2). TBARS values of chicken breast fillets cooked at different temperature-time combinations ranged from 0.29 to 2.60 mg/Kg (Table 3). This parameter was only affected by the cooking temperature (p < 0.05). Chicken breast fillets cooked at 60 °C at every time point showed TBARS values below one. Akoğlu et al. [27] reported that oxidative rancidity cannot be detected by a sensory panel under a threshold level of one (mg/kg). TBARS value was increased by increasing temperature up to 80 °C (p < 0.05). Control treatment cooked at 100 °C showed a similar value to sous vide chicken cooked at 80 °C. In contrast to our result, Sánchez del Pulgar et al. [23] reported that time (5 and 12 h) and temperature (60 and 80 °C) and their interaction were affected by the TBARS of sous vide pork cheeks.

3.4. Warner-Bratzler Shear Force (WBSF)

The WBSF is commonly used for evaluating tenderness. It is an important eating quality character due to the impact on texture and consumer acceptance [53]. The WBSF values of chicken breast fillets cooked at different temperature-time combinations are presented in Table 3. The WBSF was only affected by cooking temperature and it was increased by increasing temperature (p < 0.05). This parameter ranged between 0.62 and 1.37 kg. The lowest shear force was found in sous vide chicken treatment cooked at 60 °C and 70 °C. This result might be associated with higher moisture content and lower cooking loss of samples cooked at lower temperatures [29,41]. Cooking at low temperatures reduces the protein–protein association and gelation and increases water retention [6,22]. On the other hand, the control sample cooked at 100 °C showed the highest WBSF, which could be attributed to higher cooking loss, lower moisture content, and formation of gelatin due to the collagen denaturation and myofibrillar hardening [54]. Barbanti and Pasquini [55] reported that the enhancement of tenderness is mainly caused by the solubilization of connective tissues, while denaturation of myofibrillar proteins led to toughening. Overall, from previous studies it was suggested that solubilization of the connective tissue [51,56], aggregation of sarcoplasmic proteins [6,9], and water retention inside the muscles [25,53,57] are three major factors contributing to the increase in tenderness.

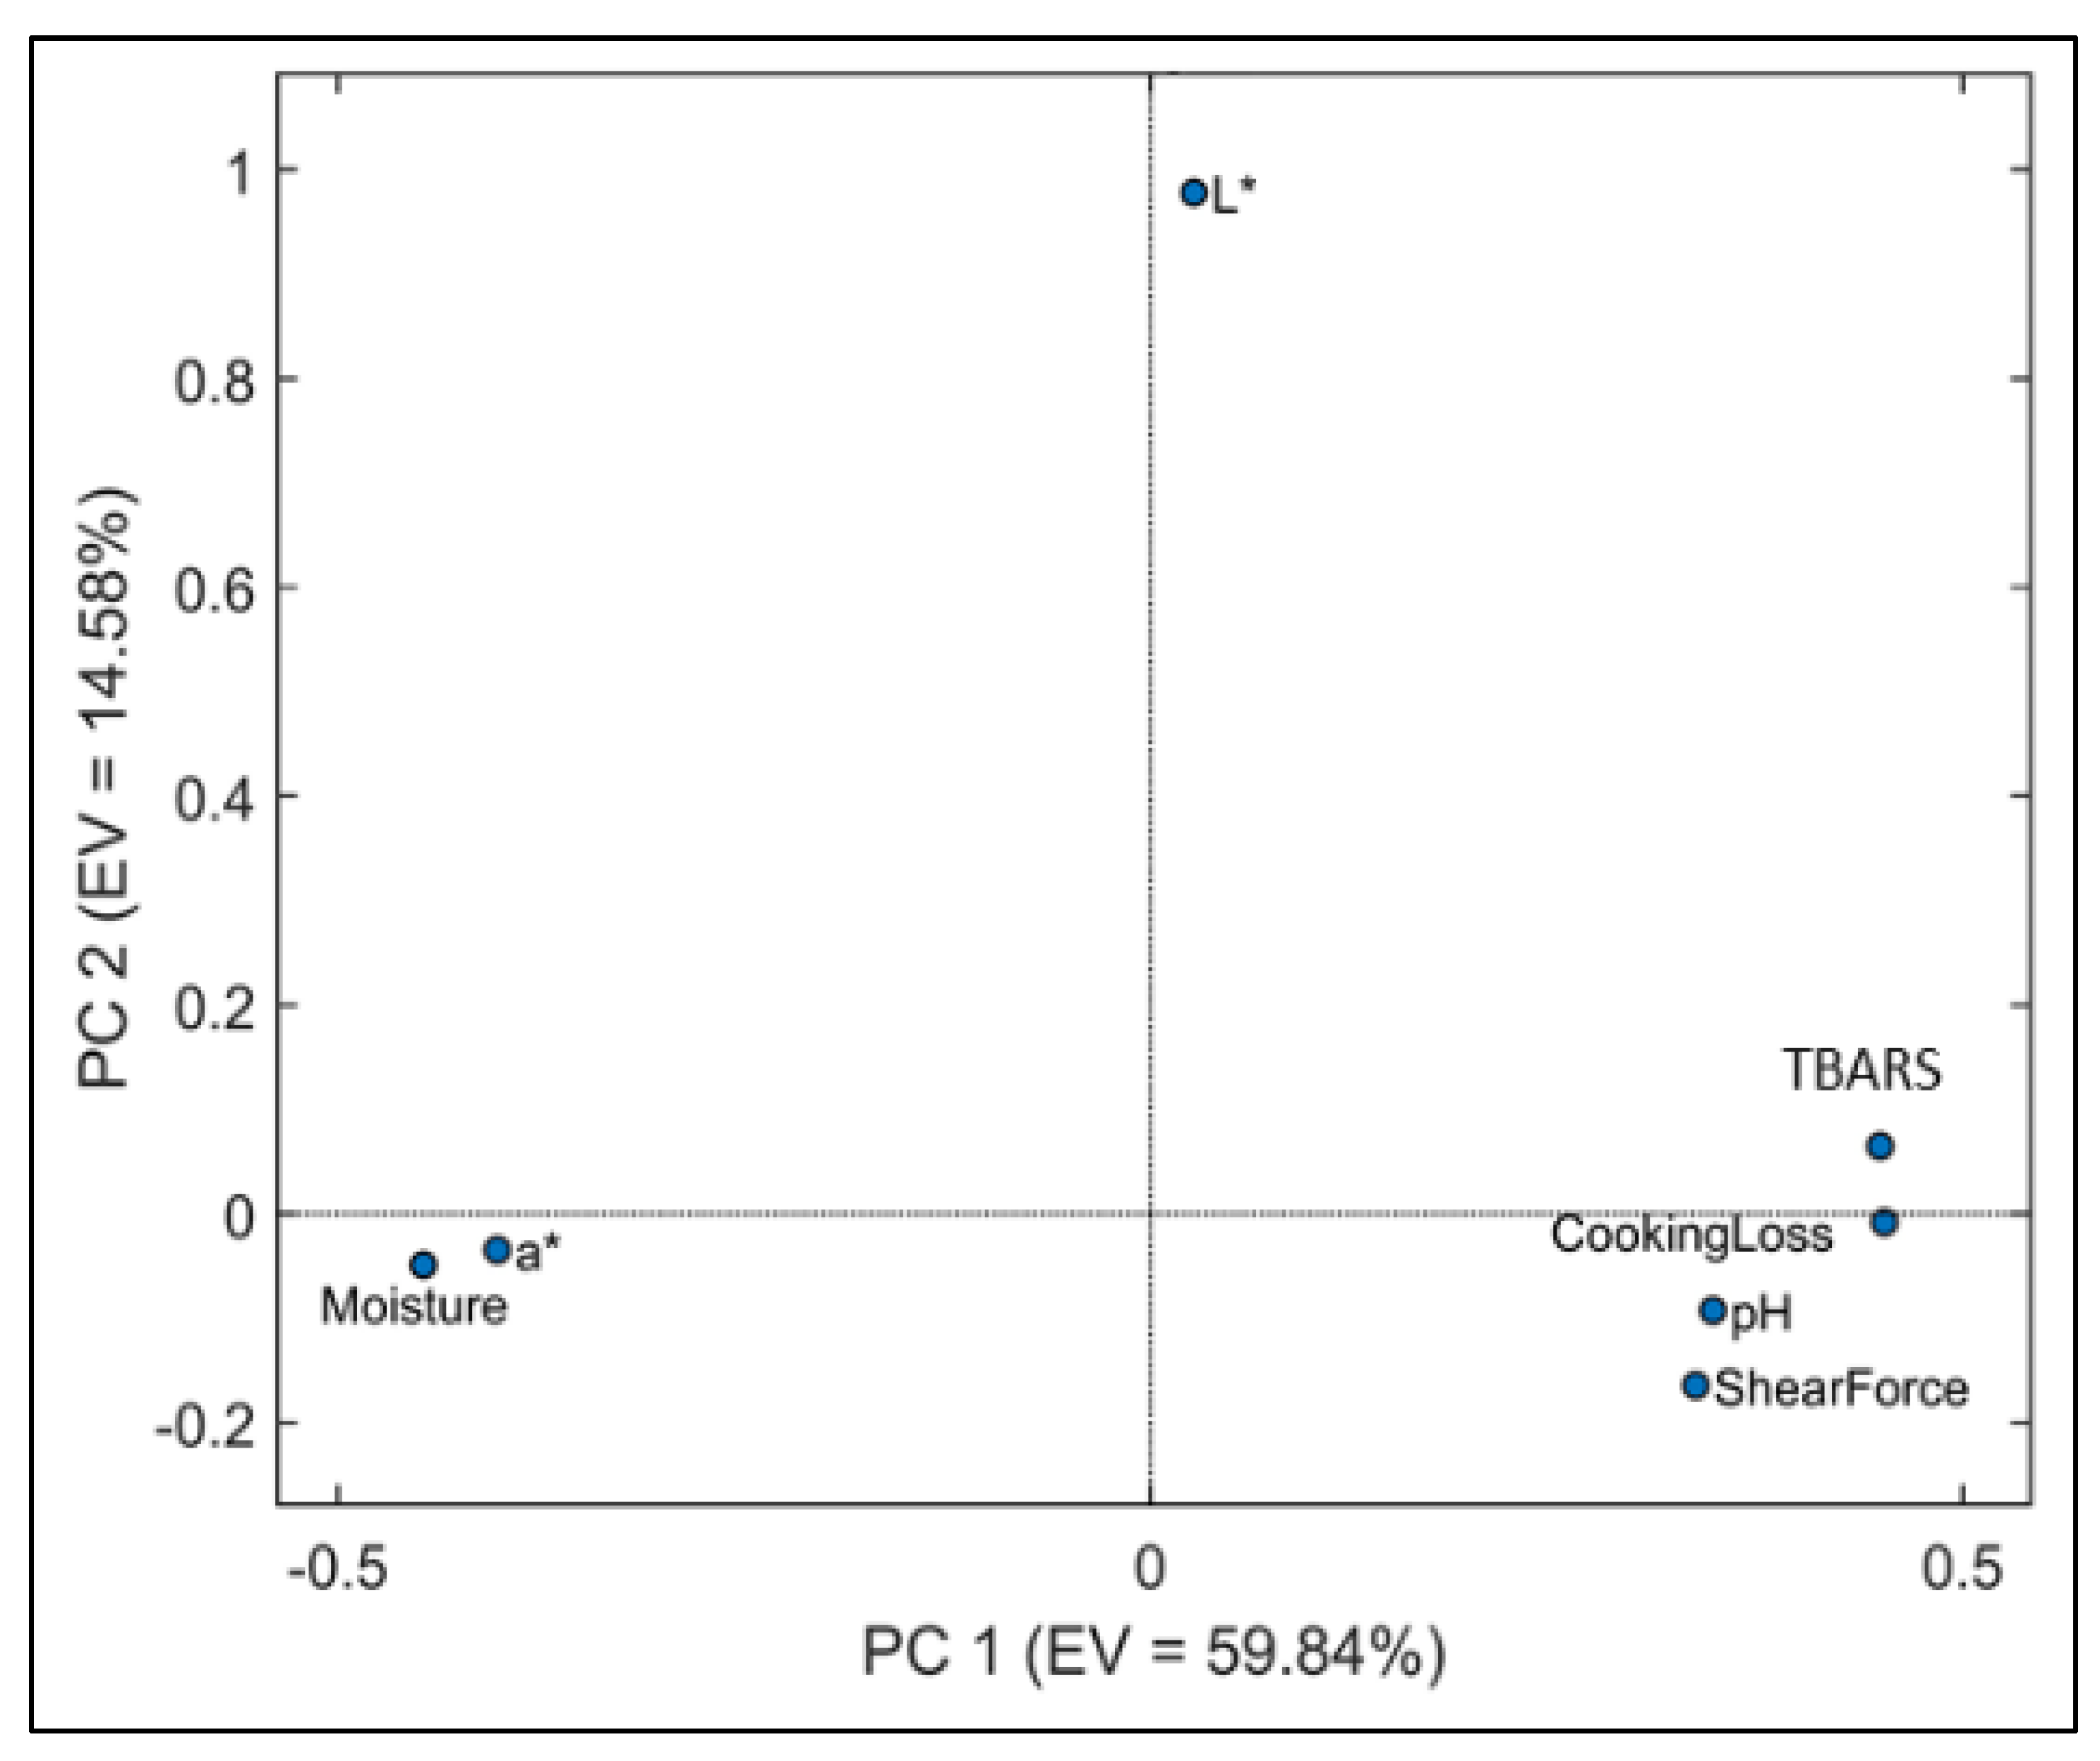
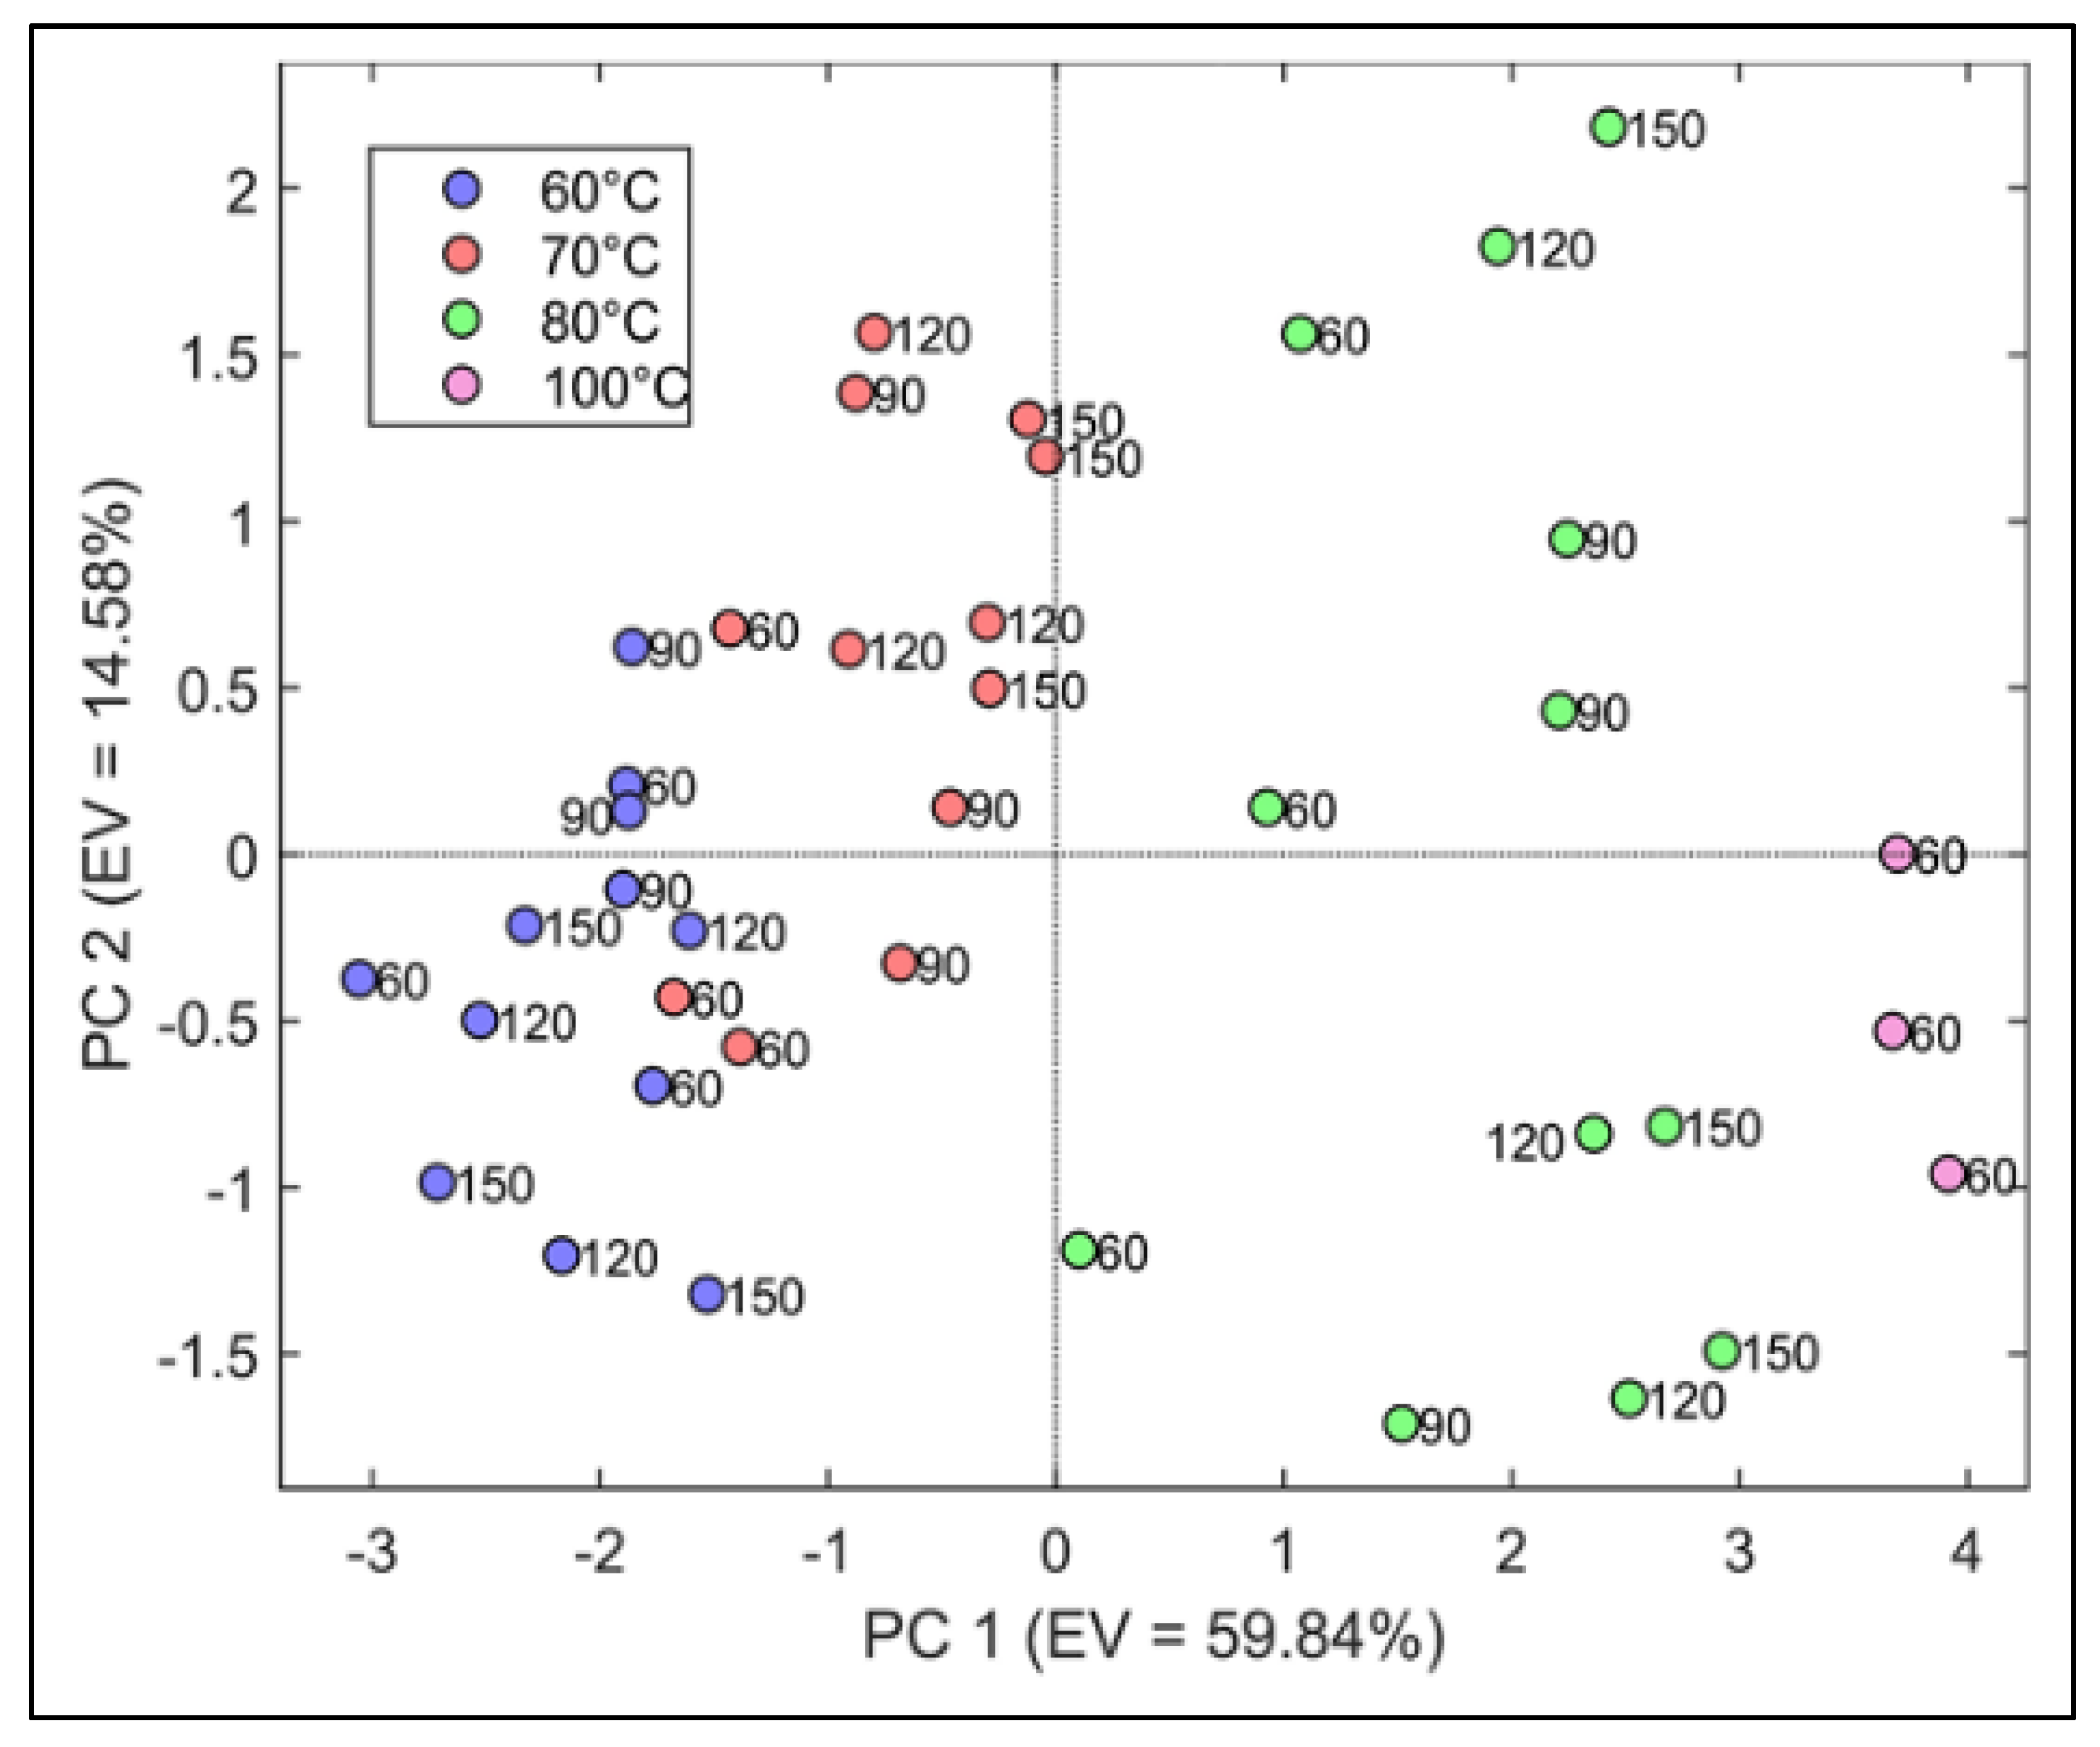
3.5. Principal Component Analysis (PCA) Analysis

Figure 1 reports the loading plot of the PCA model computed on the physicochemical variables considered in this study. The analysis showed that about 59.84% of the total variation is explained by the first principal component (PC1) and 14.58% by the second principal component (PC2). These two PCs account for about 74.42% of the total data variance. PC1 correlated positively with shear force, cooking loss, TBARS, and pH, while it had a negative correlation with moisture and a* color value. This tendency confirms the opposite relationship between moisture content and shear force, cooking loss, TBARS, and pH. PC2 was only correlated positively with L* color value. A similar result was reported by Fabre et al. [53].
Figure 2 reports the score plot. The colors on the plot refer to the different temperatures (60, 70, 80, and 100 °C) while the numbers indicate the cooking time (60, 90, 120, and 150 min). Chicken breast samples cooked at 60 °C and 70 °C were at negative values of PC1. Conversely, the chicken breast samples cooked at 80 and 100 °C were at positive values of PC1. By comparing the score plot with the corresponding loading plot, it is possible to interpret the relationships between samples and variables [58]. The score plot in conjugation with the loading plot demonstrated that increasing cooking temperature caused an increase in cooking loss, lipid oxidation, TBARS, and pH. Comparing the results in Table 3 with the PCA model allowed us to conclude that the cooking temperature played a major role in measured variables while the effect of cooking times seemed to be negligible.

3.6. Microbiology

The microbial load before and after sous vide cooking was analyzed to verify different temperature and time combinations applied in this study guarantee microbiological safety. The microbial counts of mesophilic aerobic bacteria, Psychrotrophic bacteria, and Enterobacteriaceae at raw chicken breast fillets are presented in Table 4. The selection of these three groups was based on their significant importance in food quality and safety. Raw chicken breast fillets showed 2.8 and 2.3 log CFU/g counts for total mesophilic aerobic bacteria and Enterobacteriaceae, respectively. The Psychrotrophic bacteria count was lower than 1 log CFU/g. These results are below reference values recommended by food quality standards for fresh poultry meat (EC No. 2073/2005). The counts of all microbial groups were not detectable at 4 °C for 21 days in sous vide chicken breast fillets confirming that even the lowest temperature and time combinations (60 °C–60 min) were enough to pasteurize meat. This result might be due to the growth inhibition of microorganisms under anaerobic conditions caused by vacuum packaging together with heat treatment and storage at a low temperature (4 °C) [17,27]. In accordance with these results, Can and Harun [31] reported that total mesophilic aerobic bacteria, Psychrotrophic bacteria, and Enterobacteriaceae counts were for sous vide chicken meatballs cooked at 90 °C for 20 min. In contrast to our results, Akoğlu et al. [27] found that total mesophilic aerobic bacterial counts exceeded 5 log CFU/g for sous vide turkey cutlet cooked at 45 °C for 60 min and stored at 4 and 12 °C, respectively. The presence of total mesophilic aerobic bacteria might be due to the low temperature (45 °C) applied in this study which was not enough to inhibit the growth of microorganisms.

4. Conclusions

Sous vide cooking is gaining more and more attention from catering, restaurants, ready-to-eat industries, and homes recently mainly due to the improvement in eating quality characteristics, extended shelf lives, and reduced risk of post-cooking contamination compared to other cooking methods. Temperature and time are two critical parameters in sous vide cooking that directly affect eating quality and safety. The finding of this study showed that cooking temperature played a major role in the moisture content, cooking loss, shear force, TBARS, a*, and pH value. Increasing cooking time from 60 min to 150 min caused a reduction in moisture content and a* value while cooking loss increased. Chicken breast fillets cooked at 60 °C revealed less cooking loss, lipid oxidation, shear force, and a more intense red color compared to those cooked at 70 and 80 °C. Total mesophilic aerobic bacteria, Psychrotrophic bacteria, and Enterobacteriaceae were not detected during storage at 4 °C for 21 days, ensuring microbiological safety for consumers. Overall, the optimum condition obtained in this study for chicken breast fillets was cooking at 60 °C for 60 min. Future studies need to be carried out to assess the sensory quality parameters and palatability of sous vide chicken breast fillets during the storage time to determine shelf life and consumer acceptability. Besides, it is necessary to perform inoculum studies targeting specific pathogenic and spoilage microorganisms to assess the effectiveness of selected temperature and time combinations on microbiological quality.

Author Contributions

Conceptualization, H.H., and A.M.B.; methodology, H.H., and A.M.B.; software, H.H., A.M.B., and F.M.; validation, H.H., and A.M.B.; formal analysis, H.H., and A.M.B.; investigation, H.H., and A.M.B.; resources, D.P.L.F., and A.P.; data curation, H.H., and A.M.B.; writing—original draft preparation, H.H., and A.M.B.; writing—review and editing, H.H; and A.M.B.; visualization, H.H., and A.M.B.; supervision, D.P.L.F., G.M., and A.P.; project administration, H.H.; funding acquisition, A.P. All authors have read and agreed to the published version of the manuscript.

Funding

This research was funded “FAR” INTERDISCIPLINARI-LS 2018 PROT.161714 Titolo: “DEL TRATTAMENTO TERMICO SOUS-VIDE: QUALITÀ REALE E PERCEPITA.

Institutional Review Board Statement

Not applicable.

Informed Consent Statement

Not applicable.

Data Availability Statement

The data presented in this study are available on request from the corresponding author.

Conflicts of Interest

The authors declare no conflict of interest.

References

  1. Biesalski, H.-K. Meat as a component of a healthy diet—Are there any risks or benefits if meat is avoided in the diet? Meat Sci. 2005, 70, 509–524. [Google Scholar] [CrossRef] [PubMed]
  2. Czarnowska-Kujawska, M.; Draszanowska, A.; Gujska, E. Effect of Different Cooking Methods on Folate Content in Chicken Liver. Foods 2020, 9, 1431. [Google Scholar] [CrossRef] [PubMed]
  3. Davey, C.L.; Gilbert, K.V. Temperature-dependent cooking toughness in beef. J. Sci. Food Agric. 1974, 25, 931–938. [Google Scholar] [CrossRef]
  4. Gök, V.; Uzun, T.; Tomar, O.; Çağlar, M.Y.; Çağlar, A. The effect of cooking methods on some quality characteristics of gluteus medius. Food Sci. Technol. 2019, 39, 999–1004. [Google Scholar] [CrossRef] [Green Version]
  5. Nithyalakshmi, V.; Preetha, R. Effect of cooking conditions on physico-chemical and textural properties of emu (Dromaius novaehollandiae) meat. Int. Food Res. J. 2015, 22, 1924–1930. [Google Scholar]
  6. Tornberg, E. Effects of heat on meat proteins—Implications on structure and quality of meat products. Meat Sci. 2005, 70, 493–508. [Google Scholar] [CrossRef]
  7. Roldán, M.; Antequera, T.; Martín, A.; Mayoral, A.I.; Ruiz, J. Effect of different temperature–time combinations on physicochemical, microbiological, textural and structural features of sous-vide cooked lamb loins. Meat Sci. 2013, 93, 572–578. [Google Scholar] [CrossRef] [PubMed]
  8. Dominguez-Hernandez, E.; Salaseviciene, A.; Ertbjerg, P. Low-temperature long-time cooking of meat: Eating quality and underlying mechanisms. Meat Sci. 2018, 143, 104–113. [Google Scholar] [CrossRef] [Green Version]
  9. Baldwin, D.E. Sous vide cooking: A review. Int. J. Gastron. Food Sci. 2012, 1, 15–30. [Google Scholar] [CrossRef] [Green Version]
  10. Zavadlav, S.; Blažić, M.; Van De Velde, F.; Vignatti, C.; Fenoglio, C.; Piagentini, A.M.; Pirovani, M.E.; Perotti, C.M.; Kovačević, D.B.; Putnik, P. Sous-Vide as a Technique for Preparing Healthy and High-Quality Vegetable and Seafood Products. Foods 2020, 9, 1537. [Google Scholar] [CrossRef]
  11. Albistur, A.R.-; Gámbaro, A. Consumer perception of a non-traditional market on sous-vide dishes. Int. J. Gastron. Food Sci. 2018, 11, 20–24. [Google Scholar] [CrossRef]
  12. Christensen, L.; Gunvig, A.; Tørngren, M.A.; Aaslyng, M.D.; Knøchel, S.; Christensen, M. Sensory characteristics of meat cooked for prolonged times at low temperature. Meat Sci. 2012, 90, 485–489. [Google Scholar] [CrossRef]
  13. Cho, D.K.; Lee, B.; Oh, H.; Lee, J.S.; Kim, Y.S.; Choi, Y.M. Effect of Searing Process on Quality Characteristics and Storage Stability of Sous-Vide Cooked Pork Patties. Foods 2020, 9, 1011. [Google Scholar] [CrossRef]
  14. Rondanelli, M.; Daglia, M.; Meneghini, S.; Di Lorenzo, A.; Peroni, G.; Faliva, M.A.; Perna, S. Nutritional advantages of sous-vide cooking compared to boiling on cereals and legumes: Determination of ashes and metals content in ready-to-eat products. Food Sci. Nutr. 2017, 5, 827–833. [Google Scholar] [CrossRef] [Green Version]
  15. Schellekens, M. New research issues in sous-vide cooking. Trends Food Sci. Technol. 1996, 7, 256–262. [Google Scholar] [CrossRef]
  16. Jeong, S.-H.; Kim, E.-C.; Lee, D.-U. The Impact of a Consecutive Process of Pulsed Electric Field, Sous-Vide Cooking, and Reheating on the Properties of Beef Semitendinosus Muscle. Foods 2020, 9, 1674. [Google Scholar] [CrossRef]
  17. Hong, G.-E.; Kim, J.-H.; Ahn, S.-J.; Lee, C.-H. Changes in Meat Quality Characteristics of the Sous-vide Cooked Chicken Breast during Refrigerated Storage. Food Sci. Anim. Resour. 2015, 35, 757–764. [Google Scholar] [CrossRef] [Green Version]
  18. Rizzo, V.; Amoroso, L.; Licciardello, F.; Mazzaglia, A.; Muratore, G.; Restuccia, C.; Lombardo, S.; Pandino, G.; Strano, M.G.; Mauromicale, G. The effect of sous vide packaging with rosemary essential oil on storage quality of fresh-cut potato. LWT 2018, 94, 111–118. [Google Scholar] [CrossRef]
  19. Głuchowski, A.; Czarniecka-Skubina, E.; Wasiak-Zys, G.; Nowak, D.; Skubina, C.-; Zys, W. Effect of Various Cooking Methods on Technological and Sensory Quality of Atlantic Salmon (Salmo salar). Foods 2019, 8, 323. [Google Scholar] [CrossRef] [Green Version]
  20. Becker, A.; Boulaaba, A.; Pingen, S.; Krischek, C.; Klein, G. Low temperature cooking of pork meat—Physicochemical and sensory aspects. Meat Sci. 2016, 118, 82–88. [Google Scholar] [CrossRef]
  21. Christensen, L.; Ertbjerg, P.; Aaslyng, M.D.; Christensen, M. Effect of prolonged heat treatment from 48 °C to 63°C on toughness, cooking loss and color of pork. Meat Sci. 2011, 88, 280–285. [Google Scholar] [CrossRef]
  22. Jeong, K.; Hyeonbin, O.; Shin, S.Y.; Kim, Y.-S. Effects of sous-vide method at different temperatures, times and vacuum degrees on the quality, structural, and microbiological properties of pork ham. Meat Sci. 2018, 143, 1–7. [Google Scholar] [CrossRef] [PubMed]
  23. del Pulgar, J.S.; Gázquez, A.; Ruiz-Carrascal, J. Physico-chemical, textural and structural characteristics of sous-vide cooked pork cheeks as affected by vacuum, cooking temperature, and cooking time. Meat Sci. 2012, 90, 828–835. [Google Scholar] [CrossRef] [PubMed]
  24. Botinestean, C.; Keenan, D.F.; Kerry, J.P.; Hamill, R.M. The effect of thermal treatments including sous-vide, blast freezing and their combinations on beef tenderness of M. semitendinosus steaks targeted at elderly consumers. LWT 2016, 74, 154–159. [Google Scholar] [CrossRef]
  25. Gómez, I.; Ibañez, F.C.; Beriain, M.J. Physicochemical and sensory properties of sous vide meat and meat analog products marinated and cooked at different temperature-time combinations. Int. J. Food Prop. 2019, 22, 1693–1708. [Google Scholar] [CrossRef] [Green Version]
  26. Bıyıklı, M.; Akoğlu, A.; Kurhan, Ş.; Akoğlu, İ.T. Effect of different Sous Vide cooking temperature-time combinations on the physicochemical, microbiological, and sensory properties of turkey cutlet. Int. J. Gastron. Food Sci. 2020, 20, 100204. [Google Scholar] [CrossRef]
  27. Akoğlu, I.; Bıyıklı, M.; Akoglu, A.; Kurhan, Ş.; Biyikli, M. Determination of the Quality and Shelf Life of Sous Vide Cooked Turkey Cutlet Stored at 4 and 12 °C. Braz. J. Poult. Sci. 2018, 20, 1–8. [Google Scholar] [CrossRef]
  28. Naveena, B.M.; Khansole, P.S.; Kumar, M.S.; Krishnaiah, N.; Kulkarni, V.V.; Deepak, S.J. Effect of sous vide processing on physicochemical, ultrastructural, microbial and sensory changes in vacuum packaged chicken sausages. Food Sci. Technol. Int. 2016, 23, 75–85. [Google Scholar] [CrossRef]
  29. Park, C.; Lee, B.; Oh, E.; Kim, Y.; Choi, Y. Combined effects of sous-vide cooking conditions on meat and sensory quality characteristics of chicken breast meat. Poult. Sci. 2020, 99, 3286–3291. [Google Scholar] [CrossRef]
  30. Karpińska-Tymoszczyk, M.; Draszanowska, A.; Danowska-Oziewicz, M.; Kurp, L. The effect of low-temperature thermal processing on the quality of chicken breast fillets. Food Sci. Technol. Int. 2020, 26, 563–573. [Google Scholar] [CrossRef]
  31. Can, Ö.; Harun, F. Shelf Life of Chicken Meat Balls Submitted to Sous Vide Treatment. Braz. J. Poult. Sci. 2015, 17, 137–144. [Google Scholar] [CrossRef] [Green Version]
  32. AOAC. AOAC Official Methods of Analysis, 18th ed.; AOAC International: Rockville, MD, USA, 2005; ISBN 0935584870. [Google Scholar]
  33. Da Silva-Buzanello, R.A.; Schuch, A.F.; Gasparin, A.W.; Torquato, A.S.; Scremin, F.R.; Canan, C.; Soares, A.L. Quality parameters of chicken breast meat affected by carcass scalding conditions. Asian-Australas. J. Anim. Sci. 2019, 32, 1186–1194. [Google Scholar] [CrossRef] [PubMed]
  34. Haghighi, H.; Gullo, M.; La China, S.; Pfeifer, F.; Siesler, H.W.; Licciardello, F.; Pulvirenti, A. Characterization of bio-nanocomposite films based on gelatin/polyvinyl alcohol blend reinforced with bacterial cellulose nanowhiskers for food packaging applications. Food Hydrocoll. 2021, 113, 106454. [Google Scholar] [CrossRef]
  35. Honikel, K.O. Reference methods for the assessment of physical characteristics of meat. Meat Sci. 1998, 49, 447–457. [Google Scholar] [CrossRef]
  36. Siu, G.M.; Draper, H.H. A Survey of the Malonaldehyde Content of Retail Meats and Fish. J. Food Sci. 1978, 43, 1147–1149. [Google Scholar] [CrossRef]
  37. ISO. ISO 4833-1 Microbiology of the Food Chain—Horizontal Method for the Enumeration of Microorganisms, Part 1, Count at 30 °C by the Pour Plate Technique; ISO: Geneva, Switzerland, 2013; p. 9. [Google Scholar]
  38. ISO. ISO 17410 Microbiology of the Food Chain—Horizontal Method for the Enumeration of Psychrotrophic Microorganisms; ISO: Geneva, Switzerland, 2019; p. 10. [Google Scholar]
  39. ISO. ISO 21528-1 Microbiology of the Food Chain—Horizontal Method for the Detection and Enumeration of Enterobacteriaceae—Part 1: Detection of Enterobacteriaceae; ISO: Geneva, Switzerland, 2017; p. 17. [Google Scholar]
  40. Brambila, G.S.; Chatterjee, D.; Bowker, B.; Zhuang, H. Descriptive texture analyses of cooked patties made of chicken breast with the woody breast condition. Poult. Sci. 2017, 96, 3489–3494. [Google Scholar] [CrossRef] [PubMed]
  41. Murphy, R.Y.; Marks, B.P. Effect of meat temperature on proteins, texture, and cook loss for ground chicken breast patties. Poult. Sci. 2000, 79, 99–104. [Google Scholar] [CrossRef]
  42. Murphy, R.Y.; Johnson, E.R.; Duncan, L.K.; Clausen, E.C.; Davis, M.D.; March, J.A. Heat Transfer Properties, Moisture Loss, Product Yield, and Soluble Proteins in Chicken Breast Patties During Air Convection Cooking. Poult. Sci. 2001, 80, 508–514. [Google Scholar] [CrossRef]
  43. Ismail, I.; Hwang, Y.-H.; Bakhsh, A.; Joo, S.-T. The alternative approach of low temperature-long time cooking on bovine semitendinosus meat quality. Asian Australas. J. Anim. Sci. 2019, 32, 282–289. [Google Scholar] [CrossRef] [PubMed] [Green Version]
  44. Aaslyng, M.D.; Bejerholm, C.; Ertbjerg, P.; Bertram, H.C.; Andersen, H.J. Cooking loss and juiciness of pork in relation to raw meat quality and cooking procedure. Food Qual. Prefer. 2003, 14, 277–288. [Google Scholar] [CrossRef]
  45. Roldán, M.; Antequera, T.; Hernández, A.; Ruiz, J.; Ruiz-Carrascal, J. Physicochemical and microbiological changes during the refrigerated storage of lamb loins sous-vide cooked at different combinations of time and temperature. Food Sci. Technol. Int. 2014, 21, 512–522. [Google Scholar] [CrossRef]
  46. Purslow, P.; Oiseth, S.; Hughes, J.; Warner, R. The structural basis of cooking loss in beef: Variations with temperature and ageing. Food Res. Int. 2016, 89, 739–748. [Google Scholar] [CrossRef] [PubMed]
  47. Li, C.; Wang, D.; Xu, W.; Gao, F.; Zhou, G. Effect of final cooked temperature on tenderness, protein solubility and microstructure of duck breast muscle. LWT 2013, 51, 266–274. [Google Scholar] [CrossRef]
  48. Wideman, N.; O’Bryan, C.; Crandall, P. Factors affecting poultry meat colour and consumer preferences—A review. World’s Poult. Sci. J. 2016, 72, 353–366. [Google Scholar] [CrossRef]
  49. Cobos, Á.; Diaz, O. Chemical Composition of Meat and Meat Products. In Handbook of Food Chemistry; Cheung, P.C.K., Ed.; Springer: Berlin/Heidelberg, Germany, 2014; pp. 1–32. [Google Scholar]
  50. Khan, A.; Allen, K.; Wang, X. Effect of Type I and Type II Antioxidants on Oxidative Stability, Microbial Growth, pH, and Color in Raw Poultry Meat. Food Nutr. Sci. 2015, 6, 1541–1551. [Google Scholar] [CrossRef] [Green Version]
  51. García-Segovia, P.; Andrés-Bello, A.; Martínez-Monzó, J. Effect of cooking method on mechanical properties, color and structure of beef muscle (M. pectoralis). J. Food Eng. 2007, 80, 813–821. [Google Scholar] [CrossRef]
  52. Holownia, K.; Chinnan, M.S.; Reynolds, A.E.; Koehler, P.E. Evaluation of induced color changes in chicken breast meat during simulation of pink color defect. Poult. Sci. 2003, 82, 1049–1059. [Google Scholar] [CrossRef] [PubMed]
  53. Fabre, R.; Dalzotto, G.; Perlo, F.; Bonato, P.; Teira, G.; Tisocco, O. Cooking method effect on Warner-Bratzler shear force of different beef muscles. Meat Sci. 2018, 138, 10–14. [Google Scholar] [CrossRef]
  54. Turner, B.E.; Larick, D.K. Palatability of Sous Vide Processed Chicken Breast. Poult. Sci. 1996, 75, 1056–1063. [Google Scholar] [CrossRef]
  55. Barbanti, D.; Pasquini, M. Influence of cooking conditions on cooking loss and tenderness of raw and marinated chicken breast meat. LWT 2005, 38, 895–901. [Google Scholar] [CrossRef]
  56. Warner, R.; Ha, M.; Sikes, A.; Vaskoska, R. Cooking and Novel Postmortem Treatments to Improve Meat Texture. In New Aspects of Meat Quality; Elsevier BV: Amsterdam, The Netherlands, 2017; pp. 387–423. [Google Scholar]
  57. Laakkonen, E.; Wellington, G.H.; Sherbon, J.N. Low-Temperature, Long-Time Heating of Bovine Muscle 1. Changes in Tenderness, Water-Binding Capacity, pH and Amount of Water-Soluble Components. J. Food Sci. 1970, 35, 175–177. [Google Scholar] [CrossRef]
  58. Bigi, F.; Haghighi, H.; De Leo, R.; Ulrici, A.; Pulvirenti, A. Multivariate exploratory data analysis by PCA of the combined effect of film-forming composition, drying conditions, and UV-C irradiation on the functional properties of films based on chitosan and pectin. LWT 2021, 137, 110432. [Google Scholar] [CrossRef]
Figure 1. PC1 vs. PC2: Loading plot of physicochemical variables studied in sous vide chicken fillet breasts cooked at different combinations of temperature (60, 70, 80, and 100 °C) and time (60, 90, 120, and 150 min).
Applsci 11 03189 g001
Figure 2. PC1 vs. PC2: Score plot of physicochemical variables studied in sous vide chicken fillet breasts cooked at different combinations of temperature (60, 70, 80, and 100 °C) and time (60, 90, 120, and 150 min). The symbol’s color corresponds to cooking temperature (60, 70, 80, and 100 °C) and the number beside the symbol corresponds to cooking time (60, 90, 120, and 150 min).
Applsci 11 03189 g002
Table 1. Temperature, Time, and Vacuum Conditions Applied in This Study for Cooking Chicken Breast Fillets.
GroupTemperature (°C)Time (min)Vacuum Degree (%)
Control100600
1606098
2609098
36012098
46015098
5706098
6709098
77012098
87015098
9806098
10809098
118012098
128015098
Table 2. Moisture Content, Thiobarbituric Acid Reactive Substances (TBARS), Color Parameters (L*: Lightness, a*: Redness/Greenness, and b*: Yellowness/Blueness), and pH of the Raw Chicken Breast Fillet 24 h Post-Mortem.
ParametersResults
Moisture (%)72.4 ± 1.02
TBARS (mg/Kg)0.08 ± 0.011
Weight (g)125 ± 5
L*58.4 ± 1.7
a*0.8 ± 0.1
b*9.1 ± 0.9
pH5.8 ± 0.03
Values are presented as means ± standard deviations (n = 3).
Table 3. Moisture Content, Cooking Loss, Shear Force, TBARS, Color Parameters (L*: Lightness, a*: Redness/Greenness, and b*: Yellowness/Blueness), and pH of Sous vide Chicken Breast Fillets Cooked at Different Temperature and Time Combinations.
Temp (°C)60 70 80 100
Time (min)60901201506090120150609012015060SEMTempTimeTemp × Time
Moisture (%)71.41 f,g71.30 e,f,g71.72 f,g71.89 g71.71 f,g70.86 e,f,g69.97 c,d,e70.46 d,e,f70.43 d,e,f69.76 b,c,d69.47 a,b,c69.02 a,b68.25 a0.21***
Cooking loss (%)10.23 a11.02 a12.42 a,b12.47 a,b14.01 a,b,c16.88 b,c,d18.38 c,d,e18.69 c,d,e17.86 c,d,e21.77 d,e,f22.77 e,f24.23 f,g28.08 g3.11**N.S
Shear force (kg)0.75 a0.83 a,b0.76 a0.62 a0.66 a0.73 a0.62 a0.63 a0.88 a,b0.97 b0.79 a0.88 a,b1.37 c0.02*N.SN.S
TBARS (mg/kg)0.29 a0.77 a,b0.92 a,b0.94 a,b1.50 b1.47 b1.63 b1.71 b2.31 c2.42 c2.54 c2.60 c2.91 d0.12*N.SN.S
L*80.94 a81.71 a80.11 a79.63 a80.82 a81.72 a82.27 a82.43 a81.39 a81.19 a80.85 a81.15 a80.75 a2.65N.SN.SN.S
a*1.95 a1.95 a1.81 a1.71 a1.73 a1.71 a1.74 a1.50 ab1.44 b1.39 b1.33 b1.29 b1.29 b0.05**N.S
b*14.71 a14.65 a14.95 a15.15 a14.91 a14.83 a14.95 a15.40 a15.64 a15.55 a15.60 a15.36 a14.82 a0.41N.SN.SN.S
pH6.17 a,b,c6.14 a6.07 a6.08 a6.11 a6.14 a,b6.07 a6.13 a6.15 a,b6.25 b,c6.30 d6.27 c,d6.17 a,b,c0.93*N.S*
Means value with different superscripts letters (a–g) in the same row indicate a significant difference (p < 0.05). Values are presented as means (n = 3). SEM: Standard error of the mean. N.S: not significant; *: indicate a significant difference (p < 0.05).
Table 4. Microbiological Counts of the Raw Chicken Breast Fillet 24 h Post-Mortem (Day 0) and Sous Vide Chicken Breast Fillets (Cooked at All Different Combinations of Temperature and Time) during 21 Days of Storage at 4 °C.
TableTreatmentTotal Mesophilic
Aerobic Log (CFU/g)
Enterobacteriaceae
Log (CFU/g)
Psychrotrophic
Aerobic Log (CFU/g)
0Raw meat2.8 ± 0.62.3 ± 0.4<1
0Sous viden.dn.dn.d
5Sous viden.dn.dn.d
10Sous viden.dn.dn.d
15Sous viden.dn.dn.d
21Sous viden.dn.dn.d
Values are presented as means ± standard deviations (n = 3). n.d: not detected.
Publisher’s Note: MDPI stays neutral with regard to jurisdictional claims in published maps and institutional affiliations.

