
A New Definition of the Term “High-Phenolic Olive Oil” Based on Large Scale Statistical Data of Greek Olive Oils Analyzed by qNMR

 , ,
, , 
Abstract
1. Introduction
2. Results and Discussion
2.1. Overall Analysis
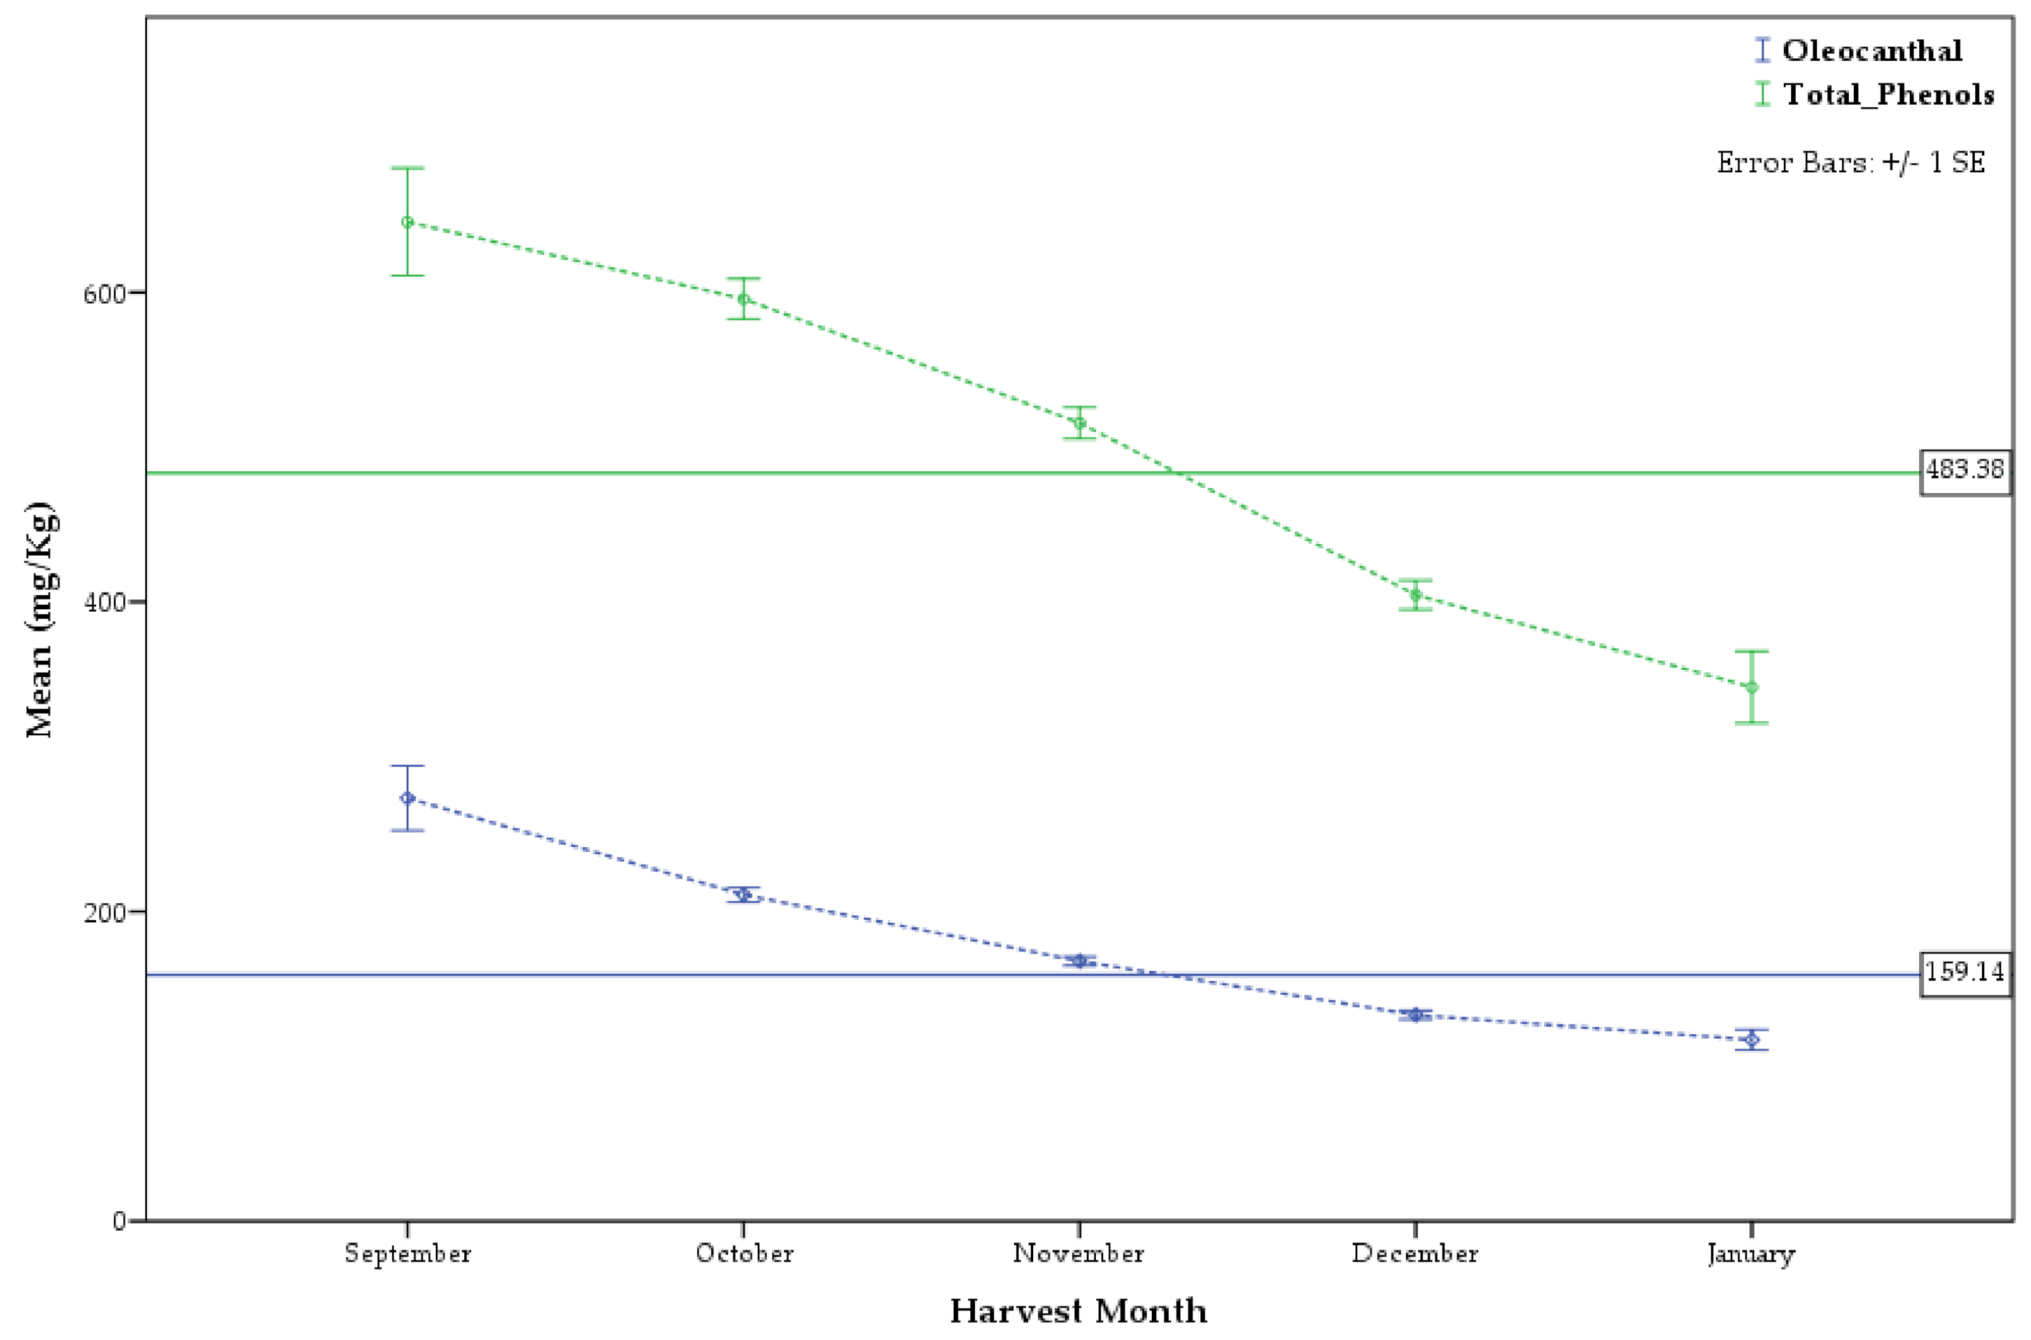
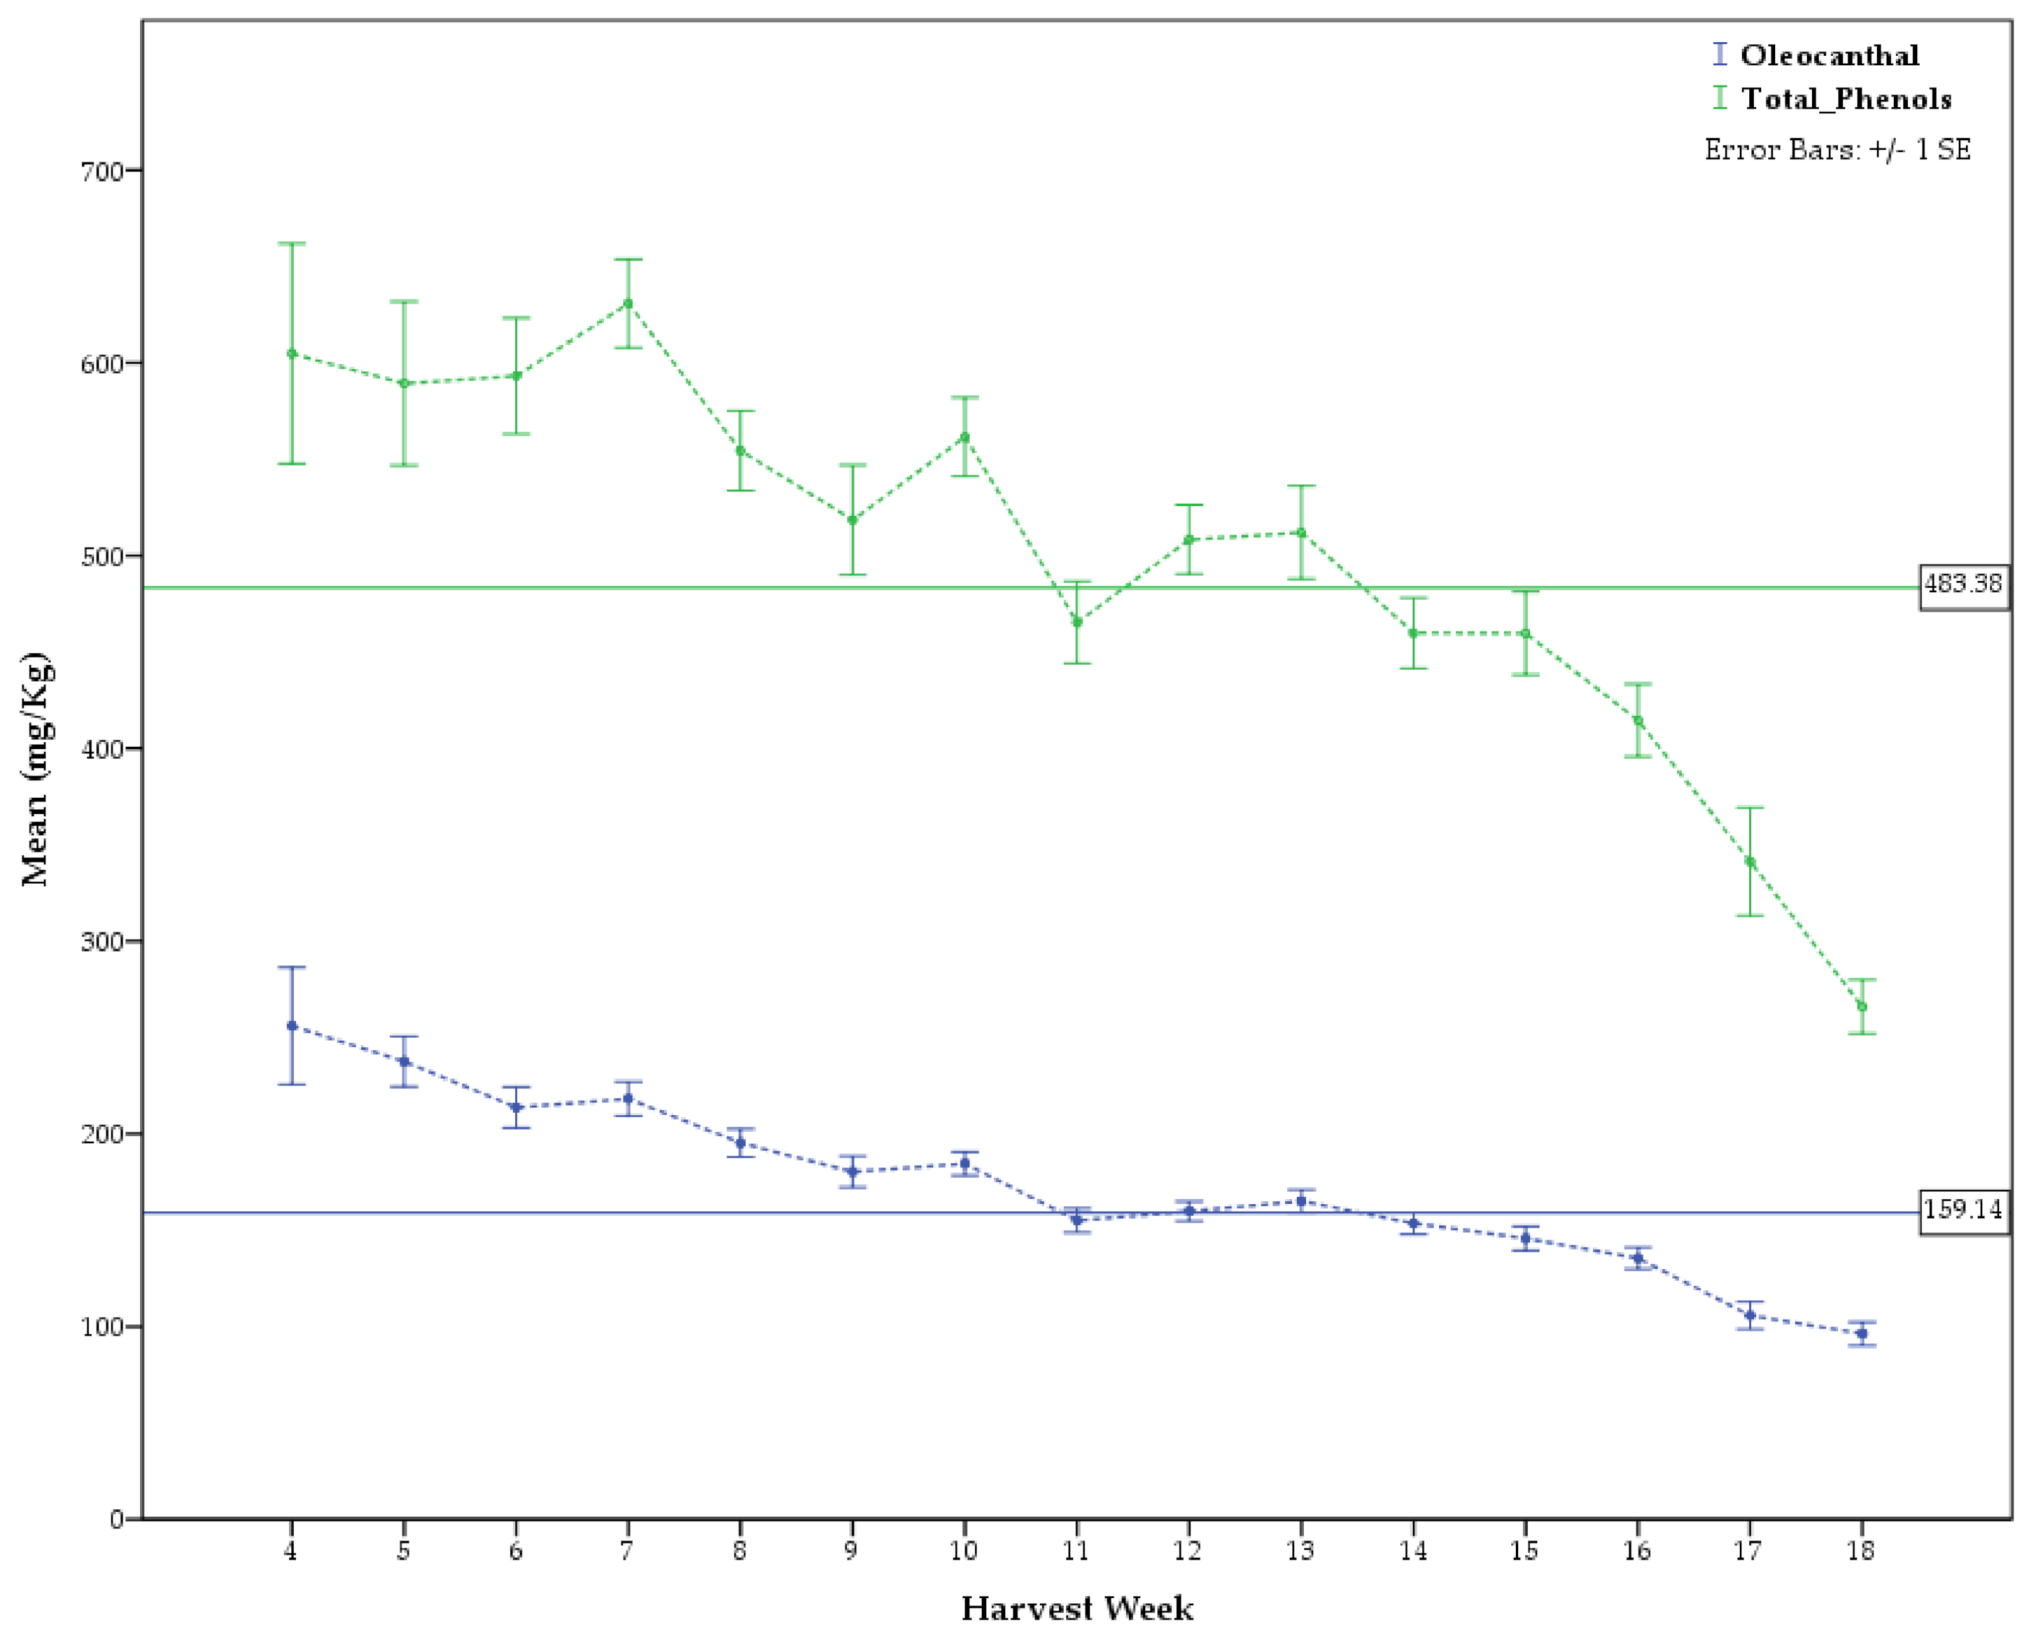
2.2. Differences among Months of Harvest
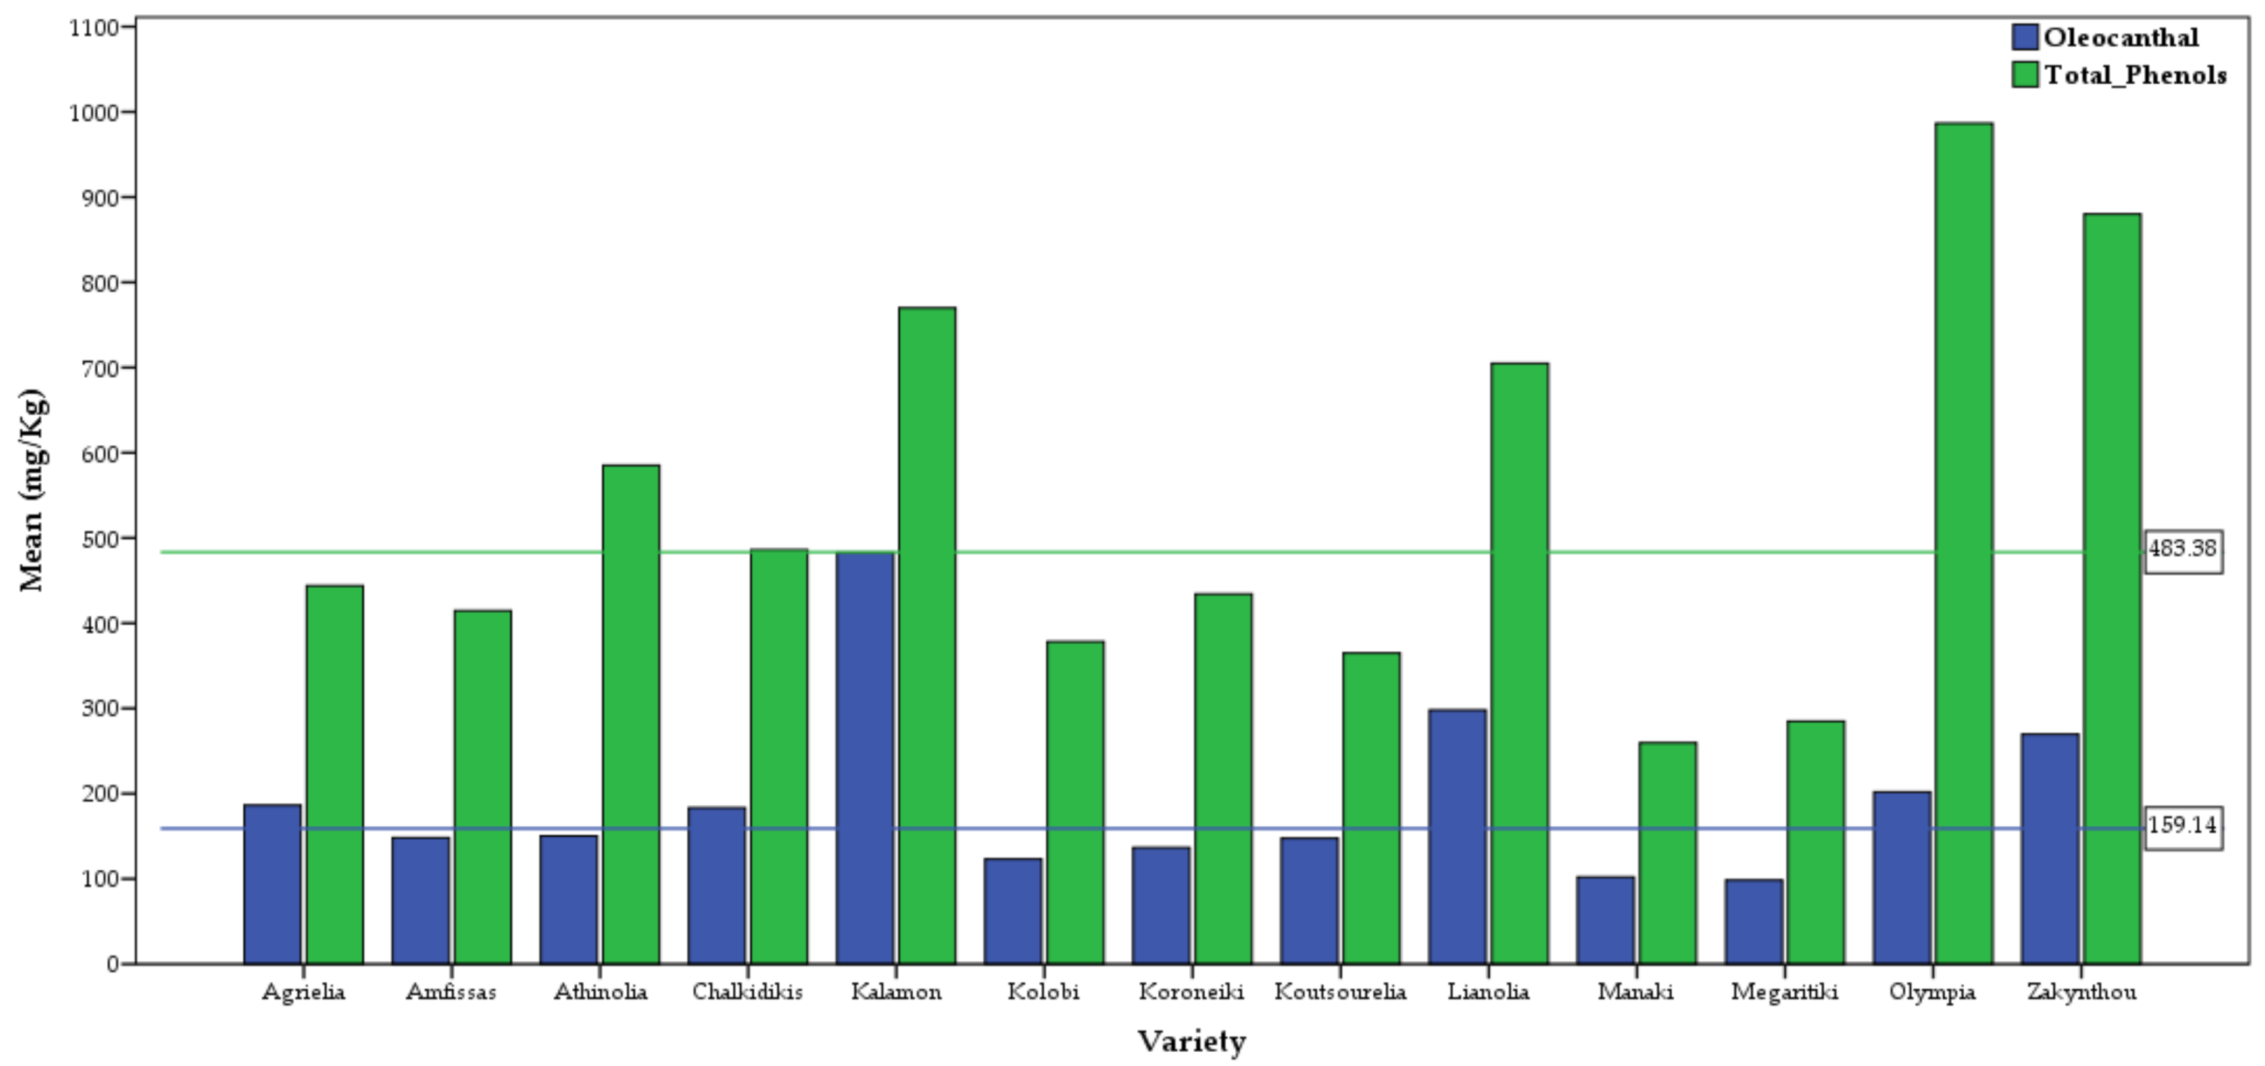
2.3. Differences among Varieties
2.4. Impact of Other Factors
2.5. Impact of Storage
2.6. Redefining the Olive Oil Classification According to Its Phenolic Content
2.7. Definition of Limits for High Phenolic Olive Oil
3. Materials and Methods
3.1. Chemicals and Standards
3.2. Instrumentation
3.3. Olive Oil Samples Origin
3.4. Olive Oil Extraction for Analysis
3.5. NMR Spectra Analysis
3.6. Phenolic Content Loss during Storage
3.7. Statistical Analysis
4. Conclusions
Supplementary Materials
Author Contributions
Funding
Institutional Review Board Statement
Informed Consent Statement
Data Availability Statement
Acknowledgments
Conflicts of Interest
Sample Availability
References
- Commission Regulation (EU) No 432/2012 of 16 May 2012 Establishing a List of Permitted Health Claims Made on Foods, Other than Those Referring to the Reduction of Disease Risk and to Children’s Development and HealthText with EEA Relevance. 40.
- Karkoula, E.; Skantzari, A.; Melliou, E.; Magiatis, P. Direct Measurement of Oleocanthal and Oleacein Levels in Olive Oil by Quantitative 1H NMR. Establishment of a New Index for the Characterization of Extra Virgin Olive Oils. J. Agric. Food Chem. 2012, 60, 11696–11703. [Google Scholar] [CrossRef]
- Karkoula, E.; Skantzari, A.; Melliou, E.; Magiatis, P. Quantitative Measurement of Major Secoiridoid Derivatives in Olive Oil Using QNMR. Proof of the Artificial Formation of Aldehydic Oleuropein and Ligstroside Aglycon Isomers. J. Agric. Food Chem. 2014, 62, 600–607. [Google Scholar] [CrossRef]
- Diamantakos, P.; Velkou, A.; Killday, K.; Gimisis, T.; Melliou, E.; Magiatis, P. Oleokoronal and Oleomissional: New Major Phenolic Ingredients of Extra Virgin Olive Oil. Olivae 2015, 122, 22–33. [Google Scholar]
- Tsolakou, A.; Diamantakos, P.; Kalaboki, I.; Mena-Bravo, A.; Priego-Capote, F.; Abdallah, I.M.; Kaddoumi, A.; Melliou, E.; Magiatis, P. Oleocanthalic Acid, a Chemical Marker of Olive Oil Aging and Exposure to a High Storage Temperature with Potential Neuroprotective Activity. J. Agric. Food Chem. 2018, 66, 7337–7346. [Google Scholar] [CrossRef] [PubMed]
- Angelis, A.; Antoniadi, L.; Stathopoulos, P.; Halabalaki, M.; Skaltsounis, L.A. Oleocanthalic and Oleaceinic Acids: New Compounds from Extra Virgin Olive Oil (EVOO). Phytochem. Lett. 2018, 26, 190–194. [Google Scholar] [CrossRef]
- Siddique, A.B.; Kilgore, P.C.S.R.; Tajmim, A.; Singh, S.S.; Meyer, S.A.; Jois, S.D.; Cvek, U.; Trutschl, M.; Sayed, K.A.E. (−)-Oleocanthal as a Dual c-MET-COX2 Inhibitor for the Control of Lung Cancer. Nutrients 2020, 12, 1749. [Google Scholar] [CrossRef]
- Siddique, A.B.; Ayoub, N.M.; Tajmim, A.; Meyer, S.A.; Hill, R.A.; El Sayed, K.A. (−)-Oleocanthal Prevents Breast Cancer Locoregional Recurrence After Primary Tumor Surgical Excision and Neoadjuvant Targeted Therapy in Orthotopic Nude Mouse Models. Cancers 2019, 11, 637. [Google Scholar] [CrossRef] [PubMed]
- Beauchamp, G.K.; Keast, R.S.J.; Morel, D.; Lin, J.; Pika, J.; Han, Q.; Lee, C.-H.; Smith, A.B.; Breslin, P.A.S. Ibuprofen-like Activity in Extra-Virgin Olive Oil. Nature 2005, 437, 45–46. [Google Scholar] [CrossRef] [PubMed]
- Al Rihani, S.B.; Darakjian, L.I.; Kaddoumi, A. Oleocanthal-Rich Extra-Virgin Olive Oil Restores the Blood–Brain Barrier Function through NLRP3 Inflammasome Inhibition Simultaneously with Autophagy Induction in TgSwDI Mice. ACS Chem. Neurosci. 2019, 10, 3543–3554. [Google Scholar] [CrossRef]
- Batarseh, Y.S.; Kaddoumi, A. Oleocanthal-rich extra-virgin olive oil enhances donepezil effect by reducing amyloid-β load and related toxicity in a mouse model of Alzheimer’s disease. J. Nutr. Biochem. 2018, 55, 113–123. [Google Scholar] [CrossRef]
- Grossi, C.; Rigacci, S.; Ambrosini, S.; Ed Dami, T.; Luccarini, I.; Traini, C.; Failli, P.; Berti, A.; Casamenti, F.; Stefani, M. The Polyphenol Oleuropein Aglycone Protects TgCRND8 Mice against Aß Plaque Pathology. PLoS ONE 2013, 8, e71702. [Google Scholar] [CrossRef]
- Filipek, A.; Czerwińska, M.E.; Kiss, A.K.; Wrzosek, M.; Naruszewicz, M. Oleacein Enhances Anti-Inflammatory Activity of Human Macrophages by Increasing CD163 Receptor Expression. Phytomedicine 2015, 22, 1255–1261. [Google Scholar] [CrossRef] [PubMed]
- Naruszewicz, M.; Czerwinska, M.; Kiss, A. Oleacein Translation from Mediterranean Diet to Potential Antiatherosclerotic Drug. Curr. Pharm. Des. 2015, 21, 1205–1212. [Google Scholar] [CrossRef]
- Czerwińska, M.; Kiss, A.K.; Naruszewicz, M. A Comparison of Antioxidant Activities of Oleuropein and Its Dialdehydic Derivative from Olive Oil, Oleacein. Food Chem. 2012, 131, 940–947. [Google Scholar] [CrossRef]
- Gutiérrez-Miranda, B.; Gallardo, I.; Melliou, E.; Cabero, I.; Álvarez, Y.; Magiatis, P.; Hernández, M.; Nieto, M.L. Oleacein Attenuates the Pathogenesis of Experimental Autoimmune Encephalomyelitis through Both Antioxidant and Anti-Inflammatory Effects. Antioxidants 2020, 9, 1161. [Google Scholar] [CrossRef] [PubMed]
- Agiomyrgianaki, A.; Petrakis, P.V.; Dais, P. Influence of Harvest Year, Cultivar and Geographical Origin on Greek Extra Virgin Olive Oils Composition: A Study by NMR Spectroscopy and Biometric Analysis. Food Chem. 2012, 135, 2561–2568. [Google Scholar] [CrossRef] [PubMed]
- Malheiro, R.; Rodrigues, N.; Pereira, J.A. Olive Oil Phenolic Composition as Affected by Geographic Origin, Olive Cultivar, and Cultivation Systems. In Olive and Olive Oil Bioactive Constituents; Elsevier: Amsterdam, The Netherlands, 2015; pp. 93–121. ISBN 978-1-63067-041-2. [Google Scholar]
- Tsolaki, M.; Lazarou, E.; Kozori, M.; Petridou, N.; Tabakis, I.; Lazarou, I.; Karakota, M.; Saoulidis, I.; Melliou, E.; Magiatis, P. A Randomized Clinical Trial of Greek High Phenolic Early Harvest Extra Virgin Olive Oil in Mild Cognitive Impairment: The MICOIL Pilot Study. J. Alzheimers Dis. 2020, 78, 801–817. [Google Scholar] [CrossRef] [PubMed]
- Agrawal, K.; Melliou, E.; Li, X.; Pedersen, T.L.; Wang, S.C.; Magiatis, P.; Newman, J.W.; Holt, R.R. Oleocanthal-Rich Extra Virgin Olive Oil Demonstrates Acute Anti-Platelet Effects in Healthy Men in a Randomized Trial. J. Funct. Foods 2017, 36, 84–93. [Google Scholar] [CrossRef]
- Gilani, A.H.; Khan, A.; Ghayur, M.N. Ca2+ Antagonist and Cholinergic Activities Explain the Medicinal Use of Olive in Gut Disorders. Nutr. Res. 2006, 26, 277–283. [Google Scholar] [CrossRef]
- Gilani, A.H.; Khan, A.-U.; Shah, A.J.; Connor, J.; Jabeen, Q. Blood Pressure Lowering Effect of Olive Is Mediated through Calcium Channel Blockade. Int. J. Food Sci. Nutr. 2005, 56, 613–620. [Google Scholar] [CrossRef]
- Perona, J. Virgin Olive Oil Reduces Blood Pressure in Hypertensive Elderly Subjects. Clin. Nutr. 2004, 23, 1113–1121. [Google Scholar] [CrossRef]
- Rozati, M.; Barnett, J.; Wu, D.; Handelman, G.; Saltzman, E.; Wilson, T.; Li, L.; Wang, J.; Marcos, A.; Ordovás, J.M.; et al. Cardio-Metabolic and Immunological Impacts of Extra Virgin Olive Oil Consumption in Overweight and Obese Older Adults: A Randomized Controlled Trial. Nutr. Metab. 2015, 12, 28. [Google Scholar] [CrossRef]
- Fitó, M.; Cladellas, M.; de la Torre, R.; Martí, J.; Alcántara, M.; Pujadas-Bastardes, M.; Marrugat, J.; Bruguera, J.; López-Sabater, M.C.; Vila, J.; et al. Antioxidant Effect of Virgin Olive Oil in Patients with Stable Coronary Heart Disease: A Randomized, Crossover, Controlled, Clinical Trial. Atherosclerosis 2005, 181, 149–158. [Google Scholar] [CrossRef]
- Moreno-Luna, R.; Muñoz-Hernandez, R.; Miranda, M.L.; Costa, A.F.; Jimenez-Jimenez, L.; Vallejo-Vaz, A.J.; Muriana, F.J.G.; Villar, J.; Stiefel, P. Olive Oil Polyphenols Decrease Blood Pressure and Improve Endothelial Function in Young Women with Mild Hypertension. Am. J. Hypertens. 2012. [Google Scholar] [CrossRef]
- Castañer, O.; Covas, M.-I.; Khymenets, O.; Nyyssonen, K.; Konstantinidou, V.; Zunft, H.-F.; de la Torre, R.; Muñoz-Aguayo, D.; Vila, J.; Fitó, M. Protection of LDL from Oxidation by Olive Oil Polyphenols Is Associated with a Downregulation of CD40-Ligand Expression and Its Downstream Products in Vivo in Humans. Am. J. Clin. Nutr. 2012, 95, 1238–1244. [Google Scholar] [CrossRef]
- Boskou, D. Sources of Natural Phenolic Antioxidants. Trends Food Sci. Technol. 2006, 17, 505–512. [Google Scholar]
- Aparicio, R.; Roda, L.; Albi, M.A.; Gutiérrez, F. Effect of Various Compounds on Virgin Olive Oil Stability Measured by Rancimat. J. Agric. Food Chem. 1999, 47, 4150–4155. [Google Scholar] [CrossRef] [PubMed]
- Nikou, T.; Liaki, V.; Stathopoulos, P.; Sklirou, A.D.; Tsakiri, E.N.; Jakschitz, T.; Bonn, G.; Trougakos, I.; Halabalaki, M.; Skaltsounis, A.L. Comparison survey of EVOO polyphenols and exploration of healthy aging-promoting properties of oleocanthal and oleacein. Food Chem. Toxicol. 2019, 125, 403–412. [Google Scholar] [CrossRef] [PubMed]
- García-Rodríguez, R.; Belaj, A.; Romero-Segura, C.; Sanz, C.; Pérez, A.G. Exploration of Genetic Resources to Improve the Functional Quality of Virgin Olive Oil. J. Funct. Foods 2017, 38, 1–8. [Google Scholar] [CrossRef]
- Klikarová, J.; Rotondo, A.; Cacciola, F.; Česlová, L.; Dugo, P.; Mondello, L.; Rigano, F. The Phenolic Fraction of Italian Extra Virgin Olive Oils: Elucidation Through Combined Liquid Chromatography and NMR Approaches. Food Anal. Methods 2019, 12, 1759–1770. [Google Scholar] [CrossRef]
- Miho, H.; Díez, C.M.; Mena-Bravo, A.; Sánchez de Medina, V.; Moral, J.; Melliou, E.; Magiatis, P.; Rallo, L.; Barranco, D.; Priego-Capote, F. Cultivar Influence on Variability in Olive Oil Phenolic Profiles Determined through an Extensive Germplasm Survey. Food Chem. 2018, 266, 192–199. [Google Scholar] [CrossRef]
- Miho, H.; Moral, J.; Barranco, D.; Ledesma-Escobar, C.A.; Priego-Capote, F.; Díez, C.M. Influence of genetic and interannual factors on the phenolic profiles of virgin olive oils. Food Chem. 2021, 342, 128357. [Google Scholar] [CrossRef]
- Diamantakos, P.; Giannara, T.; Skarkou, M.; Melliou, E.; Magiatis, P. Influence of Harvest Time and Malaxation Conditions on the Concentration of Individual Phenols in Extra Virgin Olive Oil Related to Its Healthy Properties. Molecules 2020, 25, 2449. [Google Scholar] [CrossRef]
- Jolayemi, O.S.; Tokatli, F.; Ozen, B. Effects of Malaxation Temperature and Harvest Time on the Chemical Characteristics of Olive Oils. Food Chem. 2016, 211, 776–783. [Google Scholar] [CrossRef] [PubMed]
- Lukić, I.; Krapac, M.; Horvat, I.; Godena, S.; Kosić, U.; Brkić Bubola, K. Three-Factor Approach for Balancing the Concentrations of Phenols and Volatiles in Virgin Olive Oil from a Late-Ripening Olive Cultivar. LWT 2018, 87, 194–202. [Google Scholar] [CrossRef]
- Lukić, I.; Žanetić, M.; Jukić Špika, M.; Lukić, M.; Koprivnjak, O.; Brkić Bubola, K. Complex Interactive Effects of Ripening Degree, Malaxation Duration and Temperature on Oblica Cv. Virgin Olive Oil Phenols, Volatiles and Sensory Quality. Food Chem. 2017, 232, 610–620. [Google Scholar] [CrossRef] [PubMed]
- Jiménez, B.; Sánchez-Ortiz, A.; Rivas, A. Influence of the Malaxation Time and Olive Ripening Stage on Oil Quality and Phenolic Compounds of Virgin Olive Oils. Int. J. Food Sci. Technol. 2014, 49, 2521–2527. [Google Scholar] [CrossRef]
- Romero, N.; Saavedra, J.; Tapia, F.; Sepúlveda, B.; Aparicio, R. Influence of Agroclimatic Parameters on Phenolic and Volatile Compounds of Chilean Virgin Olive Oils and Characterization Based on Geographical Origin, Cultivar and Ripening Stage: Effect of Agroclimatic Parameters on Compounds Responsible for the Flavor of EVOO. J. Sci. Food Agric. 2016, 96, 583–592. [Google Scholar] [CrossRef]
- Youssef, N.B.; Zarrouk, W.; Carrasco-Pancorbo, A.; Ouni, Y.; Segura-Carretero, A.; Fernández-Gutiérrez, A.; Daoud, D.; Zarrouk, M. Effect of Olive Ripeness on Chemical Properties and Phenolic Composition of Chétoui Virgin Olive Oil: Influence of Fruit Maturity Stage on Chétoui Olive Oil Quality. J. Sci. Food Agric. 2010, 90, 199–204. [Google Scholar] [CrossRef]
- Baccouri, O.; Guerfel, M.; Baccouri, B.; Cerretani, L.; Bendini, A.; Lercker, G.; Zarrouk, M.; Daoud Ben Miled, D. Chemical Composition and Oxidative Stability of Tunisian Monovarietal Virgin Olive Oils with Regard to Fruit Ripening. Food Chem. 2008, 109, 743–754. [Google Scholar] [CrossRef]
- Armitage, P.; Geoffrey, B.; Matthews, J.N.S. Statistical Methods in Medical Research, 4th ed.; Wiley-Blackwell: Hoboken, NJ, USA, 2001; ISBN 978-0-632-05257-8. [Google Scholar]
- Koerbin, G.; Abhayaratna, W.P.; Potter, J.M.; Apple, F.S.; Jaffe, A.S.; Ravalico, T.H.; Hickman, P.E. Effect of Population Selection on 99th Percentile Values for a High Sensitivity Cardiac Troponin I and T Assays. Clin. Biochem. 2013, 46, 1636–1643. [Google Scholar] [CrossRef] [PubMed]
- Fraser, C.G.; Kallner, A.; Kenny, D.; Petersen, P.H. Introduction: Strategies to Set Global Quality Specifications in Laboratory Medicine. Scand. J. Clin. Lab. Investig. 1999, 59, 477–478. [Google Scholar] [CrossRef] [PubMed]
- Ialongo, C. Confidence Interval for Quantiles and Percentiles. Biochem. Medica 2019, 29, 5–17. [Google Scholar] [CrossRef] [PubMed]


| Substance | Maximum | Mean | Std. Deviation |
|---|---|---|---|
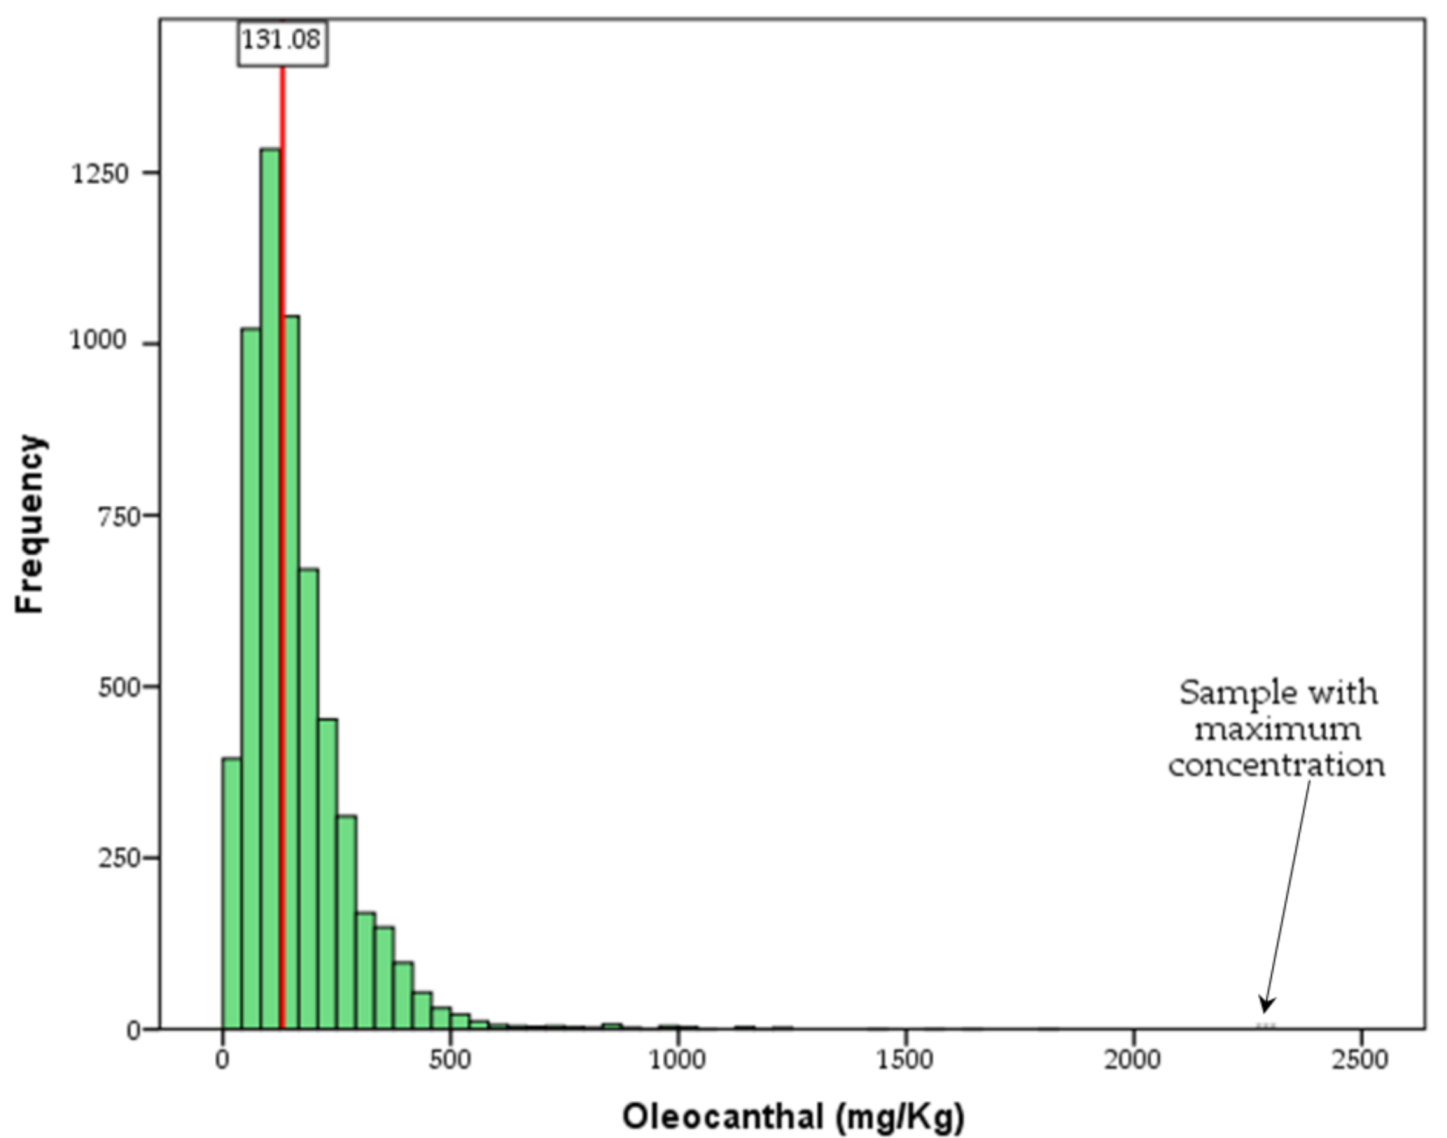
| Oleocanthal | 2275 | 159 | 124 |
| Oleacein | 1046 | 94 | 81 |
| Oleocanthal + Oleacein (D1 index) | 3322 | 244 | 191 |
| Oleuropein Aglycon | 618 | 40 | 43 |
| Ligstroside Aglycon | 530 | 36 | 36 |
| Dialdehyde Ligstroside Aglycon | 1559 | 93 | 115 |
| Dialdehyde Oleuropein Aglycon | 867 | 56 | 82 |
| Total Tyrosol Derivatives | 2745 | 286 | 209 |
| Total Hydroxy Tyrosol Derivatives | 1519 | 189 | 165 |
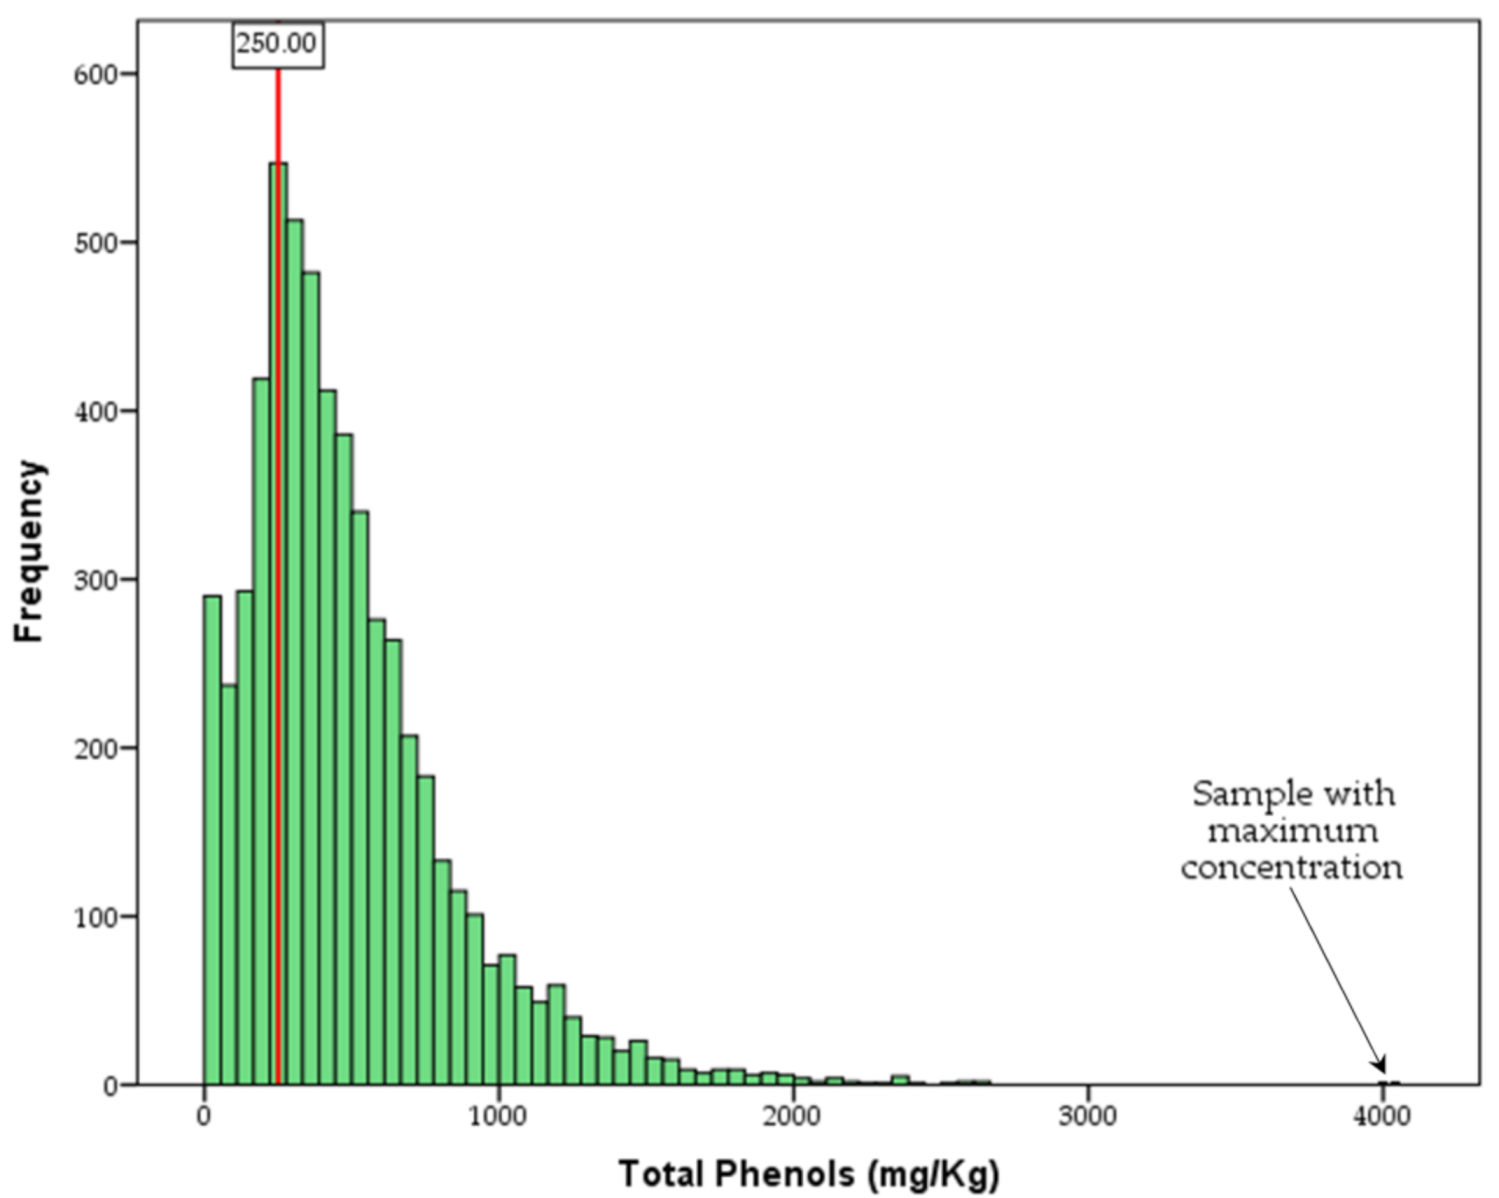
| Total Phenols | 4003 | 483 | 357 |
| Harvest Month | n | Subset for Oleocanthal | Subset for Total Phenols | |||||
|---|---|---|---|---|---|---|---|---|
| 1 | 2 | 3 | 4 | 1 | 2 | 3 | ||
| September | 163 | 273.25 | 645.58 | |||||
| October | 948 | 210.85 | 595.81 | |||||
| November | 1327 | 168.02 | 515.53 | |||||
| December | 922 | 133.12 | 404.51 | |||||
| January | 80 | 117.13 | 344.92 | |||||
| Variety | n | Subset | |||||
|---|---|---|---|---|---|---|---|
| 1 | 2 | 3 | 4 | 5 | 6 | ||
| Kalamon | 59 | 482.6 | |||||
| Lianolia Kerkyras | 350 | 297.9 | |||||
| Zakynthou | 44 | 269.6 | |||||
| Olympia | 260 | 202.0 | |||||
| Agrielia (wild) | 164 | 186.5 | |||||
| Chalkidikis | 362 | 183.5 | |||||
| Athinolia | 260 | 150.3 | |||||
| Amfissas | 276 | 148.3 | |||||
| Koutsourelia | 189 | 147.7 | |||||
| Koroneiki | 2649 | 136.8 | |||||
| Kolovi | 40 | 123.2 | 123.2 | ||||
| Manaki | 261 | 102.1 | |||||
| Megaritiki | 81 | 98.4 | |||||
| Variety | n | Subset | |||||||
|---|---|---|---|---|---|---|---|---|---|
| 1 | 2 | 3 | 4 | 5 | 6 | 7 | 8 | ||
| Olympia | 260 | 986.4 | |||||||
| Zakynthou | 44 | 880.0 | |||||||
| Kalamon | 59 | 769.9 | |||||||
| Lianolia Kerkyras | 350 | 704.9 | |||||||
| Athinolia | 260 | 585.2 | |||||||
| Chalkidikis | 362 | 486.1 | |||||||
| Agrielia (wild) | 164 | 444.0 | 444.0 | ||||||
| Koroneiki | 2649 | 434.3 | 434.3 | ||||||
| Amfissas | 276 | 414.7 | 414.7 | ||||||
| Kolovi | 40 | 378.3 | |||||||
| Koutsourelia | 189 | 364.8 | 364.8 | ||||||
| Megaritiki | 81 | 285.0 | 285.0 | ||||||
| Manaki | 261 | 259.6 | |||||||
| Percentiles (%) | Oleocanthal | Oleacein | Sum Oleocanthal Oleacein | Oleuropein Aglycon | Ligstroside Aglycon | Dialdehyde Ligstroside Aglycon | Dialdehyde Oleuropein Aglycon | Total Tyrosol Derivatives | Total Hydroxy Tyrosol Derivatives | Total Phenols |
|---|---|---|---|---|---|---|---|---|---|---|
| 5 | 34.00 | 0.00 | 19.00 | 0.00 | 0.00 | 0.00 | 0.00 | 39.54 | 0.00 | 54.44 |
| 10 | 52.00 | 7.97 | 51.04 | 0.00 | 0.00 | 0.00 | 0.00 | 73.89 | 22.58 | 119.58 |
| 15 | 64.26 | 29.64 | 79.09 | 11.50 | 11.28 | 0.00 | 0.00 | 101.62 | 46.73 | 174.04 |
| 20 | 74.15 | 36.48 | 101.96 | 14.31 | 13.61 | 0.00 | 0.00 | 125.70 | 63.30 | 212.13 |
| 25 | 84.03 | 41.61 | 120.34 | 17.00 | 16.75 | 0.00 | 0.00 | 145.76 | 77.29 | 244.21 |
| 30 | 93.92 | 48.44 | 135.86 | 20.59 | 19.18 | 13.61 | 0.00 | 164.46 | 90.99 | 271.87 |
| 35 | 102.16 | 53.57 | 151.97 | 22.92 | 21.62 | 32.22 | 0.00 | 182.04 | 106.28 | 303.92 |
| 40 | 112.04 | 60.21 | 167.63 | 25.24 | 22.92 | 41.53 | 14.31 | 202.19 | 119.63 | 334.05 |
| 45 | 120.28 | 65.53 | 184.37 | 28.92 | 25.24 | 50.84 | 24.05 | 221.66 | 134.87 | 365.77 |
| 50 | 131.08 | 73.39 | 201.80 | 31.36 | 28.01 | 60.15 | 28.92 | 242.53 | 150.96 | 402.23 |
| 55 | 141.70 | 80.92 | 219.69 | 33.79 | 30.22 | 71.78 | 36.23 | 264.23 | 167.97 | 441.17 |
| 60 | 153.24 | 88.00 | 239.47 | 36.23 | 33.79 | 85.75 | 43.53 | 288.33 | 186.53 | 482.27 |
| 65 | 168.07 | 98.76 | 261.10 | 41.10 | 36.88 | 97.38 | 53.27 | 313.32 | 206.24 | 526.88 |
| 70 | 182.89 | 109.97 | 287.15 | 44.00 | 41.10 | 114.76 | 63.01 | 341.99 | 229.00 | 576.63 |
| 75 | 202.20 | 123.64 | 318.44 | 50.48 | 45.97 | 132.29 | 77.30 | 376.61 | 255.94 | 638.81 |
| 80 | 224.09 | 140.73 | 357.45 | 55.71 | 50.84 | 153.23 | 92.23 | 415.67 | 286.02 | 706.22 |
| 85 | 253.02 | 162.95 | 411.26 | 65.45 | 57.82 | 183.48 | 116.58 | 470.92 | 327.67 | 796.62 |
| 90 | 294.94 | 200.55 | 484.81 | 80.06 | 69.46 | 227.69 | 153.11 | 546.19 | 390.71 | 933.94 |
| 95 | 367.44 | 254.45 | 601.77 | 109.01 | 94.18 | 323.10 | 223.72 | 667.57 | 516.10 | 1189.71 |
Publisher’s Note: MDPI stays neutral with regard to jurisdictional claims in published maps and institutional affiliations. |
© 2021 by the authors. Licensee MDPI, Basel, Switzerland. This article is an open access article distributed under the terms and conditions of the Creative Commons Attribution (CC BY) license (http://creativecommons.org/licenses/by/4.0/).
Share and Cite
Diamantakos, P.; Ioannidis, K.; Papanikolaou, C.; Tsolakou, A.; Rigakou, A.; Melliou, E.; Magiatis, P. A New Definition of the Term “High-Phenolic Olive Oil” Based on Large Scale Statistical Data of Greek Olive Oils Analyzed by qNMR. Molecules 2021, 26, 1115. https://doi.org/10.3390/molecules26041115
Diamantakos P, Ioannidis K, Papanikolaou C, Tsolakou A, Rigakou A, Melliou E, Magiatis P. A New Definition of the Term “High-Phenolic Olive Oil” Based on Large Scale Statistical Data of Greek Olive Oils Analyzed by qNMR. Molecules. 2021; 26(4):1115. https://doi.org/10.3390/molecules26041115
Chicago/Turabian StyleDiamantakos, Panagiotis, Kostas Ioannidis, Christos Papanikolaou, Annia Tsolakou, Aimilia Rigakou, Eleni Melliou, and Prokopios Magiatis. 2021. "A New Definition of the Term “High-Phenolic Olive Oil” Based on Large Scale Statistical Data of Greek Olive Oils Analyzed by qNMR" Molecules 26, no. 4: 1115. https://doi.org/10.3390/molecules26041115
APA StyleDiamantakos, P., Ioannidis, K., Papanikolaou, C., Tsolakou, A., Rigakou, A., Melliou, E., & Magiatis, P. (2021). A New Definition of the Term “High-Phenolic Olive Oil” Based on Large Scale Statistical Data of Greek Olive Oils Analyzed by qNMR. Molecules, 26(4), 1115. https://doi.org/10.3390/molecules26041115