
Article

Architecting Micro-Market Resilience: A Signal–Belief–Decision Framework for E-Commerce Platforms

School of Economics and Management, Southeast University, Nanjing 210096, China
*
Author to whom correspondence should be addressed.
J. Theor. Appl. Electron. Commer. Res. 2026, 21(6), 169; https://doi.org/10.3390/jtaer21060169
Submission received: 6 March 2026 / Revised: 18 May 2026 / Accepted: 25 May 2026 / Published: 28 May 2026
(This article belongs to the Section Digital Business, Governance, and Sustainability)

Abstract

The era of zero-sum competition calls for e-commerce platforms to shift focus toward micro-market resilience. Existing research has split into two traditions: diagnostic studies offer detailed analyses of market failure but lack systemic application, while engineering studies develop deployable tools yet suffer from opaque mechanisms and hidden risks. This paper proposes the Signal–Belief–Decision (SBD) framework to bridge this divide, with the Signal layer transforming private information into verifiable public knowledge, the Belief layer aggregating dispersed signals into shared consensus, and the Decision layer encoding enforceable rules for incentive compatibility. Using an extended signaling game, we diagnose six vulnerability dimensions (VD1–VD6) that destabilize markets. Agent-based modeling then allows us to distill four design principles (DP1–DP4) that inform governance configuration. The SBD framework provides a middle-range theoretical architecture that reorients platform governance from reactive tooling to proactive, consumer-centric design.

1. Introduction

Since eBay and Amazon pioneered the modern e-commerce model in the late 1990s, platform economics has reshaped global retail through network effects and two-sided markets [1]. In China, the launch of Taobao in 2003 marked the explosive rise in domestic e-commerce. Subsequently, platforms such as JD.com, Pinduoduo, and Douyin E-commerce adopted differentiated competitive strategies—including self-operated logistics, social fission, and content driven engagement—to rapidly accumulate massive user bases and gradually carve up the vast domestic market [2,3,4].
However, as internet penetration approaches saturation, the industry has entered a phase of zero-sum competition, with several verticals even witnessing the formation of monopolistic platforms [5,6]. The early customer acquisition strategies, although effective in driving short-term explosive user growth, can no longer support the demands of refined operations and long-term user retention [7,8]. Consequently, both practitioners and academics increasingly call for a more robust and longer cycle governance logic, namely consolidating existing user groups at the micro-market level to generate sustainable profit streams, rather than relying solely on traffic expansion.
Parallel to this practical challenge, academic research has diverged into two paths. The diagnostic path, rooted in information economics, uses signaling games [9,10,11] and empirical methods [12,13,14,15] to explain how information asymmetry and bounded rationality cause market fragility. The engineering path, emerging from information systems, develops governance tools such as reputation systems, blockchain traceability, and AI assistants [16,17,18]. Although both paths fundamentally describe the same transaction process, the diagnostic path leans toward a micro-level consumer perspective, whereas the engineering path focuses on platform management and control. This theoretical divide calls for a meso-level systematic integration framework.
Drawing on signaling theory [10,19], we propose the Signal–Belief–Decision (SBD) framework to bridge this gap. For consumers, the framework maps onto three sequential stages: interpreting multidimensional market information (Signal), forming subjective cognition about product quality (Belief), and translating beliefs into purchase action (Decision). For platform managers, the framework mirrors these stages with corresponding governance responsibilities: ensuring that market data is verifiable (Signal), helping participants converge on shared consensus (Belief), and providing enforceable assurance for transactions (Decision). By aligning both perspectives onto a common architecture, the SBD framework reveals the structural isomorphism between the diagnostic and engineering paths.
Accordingly, we develop and test the SBD framework through an integrated methodology. We first employ an extended signaling game, systematically relaxing its ideal assumptions to diagnose inherent market fragilities. This yields six Vulnerability Dimensions that directly motivate the three SBD layers. Recognizing that real markets involve heterogeneous, boundedly rational agents, we then use agent-based modeling to simulate governance configurations under realistic conditions, from which we derive four Design Principles. Illustrative cases are provided at the end of both Section 3 and Section 4 to help demonstrate the framework’s real-world applicability.
This study makes two primary contributions. First, we propose a middle-range theoretical architecture—the Signal–Belief–Decision (SBD) framework—that systematically bridges the diagnostic and engineering paths in platform governance. By mapping the consumer’s decision journey onto corresponding governance functions, the framework provides a unified conceptual language for analyzing micro-market fragility and designing layered interventions. Second, we translate this architecture into actionable guidance by identifying six Vulnerability Dimensions (VD1–VD6) that pinpoint the precise sources of market failure and four Design Principles (DP1–DP4) that reveal the specialization, synergy, and boundedness of governance tools.
Beyond these, the study offers two additional refinements. For information economics, we systematically relax the ideal assumptions of the canonical signaling game, providing a clear template for examining market outcomes under alternative behavioral deviations; and our distinction between consumers’ subjective posterior beliefs and objective Bayesian posteriors creates analytical space for boundedly rational agents. For strategic management research, we apply the SBD lens to reinterpret the evolutionary trajectories of leading platforms in China, showing how platforms can launch governance from different layers and why integration becomes necessary over time—offering a novel consumer-centric explanation of observed strategic choices.

2. Literature Review

E-commerce platforms have gradually overtaken offline retail through their distinctive network effects and transcendence of time and space. Yet this organizational triumph has been accompanied by more acute information asymmetry, trust deficits, and market failures. In response to this paradox, existing research has developed along two distinct paths: theoretical diagnosis and practical engineering, yielding rich but fragmented insights. This chapter systematically reviews these two streams and, on this basis, articulates the necessity and direction of integration.

2.1. Divergent Paths: Diagnosis and Engineering

Information economics provides core tools for understanding platform market fragility caused by information asymmetry. Akerlof’s (1970) [9] “market for lemons” and Spence’s (1973) [10] signaling game reveal the consequences of quality uncertainty and the signaling mechanisms to mitigate it. Subsequent research has refined this path by extending game structures to capture complex signaling strategies [11,20,21,22], or by employing empirical methods to test signal effectiveness in real transactions [12,13,14,15]. This diagnostic path adopts a micro-level consumer perspective. It is logically rigorous, yet it relies on strong assumptions (perfect rationality, common knowledge) and simplifies real-world heterogeneity and dynamics. Consequently, it captures only local interactions and falls short of addressing the complexity of actual platform ecosystems.
In parallel, information systems research has focused on developing concrete governance tools. Early work centered on reputation and feedback mechanisms [16,23,24]. And recent studies have turned to emerging technologies such as blockchain and artificial intelligence, exploring their applications in product traceability, smart contracts, and fraud detection [17,25,26]. This engineering path takes a macro-level manager perspective, oriented toward platform-wide performance metrics (e.g., transaction volume, dispute rates). Its tools are practical, but their internal mechanisms are often opaque: the interaction effects and boundary conditions among different tools remain systematically unexplored. Improper application may lead to unintended consequences such as algorithmic manipulation and signal conflicts.
These two paths emphasize causal explanation and performance improvement respectively. The former offers transparent causal logic at the cost of predictive power over complex systems; the latter delivers practical effectiveness at the risk of opaque mechanisms and potential side effects. Although their underlying logics appear incompatible, research has shown signs of convergence [17,27], such as studies on how specific tools or rules affect consumer behavior, calling for a meso-level framework to reconcile the two.

2.2. Integrative Potential: Horizontal and Vertical

Despite their divergent methodologies, the two research streams exhibit a striking convergence in their substantive focus. As signaling theory [10,19] suggests, existing research has extensively investigated the value of market signals, the formation of consumer beliefs, and the drivers of purchase decisions, generating rich but fragmented insights.
The diagnostic path, rooted in a consumer-centric perspective, offers direct contributions to this decision sequence. One strand of studies examines information, that is, what objective facts such as certifications and product specifications can reduce initial quality uncertainty [13,20,28]. Another strand focuses on cognition, investigating how consumers process, bias, or distort signals under bounded rationality [12,29,30]. A third strand addresses action, exploring what triggers consumers to finally purchase or abandon the cart [31,32,33]. Together, information, cognition, and action capture the full arc of consumer decision-making under uncertainty.
The engineering path, taking a platform manager’s perspective, exhibits a similar processual structure but with a different emphasis. Its governance tools can be grouped into three functional layers. The data layer includes mechanisms like blockchain, traceability systems, and supply chain integration that establish verifiable facts [25,27,34]. The consensus layer comprises reputation systems, AI recommendations, and social proof aggregators that transform dispersed signals into shared beliefs [17,18,24]. The assurance layer covers escrow services, refund policies, and smart contracts that provide incentive-compatible guarantees to facilitate transactions [35,36,37]. Thus, data, consensus, and assurance represent the platform’s corresponding governance capabilities.
Recognizing this convergence, several studies have attempted to integrate the two paths. Some focus on holistic integration within each path, such as the classical stimulus–organism–response (SOR) framework or blockchain-based multi-layer solutions [18,38]. Others attempt to bridge the two paths using models like technology acceptance model (TAM), yet they lack stage-by-stage operationalization [39,40]. Building on these foundations, this paper provides a more systematic integration as the Signal–Belief–Decision (SBD) framework, summarized in Table 1. Horizontally, it maps the diagnostic and engineering paths onto a unified signaling theory perspective. Vertically, it unfolds them into three distinct stages that correspond respectively to the parallel dimensions of the two paths. Section 3 formally derives this framework by diagnosing the real-world vulnerabilities of classical signaling theory, and Section 4 validates its design principles through agent-based modeling.

3. Theoretical Foundations and Vulnerability Diagnosis

This chapter employs an extended signaling game [10,41] to diagnose the inherent fragility of platform markets. By systematically relaxing the game’s ideal assumptions, we identify six Vulnerability Dimensions (VD1–VD6) that collectively undermine market stability. These dimensions directly motivate the three-layered SBD framework as a governance response, which we briefly illustrate using real-world platform practices.

3.1. Signaling Game

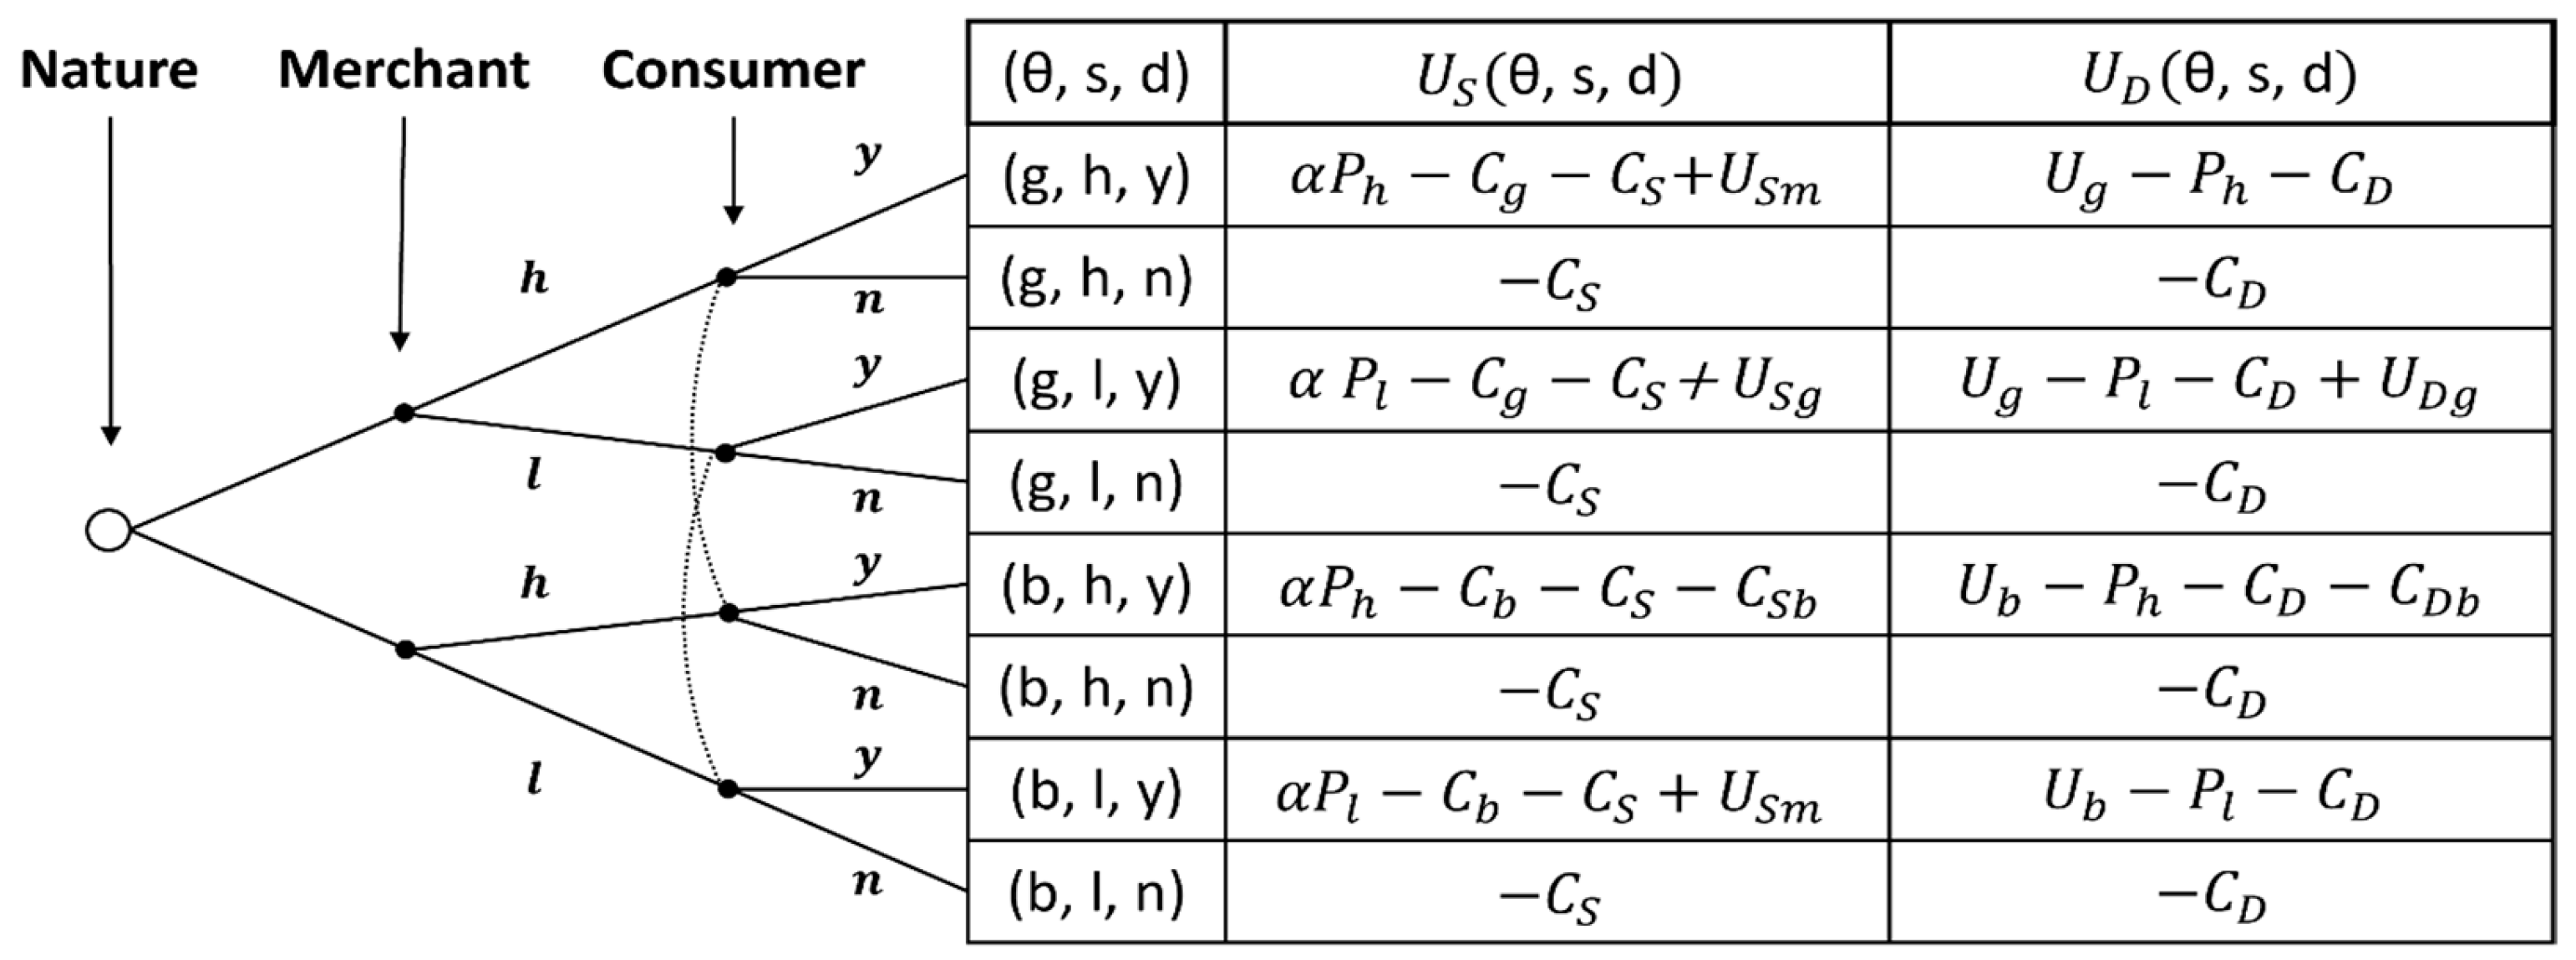
We develop an extended signaling game to capture the core strategic interactions among three key actors in an e-commerce market: Merchants (S, the sender) who possess private information about product quality, θ ∈ {g: high, b: low}; Consumers (D, the receiver) who observe price signals s ∈ {h: high, l: low} and form beliefs; and the Platform (E), modeled as a proactive governor that designs market rules without engaging directly in transactions.
The payoff functions, parameterized in Table 2, reflect core managerial trade-offs. A merchant’s profit incorporates sales revenue (share α of the price PS), fixed operating costs CS, type-dependent production cost Cθ (where Cg > Cb, manifesting the information asymmetry), and platform-mediated incentives U (e.g., reputation benefits or traffic support that reward aligned signaling). A consumer’s utility is derived from the difference between their perceived value for the product Uθ (Ug > Ub) and the price paid PS, net of a search cost CD and potential utility shocks U (e.g., disappointment CDb from quality overestimation). Figure 1 delineates the complete sequence of this dynamic, from the platform’s rule-setting to the final payoff settlement.

3.2. Equilibrium Analysis

As a dynamic game of incomplete information, the signaling game is solved for its Perfect Bayesian Equilibrium (PBE), which requires sequential rationality and belief consistency, with backward induction. To better capture decision-making in real-world environments, we introduce an intermediate variable, the consumer’s subjective posterior belief p ~ (θ|s), which represents their assessment of quality probability after observing the price signal. The PBE conditions are thus formalized as follows:
Consumer Optimality: The purchase decision must be optimal given the subjective belief p ~ (θ|s):
d * ( s ) arg max d { y , n } θ p ˜ ( θ | s ) U D ( θ , s , d )
Merchant Optimality: The price signal must be optimal, anticipating the consumer’s decision rule d*(s):
s * ( θ ) arg max s { h , l } U S ( θ , s , d * ( s ) )
Belief Consistency: On the equilibrium path, the subjective belief must coincide with the Bayesian posterior derived from the equilibrium strategy:
p ˜ ( θ | s ) μ ( θ | s )
The solution process is as follows: First, derive the consumer’s decision rule from Formula (1) for any given belief p ~ . Second, determine the merchant’s optimal signaling strategy from Formula (2), given d*(s). Finally, impose belief consistency Formula (3) to ensure that beliefs are justified by the strategies.
This process yields six distinct PBEs, categorized in Table 3. These equilibria can be interpreted from two complementary perspectives. At the micro-level, an equilibrium requires an individual consumer’s belief p ~ to justify their action, which must in turn be incentive-compatible for an individual merchant. At the macro-level, a stable market outcome emerges only when a population of consumers holding coherent beliefs interacts with a segment of merchants for whom the corresponding strategy is profitable, with the entire configuration satisfying Bayesian consistency.
The failure of any condition—a misaligned belief, an unprofitable deviation, or an inconsistent update—can cause the equilibrium to collapse or shift to an inferior state. Thus, even under idealized assumptions, the market equilibrium is intrinsically fragile, setting the stage for diagnosing the vulnerabilities that arise when real-world conditions depart from these ideals.

3.3. Vulnerability Dimensions

The equilibrium analysis reveals that market stability hinges on a precise alignment of stringent conditions. Real-world platform markets systematically violate these ideal assumptions. We therefore diagnose six fundamental Vulnerability Dimensions (VDs), each mapping directly onto a failure in the PBE solution conditions (against Formulas (1)–(3)).
VD1: Information Asymmetry & Opaque Payoffs. Core payoff parameters—merchant cost Cθ and platform incentives U—are private. This opacity prevents consumers from accurately interpreting price signals, undermining the informational foundation for rational decision-making (against Formula (1)).
VD2: Bounded Rationality & Cognitive Shortcuts. Perfect Bayesian updating is computationally prohibitive. Consumers instead rely on heuristics (e.g., “low price signals low quality”), causing subjective beliefs p ~ (θ|s) to deviate systematically from the rational benchmark. This impedes convergence to any efficient separating equilibrium (against Formula (3)).
VD3: Belief Misalignment & Trust Deficits. The systematic biases in belief updating (VD2) prevent consumers’ subjective beliefs p ~ (θ|s) from aligning with the beliefs μ(θ|s) that merchants anticipate in equilibrium. This misalignment, rooted in distrust, invalidates the merchant’s expected payoff calculations and disrupts the strategic foundation of the equilibrium (against Formula (1) and (3)).
VD4: Goal Divergence & Multiple Motives. The unitary goal assumption is violated: merchants may prioritize market share, while consumers may buy for social identity or impulse. This divergence of objective functions directly undermines the incentive-compatibility conditions essential for equilibrium strategies (against Formulas (1) and (2)).
VD5: Coordination Failure & Multiple Equilibria. The model admits multiple equilibria. The platform prefers a specific one, but the system’s complexity makes it difficult to coordinate all participants toward this focal point. Consequently, the market remains vulnerable to being locked into a suboptimal state.
VD6: Dimensionality Explosion & Dynamic Learning. The static model is overly simplified for real market contexts. Introducing more complex agent compositions, action rules, and dynamic learning would geometrically increase solution complexity, and the resulting equilibrium would likely drift or collapse.
In summary, platform market vulnerability arises from systematic deviations across information, cognition, and motivation. This diagnostic framework identifies six precise intervention targets (VD1–VD6), which directly motivate the three-layered Signal–Belief–Decision (SBD) governance framework to be introduced next.

3.4. The Signal–Belief–Decision Framework

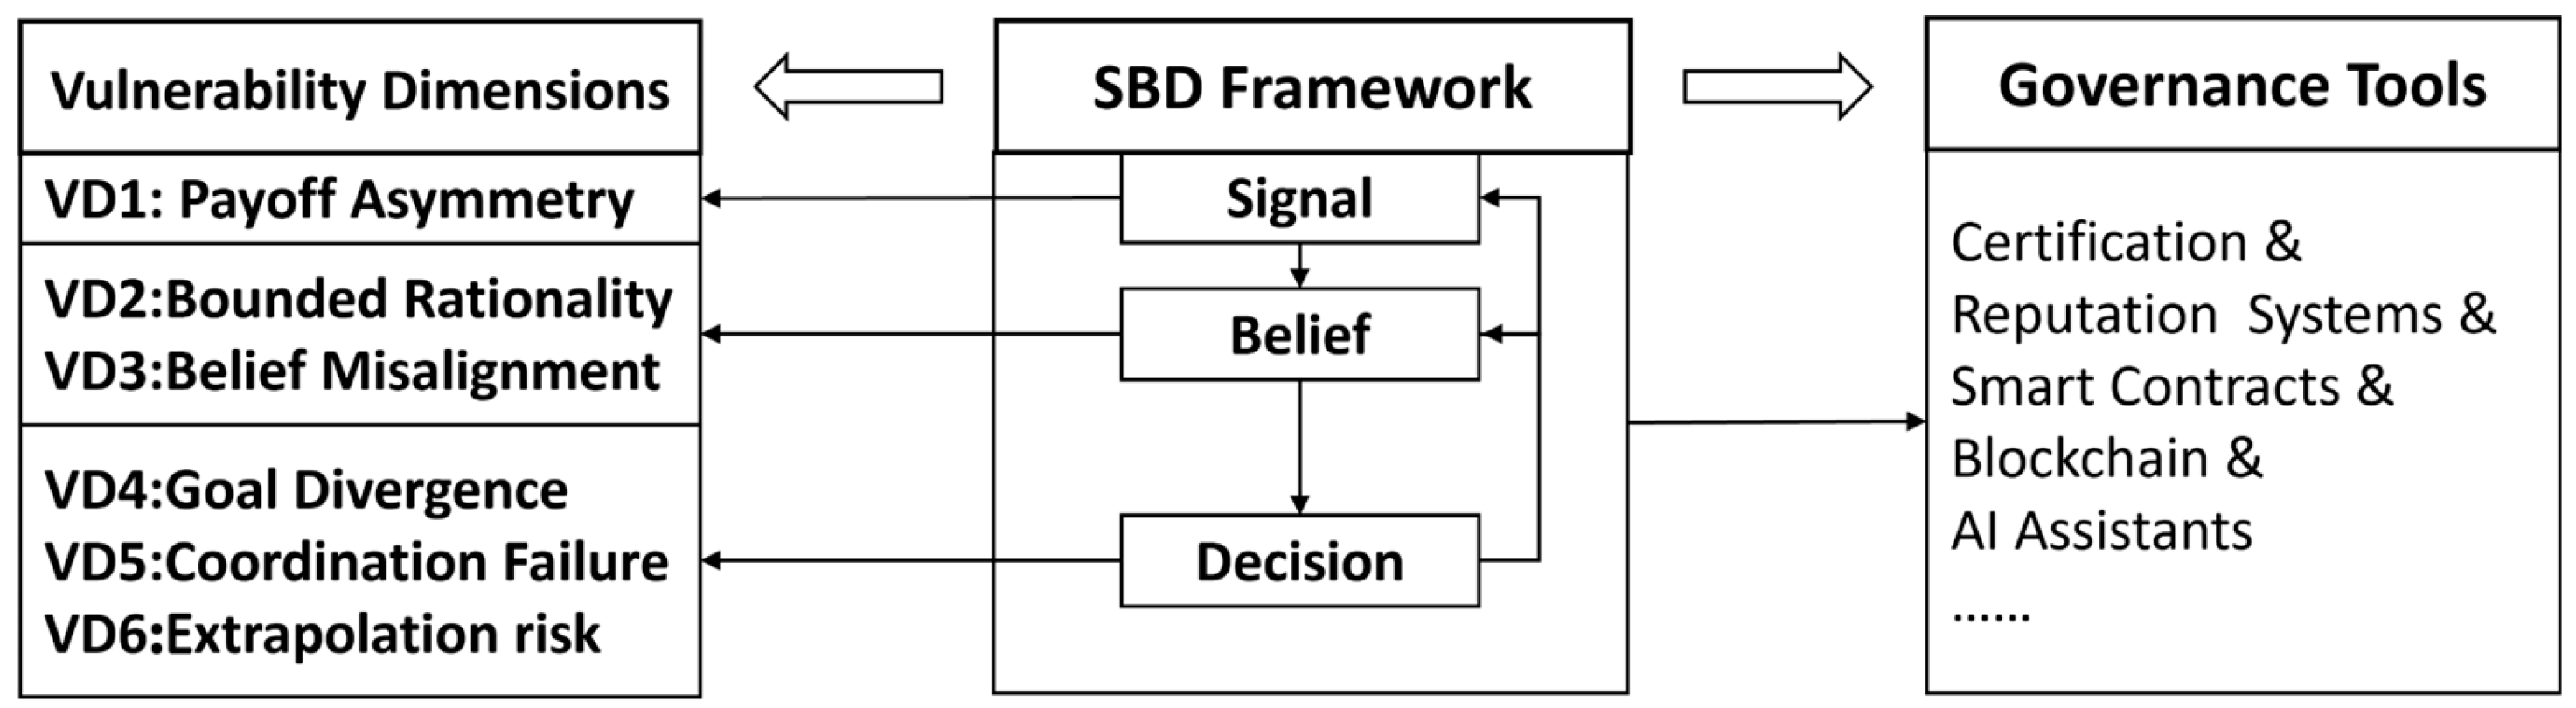
Building upon the diagnostic logic of the Vulnerability Dimensions (VD1–VD6), we propose the integrated Signal–Belief–Decision (SBD) governance framework. As illustrated in Figure 2, this tripartite architecture consists of three functionally specialized yet mutually reinforcing layers, each directly targeting specific Vulnerability Dimensions (VDs).
The Signal Layer establishes the foundational bedrock of trust by transforming private information into verifiable public knowledge. It gives consumers access to reliable factual information, and correspondingly requires the platform to provide authentic, auditable data. By resolving Information Asymmetry (VD1) through mechanisms such as verified product specifications, traceability records, and certification systems, this layer creates the factual substrate upon which reliable beliefs can be formed.
The Belief Layer is architected to mitigate cognitive and coordination failures by aggregating dispersed individual signals into standardized, publicly accessible collective judgments. It reduces consumers’ uncertainty about whom to trust, and calls for the platform to build consensus through aggregated signals. By countering Bounded Rationality (VD2) and Belief Misalignment (VD3) using mechanisms such as reputation scores, aggregated review summaries, and algorithmic quality indicators, this layer provides reliable cognitive shortcuts and reduces strategic uncertainty, guiding participants toward aligned expectations.
The Decision Layer ensures behavioral stability and incentive compatibility by encoding and enforcing cooperative rules. It assures consumers that their transactions are protected, and demands that the platform provide enforceable guarantees. Directly countering Goal Divergence (VD4), Coordination Failure (VD5), and the destabilizing effects of Dynamic Learning (VD6), this layer uses mechanisms such as escrow services, guaranteed refund policies, and smart contracts to make trustworthy behavior the dominant strategy. It curbs opportunism by reshaping payoff structures, provides a focal point for equilibrium selection, and creates a predictable environment that mitigates equilibrium drift.
Crucially, the efficacy of the SBD framework emerges from synergistic interactions among its three layers, forming a virtuous governance cycle. The Signal Layer provides the reliable factual substrate that enables the Belief Layer to form accurate collective judgments. These consensus beliefs, in turn, provide social legitimacy for the Decision Layer’s rules. Most importantly, the incentives and disincentives embedded in the Decision Layer—such as rewarding high-reputation actors or penalizing fraudulent behavior—create a feedback loop that recursively motivates participants to provide truthful information to the Signal Layer and to cultivate their standing within the Belief Layer.
In essence, the SBD framework transforms the abstract goal of “building trust” into a structured, operational governance architecture. Its design is a direct, systematic response to the diagnosed Vulnerability Dimensions (VD1–VD6), providing the missing logic to guide the configuration of governance mechanisms from a consumer-centric perspective.

3.5. Illustrative Cases

China’s e-commerce evolution offers a rich context for examining platform governance. Among its platforms, Alibaba provides an informative longitudinal case due to its foundational role and the explicit layering of its governance interventions over time. The following discussion maps Alibaba’s trajectory onto the SBD framework, which serves as an illustrative example of how the framework operates in practice.
Alibaba’s governance journey began with a Decision-layer intervention. In Taobao’s early days, a severe trust deficit threatened market emergence [42,43]. Alipay’s escrow service encoded enforceable transaction rules, making cooperative behavior the dominant strategy and directly countering Goal Divergence (VD4) [44]. As the platform scaled, Alibaba successively fortified the other two layers. It introduced merchant authentication and product traceability to harden the Signal layer [45,46], addressing Information Asymmetry (VD1). Concurrently, it deployed algorithmic reputation systems such as dynamic seller ratings to refine the Belief layer [46], mitigating Bounded Rationality (VD2) and Belief Misalignment (VD3). The subsequent launch of Tmall further stratified the market [45], creating clear signal differentiation and adding another Decision-layer rule.
Alibaba’s success illustrates a well-configured SBD architecture. The Signal layer is embodied by merchant authentication and product traceability. The Belief layer is represented by dynamic seller ratings and aggregated consumer reviews. Most critically, the Decision layer, anchored by Alipay’s escrow service, enabled Taobao’s market launch. This three-layer logic also appears in Alibaba’s other businesses. Cainiao applies real-time tracking (Signal), carrier ratings (Belief), and smart routing (Decision) [47]. Ant Group leverages transaction data (Signal), Sesame Credit scores (Belief), and credit-enabled financial products (Decision) [48]. Together, these examples suggest the broad applicability of the SBD framework.

4. Computational Analysis and Design Principles

Real platform markets are populated with heterogeneous agents, bounded rationality, and incomplete information [19,49], which go beyond the limits of signaling theory. This chapter uses agent-based modeling [50,51] to simulate market evolution under different governance configurations. From the simulation results we distill four Design Principles (DP1–DP4), and we briefly illustrate how these principles operate in practice through real platform cases.

4.1. Experimental Design

To quantitatively isolate the independent and interactive effects of the three governance layers, we designed a structured factorial experiment. As outlined in Table 4, this design progresses systematically from an ungoverned baseline (S0) through single-layer interventions (S1–S3), pairwise combinations (S4–S6), and finally to the fully integrated SBD framework (S7). This progressive structure establishes a robust counterfactual framework, allowing for the unambiguous attribution of market performance changes to specific governance configurations.
The effectiveness of each governance scenario is quantified through a suite of metrics grounded in information economics, as detailed in Table 5. This evaluation system is designed to directly assess the quality of the market’s information environment, reflecting its success in countering the diagnosed Vulnerability Dimensions. It focuses on two core dimensions: Signal Value, which captures the ability of observable signals (e.g., price, reputation) to reveal latent product quality, and Market Separation, which measures the market’s efficacy in distinguishing between heterogeneous seller types. Furthermore, we construct a Market Efficiency Index (MEI) to synthesize these dimensions and assess the overall coherence of the market’s information structure under different governance regimes (Detailed formulas are provided in Appendix A.3).

4.2. Core Architecture

This section delineates the core architecture of our agent-based model, which translates the theoretical signaling game into a dynamic digital market populated by the heterogeneous, boundedly rational agents noted in the introduction to this chapter. The model is designed as a computational laboratory where macro-level market outcomes—such as equilibrium formation and its fragility—emerge from the micro-level interactions of adaptive agents operating under the governance scenarios defined in Section 4.1.
The model instantiates the market with two core types of agents:
Merchants, endowed with heterogeneous production costs, set prices using a cost-plus rule [52] augmented with adaptive learning [53]. They exploratorily adjust prices based on historical transaction success. Their reputation is updated dynamically using a Bayesian system [54] that processes consumer feedback.
Consumers form their expected product value based on three factors: limited cost information, observed price signals [55], and individual perceptual biases. The Signal-layer transparency parameter η captures the information transparency available to consumers, which can be reflected by the level of product information disclosure or the stringency of quality certification. The Belief-layer cognitive bias parameter σv captures the belief distortion that arises from the complexity of online information or the ambiguity of user reviews. Given this expected value, consumers then make purchase decisions according to heterogeneous preferences and shopping habits, captured by the Decision-layer parameter λ, which we abstract into two stylized types: utility-calculators (buy if expected value exceeds price) and belief-followers (rely on merchant reputation).
These micro-level behaviors are integrated into a standardized multi-period sequence: (1) platform matching, where consumers are recommended merchants based on reputation rankings; (2) price signaling; (3) consumer belief updating and purchase decisions; and (4) payoff settlement and agent learning. This closed-loop process ensures that macro-market states are genuinely emergent from micro-level interactions. To ensure statistical robustness, all reported results are averaged over 300 independent simulation runs, allowing us to distill the deterministic effects of governance mechanisms from random noise. Additionally, systematic robustness checks with key parameters varied by ±30% confirmed the consistency of the results. (A complete specification of agent decision models and baseline parameters is provided in Appendix A.1 and Appendix A.2).

4.3. Governance Mechanisms

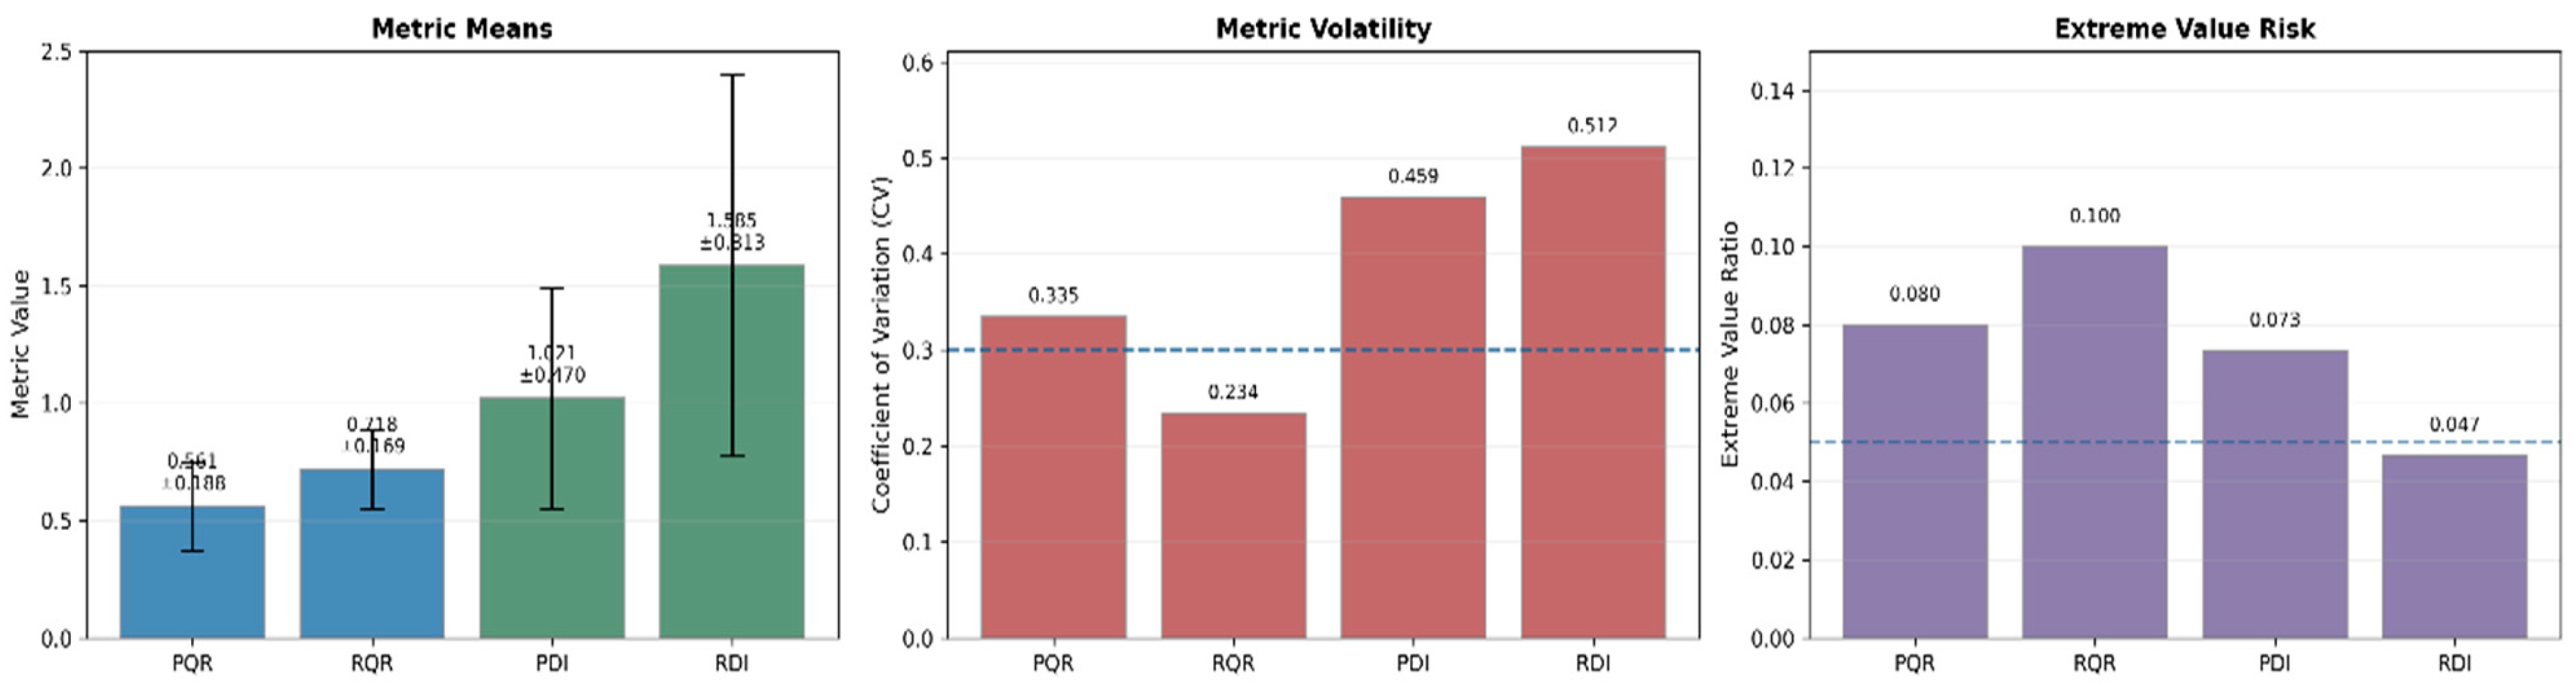
Analysis of the S0 baseline reveals the classic symptoms of a fragile market under information asymmetry. As shown in Figure 3, moderate levels of Price–Quality and Reputation–Quality Correlation (PQR = 0.561, RQR = 0.718) are undermined by high volatility (CV_PQR = 0.335, CV_RQR = 0.234), indicating unreliable signal efficiency. This instability extends to the market’s core function of differentiating sellers, with Price and Reputation Differentiation Indices (PDI = 1.021, RDI = 1.585) showing even greater fluctuations (CV_PDI = 0.460, CV_RDI = 0.513). The significant presence of extreme values further confirms the market’s predisposition to frequent efficiency breakdowns, collectively validating the equilibrium fragility hypothesis and providing a clear governance benchmark.
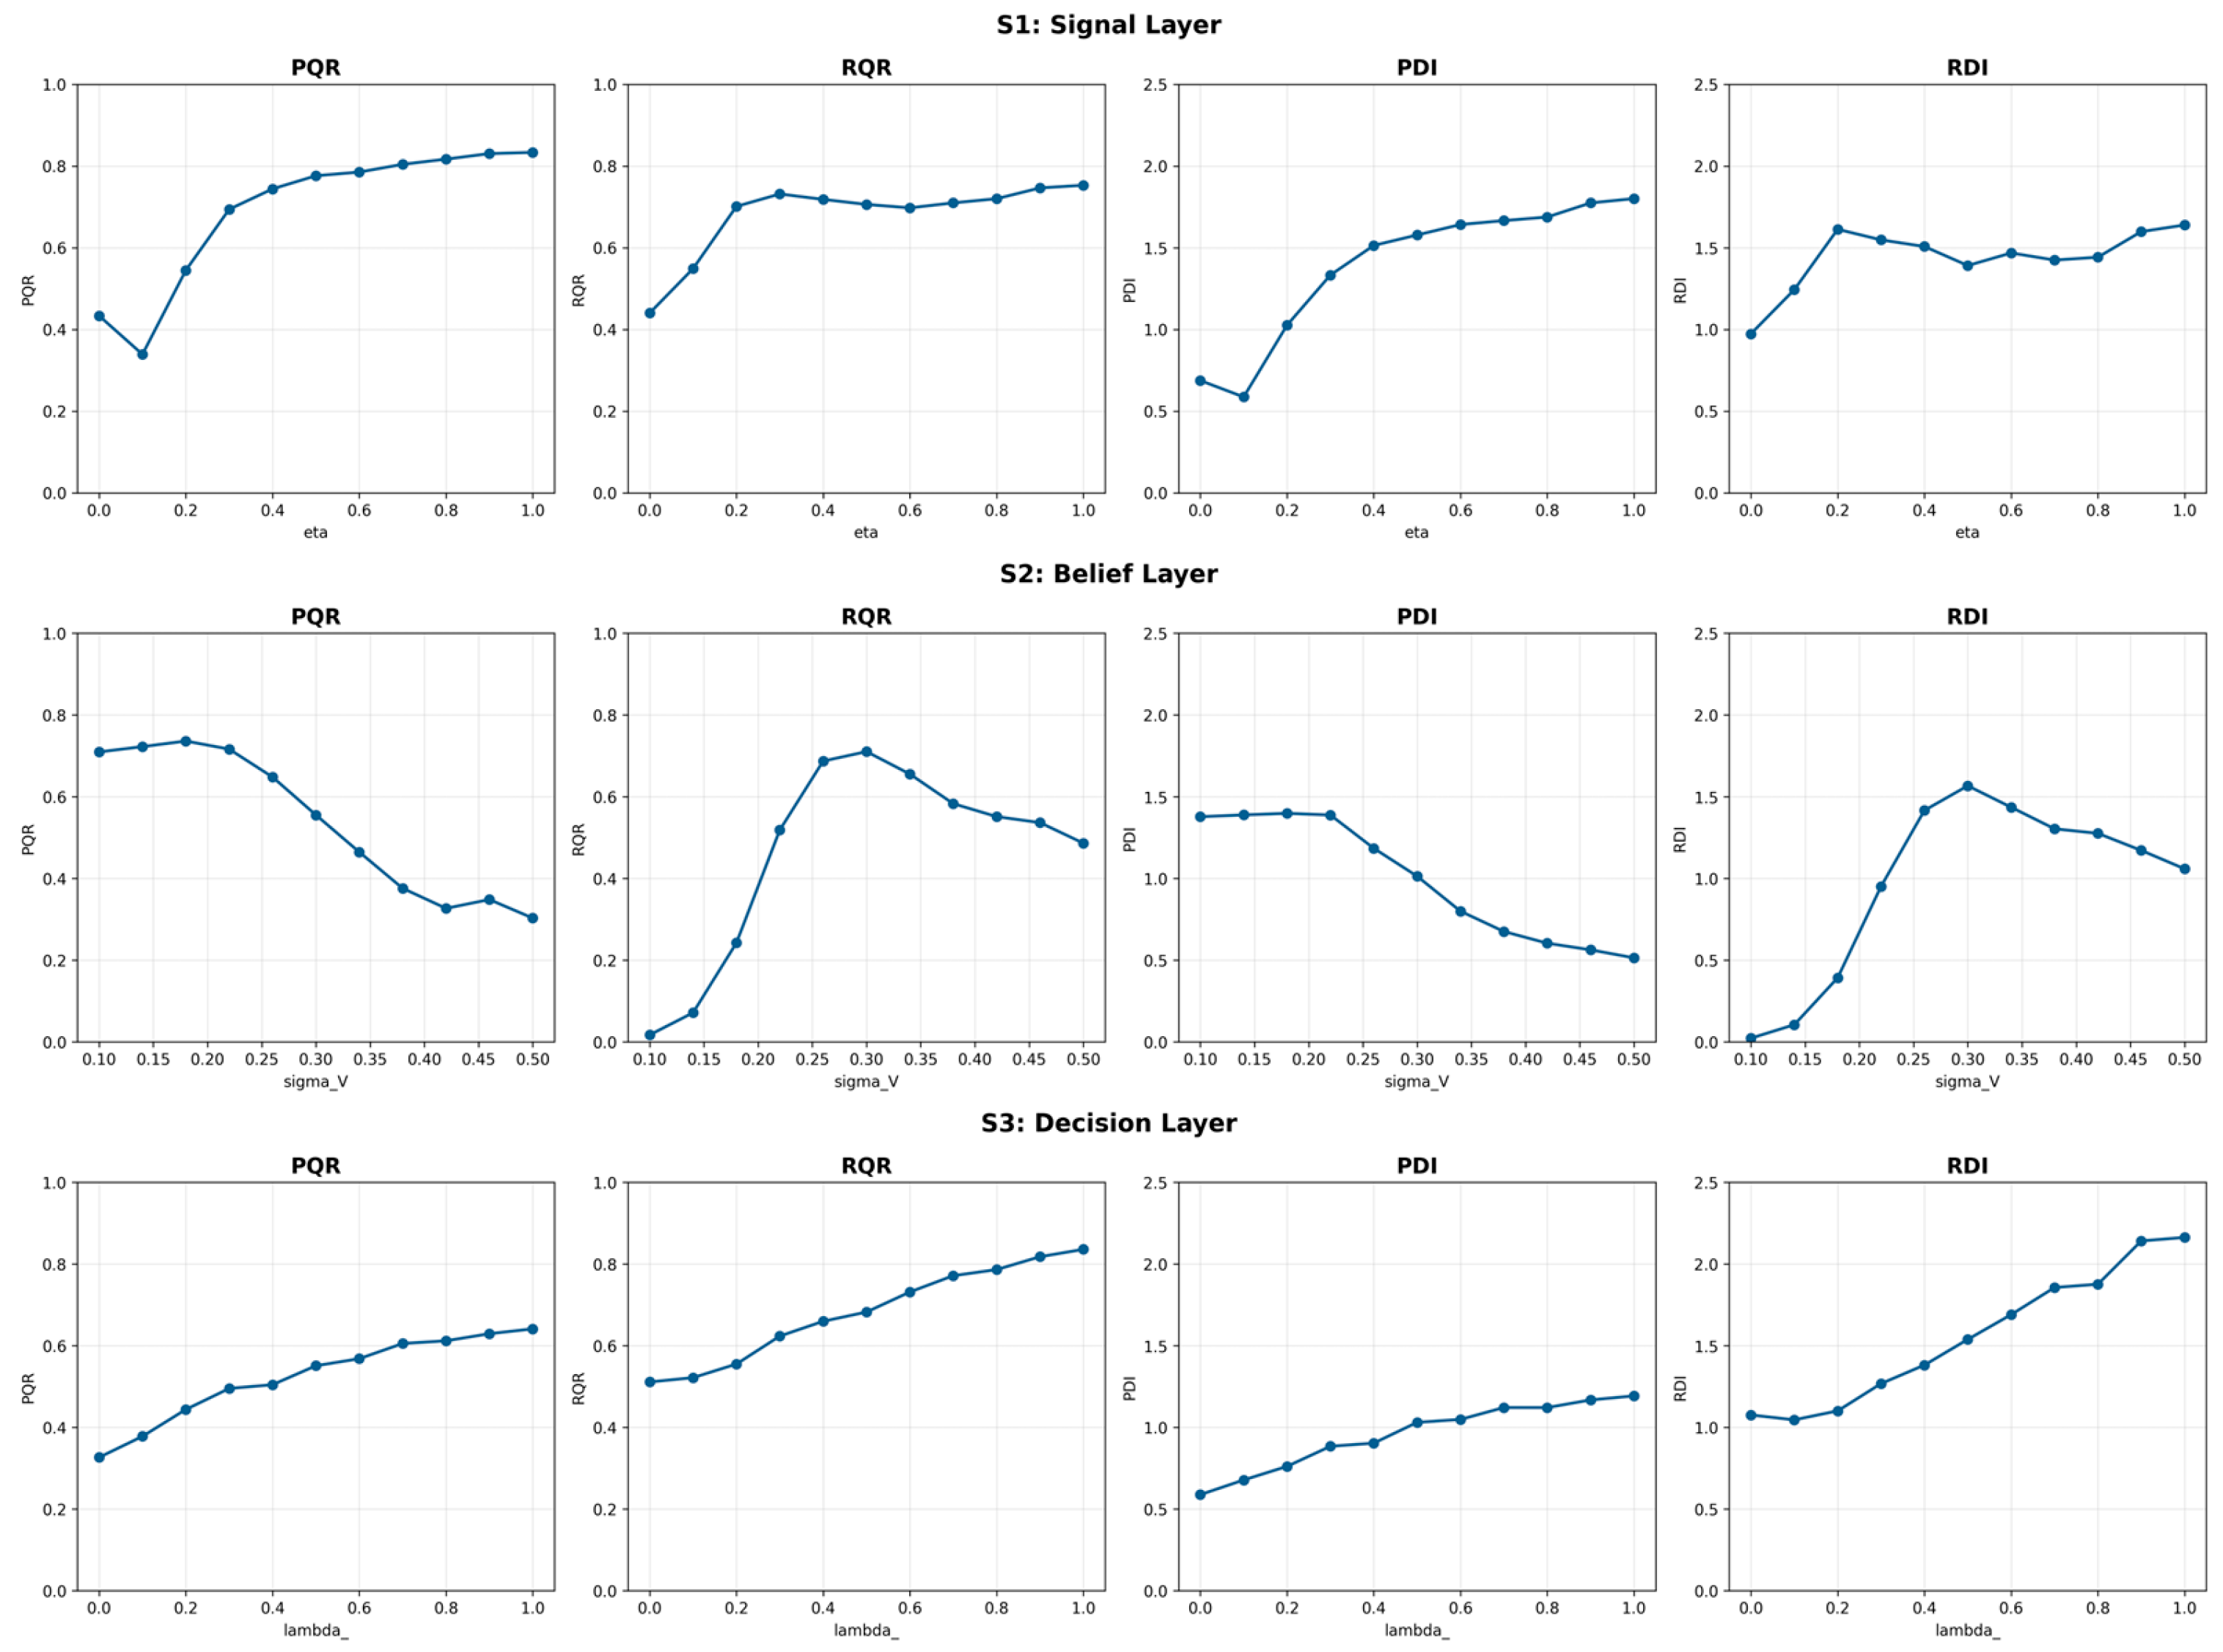
Parameter sweeps across governance scenarios reveal distinct operational logics and complex interactions (Figure 4). The Signal layer (S1) produces steady, monotonic improvements in price signal quality (PQR rising from 0.43 to 0.83 with transparency η), demonstrating its foundational role in consolidating the foundation of market signaling. In contrast, the Belief layer (S2) exhibits a fundamental trade-off: reducing cognitive bias (σV) sharpens price signals but systematically erodes the accuracy of the reputation system (RQR), revealing the cognitive constraints of multi-signal processing. The Decision layer (S3) demonstrates the most consistent optimization, broadly enhancing market efficiency as rule-based decision-making (λ) increases, underscoring its function in stabilizing behavior through incentive-compatible rules.
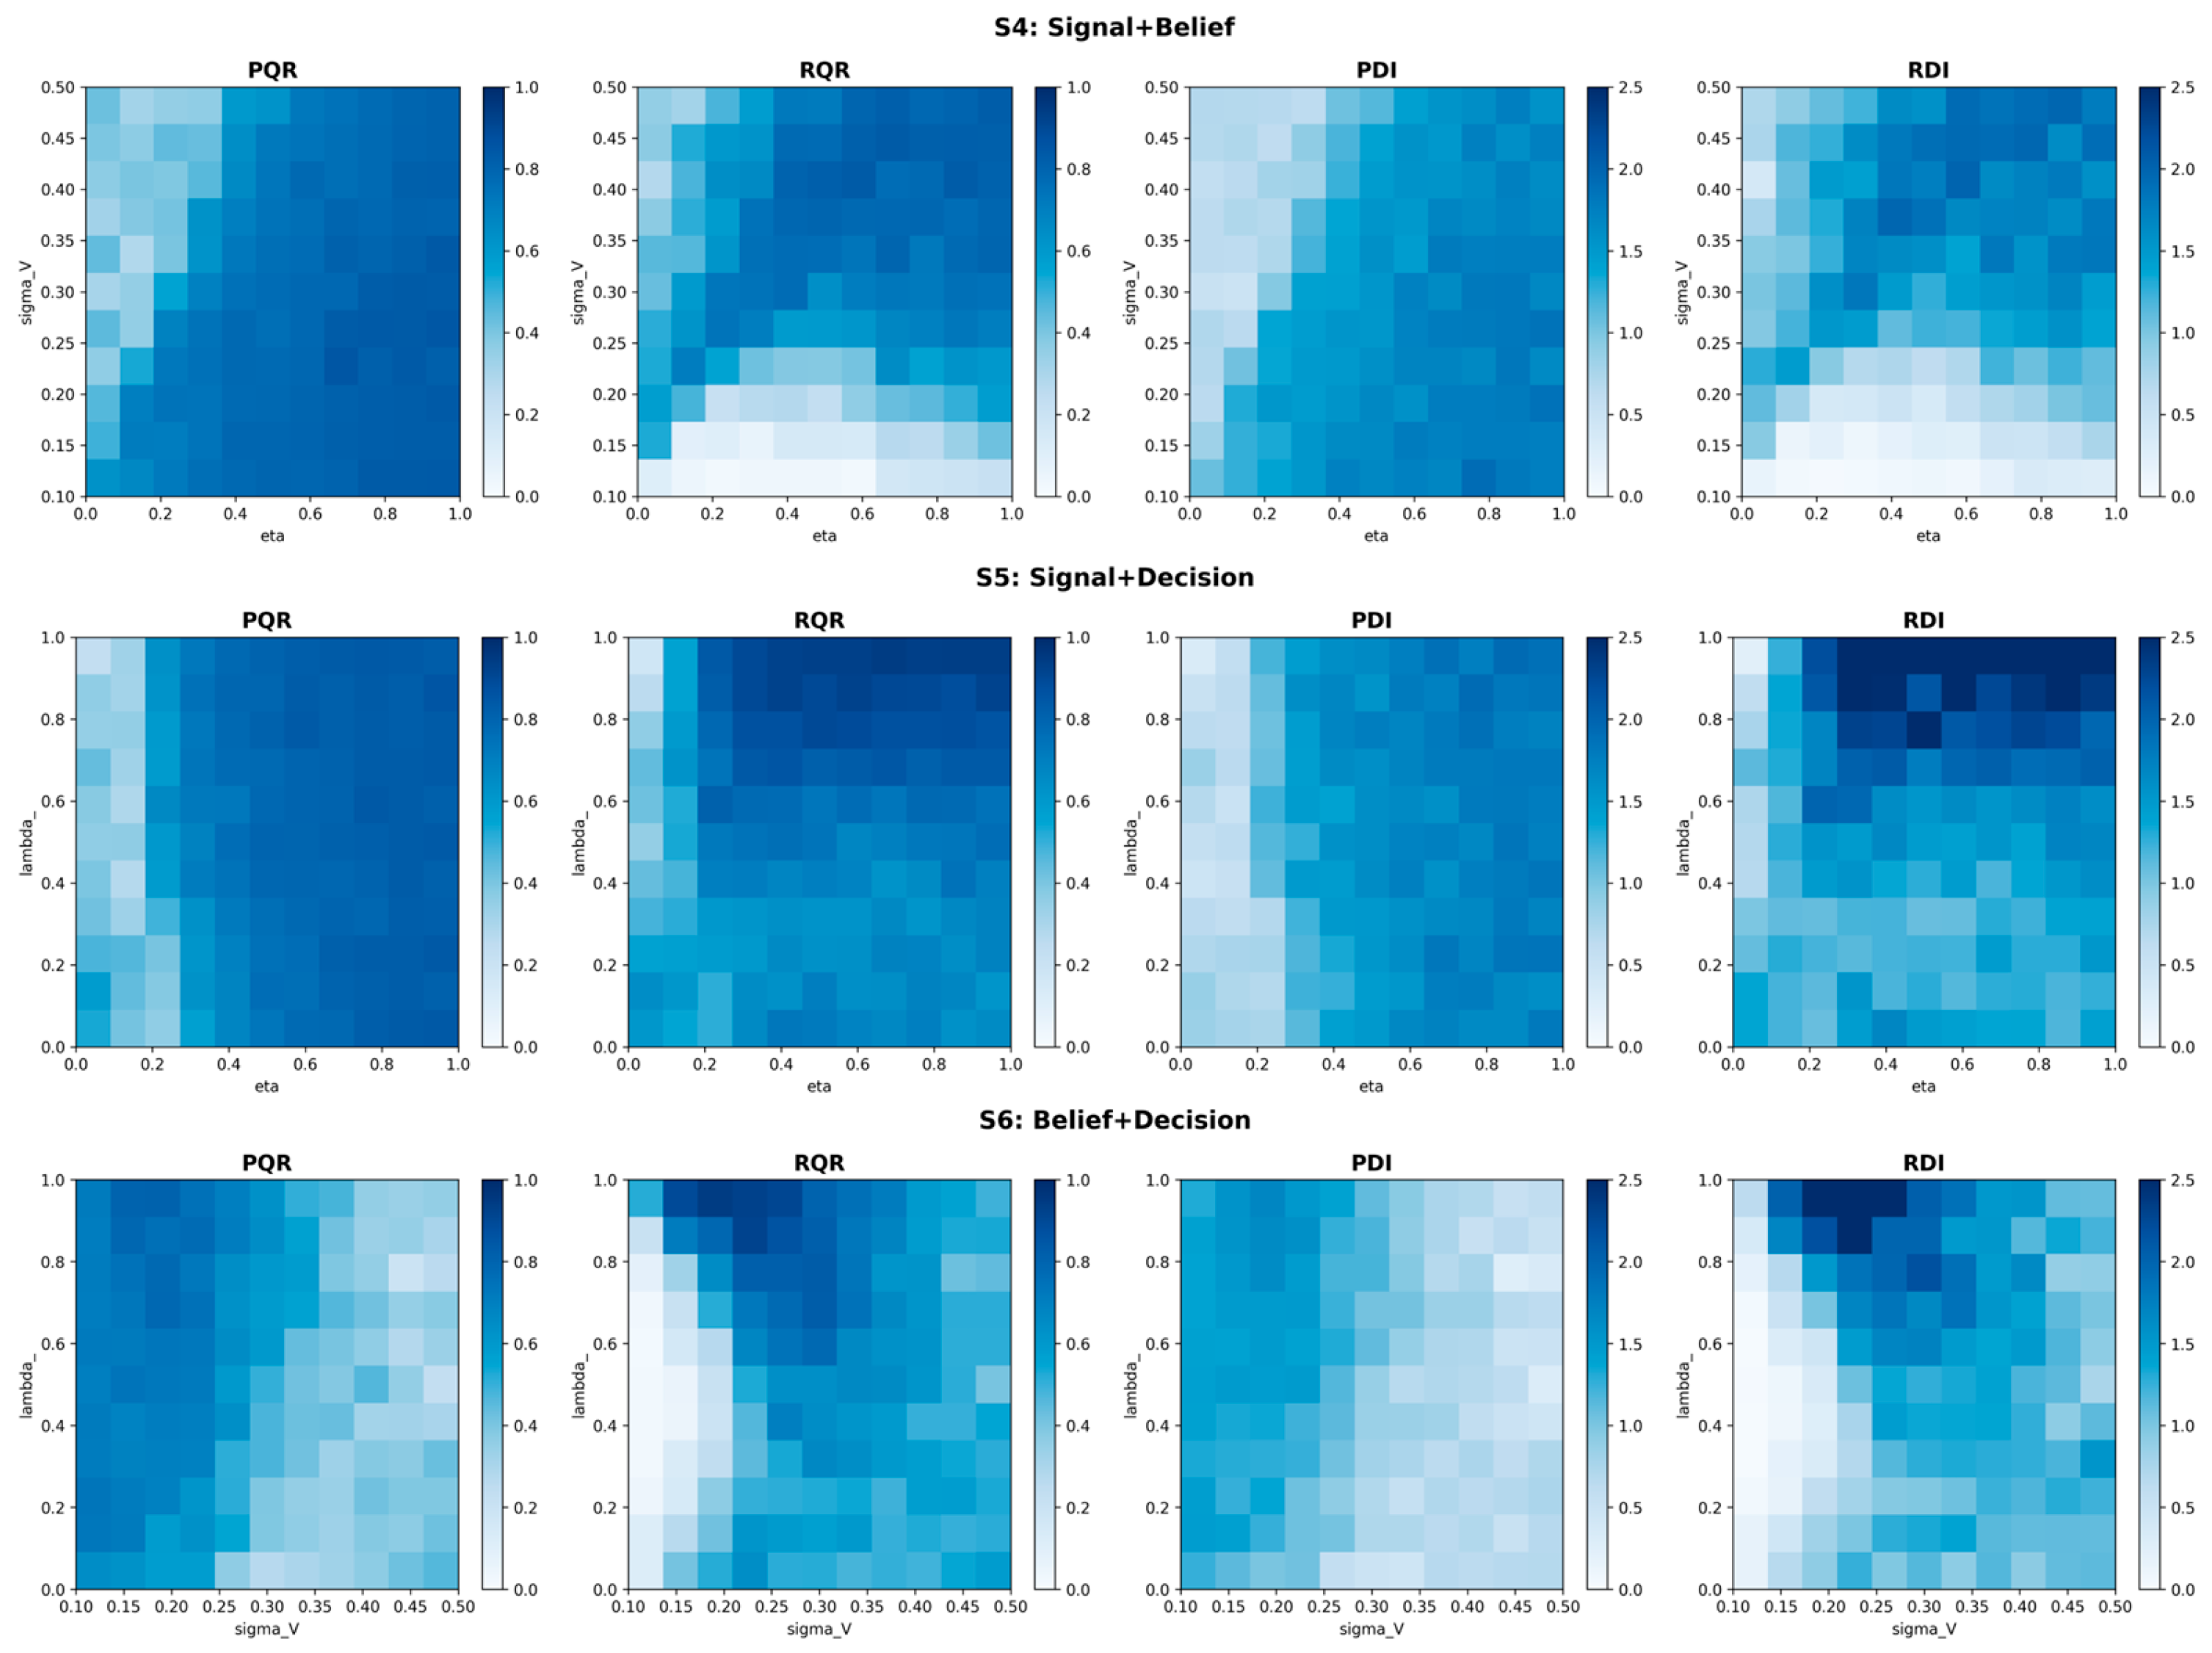
The critical insights into the framework’s dynamics emerge from governance layer interactions (Figure 5). The Signal–Decision combination (S5) demonstrates powerful synergy, where high transparency (η) and strong rule-compliance (λ) jointly drive performance to its peak, as credible data is most effectively utilized within a rational decision framework. Conversely, the Signal–Belief pair (S4) reveals a governance trade-off: belief calibration (low σV) that optimizes price signals systematically compromises reputation accuracy, exposing cognitive competition between different signals. The Belief–Decision combination (S6) proves context-dependent, requiring a sufficient proportion of rule-followers (λ) to make belief calibration effective, highlighting that trust mechanisms alone are insufficient without a backbone of enforced rules.
Results from the integrated governance scenario (S7) revealed the systemic nature of platform governance (Table 6). All parameter-optimized governance schemes significantly enhanced overall market effectiveness and universally improved metric stability. From a structural perspective, two-layer governance combinations (S4–S6) generally outperformed single-layer governance (S1–S3), demonstrating complementarity between governance tools. However, the three-layer integrated governance (S7 Practical) did not produce the expected performance breakthrough; its performance was comparable to the best two-layer combinations, and the theoretical optimal parameter combination (S7 Ideal) instead, reduced system efficiency below the pre-governance level. This phenomenon corroborates the prediction of bounded rationality theory: overly complex governance frameworks may exceed the system’s cognitive and coordination capacity, pointing toward a critical constraint on governance design.

4.4. Robustness and the Design Principles

To verify the validity and generalizability of our computational findings, we conducted systematic robustness checks under varied parameter perturbations (Table 7). For scenarios revealing single-parameter effects (S1–S3), we quantified the consistency of output graphs in overall morphology, numerical precision, and dynamic trends. For those revealing dual-parameter interactions (S4–S6), we assessed the stability of heatmaps in their macroscopic structure, local patterns, and change gradients. (The detailed specifications of our robustness metrics are provided in Appendix A.4).
The robustness of all governance scenarios remained high (average score greater than 0.85) when core experimental parameters were altered, confirming that the reported effects are inherent properties of the model’s governance logic and not stochastic artifacts. However, a critical boundary condition emerged when we simulated different market environments: expanding the market size systematically eroded governance stability. This vulnerability was most acute for pure Decision-layer governance (S3), whose robustness score collapsed to 0.04, and for strategies heavily reliant on the Belief-layer (S2, S6). This pattern delineates a fundamental limit: in hyper-scaled markets, the cognitive and coordination demands of aligning beliefs and enforcing rules increase non-linearly.
A comparative analysis confirms the Signal layer as the cornerstone of scalable robustness. All Signal-inclusive scenarios (S1, S4, S5) maintained high stability across all perturbations, demonstrating that transforming private information into trusted public knowledge is the most reliable foundation for market trust. In contrast, the Belief and Decision layers serve as effective “enhancement tools” in smaller markets, but their efficacy at scale depends critically on the Signal layer’s “factual anchor.” Without it, they risk coordination failure or prohibitive costs.
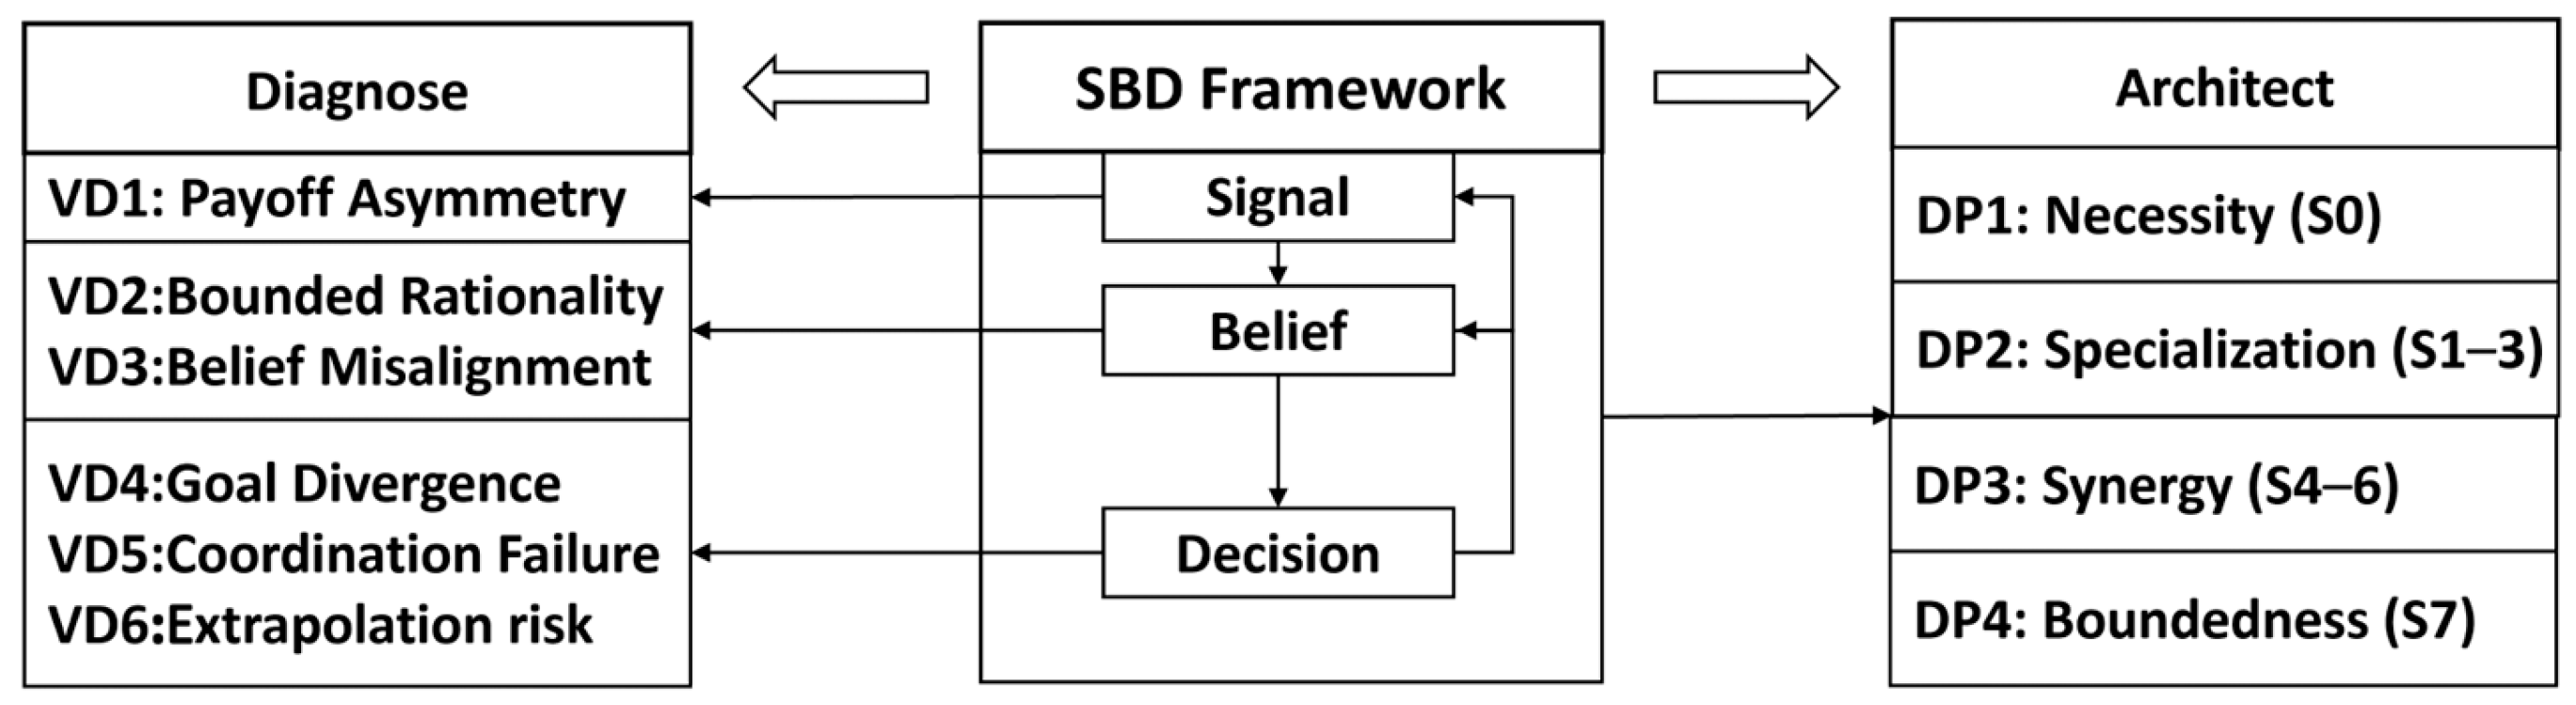
Synthesizing this systematic evidence from computational robustness checks and its real-world parallels, we formalize four core Design Principles (DP1DP4) for architecting resilient digital markets (Figure 6):
DP1: The Necessity of Intervention. Effective platform governance begins with acknowledging the necessity of active intervention to counteract the intrinsic fragility of digital market vulnerability, as starkly revealed by the degenerative dynamics of the ungoverned baseline (S0).
DP2: The Specialization of Tools. Governance tools are functionally specialized and are not substitutable. The Signal, Belief, and Decision layers respectively and most effectively address the distinct challenges of information authenticity, expectation alignment, and incentive compatibility, as evidenced by their unique performance profiles and parameter sensitivities in scenarios S1–S3.
DP3: The Synergy of Integration. The organic integration of specialized governance tools creates synergistic effects, enabling a “1 + 1 > 2” improvement in systemic robustness that cannot be achieved by any single layer in isolation. This is conclusively demonstrated by the superior and more stable performance of two-layer combinations (S4–S6) over their single-layer constituents.
DP4: The Boundedness of Intervention. The efficacy of governance is bounded by the cognitive and coordination limits of the system. Overly complex or intricate designs that exceed these limits will be counterproductive, mandating the principle of moderate intervention. This critical boundary is powerfully illustrated by the performance collapse under the theoretically optimal (S7 Ideal).
In essence, these four principles, emerging from the computational laboratory and contextualized by strategic practice, provide a foundational logic for configuring the SBD Framework, guiding platform architects on why, how, and to what extent to intervene.

4.5. Illustrative Cases

Alongside Alibaba (Section 3.5), three other Chinese platforms—JD.com, Pinduoduo, and Douyin—have each carved out a significant market presence. Sharing the same market and regulatory environment, their divergent starting points lead to different trajectories yet converge on layer integration and triad replication (DP1–DP4).
JD.com built its governance on a controlled supply chain (Signal) and enforceable logistics guarantees (Decision), with reviews (Belief) playing a secondary role [56]. This specialization (DP2) resolved information asymmetry (VD1) and incentive compatibility (VD4) from the start, demonstrating the necessity of intervention (DP1). As JD expanded into subtle-quality categories like fresh produce, verified facts alone proved insufficient. The platform therefore added curated ratings and live Q&A to strengthen the Belief layer [57], revealing the value of synergy (DP3): once baseline uncertainty is reduced, the missing layer’s value emerges.
Pinduoduo started from a pure Belief engine—social fission and group buying [58]. This single-layer intervention catalyzed rapid growth (DP1), but the absence of Signal verification and Decision enforcement invited counterfeits, nearly locking the market into a low-quality equilibrium [59]. Its forced correction—branded storefronts and a strict refund-only policy [60]—shows that an incomplete architecture may succeed initially but later demands costly retrofitting.
Douyin reinvented the Belief layer by anchoring trust in live-streaming authenticity and algorithmic curation [61]. This novel instantiation of specialization (DP2) drove rapid adoption, yet Douyin quickly found that even a reinvented Belief mechanism needs supporting scaffolds. It is now building real-time product checks (Signal) and host conduct rules (Decision) [62]—a clear demonstration of synergy (DP3).
These cases, together with Alibaba’s path, suggest that platforms can build resilience from different starting points (DP2) and that integration eventually becomes necessary (DP3). They also highlight the boundedness of intervention (DP4): mature platforms often counter diminishing governance returns by exporting their proven SBD configuration to adjacent businesses—for example, Alibaba’s Cainiao [47], JD’s international expansion [63], or Pinduoduo’s agricultural live-streaming [64].

5. Conclusions

5.1. Research Summary

This study began with a central observation: the sustained growth of e-commerce platforms is increasingly constrained, not by macro-level expansion, but by the pervasive fragility of their constituent micro-markets. We have argued that this micro-market fragility stems from a fundamental disconnect between two parallel research streams—one focused on diagnosing market failures through the lens of information economics, the other on engineering isolated governance tools. To bridge this gap, we introduced the Signal–Belief–Decision (SBD) framework, which re-architects platform governance as a dual-perspective mapping. From the consumer’s perspective, the framework follows the decision journey by asking three sequential questions: “What objective facts can I observe?”, “How should I interpret these signals and form a reliable judgment?”, and “What actions should I take?”. Correspondingly, from the platform manager’s perspective, the framework requires the platform to provide three layers of support: deliver verifiable market data, help participants converge on shared beliefs, and offer enforceable transaction guarantees.
Our investigation proceeded in two complementary steps. First, we developed an extended signaling game to diagnose the root causes of market instability under ideal assumptions. By systematically relaxing those assumptions, we identified six Vulnerability Dimensions (VD1VD6)—from information opacity and bounded rationality to coordination failure and dynamic learning—that pinpoint the precise intervention targets for governance. Second, we built an agent-based model as a computational laboratory to test how different configurations of the three SBD layers shape market outcomes under more realistic conditions of heterogeneity and bounded rationality. The simulation results, validated through systematic robustness checks, substantiate the four Design Principles (DP1DP4): the necessity of intervention (DP1), the specialization of tools (DP2), the synergy of integration (DP3), and the boundedness of intervention (DP4).
Through this integrated analytical–computational approach, the study transforms platform governance from a reactive exercise in deploying isolated tools into a proactive discipline of architectural design. The SBD framework provides not only a diagnostic logic for identifying why a micro-market is fragile, but also a constructive logic for configuring which governance layer—or combination of layers—should be deployed in response.

5.2. Practical Implications

The SBD framework and its associated design principles carry actionable implications for three distinct audiences, each engaging with platform governance from a different vantage point.
For consumers, the SBD framework offers a structured lens for understanding their own decision-making journey in online marketplaces. By explicitly distinguishing between factual information (Signal), social interpretation (Belief), and transactional security (Decision), consumers can become more reflective about where their uncertainty or hesitation originates. This awareness helps them avoid unnecessary impulse purchases driven by misleading signals or social pressure, as well as unsafe transactions where assurance mechanisms are weak or absent. In essence, the framework empowers consumers to ask the right questions before clicking “buy,” fostering more deliberate and protected purchasing behavior.
For platform managers, the SBD framework serves as both a diagnostic tool and a strategic roadmap. Diagnostically, it helps managers pinpoint precisely which layer of their governance architecture is underperforming—whether product information is opaque (Signal layer), reputation signals are confusing or untrustworthy (Belief layer), or transactional guarantees fail to deter opportunism (Decision layer). Prescriptively, the framework and its four design principles (DP1DP4) guide managers toward targeted, layered interventions rather than blind accumulation of governance features. The principles remind managers that governance is not a one-time configuration but a dynamic, lifecycle-adaptive process: the optimal mix of Signal, Belief, and Decision layers depends on the platform’s maturity stage, competitive context, and user base characteristics.
For government and regulatory authorities, the SBD framework provides a conceptual vocabulary for understanding the technical and strategic choices of dominant platform firms. As platform monopolies grow in economic and social influence, regulators face the challenge of distinguishing legitimate governance improvements from anticompetitive or manipulative practices. The SBD framework disaggregates platform behavior into three analytically separable layers, enabling regulators to assess whether a platform’s actions are genuinely enhancing market transparency (Signal layer), fairly aggregating user consensus (Belief layer), or providing pro-consumer guarantees (Decision layer)—versus engaging in algorithmic manipulation, strategic opacity, or exclusionary conduct that leverages one layer to foreclose competition in another. This layered perspective can inform antitrust investigations, algorithm audits, and consumer protection policies, helping regulators align their oversight with the underlying logic of digital market governance.

5.3. Limitations and Future Research

This study has several limitations, which also chart productive directions for future inquiry.
First, on framework position. Platform governance research has evolved along two largely disconnected paths: a diagnostic tradition rooted in signaling theory and an engineering tradition focused on deployable tools. The SBD framework, while capable of mapping onto both perspectives, draws its core logic from the diagnostic path. Consequently, it is better suited for explaining why micro-markets fail and which vulnerabilities matter most than for prescribing precise implementation details. Future research could build on our architecture to move further toward the engineering side—for example, by operationalizing each layer with concrete, testable mechanisms. Conversely, scholars from the engineering tradition might take the SBD layers as a reference point to develop their own middle-range frameworks that retain stronger engineering character. Either direction would help bridge the current divide.
Second, on method extensions. In the diagnostic stage, we deliberately employed a basic signaling game for its parsimony, helping us systematically relax ideal assumptions and derive the vulnerability dimensions without losing sight of the core causal logic. Future research could enrich this foundation by introducing multi-tier quality levels, competing platforms, or dynamic signaling, thereby examining how the six vulnerability dimensions interact under more complex conditions. In the simulation stage, we intentionally kept model parameters abstract to avoid becoming entangled in purely technological details and to focus on the core interaction effects among the three governance layers. Yet, simulated data may not fully capture real-world conditions, despite their good robustness. Future work can replace these abstract parameters with technology-specific metrics—such as the certification level or the design parameters of a reputation algorithm—to simulate the micro-level effects of concrete governance tools, as well as to complement the findings with empirical platform data.
Third, on application potential. A critical next step is to operationalize the SBD framework’s core constructs into measurable indicators or survey scales, such as product information completeness and review score consistency for Signal layer. This operationalization would enable direct empirical testing using real-world platform data or structured case studies. While our illustrative cases are drawn from China’s e-commerce landscape to ensure background consistency, future research should also examine the framework’s generalizability to other institutional contexts, such as platforms in countries with varying development levels and cross-border e-commerce. Ultimately, design science research that configures and tests SBD-based interventions in collaboration with practitioners would help translate the framework from diagnosis into actionable governance design.

Author Contributions

Conceptualization, Z.Z.; methodology, Z.Z.; software, Z.Z.; validation, Z.Z.; formal analysis, Z.Z.; investigation, Z.Z.; resources, A.C.C.; data curation, Z.Z.; writing—original draft preparation, Z.Z.; writing—review and editing, Z.Z. and A.C.C.; visualization, Z.Z.; supervision, A.C.C.; project administration, A.C.C.; funding acquisition, A.C.C. All authors have read and agreed to the published version of the manuscript.

Funding

This research was funded by the Major Program of the National Social Science Foundation of China, grant number 22&ZD095; the Humanities and Social Science Fund of Ministry of Education of China, grant number 24YJA630131; and the Undergraduate Training Programs for Innovation of Southeast University, grant number 202514009.

Institutional Review Board Statement

Not applicable.

Informed Consent Statement

Not applicable.

Data Availability Statement

The agent-based model code and configuration files developed during this study is available from the corresponding author upon reasonable request.

Conflicts of Interest

The authors declare no conflicts of interest.

Appendix A. Technical Details of the Computational Experiment

This appendix provides the complete technical documentation for the Agent-Based Model (ABM) outlined in Section 4, ensuring the research’s replicability and transparency. We detail the model architecture, agent decision rules, parameter settings, calculation methods for evaluation metrics, and the robustness testing protocol.

Appendix A.1. Agent Decision Models

This section specifies the attributes, decision rules, and learning mechanisms for each agent.
1. Merchants are modeled as boundedly rational agents with heterogeneous costs who engage in dynamic pricing through trial and error.
1.1 Merchant Profit: The profit for merchant i in period t (US,i,t) is calculated as follows. The operational cost (CS,i) is incurred automatically each period, while the good’s cost (Cθ,i) and the post-commission revenue (α PS,i,t) are realized only upon a successful transaction.
U S , i , t = C S , i + I t r a n s a c t i o n × ( α P S , i , t C θ , i )
1.2 Cost Structure: To capture the right-skewed distribution of costs in real markets and avoid negative values, the model assumes that a merchant’s operational cost (CS,i) and good’s cost (Cθ,i) both follow a log-normal distribution.
C S , i L o g N o r m a l ( μ S , σ S )
C θ , i L o g N o r m a l ( μ θ , σ θ )
1.3 Pricing Strategy: A merchant’s pricing strategy is based on cost-plus, with randomness introduced to simulate market friction and strategic exploration. The initial baseline price Pbase,i is:
P b a s e , i = C θ × ( 1 + m )
(where m is the industry average profit margin)
The actual asking price PS,i,t is:
P S , i , t L o g N o r m a l ( P b a s e , i , σ P )
Merchants possess adaptive learning capabilities. After each period’s transaction, they adjust their baseline price for the next period:
If the transaction was successful (Itransaction = 1):
P S , i , t + 1 T r u n c a t e d L o g N o r m a l ( P b a s e , i , σ P ) [ P S , i , t , + ]
If the transaction failed (Itransaction = 0):
P S , i , t + 1 T r u n c a t e d L o g N o r m a l ( P b a s e , i , σ P ) [ 0 , P S , i , t ]
This mechanism simulates learning behavior where success leads to a tendency to raise prices and failure leads to a tendency to lower them.
1.4 Reputation Update: A merchant’s reputation (RS,i,t) is constructed using Bayesian smoothing, determined by the history of positive (SS,i,t) and negative (FS,i,t) reviews.
R S , i , t = S S , i , 0 + S S , i , t S S , i , 0 + S S , i , t + F S , i , 0 + F S , i , t
After each transaction, consumers provide binary feedback based on their experience, and the historical review counts SS,i,t and FS,i,t are updated accordingly.
2. Consumers are modeled as boundedly rational decision-makers who follow intuitive heuristics.
2.1 Consumer Utility: The utility for consumer j in period t (UD,j,t) is calculated as follows. The search cost (CD,j) is incurred automatically each period, while the product price (PS,i,t) and perceived value (VD,j,t) are realized only upon purchase.
U D , j , t = C D , j + I t r a n s a c t i o n × ( α V D , j , t P S , i , t )
2.2 Consumer Cost: The consumer’s search cost (CD,j) also follows a log-normal distribution to reflect heterogeneity.
C D , j L o g N o r m a l ( μ D , σ D )
2.3 Value Expectation Formation: A consumer’s expected product value is a mixture of private information and public signals.
First, a baseline expected value is formed:
V b a s e , j , t = η × C θ , i + ( 1 η ) × P S , i , t
(Here, the Signal-layer governance parameter η measures the consumer’s knowledge of cost information.)
Heterogeneous perceptual bias is introduced to form the individual expected value:
V D , j , t L o g N o r m a l ( V b a s e , j , t , σ V )
(Here, the Belief-layer governance parameter σV controls the magnitude of consumer bias in price perception.)
2.4 Purchase Decision Rule: Consumers make purchase decisions based on their type, with the proportion of types controlled by the Decision-layer governance parameter λ.
Type I Consumers (Utility Calculators, proportion λ): Buy if and only if
V D , j , t P S , i , t
Type II Consumers (Belief Followers, proportion 1 − λ): Buy if and only if
R S , i , t × V D , j , t P S , i , t
(This rule treats reputation as a value discount rate or trust multiplier.)
2.5 Feedback Mechanism: After a successful transaction, consumers provide feedback based on their realized utility:
They leave a positive review if
U D , j , t 0
They leave a negative review if
U D , j , t < 0

Appendix A.2. Model Parameters and Experimental Setup

This section details the baseline values for the model parameters and experimental settings as Table A1 and Table A2.
Table A1. Baseline Model Parameters.
Parameter TypeParameter
Symbol
Baseline
Value
Parameter Description
Market EnvironmentNS10Number of Merchants
ND10Number of Consumers
Merchant AttributesμS, σS0.1, 0.05Operational Cost (Mean, Std. Dev.)
μθ, σθ1.0, 0.3Good’s Cost (Mean, Std. Dev.)
α0.9Merchant Revenue Share
m0.3Industry Profit Margin
σP0.2Pricing Exploration Std. Dev.
SS,0, FS,090, 10Reputation Prior Parameters
(Baseline Pos./Neg. Reviews)
Consumer AttributesμD, σD0.05, 0.02Search Cost (Mean, Std. Dev.)
η0.2Signal-layer Transparency
σV0.3Belief-layer Cognitive Bias
λ0.5Decision-layer Rational Proportion
Table A2. Experimental Parameters.
DimensionParameterValueUsage Scenario
Experimental RunTotal Periods100All
Steady-State Start Proportion0.7All
Number of RunsS0 Baseline300S0
Single-Parameter Sweep (S1–S3)300S1–S3
Two-Parameter Sweep (S4–S6)30S4–S6
S7 Ideal300S7
Parameter Sweep RangeSignal-layer Transparency (η)[0.0, 1.0], 11 pointsS1, S4, S5
Belief-layer Cognitive Bias (σV)[0.1, 0.5], 11 pointsS2, S4, S6
Decision-layer Rational Proportion (λ)[0.0, 1.0], 11 pointsS3, S5, S6

Appendix A.3. Evaluation Metrics Calculation

This section provides the detailed calculation formulas for all market evaluation metrics used in the main text. All calculations are performed after the model run has reached a steady state and are averaged over multiple independent runs to ensure statistical power.
1. Price-Quality Correlation (PQR): Measures the ability of the price signal to convey information about product quality
P Q R = ρ ( C θ , P S )
(i.e., the sample Pearson correlation coefficient between the good’s cost and the transaction price).
2. Reputation-Quality Correlation (RQR): Measures the accuracy of the reputation system in reflecting the true product quality
R Q R = ρ ( C θ , R S )
(i.e., the sample Pearson correlation coefficient between the good’s cost and the end-of-period reputation score).
3. Price Differentiation Index (PDI): Quantifies the market’s ability to stratify high- and low-quality sellers via pricing. Merchants are split into High-cost (H) and Low-cost (L) groups based on the median good’s cost
P D I = P ¯ H P ¯ L s p
(where sp is the pooled standard deviation of the two groups).
4. Reputation Differentiation Index (RDI): Quantifies the reputation system’s precision in distinguishing between high- and low-quality sellers
R D I = R ¯ H R ¯ L s r
(where sr is the pooled standard deviation of the reputation scores for the two groups).
5. Market Efficiency Index (MEI): The Market Efficiency Index is designed to comprehensively evaluate the synergistic effects between price signals and reputation signals in the market, while taking into account both signal complementarity and signal conflict.
C o m p l e m e n t a r i t y = P Q R × R D I + R Q R × P D I
C o n f l i c t = 2 × | P Q R R Q R | × | P D I R D I | | P Q R R Q R | + | P D I R D I |
MEI = C o m p l e m e n t a r i t y × ( 1 C o n f l i c t )

Appendix A.4. Robustness Check Methodology

To verify the reliability and generalizability of our findings, we conducted systematic robustness checks for governance scenarios S1–S6. This section details the parameter perturbation strategy, the evaluation metrics system, and the robustness determination criteria.
1. Parameter Perturbation Strategy
The robustness check framework employs multi-dimensional parameter perturbations, with the variation ranges detailed in Table A3 below.
Table A3. Robustness Check Parameter Perturbations.
Parameter TypeParameter SymbolPerturbation RangeSample Points
Random Seedseed{1, 2, …, 10}10
Number of Runsruns200–40010
Steady-State Periodperiod70–13010
Profit Marginprofit0.1–0.510
Cost Structurecost0.1–0.510
Market Scalescale{5, 15, 20, 30, 50}5
2. Evaluation Metrics System
Different evaluation strategies were adopted based on the nature of the output from various governance scenarios:
2.1 For Single-Parameter Effects (S1–S3):
2.1.1 Shape Similarity (Pearson Correlation): Measures the consistency in overall pattern morphology between baseline and perturbed outputs.
S h a p e = ρ f b a s e l i n e ,   f p e r t u r b e d
2.1.2 Numerical Accuracy (Normalized RMSE): Quantifies absolute deviation in output values.
A c c u r a c y = 1 N R M S E f b a s e l i n e ,   f p e r t u r b e d
2.1.3 Trend Consistency (Trend Correlation): Captures stability in dynamic change patterns.
T r e n d = ρ Δ f b a s e l i n e ,   Δ f p e r t u r b e d
2.1.4 Comprehensive Score:
S c o r e L = 0.4 × S h a p e + 0.4 × A c c u r a c y + 0.3 × T r e n d
2.2 For Dual-Parameter Interactions (S4–S6):
2.2.1 Structural Fidelity (SSIM): Comprehensively assesses similarity in luminance, contrast, and structure.
S t r u c t u r e = S S I M H b a s e l i n e ,   H p e r t u r b e d
2.2.2 Grid Correlation: Examines association patterns in row and column directions separately.
G r i d = ρ r o w + ρ c o l / 2
2.2.3 Gradient Similarity: Quantifies directional consistency of change gradients.
G r a d i e n t = ρ ( H b a s e l i n e , H p e r t u r b e d )
2.2.4 Comprehensive Score:
S c o r e H = 0.4 × S t r u c t u r e + 0.4 × G r i d + 0.3 × G r a d i e n t

References

  1. Lee, B.G. Digital Platforms. In Understanding the Digital and AI Transformation; Springer: Singapore, 2025; pp. 37–68. [Google Scholar]
  2. Hong, W.; Turpin, D. Alibaba versus JD.Com: Strategies, Business Models, and Financial Statements. In China-Focused Cases; CEIBS Case Center, Ed.; Springer: Singapore, 2025; pp. 151–163. [Google Scholar]
  3. Xiao, J. A Report on E-commerce Business Model of Pinduoduo. Explor. Sci. Acad. Conf. Ser. 2026, 13, 85–91. [Google Scholar] [CrossRef]
  4. Liu, H.; Liang, J. A Study on the Factors Influencing Chinese Costume Consumers Utilizing Live Streaming Platforms to Purchase Products: A Case Study of Douyin. J. Theor. Appl. Electron. Commer. Res. 2025, 20, 38. [Google Scholar] [CrossRef]
  5. Khoo, K.; Lai, S.; Tian, C. The impact of antitrust enforcement on China’s digital platforms: Evidence from SAMR vs. Alibaba. Int. Rev. Law. Econ. 2025, 83, 106268. [Google Scholar] [CrossRef]
  6. Klepek, M. How online retailers compete: Duplication of purchase and natural monopoly in e-commerce. Int. Rev. Retail. Distr. 2025, 35, 527–544. [Google Scholar] [CrossRef]
  7. Men, J.; Yang, T.; Tao, T. Understanding the predictors of user switching in e-commerce platforms: Evidence from the fsQCA analysis. Ind. Manag. Data Syst. 2026, 126, 492–519. [Google Scholar] [CrossRef]
  8. Hong, Y.; Wan, M.; Yao, W. Exploring User Retention in WeChat E-Commerce for SME Retailers: Perspective of Perceived Quality and Privacy Calculus. J. Theor. Appl. Electron. Commer. Res. 2025, 20, 151. [Google Scholar] [CrossRef]
  9. Akerlof, G. The market for “lemons”: Quality uncertainty and the market mechanism. Q. J. Econ. 1970, 84, 488–500. [Google Scholar] [CrossRef]
  10. Spence, M. Job Market Signaling. Q. J. Econ. 1973, 87, 355–374. [Google Scholar] [CrossRef]
  11. Xu, X.; Fan, R.; Wang, D.; Wang, Y.; Wang, Y. The role of consumer reviews in e-commerce platform credit supervision: A signaling game model based on complex network. Electron. Commer. R. A 2024, 63, 101347. [Google Scholar] [CrossRef]
  12. Roy, R.; Shaikh, A. The impact of online consumer review confusion on online shopping cart abandonment: A mediating role of perceived risk and moderating role of mindfulness. J. Retail. Consum. Serv. 2024, 81, 103941. [Google Scholar] [CrossRef]
  13. Lu, Y.; Cai, S.; Xie, Q.; Wang, J. The impact of multiple similar online certifications on seller performance in e-commerce platforms. J. Bus. Res. 2025, 191, 115275. [Google Scholar] [CrossRef]
  14. Zhao, Y.; Tang, S.; Zhang, H.; Lyu, L. AI vs. human: A large-scale analysis of AI-generated fake reviews, human-generated fake reviews and authentic reviews. J. Retail. Consum. Serv. 2025, 87, 104400. [Google Scholar] [CrossRef]
  15. Quan, N.H.; Ha, P.T.; Tuan, V.T.; Nam, N.H.; Trang, L.T.T.; Mai, N.T. The relationship between eWoM, security, quality of information and purchase behaviour at B2C e-commerce website: The moderating role of E-trustmarks. J. Adv. Manag. Res. 2024, 22, 417–439. [Google Scholar] [CrossRef]
  16. Pavlou, P.A.; Gefen, D. Building Effective Online Marketplaces with Institution-Based Trust. Inform. Syst. Res. 2004, 15, 37–59. [Google Scholar] [CrossRef]
  17. Xie, G. The impact of generative AI shopping assistants on E-commerce consumer motivation and behavior: Consumer-AI interaction design. Int. J. Inform. Manag. 2026, 86, 102983. [Google Scholar] [CrossRef]
  18. Krishnan, K.S.; Devi, R.C.; Ananth, C.; Easwaramoorthy, D.; Agarwal, S.; Pak, W.; Rai, H.M.; Kant, S. Blockchain-based two-level trustable reputation framework for e-commerce platform using smart contracts. Sci. Rep. 2026, 16, 14465. [Google Scholar] [CrossRef]
  19. Mavlanova, T.; Benbunan-Fich, R.; Koufaris, M. Signaling theory and information asymmetry in online commerce. Inform. Manag. 2012, 49, 240–247. [Google Scholar] [CrossRef]
  20. Pan, R.; Feng, J. Better Is Better? Signaling Paradoxes in Performance-Based Advertising. Inform. Syst. Res. 2024, 36, 1217–1227. [Google Scholar] [CrossRef]
  21. Zhao, C.; Li, Y.; Zhang, Y.; Li, L.; Wang, K. Honesty, Deception, or Collusion? Quality Information Disclosure in Live Streaming Commerce. Manag. Decis. Econ. 2026, 47, 309–332. [Google Scholar] [CrossRef]
  22. Xu, X.; Fan, R.; Wang, D.; Xie, X.; Du, K. Mitigating collusive manipulation of reviews in e-commerce platforms: Evolutionary game and strategy simulation. Inform. Process Manag. 2025, 62, 104080. [Google Scholar] [CrossRef]
  23. Milo, S.W.; Runjia, Z.; Maxim, V. Building Bridges in the Digital Age: How online platforms foster trust during a crisis. Organ. Stud. 2025, 47, 481–509. [Google Scholar] [CrossRef]
  24. Janiszewski, M.; Szczypiorski, K. Methodological reliability evaluation of trust and reputation management systems. Comput. Secur. 2025, 158, 104620. [Google Scholar] [CrossRef]
  25. Giuseppe, D.A.; Fotia, L. Blockchain and AI-based methods for trust management in IoT: A comprehensive survey. Internet Things 2025, 34, 101755. [Google Scholar] [CrossRef]
  26. Zhang, H.; Guo, Z.; Liu, J.; Wang, M. Analyzing Consumer Footprints on E-Commerce Platforms: A Multichannel Sequential Search Model with Reference Price. Inform. Syst. Res. 2026. ahead of print. [Google Scholar] [CrossRef]
  27. Mei, Y.; Deng, N. From technological signal to behavioral response: Unraveling the influence of blockchain traceability labels in fresh e-commerce. J. Retail. Consum. Serv. 2026, 92, 104826. [Google Scholar] [CrossRef]
  28. Tang, Q.; Jiang, P. Online reviews in e-commerce: A bibliometric analysis of consumer decision-making. Acta Psychol. 2026, 265, 106464. [Google Scholar] [CrossRef] [PubMed]
  29. Lei, C.F.; Kong, M.M.C. Promotion Complexity and Consumer Confusion: Evidence of the Dark Side of Online Sales Events. Int. J. Consum. Stud. 2026, 50, e70210. [Google Scholar] [CrossRef]
  30. Zhang, Y.; Fu, S.; Yan, X. From rational depletion to impulsive decision: A multi-information source perspective in social livestreaming e-commerce. J. Retail. Consum. Serv. 2026, 88, 104518. [Google Scholar] [CrossRef]
  31. Chen, Z.; Xiao, T. Returnable-after-deep-trial policies in e-commerce supply chains with opportunistic consumers. Transp. Res. Part E Logist. Transp. Rev. 2026, 209, 104728. [Google Scholar] [CrossRef]
  32. Zhang, D.; Jiang, H.; Qiang, M.; Zhang, K.; Qiu, L. Time to Stop? An Empirical Investigation on the Consequences of Canceling Monetary Incentives on a Digital Platform. Inform. Syst. Res. 2025, 36, 781–801. [Google Scholar] [CrossRef]
  33. Zhang, R.; Gao, X. Protection of E-commerce Consumers’ Rights and Interests. In Handbook of E-Commerce in China; Qin, Z., Shuai, Q., Eds.; Springer: Singapore, 2025; pp. 317–346. [Google Scholar]
  34. Bossler, L.F.; Buchwald, A.; Spohrer, K. And No One Gets the Short End of the Stick: A Blockchain-Based Approach to Solving the Two-Sided Opportunism Problem in Interorganizational Information Sharing. Inform. Syst. Res. 2025, 36, 1565–1586. [Google Scholar] [CrossRef]
  35. Jakhar, A.; Indian, A. Explainable fake review detection: A hybrid deep learning model for E-commerce platforms to enhance customer trust. J. Retail. Consum. Serv. 2026, 92, 104796. [Google Scholar] [CrossRef]
  36. Sghaier, R.; El Hog, C.; Djemaa, R.B.; Sliman, L. Machine Learning and Blockchain Synergy: Opportunities and Challenges for ML Models and Smart Contracts. Blockchain Res. Appl. 2025, 100411, ahead of print. [Google Scholar] [CrossRef]
  37. Yang, L.; Zhang, W.; Hao, C.; Zhang, J. The impact of dynamic rating rule on e-commerce platform’s review system under a simulation experiment. Electron. Commer. Res. 2026, 26, 1809–1851. [Google Scholar] [CrossRef]
  38. Lee, Z.; Liu, W.Z.H.; Chan, T.K.H.; Wei, G.G.Z. Impulse buying in live streaming commerce: A literature review and research agenda. Inform. Manag. 2025, 62, 104220. [Google Scholar] [CrossRef]
  39. Dong, Y. Navigating trust in cross-border e-commerce: A systematic review of cultural and consumer dynamics. Hum. Soc. Sci. Commun. 2026, 13, 237. [Google Scholar] [CrossRef]
  40. Fan, Y. A Systematic Review on Agri-Food Live Streaming E-Commerce. J. Econ. Surv. 2026. ahead of print. [Google Scholar] [CrossRef]
  41. Fudenberg, D.; Tirole, J. Game Theory; MIT Press: Cambridge, MA, USA, 1991. [Google Scholar]
  42. Tan, Z.A.; Ouyang, W. Globalization and E-Commerce I: Factors Affecting E-Commerce Diffusion in China. Commun. Assoc. Inf. Syst. 2003, 10, 2. [Google Scholar] [CrossRef]
  43. Li, D.; Li, J.; Lin, Z. Online consumer-to-consumer market in China—A comparative study of Taobao and eBay. Electron. Commer. R. A 2008, 7, 55–67. [Google Scholar] [CrossRef]
  44. Kwak, J.; Zhang, Y.; Yu, J. Legitimacy building and e-commerce platform development in China: The experience of Alibaba. Technol. Forecast. Soc. 2019, 139, 115–124. [Google Scholar] [CrossRef] [PubMed]
  45. Havinga, M.; Hoving, M.; Swagemakers, V. Alibaba: A Case Study on Building an International Imperium on Information and E-Commerce. In Multinational Management: A Casebook on Asia’s Global Market Leaders; Segers, R., Ed.; Springer: Cham, Switzerland, 2016; pp. 13–32. [Google Scholar]
  46. Yao, Y.; Yen, B.; Yip, A. Examining the Effects of the Internet of Things (IoT) on E-Commerce: Alibaba Case Study. In Proceedings of the International Conference on Economics and Banking (ICEB) 2015, Hong Kong, China, 6–10 December 2015. [Google Scholar]
  47. Falcone, E.; Kent, J.; Fugate, B. Supply chain technologies, interorganizational network and firm performance: A case study of Alibaba Group and Cainiao. Int. J. Phys. Distrib. Logist. Manag. 2019, 50, 333–354. [Google Scholar] [CrossRef]
  48. Zhang, Y.; Rohlfer, S.; Rajasekera, J. An Eco-Systematic View of Cross-Sector Fintech: The Case of Alibaba and Tencent. Sustainability 2020, 12, 8907. [Google Scholar] [CrossRef]
  49. Simon, H.A. A Behavioral Model of Rational Choice. Q. J. Econ. 1955, 69, 99–118. [Google Scholar] [CrossRef]
  50. Epstein, J.M.; Axtell, R. Growing Artificial Societies: Social Science from the Bottom Up; MIT Press: Cambridge, MA, USA, 1996. [Google Scholar]
  51. Tesfatsion, L.; Judd, K.L. Agent-based computational economics. In Handbook of Computational Economics; Elsevier: Amsterdam, The Netherlands, 2006; Volume 2. [Google Scholar]
  52. Kaplan, G.; Menzio, G. The Morphology of Price Dispersion; National Bureau of Economic Research Working Paper Series No. 19877; National Bureau of Economic Research: Cambridge, MA, USA, 2014. [Google Scholar] [CrossRef]
  53. Nelson, R.R.; Winter, S.G. An Evolutionary Theory of Economic Change; Harvard University Press: Cambridge, MA, USA, 1985. [Google Scholar]
  54. Fudenberg, D.; Levine, D.K. The Theory of Learning in Games; MIT Press: Cambridge, MA, USA, 1998. [Google Scholar]
  55. Monroe, K.B. Buyers’ Subjective Perceptions of Price. J. Mark. Res. 1973, 10, 70–80. [Google Scholar] [CrossRef]
  56. Wang, S.; Zhou, R. Why JD. com grows sustainably and rapidly: Supply chain innovation. In Urban Construction and Management Engineering IV; CRC Press: Boca Raton, FL, USA, 2024; pp. 717–722. [Google Scholar]
  57. Deng, J. Analysis of E-commerce Platform Expansion and Brand Effect. In Proceedings of the 2025 International Conference on Business, Management and Sustainability (ICBMS 2025), Blagoveshchensk, Russia, 2–4 August 2025; Volume 6, pp. 75–80. [Google Scholar] [CrossRef]
  58. Wang, X.; Wang, X. Socialization, Traffic Distribution and E-Commerce Trends: An Interpretation of the “Pinduoduo” Phenomenon. China Econ. 2019, 14, 56–72. [Google Scholar] [CrossRef]
  59. Chang, Y.; Wong, S.F.; Libaque-Saenz, C.F.; Lee, H. e-Commerce Sustainability: The Case of Pinduoduo in China. Sustainability 2019, 11, 4053. [Google Scholar] [CrossRef]
  60. Qu, S.; Cui, X.; Shen, Y.; Zhu, K.; Zhu, M.; Ma, Z.; Zhou, Y. Exploring the Optimization Path of Pinduoduo Social E-Commerce Marketing Strategy in Shanghai, China; Atlantis Press: Amsterdam, The Netherlands, 2024; pp. 17–31. [Google Scholar]
  61. Pun, B.L.F.; Fung, A.Y.H. Live Streaming as an Interactive Marketing Media: Examining Douyin and Its Constructed Value and Cultural Preference of Consumption in E-commerce. In The Palgrave Handbook of Interactive Marketing; Wang, C.L., Ed.; Springer: Cham, Switzerland, 2023; pp. 499–517. [Google Scholar]
  62. Meng, Y. Governing AI virtual anchors in China’s live streaming E-commerce ecosystem: Policy challenges and global implications. Telecommun. Policy 2026, 50, 103109. [Google Scholar] [CrossRef]
  63. Ostic, D.; Obrenovic, B. JD Strategic Cross-Border Expansion–Offering Retail as Strategy Solutions Abroad. In Casebook of Chinese Business Management; Fan, M., Wang, L., Ostic, D., Eds.; Springer: Singapore, 2022; pp. 139–148. [Google Scholar]
  64. Pan, Y. Rural E-commerce Logistics. In Handbook of E-Commerce in China; Qin, Z., Shuai, Q., Eds.; Springer: Singapore, 2025; pp. 431–444. [Google Scholar]
Figure 1. Signaling Game Sequence and Payoff Structure.
Jtaer 21 00169 g001
Figure 2. SBD Framework with Vulnerability Dimensions.
Jtaer 21 00169 g002
Figure 3. Fragility Analysis of the Baseline Scenario (S0).
Jtaer 21 00169 g003
Figure 4. Effects of Single-Layer Governance Interventions (S1–S3).
Jtaer 21 00169 g004
Figure 5. Interaction Effects of Two-Layer Governance Combinations (S4–S6).
Jtaer 21 00169 g005
Figure 6. SBD Framework with Design Principles.
Jtaer 21 00169 g006
Table 1. Integration of Two Paths: SBD Framework.
Diagnostic PathICASBDDCAEngineering Path
e.g., price signals, certificationsInformationSignalDatae.g., blockchain traceability
e.g., review, information overloadCognitionBeliefConsensuse.g., reputation systems, AI
e.g., purchase, return behaviorActionDecisionAssurancee.g., smart contracts, escrow
Table 2. Parameter Definition.
ParameterMerchant (S)Consumer (D)
Fixed CostCSCD
Variable CostCθ = {Cg, Cb}PS = {Ph, Pl}
Direct RevenueαPS = {αPh, αPl}Uθ = {Ug, Ub}
Potential RevenueU = {USg, USm, CSb}U = {UDg, CDb}
Note: All parameters are non-negative.
Table 3. Perfect Bayesian Equilibria and Sustaining Conditions.
EquilibriaConsumer RationalityMerchant RationalityBelief Consistency
SE1(g, h, y)
(b, l, n)
(Ph − Ub + CDb)/(Ug − Ub + CDb) ≤ p ~ (g|h) ≤ 1
(Ug − Pl + UDg)/(Ug − Ub + UDg) ≤ p ~ (b|l) ≤ 1
αPh − Cg + USm ≥ 0
αPh − Cb − CSb ≤ 0
μ(g|h) = 1
μ(b|l) = 1
SE2(g, l, y)
(b, h, n)
0 ≤ p ~ (g|h) ≤ (Ph − Ub + CDb)/(Ug − Ub + CDb)
0 ≤ p ~ (b|l) ≤ (Ug − Pl + UDg)/(Ug − Ub + UDg)
αPl − Cg + USg ≥ 0
αPl − Cb + USm ≤ 0
μ(g|h) = 0
μ(b|l) = 0
PE1(g, h, y)
(b, h, y)
(Ph − Ub + CDb)/(Ug − Ub + CDb) ≤ p ~ (g|h) ≤ 1
(Ug − Pl + UDg)/(Ug − Ub + UDg) ≤ p ~ (b|l) ≤ 1
αPh − Cg + USm ≥ 0
αPh − Cb − CSb ≥ 0
μ(g|h) = p(g)
μ(b|h) = p(b)
PE2(Ph − Ub + CDb)/(Ug − Ub + CDb) ≤ p ~ (g|h) ≤ 1
0 ≤ p ~ (b|l) ≤ (Ug − Pl + UDg)/(Ug − Ub + UDg)
α(Ph − Pl) ≥ USg − USm
α(Ph − Pl) ≥ USm + CSb
μ(g|h) = p(g)
μ(b|h) = p(b)
PE3(g, l, y)
(b, l, y)
(Ph − Ub + CDb)/(Ug − Ub + CDb) ≤ p ~ (g|h) ≤ 1
0 ≤ p ~ (b|l) ≤ (Ug − Pl + UDg)/(Ug − Ub + UDg)
α(Ph − Pl) ≤ USg − USm
α(Ph − Pl) ≤ USm + CSb
μ(g|l) = p(g)
μ(b|l) = p(b)
PE40 ≤ p ~ (g|h) ≤ (Ph − Ub + CDb)/(Ug − Ub + CDb)
0 ≤ p ~ (b|l) ≤ (Ug − Pl + UDg)/(Ug − Ub + UDg)
αPl − Cg + USg ≥ 0
αPl − Cb + USm ≥ 0
μ(g|l) = p(g)
μ(b|l) = p(b)
Table 4. Governance Experimental Scenarios.
ScenarioSignal LayerBelief LayerDecision Layer
S0NoNoNo
S1: SYesNoNo
S2: BNoYesNo
S3: DNoNoYes
S4: S + BYesYesNo
S5: S + DYesNoYes
S6: B + DNoYesYes
S7: S + B + DYesYesYes
Table 5. Market Information Efficiency Evaluation System
SymbolIndicatorInterpretation
PQRPrice-Quality CorrelationInformation content and credibility of price signals
RQRReputation-Quality CorrelationAccuracy and reliability of the reputation system
PDIPrice Differentiation IndexMarket’s ability to achieve separation via pricing
RDIReputation Differentiation IndexMarket’s ability to achieve separation via reputation
MEIMarket Efficiency IndexComprehensive assessment of overall market efficiency
Table 6. Integrated Governance Performance (S7).
ScenarioPQR (CV)RQR (CV)PDI (CV)RDI (CV)MEI (CV)
S00.561 (33.5%)0.718 (23.5%)1.021 (46.0%)1.585 (51.3%)1.352 (36.0%)
S1: S0.834 (8.3%)0.753 (21.1%)1.801 (20.7%)1.640 (43.9%)1.992 (29.9%)
S2: B0.648 (18.8%)0.687 (28.9%)1.185 (33.4%)1.417 (49.0%)1.530 (28.7%)
S3: D0.641 (20.8%)0.836 (12.2%)1.193 (32.4%)2.163 (42.3%)1.510 (29.3%)
S4: S + B0.805 (11.6%)0.815 (12.3%)1.731 (14.6%)1.908 (39.2%)2.223 (16.3%)
S5: S + D0.854 (6.6%)0.916 (6.6%)1.839 (23.4%)2.372 (38.4%)2.416 (17.8%)
S6: B + D0.807 (7.2%)0.944 (3.2%)1.679 (17.8%)2.746 (31.3%)2.095 (16.1%)
S7: SBD_Practical0.854 (6.6%)0.916 (6.6%)1.839 (23.4%)2.372 (38.4%)2.416 (17.8%)
S7: SBD_Ideal0.763 (11.6%)0.389 (74.3%)1.538 (22.9%)0.609 (106.2%)1.028 (61.0%)
Note: Performance metrics (higher is better) and Coefficients of Variation (CV, in parentheses; lower is better) are reported.
Table 7. Governance Robustness Across Parameter Perturbations.
ScenarioSeedTimesPeriodProfitCostScale
S10.96 (3.5%)0.95 (3.9%)0.95 (3.9%)0.95 (4.5%)0.86 (7.3%)0.67 (11.0%)
S20.97 (2.4%)0.97 (1.7%)0.96 (1.8%)0.96 (2.1%)0.89 (2.6%)0.65 (19.4%)
S30.80 (4.2%)0.77 (4.1%)0.77 (5.2%)0.62 (17.7%)0.71 (6.8%)0.04 (156.9%)
S40.91 (3.5%)0.91 (3.3%)0.90 (3.8%)0.90 (3.6%)0.86 (2.9%)0.68 (7.0%)
S50.86 (3.6%)0.85 (4.3%)0.86 (3.4%)0.86 (3.7%)0.81 (5.2%)0.55 (5.3%)
S60.85 (5.4%)0.85 (5.3%)0.84 (5.5%)0.85 (5.5%)0.81 (4.1%)0.42 (28.0%)
Note: Robustness scores (range 0–1, higher is better) and Coefficients of Variation (CV, in parentheses; lower is better) are reported.
Disclaimer/Publisher’s Note: The statements, opinions and data contained in all publications are solely those of the individual author(s) and contributor(s) and not of MDPI and/or the editor(s). MDPI and/or the editor(s) disclaim responsibility for any injury to people or property resulting from any ideas, methods, instructions or products referred to in the content.