1. Introduction
The changing technological landscape and the emergence of dynamic investment options such as cryptocurrencies, non-fungible tokens (NFTs), stablecoins, and gold-backed digital assets in the financial landscape have sparked serious questions about the type, nature, trading mechanism, and connectivity of these digital assets with conventional financial assets like fiat currencies, gold, and commodities. In the digital realm, we define digital assets as intangible assets with intrinsic value [
1]. Recently, these dynamic digital assets, particularly bitcoins and digital gold, have attracted significant attention from traditional investors due to their potential for higher returns [
2]. For example, Black [
3] reports that approximately 36% of institutional investors in the United States and Europe are now investing in digital assets. Bitcoin is the top investment option for institutional investors, with a market share of more than 45 percent in the whole cryptocurrency market. Dennin [
4] also claimed that the value of gold-backed tokens had reached almost
$700 million, showing a growing appetite for digital versions of traditional commodities. However, despite the growing preference for digital assets, numerous studies assert that most digital assets, such as bitcoins and gold-backed digital assets, are more volatile than traditional assets, particularly during periods of economic uncertainty [
5]. Recently, the global economy has encountered several economic and geopolitical uncertainties, including the subprime crisis of 2007, the COVID-19 pandemic, the Russia–Ukraine War, and the Israel–Palestine conflict, among others. These current developments, combined with close financial integration, have caused tremendous volatility in the financial markets, prompting investors to adjust their portfolios. This rebalancing enables investors to benefit from increased returns from digital assets while still providing return stability and safety through investments in traditional financial assets like gold, currency, and equity markets [
6]. Rebalancing a portfolio in a tightly integrated financial sector characterized by high uncertainty requires unraveling patterns of interconnectedness between traditional and digital assets. This assists investors with accurate risk assessment, efficient portfolio management, and the development of optimal hedging strategies. In accordance with this, the present study seeks to analyze the dynamic interconnectedness between a collection of digital assets, such as bitcoins and gold-backed digital cryptocurrencies, and selected traditional assets, such as fiat currency pairs and gold, which serve as traditional safe-haven investments under dynamic economic conditions.
As previously discussed, due to the significant growth of digital assets such as cryptocurrencies, numerous scholars have investigated their interconnectedness with other financial assets from various perspectives. For instance, Goodell et al. [
7] explored the connectedness between NFTs, bitcoins, chain links, and renewable energy assets; Bas et al. [
8] examined the connectedness between a financial stability index, bitcoins, stable coins, and central bank digital currencies. Recently, Liao et al. [
9] investigated the interconnections and contagion among cryptocurrencies, NFTs, stock indices, and the commodities market. Likewise, Kayani et al. [
10] scrutinized the quantile connectivity between bitcoins, NFTs, traditional assets like the S&P 500, and renewable energy prices. In addition to the aforementioned studies, several other scholars have also attempted to measure the dynamic interconnectedness of digital assets with other traditional financial assets [
11,
12]. The majority of the existing literature on the dynamic interconnectedness between digital assets and other conventional financial assets reveals a complex interplay of interconnectedness. In certain studies, digital assets act as net receivers of shocks, while in others, they act as net transmitters of shocks. However, the majority of these studies reveal a strong interconnection among the selected asset classes. Furthermore, the current literature indicates that research on the dynamic interconnectedness of digital assets is still in its early stages, with the majority of studies primarily focusing on the interconnection of digital assets with traditional assets, particularly focusing on bitcoins [
9,
10]. There are still limited studies on other digital assets, like gold-backed digital assets and gold-backed cryptocurrencies. Moreover, there is also a dearth of literature examining the interconnection between digital assets and traditional assets such as fiat currencies. Exploring the intricate relationship between gold-backed cryptocurrencies, bitcoins, digital assets, and fiat currencies is essential for analyzing their behavior relative to each other, their roles in the financial system, and how they react to economic and geopolitical disturbances. These assets exhibit diverse risk–return characteristics, with gold serving as a safe haven, bitcoin being a volatile and speculative asset, gold-backed cryptocurrencies functioning as intermediaries between traditional and digital currencies, and fiat currencies forming the backbone of global economies. By examining their dynamic interconnectedness, investors can assess diversification possibilities and the potential for reducing portfolio risk. This analysis also assists in understanding how these assets react to regulatory changes, economic crises, and geopolitical tensions, as well as their roles in inflation hedging and currency devaluation. Moreover, the relationship between cryptocurrencies and fiat currencies can inform policymakers about risks to financial stability and currency systems. In addition to the aforementioned rationale, we have also drawn theoretical motivation from the modern portfolio theory propounded by Harry Markowitz and the network theory of financial market integration. Modern portfolio theory explains the optimal allocation of assets in a portfolio to maximize returns based on a given level of risk. Moreover, this theory underlines the importance of exploring how the relationships between digital and traditional assets evolve under diverse economic conditions. If digital assets, such as cryptocurrencies, exhibit distinct connectedness patterns compared to traditional financial instruments, especially during economic uncertainty, they may act as an effective diversifier in portfolio construction. Alongside the modern portfolio theory, as discussed above, the present study also draws insight from network theory, which, in the context of financial markets, explains how different assets are interconnected and how shocks or changes in one asset can propagate through the system. Under network theory, the market is framed as a network comprising nodes (assets) and edges (relationships), wherein alterations in the strength or configuration of these connections may signify systemic changes, contagion risks, or the development of market hierarchies. During periods of market stress, this fact is especially relevant since contagion effects can lead to increased co-movement across many asset classes. Therefore, drawing inspiration from these theoretical backgrounds, the present study attempts to answer the following questions: How do traditional fiat currencies (JPY/USD, CHF/USD), cryptocurrencies (Bitcoin), and gold interact with each other in terms of price movements and volatility under different economic conditions? How much of each asset’s forecast error variance is driven by its shocks vs. external shocks from other assets? To what extent do cryptocurrencies (Bitcoin and gold-backed tokens like XAUT and DGX) act as net transmitters/receivers of shocks against traditional fiat currencies (JPY, CHF) and traditional safe-haven assets (gold)? How does the shock transmission, market interconnectedness, and risk spillover among the digital assets and traditional assets like bitcoins, gold-backed digital assets, gold-backed cryptocurrencies, fiat currencies, and gold change against different quantiles and frequency domain conditions?
In addition to answering the above questions, the study further contributes to the existing literature in the following ways. Most of the existing studies on digital asset interconnectedness revolve around the post-COVID-19 timeline. However, recent global economic turbulences, such as wars, pandemics, financial crises, and trade conflicts, have caused significant disruptions. Therefore, it becomes imperative to examine how the interrelationships between the aforementioned asset classes change in response to these changing economic landscapes. Thus, to answer this question, the present study explores the dynamic interconnectedness between digital assets and traditional assets, covering the timeline of the post-2008 financial crisis recovery, the emergence of cryptocurrencies, trade wars, the COVID-19 pandemic, the Russia–Ukraine war, etc. This approach contributes to a deeper understanding of how spillover and market connectedness fluctuate in different market conditions. Additionally, in terms of methodological contribution, the existing studies on market interconnectedness between digital assets and traditional assets mostly employ a quantile approach. A simple quantile approach offers limited insight into the variability or evolution of connectedness over time, and it may overlook crucial dynamics such as time-varying correlations, asymmetries in market behavior, or frequency-specific relationships. Therefore, to overcome this limitation and to contribute to the methodological novelty, the present study employs robust dynamic connectedness, quantile connectedness, and time-frequency connectedness analyses. Dynamic connectedness models account for changes over time, which is critical for financial markets that are continuously changing due to evolving economic conditions. Time-frequency and quantile connectedness analyses provide a more comprehensive evaluation by exploring connectedness at different levels of the distribution and across different frequencies, revealing hidden patterns and dependencies that may not be visible in a simple quantile framework. These advanced techniques assist in capturing the non-linearities, asymmetries, and shifts in relationships that simple quantile approaches may miss, especially under extreme market conditions. The empirical outcome from the aforementioned model will assist investors and policymakers in making investment decisions during turbulent times and provide guidance on formulating appropriate portfolio management strategies.
The remaining part of the paper is organized as follows.
Section 2 provides a comprehensive evaluation of the existing literature and theoretical frameworks.
Section 3 explains the methodology employed.
Section 4 exhibits the analysis results and discussion, and finally, the
Section 5 offers concluding remarks.
2. Literature Review
The rapid transformation of the economic and technological landscape has resulted in a substantial shift in trading strategies and investor investment preferences. With the introduction of new investments and technology-driven asset classes, it has become critical to study the investment trends between digital and traditional assets. A popular strand on market interconnectedness attempts to look into the cross-connectedness between the yields of different asset classes with the objective of constructing optimum portfolios and devising suitable hedging strategies. Among the studies on market interconnectedness, the most widely discussed topics within the financial markets are the interconnections between oil and stock markets. Zhang [
13], Ferrer et al. [
14], and Cui et al. [
15], among others, have extensively investigated the dynamic interconnections of oil and stock markets and determined that oil prices have a considerable spillover effect on stock market indices at both the regional and global levels. A few studies, such as those by Nham et al. [
16] and Mensi et al. [
17], have extended prior research by including gold and commodities in their examination of the dynamic interconnectivity of financial assets. These studies demonstrated the hedging properties of gold and specific commodities against the negative returns of other financial assets.
Subsequently, with the progression of digital technologies and the emergence of novel investment options, attention has shifted toward investigating the interconnections between digital assets and conventional financial assets. In this context, Anahron and Demir [
18] are the first to examine the pattern of connectedness between digital assets and conventional assets by exploring the pattern of volatility connectedness between NFTs, equities, bonds, gold, and oil prices by using TVP and VAR methodologies. The empirical estimate demonstrated that NFTs are resilient to shocks transmitted from traditional and conventional assets, particularly during a pandemic scenario. In continuation, Yousuf and Yaravaya [
19] investigated the static and dynamic relationships between NFT, DeFi, oil, gold, and the S&P 500 using the TVP and VAR methodologies. The results demonstrated a weak static return and volatility between the S&P 500, NFTs, and DeFi, implying that these digital assets are indifferent to traditional assets. The study further concluded that oil and bitcoins are net transmitters of return and volatility spillover, whereas the other assets are net receivers of spillover. Furthermore, the study indicates that there was a higher level of connectivity and volatility during the initial phase of the cryptocurrency bubble. Likewise, Wang et al. [
20] explored the dynamic interconnectedness between bitcoin and 14 conventional financial assets in different time-frequency domains. The author concluded that bitcoin is closer to a risky asset than a safe-haven asset; moreover, in the long run, it can be used as a hedge against the U.S. stock market, the Chinese stock market, and crude oil prices. Extending the above studies, Goodell et al. [
7] examined the time-varying connectedness between digital assets and traditional assets by including NFTs, bitcoins, chain link, and renewable energy stocks. The authors found that Bitcoin is the net transmitter of shocks, whereas Chainlink is the net receiver. Furthermore, the authors suggest that NFTs are the ideal asset to incorporate into the portfolio, given their decoupling from shocks from other asset classes. In another study, Barson and Junior [
21] investigated the connectedness between 12 conventional assets, central bank digital currency indices, NFTs, and the cryptocurrency environmental attention index. The wavelet multiple correlation technique revealed high correlation among the selected asset class during short-term and long-term periods. Furthermore, the authors reported a pair-specific, frequency-dependent connectedness among the assets, with the spillover effect being more dominant in the short run and decreasing over time. Kayani et al. [
10] attempted to revisit the study of Barson and Junior [
21] by exploring the quantile connectedness of digital assets, traditional assets, and renewable energy stocks. The authors confirmed that Bitcoin is the net transmitter of shocks, whereas DeFi and Chainlink are net receivers. Furthermore, the authors argued that digital assets’ volatility exceeds that of traditional assets. In a similar vein, Liao et al. [
9] investigated the interconnections and contagion between cryptocurrencies, DeFi, NFTs, and traditional financial assets and revealed that there exists tail risk spillover between digital financial assets and traditional financial assets, where the risk spillover between digital assets and commodities is bidirectional, and the risk spillovers from stocks to digital assets as well as from commodities to stocks are unidirectional. In addition to the above studies, several other scholars also attempted to explore the dynamic interconnectedness between digital assets and traditional assets. For instance, Ullah [
22] explored the dynamic interconnectedness between cryptocurrency and financial markets, focusing specifically on the Russian financial market, and concluded that cryptocurrencies are net transmitters of shocks to the Russian financial market. Ali et al. [
11] examined the dynamic interconnectedness between digital assets and the equity markets of BRICS countries, concluding that NFTs are net transmitters of shocks to the BRICS equity markets. Recently, Alnafisah et al. [
23] explored the interconnectedness and spillover effects between cryptocurrencies, NFTs, and decentralized financial assets in both endogenous and exogenous situations and concluded that during the COVID-19 pandemic, Binance Coin, Ethereum, and Bitcoin acted as net transmitters, whereas decentralized financial assets and NFT-related cryptocurrencies served as net receivers. Conversely, in the Russia–Ukraine conflict, LINK, FTX, and Theta transitioned from transmitters to net receivers.
In a nutshell, the above literature review explains that since the advent of new technology-driven financial instruments, several authors have examined the changing dynamics of interconnectedness among digital assets and traditional assets. Nevertheless, the above literature review reveals that most of the studies examining the aforementioned relationship focus on NFTs, bitcoins, equity markets, oil prices, etc. [
9,
10,
19]. As per the authors’ knowledge, except for a few studies, for instance, that of Jalan et al. [
24], who performed a systemic analysis of gold-backed cryptocurrencies during the COVID-19 pandemic; Nugroho [
25], who explored the spillovers and bivariate portfolios of gold-backed cryptocurrencies and gold during the COVID-19 outbreak; and Gökgöz et al. [
26], who conducted a comparative analysis of gold, bitcoin, and gold-backed cryptocurrencies as safe havens during global crises, there is no existing literature that has examined the dynamic connectedness between traditional and digital assets by including an array of digital assets and tradition asset like bitcoins, gold-backed digital assets, gold-backed cryptocurrencies, fiat currencies, and gold. Thus, the present study contributes to addressing the existing gap by including a diverse mix of digital assets and traditional assets like bitcoins, gold-backed digital assets, gold-backed cryptocurrencies, fiat currencies, and gold, which will help in understanding the risk transmission mechanism and aid in devising efficient strategies for risk mitigation and optimal portfolio construction. Moreover, the majority of existing literature on the dynamic interconnectedness between digital assets and traditional assets, with the exception of a few studies, focuses on the pre- and post-COVID-19 pandemic periods [
20,
23]. Notably, there is a lack of comprehensive analysis on how the interconnectedness between traditional and digital assets responds to extreme events like the post-2008 financial crisis, the cryptocurrency bubble, trade wars, the COVID-19 pandemic, and the Russia–Ukraine war. In view of the above literature gap and in response to the growing importance of digital assets, the present study seeks to evaluate the following hypothesis by examining the dynamic interconnectedness between bitcoins, gold-backed digital assets, gold-backed cryptocurrencies, fiat currencies, and gold, covering the timeline of the post-2008 financial crisis, the cryptocurrency bubble, trade wars, the COVID-19 pandemic, and the Russia–Ukraine war.
H1.: Market interconnectedness between digital assets and traditional assets increases during extreme economic situations and market upheavals.
H2.: Gold-backed digital assets and gold-backed cryptocurrencies are net risk transmitters during extreme economic situations.
H3.: Bitcoins and fiat currencies are net risk receivers during extreme economic situations.
3. Data Description and Methodology
This study uses daily return data from 3 January 2013 to 5 August 2024, covering a diverse range of assets, including traditional fiat currencies, cryptocurrencies, and gold-backed digital assets. Precisely, the dataset includes JPY/USD (Japanese Yen to US Dollar exchange rate), a traditional fiat currency pair representing the exchange rate between the Japanese Yen and the US Dollar; CHF/USD (Swiss Franc to US Dollar exchange rate), a fiat pair reflecting the value of the Swiss Franc against the US Dollar; Bitcoin (BTC), the most widely traded cryptocurrency, representative of the digital asset class; and gold (XAU/USD), with gold prices denominated in US dollars, representing a traditional safe-haven asset. Furthermore, the study includes gold-backed cryptocurrencies like Tether Gold (XAUT), which is pegged to the price of one troy ounce of physical gold held in reserves, and the Digix Gold Token (DGX), where each token represents 1 g of physical gold stored in vaults.
To conduct the dynamic connectedness, quantile connectedness, and time-frequency connectedness analyses, the data have to be stationary. So, the return series for all assets are tested for stationarity using the augmented Dickey–Fuller (ADF) test (see
Table 1). The results confirm that all series are stationary at levels, allowing for the direct application of connectedness methodologies without further differencing or transformations. The sample period from 3 January 2013 to 5 August 2024 captures crucial events in the financial and cryptocurrency markets, such as the post-2008 financial crisis recovery, the emergence of cryptocurrencies, trade wars, the COVID-19 pandemic, and increasing inflation rates in major economies. This period provides a broad perspective on the dynamic interrelationships between traditional and digital assets during both stable periods and times of heightened uncertainty.
Figure 1 captures the total connectedness index across digital and traditional assets. Between 2021 and 2024, the total connectedness of the assets displays notable fluctuations, reflecting key financial events and global economic shifts. In the beginning of 2021, as global economies began to recover from the COVID-19 pandemic, there was a sharp increase in connectedness. This period also coincides with increasing inflation concerns and central bank interventions, which created uncertainty across markets, increasing interdependence among traditional fiat currencies, cryptocurrencies, and gold-backed digital assets. These spikes validate Hypothesis 1, indicating heightened co-movement during crisis periods. In view of the MPT, our findings that digital assets such as Bitcoin exhibit lower connectedness with traditional assets during economic uncertainty indicate potential diversification benefits, revalidating the theoretical proposition that combining uncorrelated assets can lower overall portfolio risk. Another peak in connectedness occurs during the first half of 2023. This period aligned with escalating geopolitical tensions, including the aftermath of energy supply disruptions and inflationary pressures from previous years. Market participants, grappling with elevated uncertainty, exhibited heightened sensitivity to global risk factors, driving greater co-movement between asset classes, which substantiates hypothesis 1. As the market stabilized in late 2023 and early 2024, connectedness progressively declined, although it remained elevated compared to pre-2023 levels. This reflects the lasting impact of economic shocks all through this period and the continuing integration of digital assets like Bitcoin and gold-backed cryptocurrencies into broader financial markets.
Figure 2 illustrates the evolution of net connectedness across asset classes, capturing not only the directionality of spillovers but also their intensity during key periods of market stress. Gold (XAU) and Tether Gold (XAUT) emerge as persistent net transmitters of shocks, particularly during high-volatility windows such as early 2021 and 2023, which confirms their active role in influencing the dynamics of the broader financial system and supports Hypothesis 2. Their transmission peaks reflect investor shifts toward tangible safe-haven assets when macroeconomic and geopolitical risks escalate.
In contrast, Bitcoin (BTC) and fiat currency pairs (JPY/USD and CHF/USD) consistently function as net recipients, reinforcing Hypothesis 3. Bitcoin’s vulnerability to external shocks, especially following its speculative rallies during the end of 2022 and in 2023, coinciding with heightened global financial uncertainty, tightening monetary policies, and shifts in investor sentiment toward safer assets, underscores its reactive nature and limited capacity to serve as a reliable hedge during systemic stress. This positions it more as a reactive asset. DGX, on the other hand, remains marginal in its systemic role, showing limited directional influence and underscoring its peripheral status in volatility propagation.
The observed patterns are not only consistent with earlier studies by Lamine et al. [
27] and Gökgöz et al. [
26] but also reveal a structural hierarchy in shock transmission within the asset network. Between 2021 and 2024, we noted pronounced fluctuations in net roles, with gold and XAUT intensifying their transmitter status during inflationary and geopolitical flare-ups, while BTC and CHF/USD deepened their receiver positions amid flight-to-quality behavior. These dynamics underline the differentiated functional roles of assets during crisis periods, where gold-backed instruments actively shape inter-asset volatility while digital and fiat assets absorb it.
By 2024, these patterns remained observable but with a slightly reduced magnitude, possibly due to market stabilization, recalibrated investor strategies, or emerging asset reclassification. Such temporal attenuation, though subtle, may signal the onset of market segmentation and fragmentation phenomena that warrant close monitoring in the post-2024 landscape. Overall, these insights not only reinforce Hypotheses 2 and 3 but also offer valuable signals for portfolio risk management and asset classification under systemic stress.
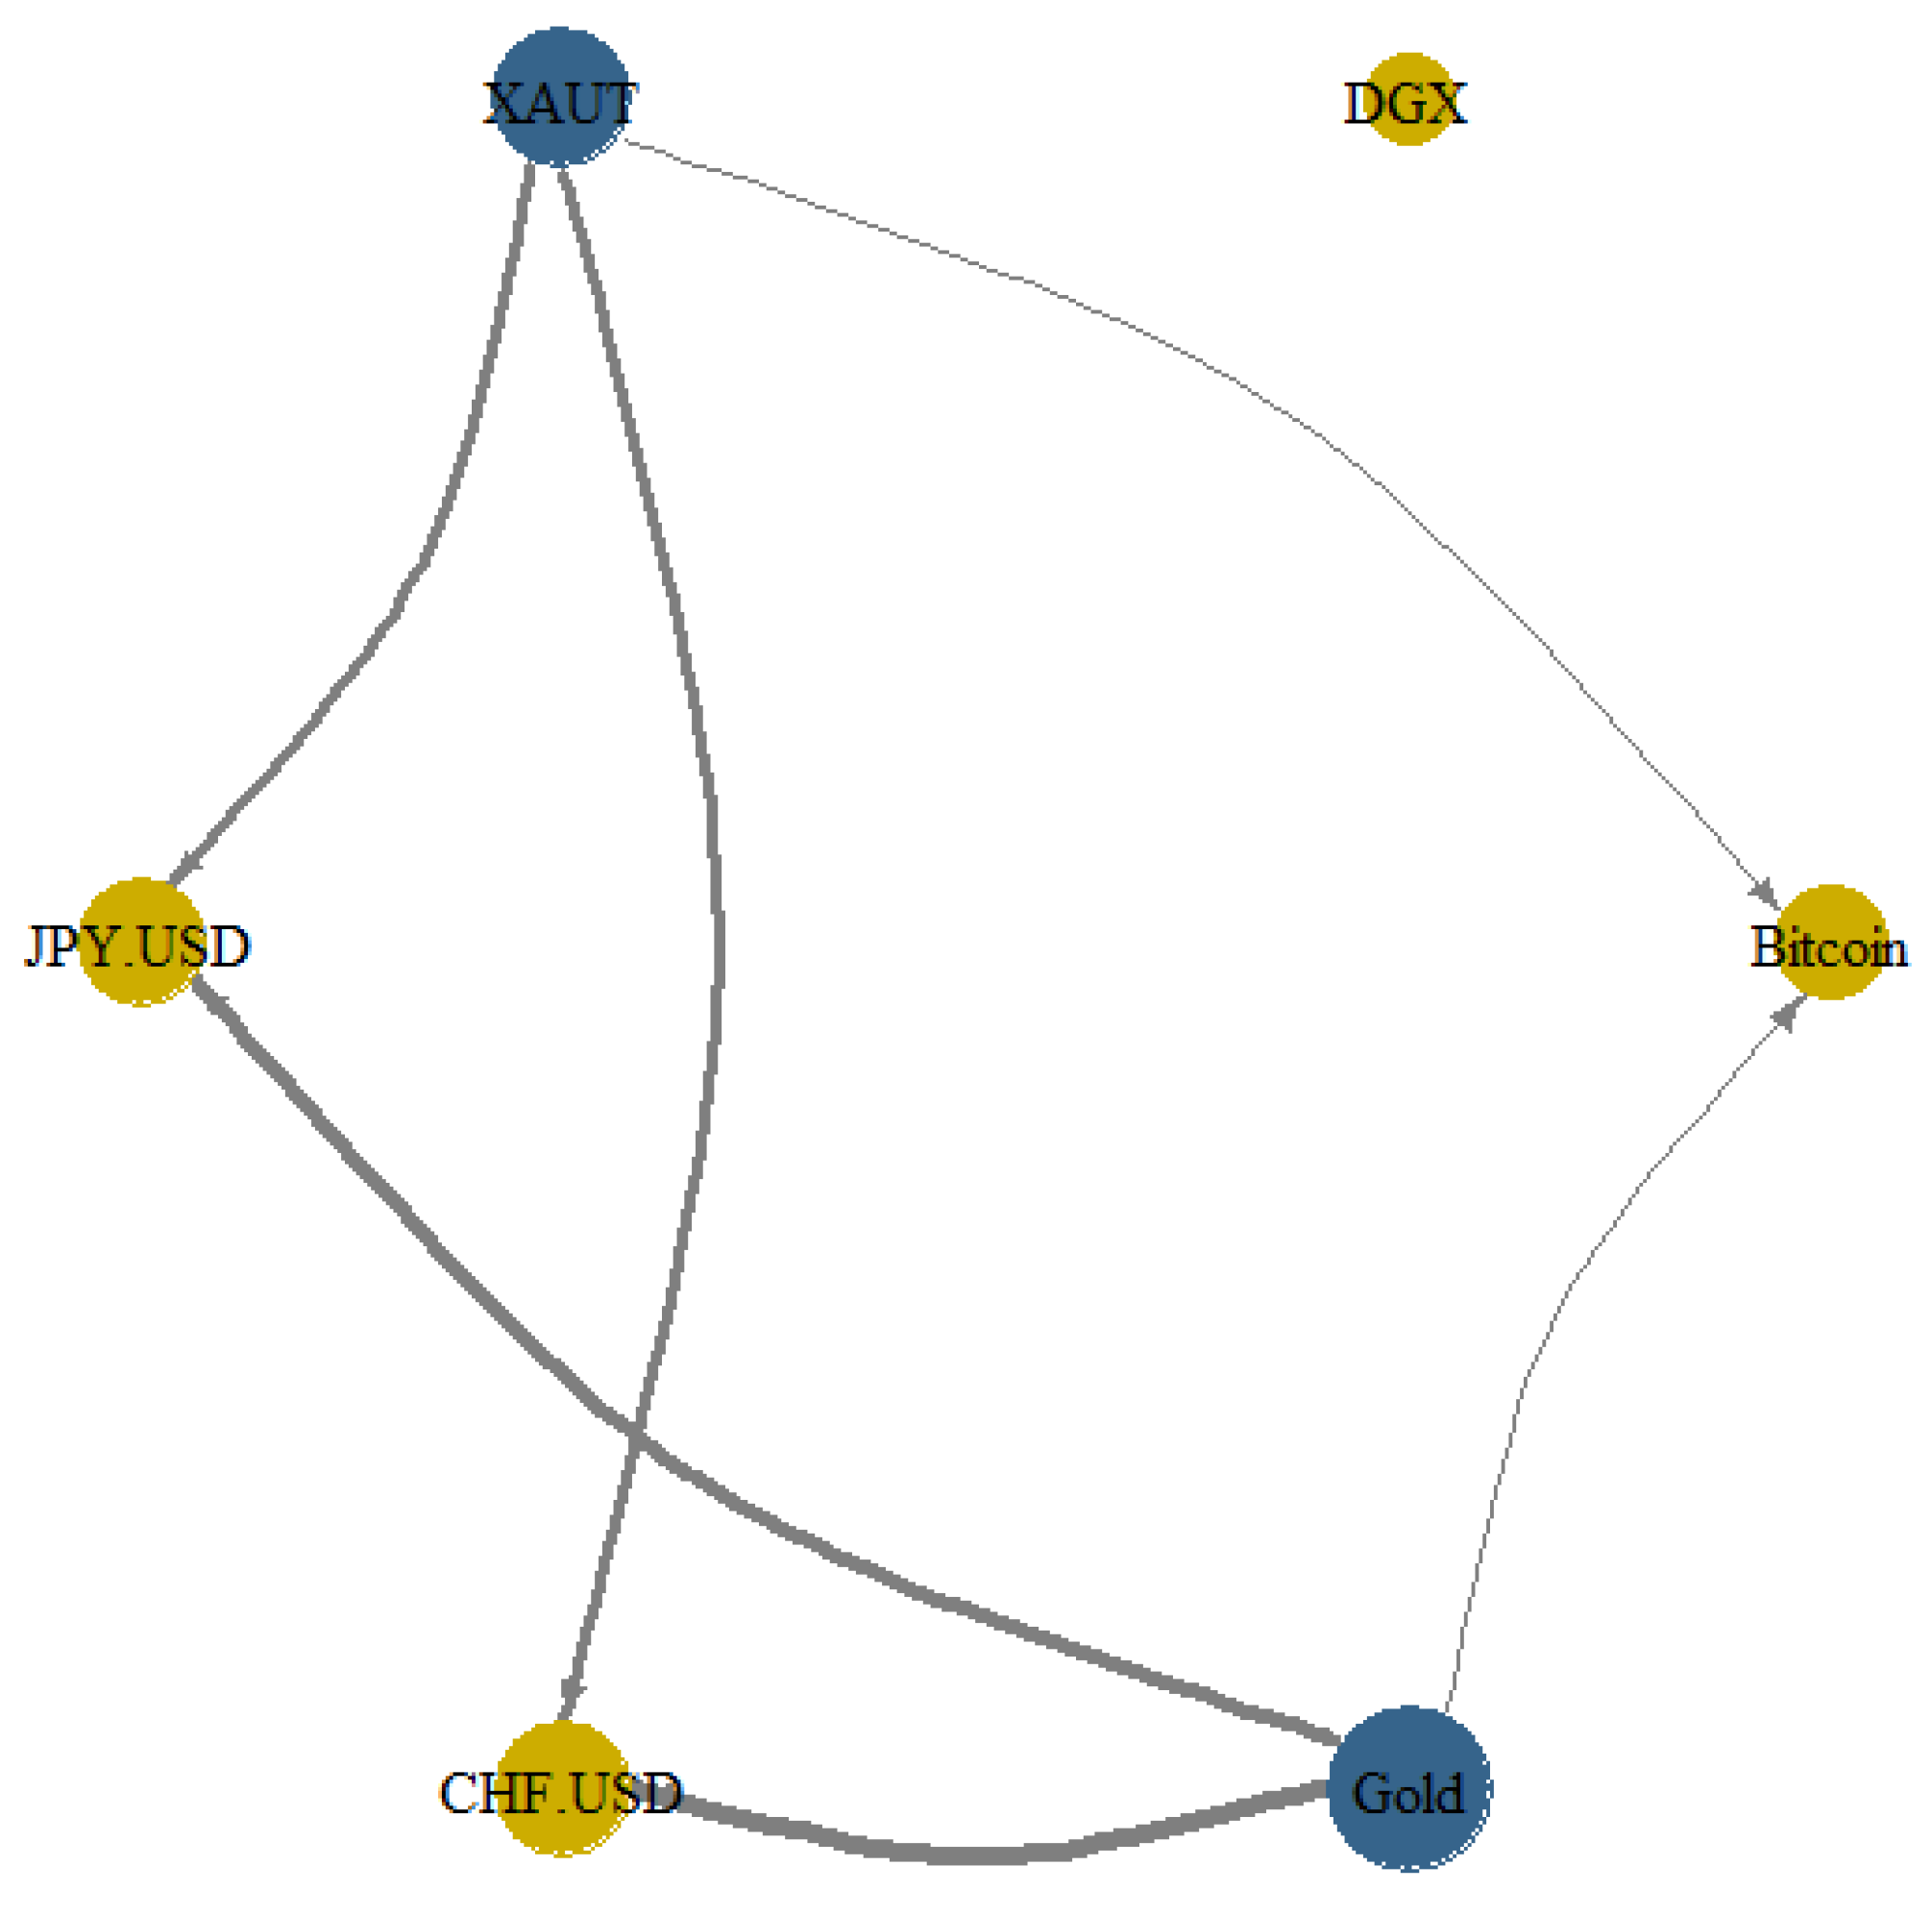
The network plot for the 2021–2024 period provides a visually intuitive representation of pairwise directional connectedness, revealing the underlying architecture of shock transmission across asset classes. Gold (XAU/USD) and Tether Gold (XAUT) emerge as dominant net transmitters, represented by large blue nodes that signify their centrality and influence within the shock propagation network. Their role becomes especially prominent during episodes of elevated inflation and macroeconomic stress, reinforcing their status as key volatility drivers in turbulent environments. This finding aligns with the study by Lamine et al. [
27], which similarly identified gold-backed assets as core transmitters vis-à-vis Bitcoin.
In contrast, Bitcoin (BTC), CHF/USD, JPY/USD, and DGX appear as peripheral nodes in the network, consistently functioning as net recipients of shocks, denoted by yellow-colored markers. Bitcoin’s position as a receiver, despite its market dominance, reflects its tendency to absorb shocks rather than generate systemic spillovers—likely due to its volatility being more reactive than causative. The fiat currencies, traditionally viewed as safe havens, also absorb risk from gold and gold-backed tokens, a behavior consistent with investor reallocation during uncertain times. The directional arrows in the network further emphasize this dynamic, with the strongest flows observed from gold to CHF/USD and JPY/USD, suggesting a unidirectional transmission of volatility from commodity to currency markets. These arrows not only indicate statistical significance but also reflect real-world flight-to-quality mechanisms, whereby investors exit gold after initial shocks and reposition in fiat currencies. In context of the network theory, the centrality measures of certain digital assets during financial turmoil demonstrate their role as a buffer against financial contagion, thus exhibiting the structural prominence of interconnectedness among multi-asset systems.
Although connections involving XAUT are slightly less pronounced, their directional arrows toward both JPY/USD and CHF/USD still highlight secondary transmission roles, especially under co-movement pressure with gold. DGX remains largely disconnected, shown by the absence of directional links, underscoring its limited systemic relevance and low transmission capacity. This visual evidence reinforces the asymmetric structure of the financial system under stress, where traditional and tokenized gold instruments serve as key sources of volatility, while fiat and digital assets primarily react. Such structural insights are essential for understanding the hierarchical nature of asset interactions and their implications for shock containment and spillover amplification. The dynamic connectedness configurations detected can be inferred as changes in the financial network’s topology, where digital assets recurrently assume hub-like characteristics, advocating developing systemic prominence.
The network plot (see
Figure 3) shows that gold and XAUT (in blue) act as strong net transmitters, sending shocks primarily toward Bitcoin, JPY/USD, and CHF/USD (in yellow), which behave as net receivers. The thick directional arrows confirm that gold-backed assets dominate shock propagation, while cryptocurrencies and fiat currencies mainly absorb volatility during the analyzed period.
Table 2 presents the results of a dynamic connectedness analysis and sheds light on how much each asset’s forecast error variance is driven by its own shocks vs. external shocks from other assets. For intrinsic variance contributions, Bitcoin, DGX, and gold have relatively high self-dependence, meaning that a large portion of their forecast error variance is explicated by their own shocks. Wang et al. [
20] also projected similar shock-absorbing properties for bitcoins and gold. Precisely, Bitcoin’s own variance contribution is 88.01% and DGX’s is 93.96%, while XAUT, JPY/USD, CHF/USD, and gold exhibit lower self-contributions, with XAUT showing 43.39%, JPY/USD 57.88%, CHF/USD 56.57%, and gold 42.46%. This implies that these assets are more influenced by external shocks compared to Bitcoin and DGX.
The cross-variance contributions, reflecting how much external shocks affect each asset, highlight that XAUT is highly sensitive to other assets, with 56.61% of its variance coming from external shocks. Particularly, 36.26% of this influence comes from gold, while JPY/USD and CHF/USD also contribute 8.62% and 9.47%, respectively. Gold, while largely driven by its own shocks (42.46%), also receives significant spillovers from XAUT, which contribute 35.39% to its variance. Furthermore, JPY/USD and CHF/USD are significantly impacted by XAUT (11.24% and 12.24%) and gold (13.04% and 13.91%), underscoring the important influence of gold-backed assets on these fiat currencies.
The TO and FROM indices offer further insight into shock transmission dynamics. TO values, indicating how much each asset transmits shocks to others, reveal that gold (67.09%) and XAUT (62.89%) are the largest transmitters in the system. Bitcoin (8.51%) and DGX (5.00%) are the smallest transmitters, signifying a more isolated role for these assets. In terms of FROM values, measuring how much each asset receives shocks from others, XAUT (56.61%) and gold (57.54%) are the most impacted by external shocks. On the other hand, Bitcoin (11.99%) and DGX (6.04%) are the least affected, indicating their relatively independent behavior within the system.
The net connectedness (NET) values indicate whether an asset is a net transmitter or receiver of shocks. Gold (9.55%) and XAUT (6.28%) are net transmitters, so they exert more influence on other assets than they receive. Conversely, Bitcoin (−3.49%), DGX (−1.05%), JPY/USD (−5.16%), and CHF/USD (−6.14%) are net recipients, absorbing more shocks from others than they transmit. This is particularly true for fiat currencies, which are the largest net recipients, reflecting their vulnerability to external influences, mostly from gold-related assets.
The total connectedness index (TCI) stands at 43.55%. This designates a moderately high level of interconnectedness among the assets, with significant spillovers across the system. The ranking of transmission power (NPT) indicates that gold (rank 5) and XAUT (rank 4) are the most powerful transmitters, followed by JPY/USD and CHF/USD. Bitcoin and DGX, ranked lowest, have the least transmission power, further confirming their relative isolation in the system. The overall connectedness, as indicated by the TCI of 43.55, reveals a moderately interconnected system, with significant spillovers, particularly between gold-related assets and fiat currencies.
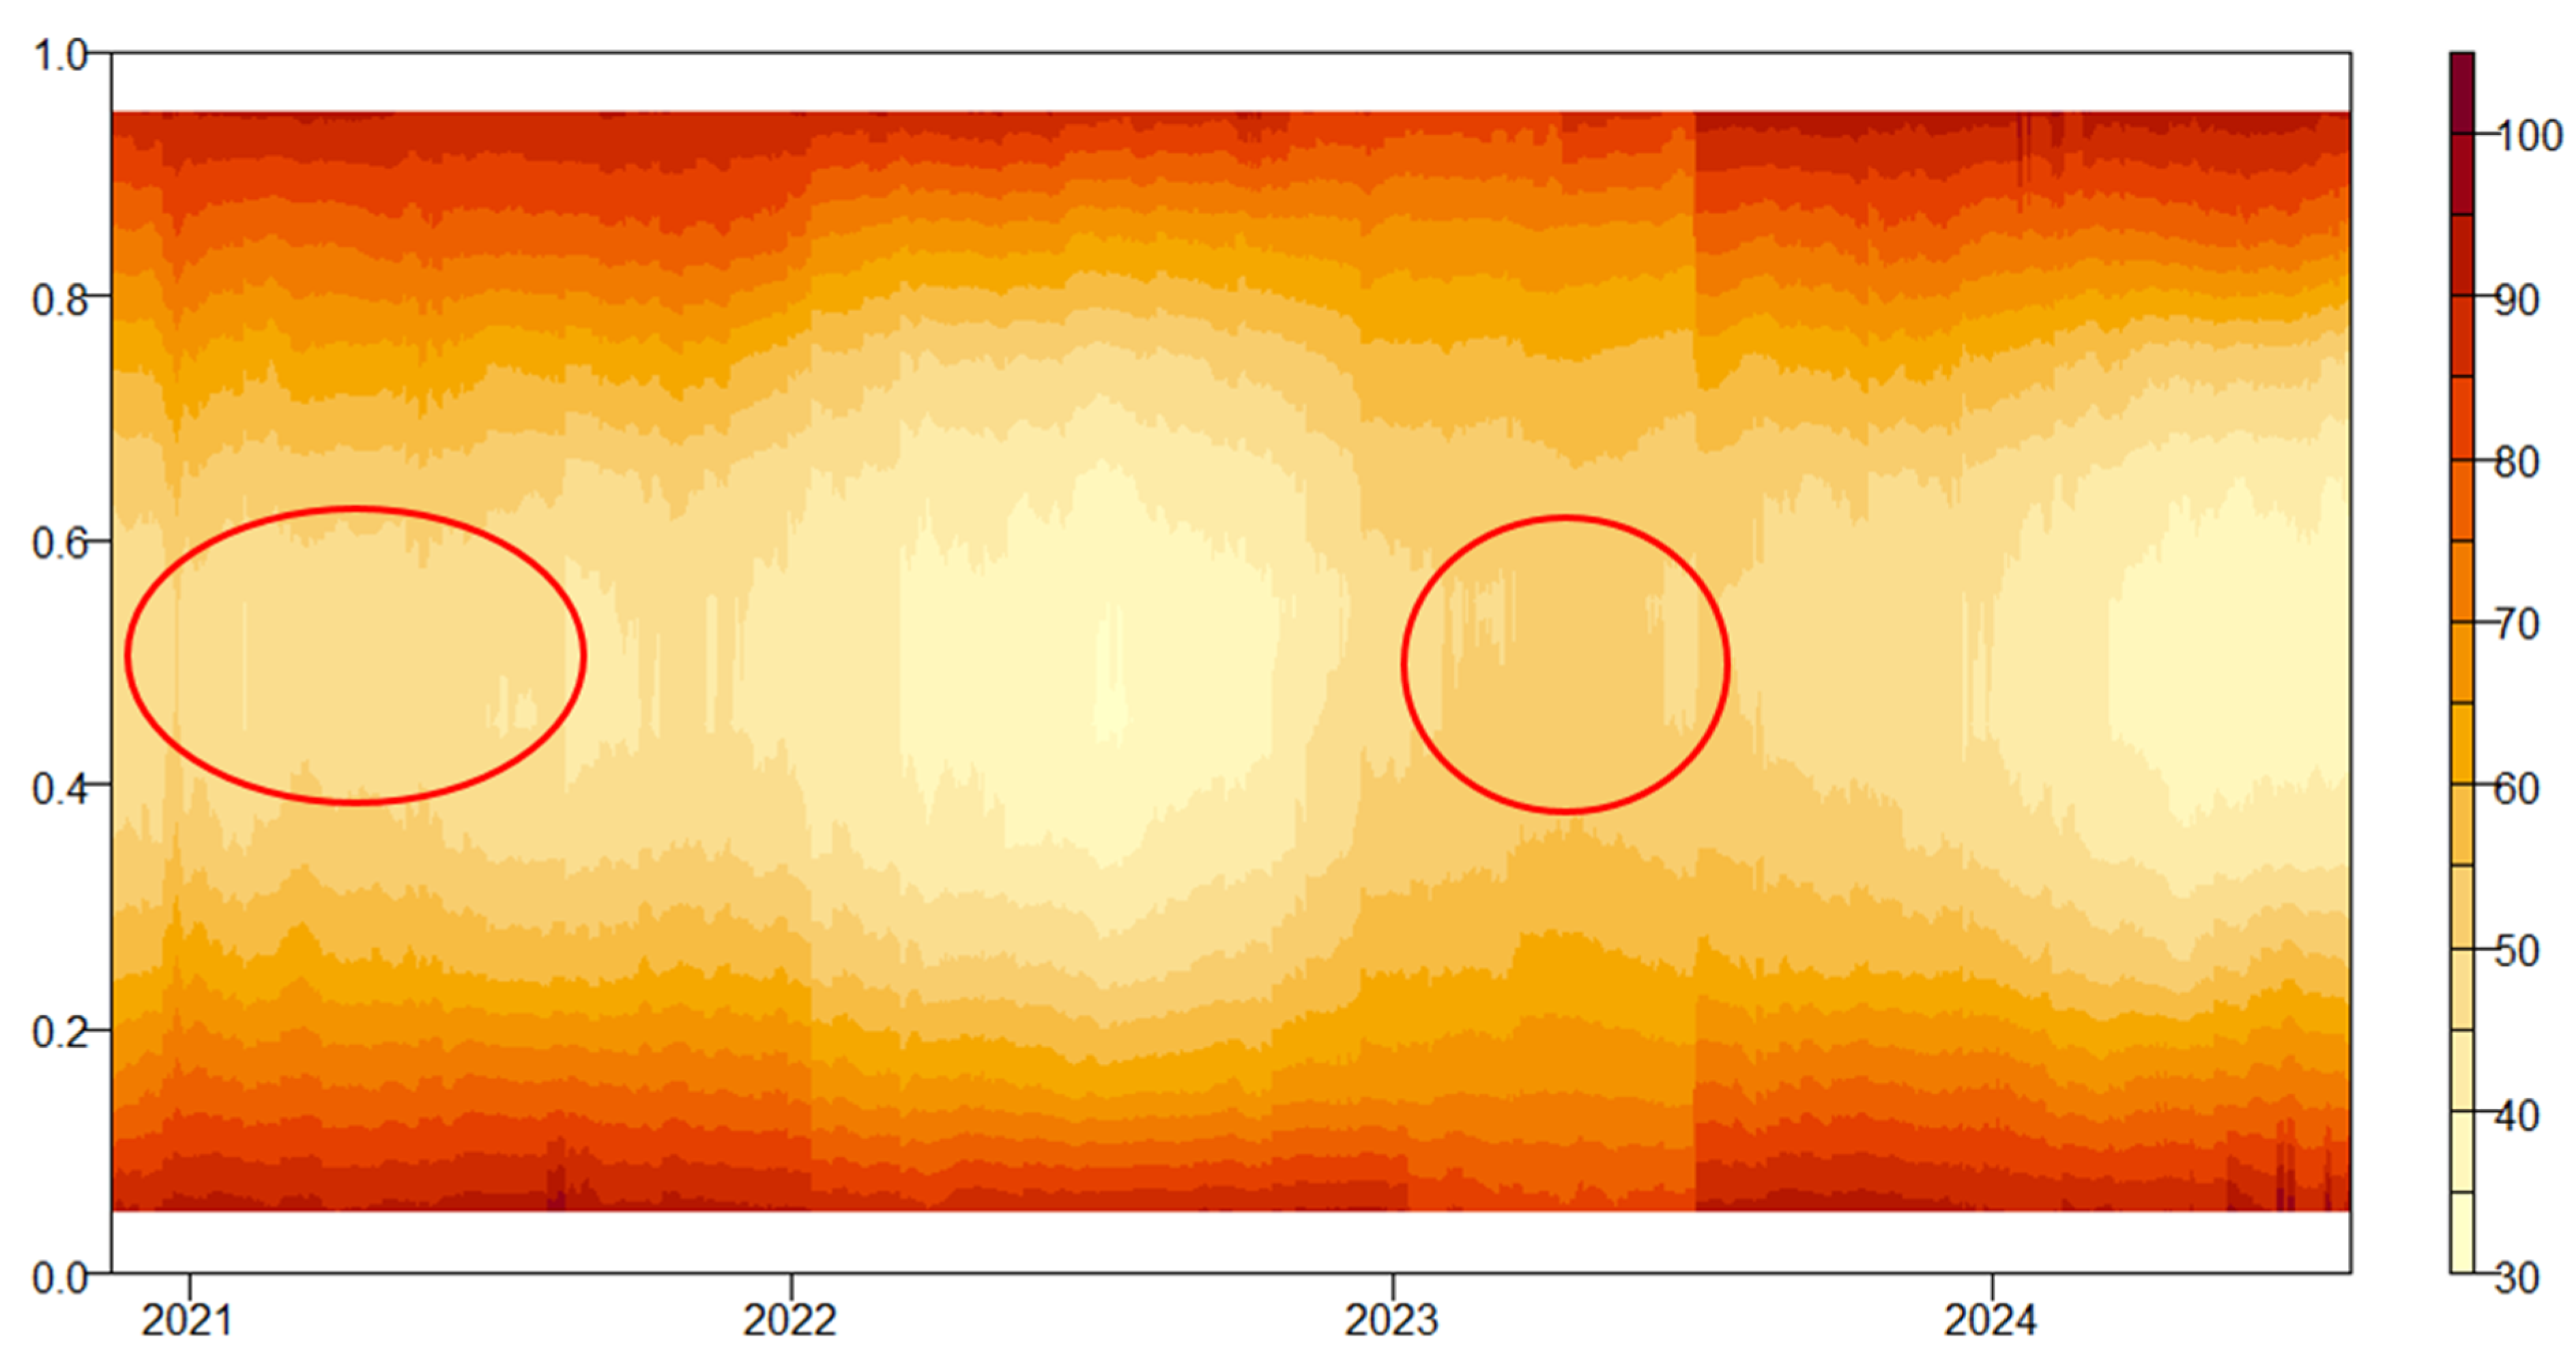
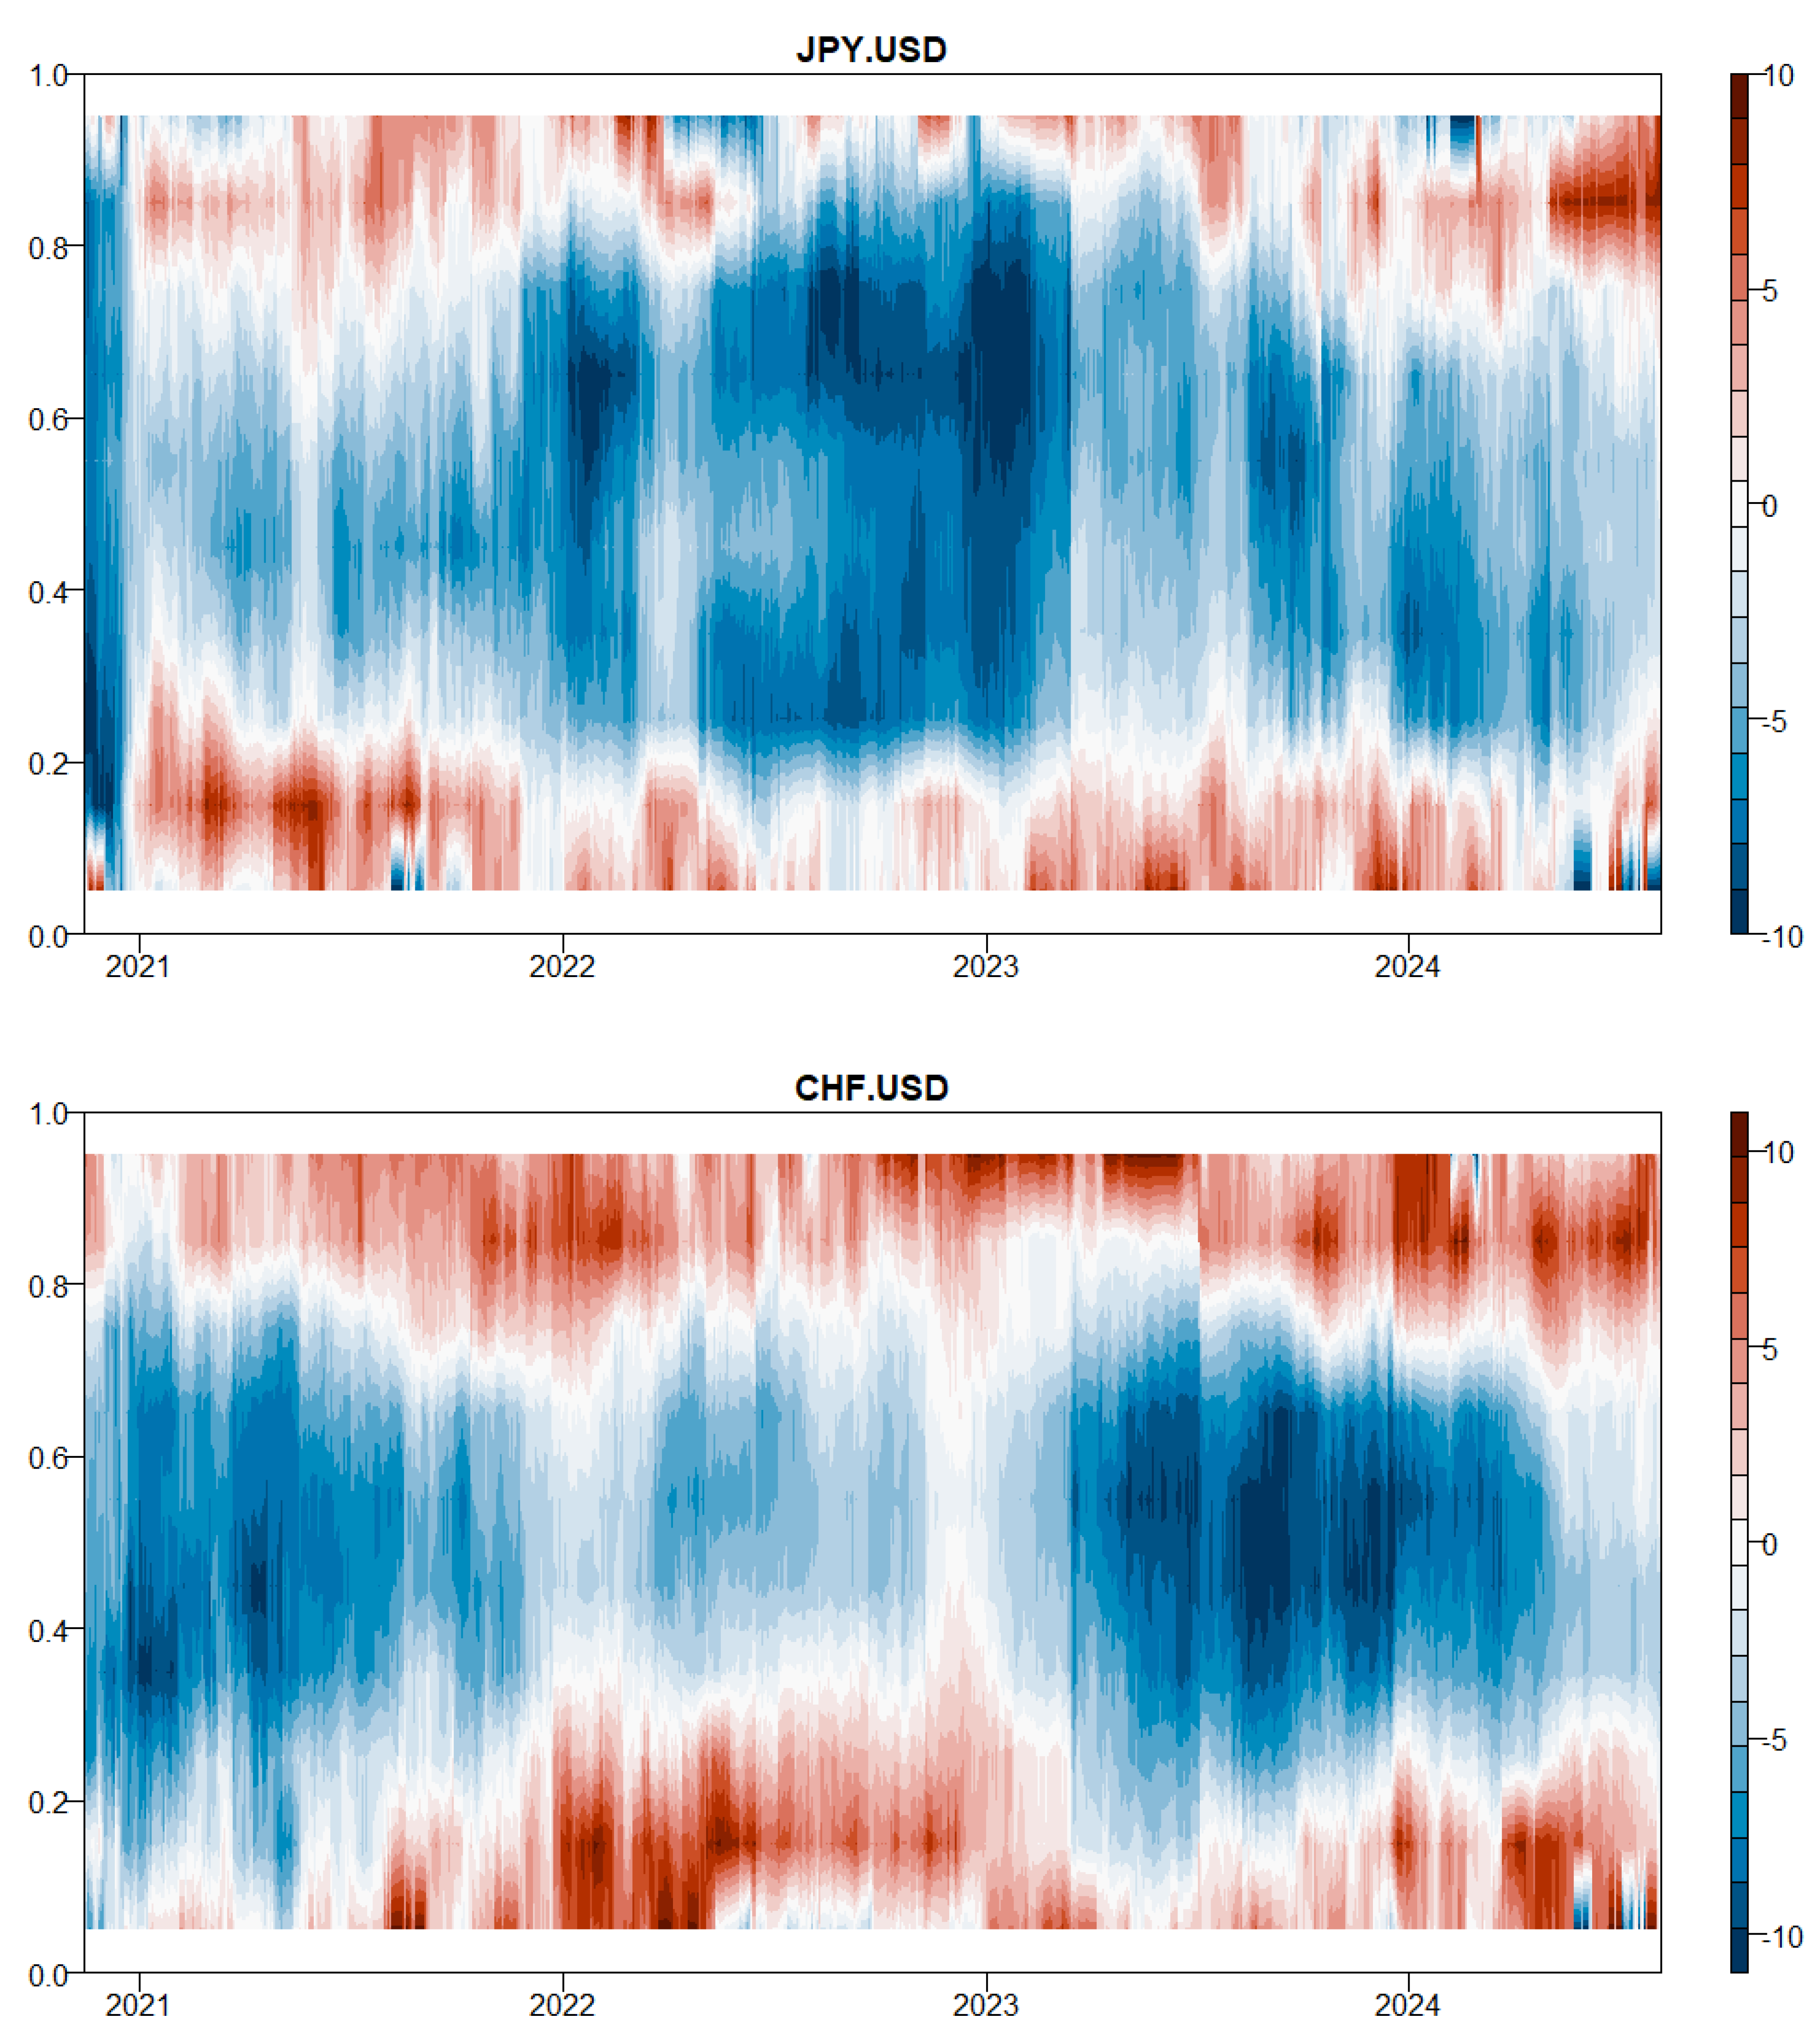
The total connectedness amid different quantiles from 2021 to 2024 in
Figure 4, highlights how interdependence among assets varies across market conditions. In the median quantile, representing more stable market conditions, total connectedness remains moderate but displays notable spikes during 2021 and the first half of 2023. As market volatility intensifies in the extreme quantiles, total connectedness reaches its highest levels, but this occurs symmetrically. This indicates that under extreme market conditions, gold, fiat currencies, cryptocurrencies, and gold-backed assets are highly interconnected, responding collectively to economic shocks. The increased interconnectedness during crises emphasizes the systemic risks and widespread market reactions to significant financial disruptions. The observed time-varying correlation structure is in line with the modern portfolio theory explanation on optimizing portfolio construction in changing environments, where asset co-movements exhibit alteration in response to macroeconomic shocks. Several existing studies have also exhibited similar outcomes while exploring market interconnectedness amid different quantiles considering a wide array of financial assets [
27,
28]. These results imply that asset class behavior becomes more synchronized as tail risks materialize, thereby reducing diversification benefits when they are most needed. This reinforces the necessity of stress-tested hedging strategies that account for non-linear contagion patterns across quantiles.
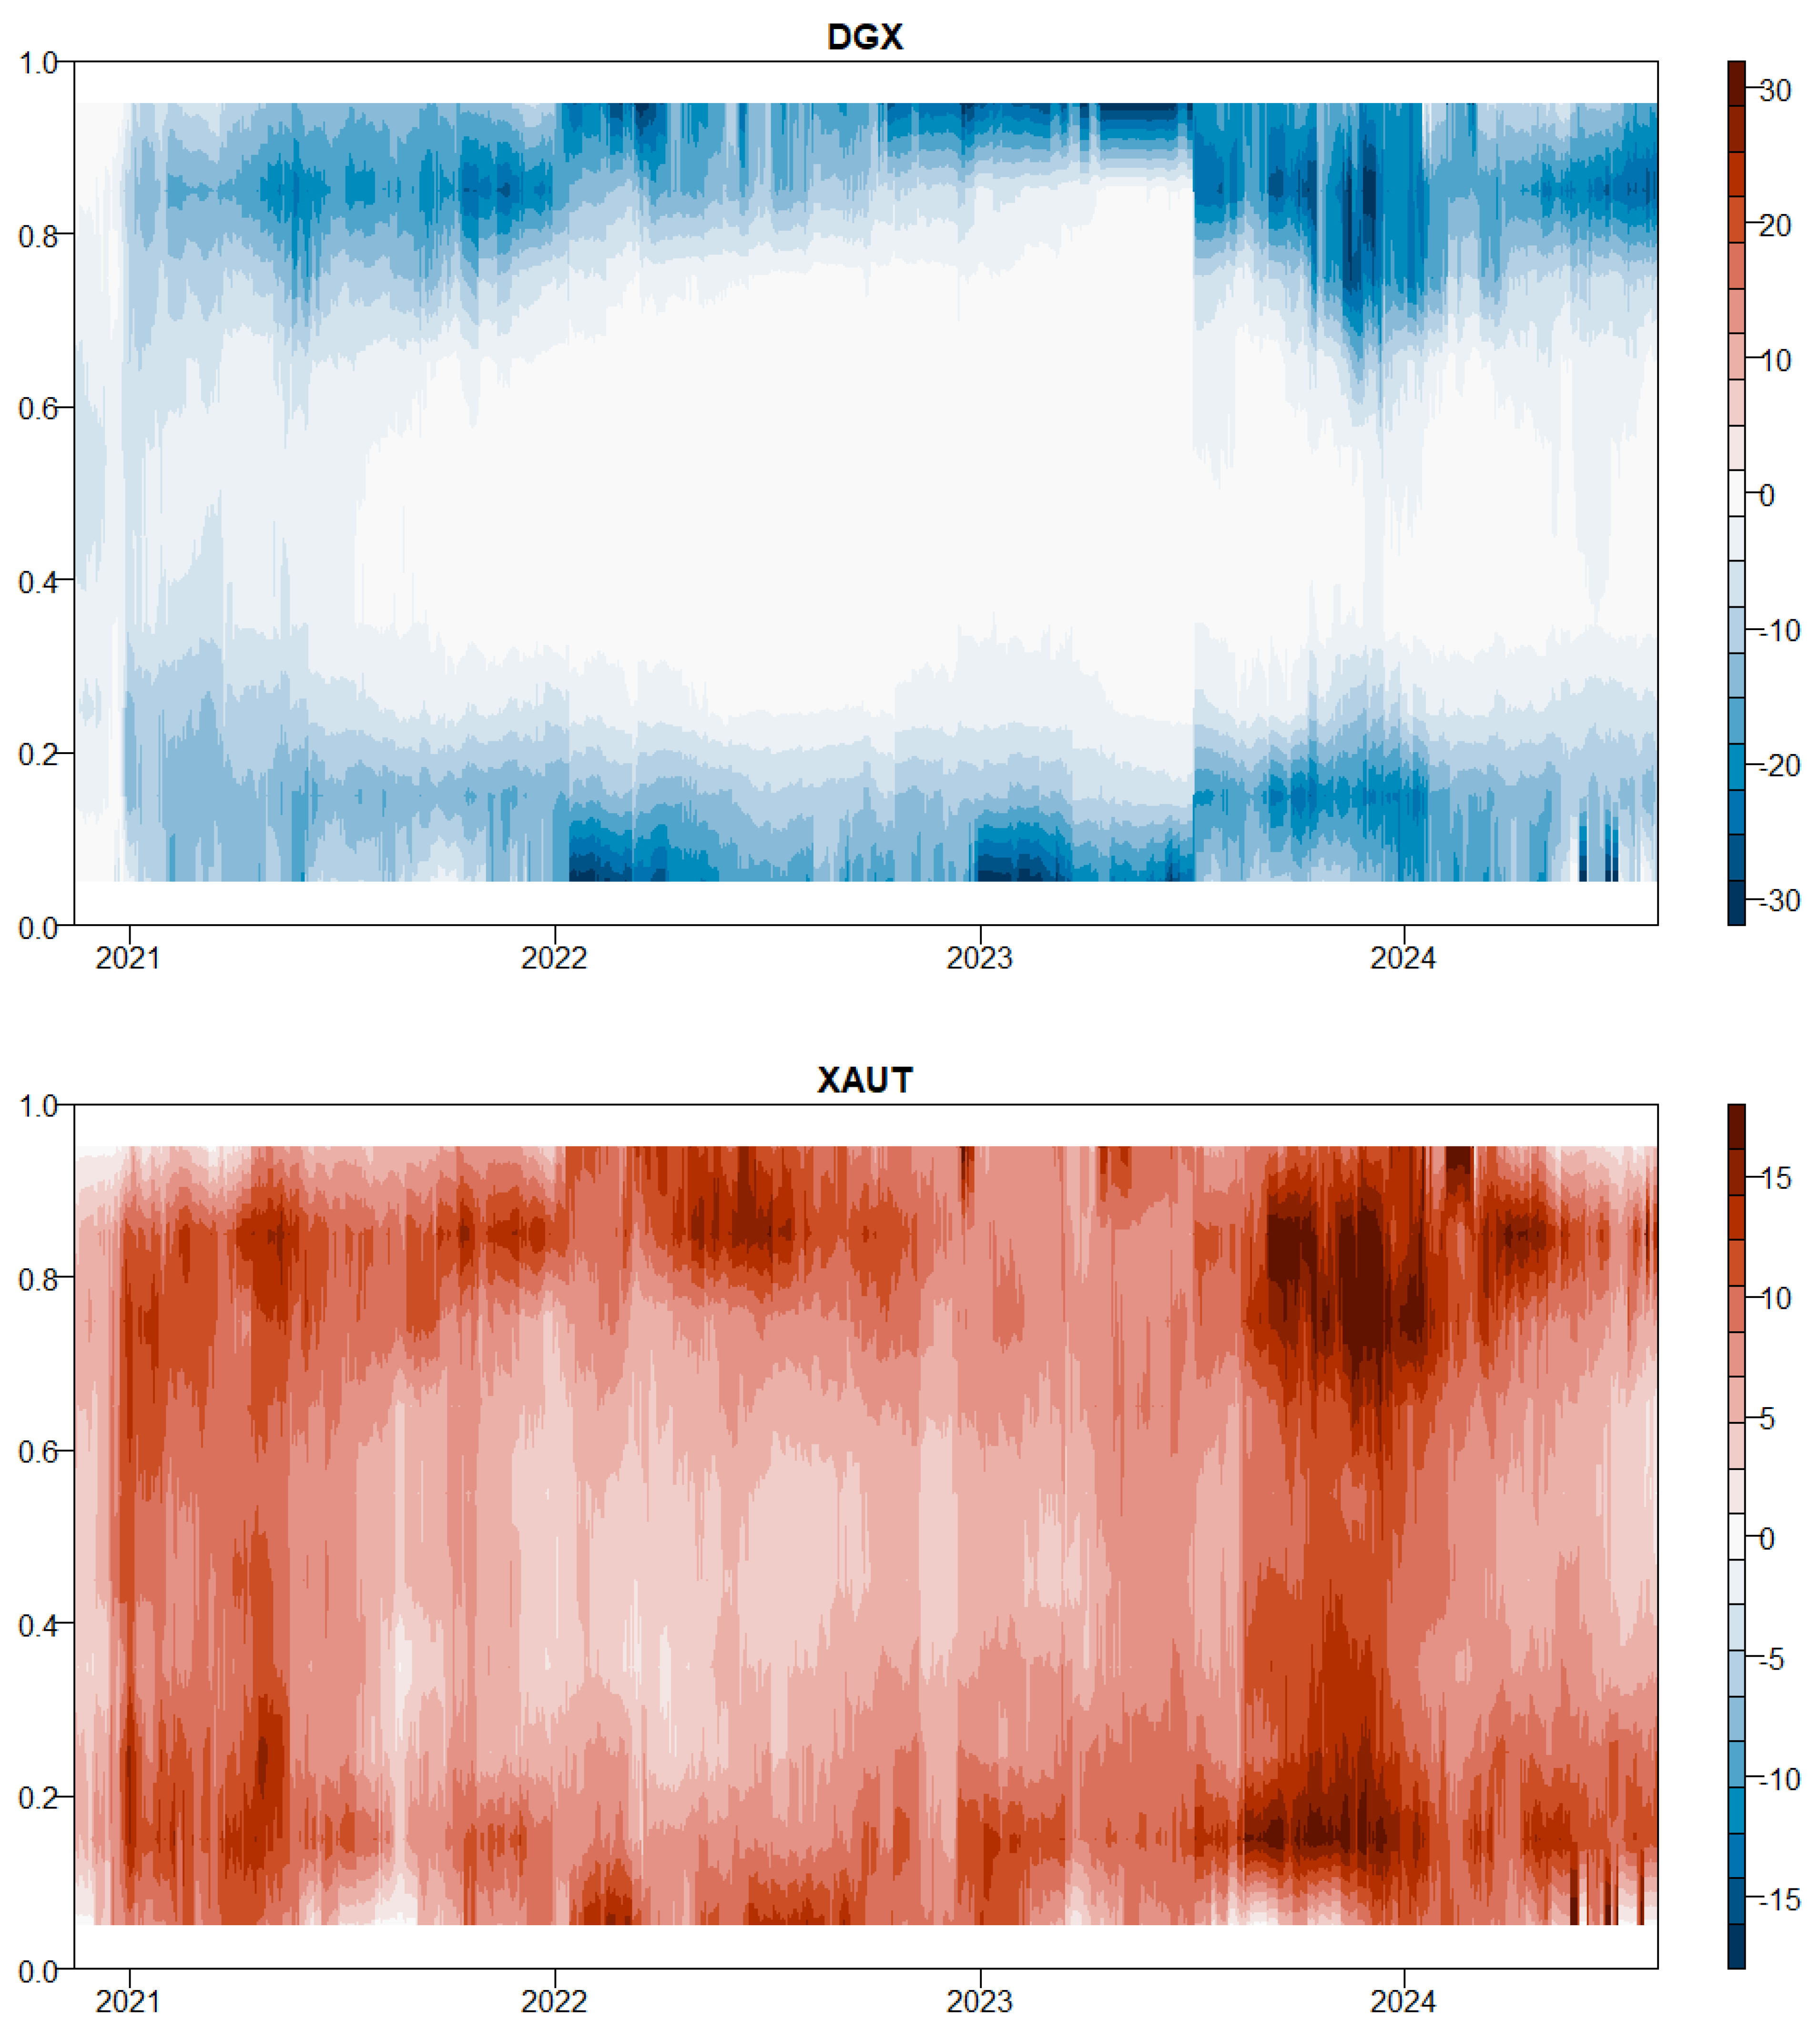
The dynamic net status of each index through quantiles in
Figure 5 reveals significant insights into the interdependence and shock transmission behavior among the assets during the analyzed period. In 2023, Bitcoin (BTC) steadily emerges as a strong net receiver across all quantiles, indicating its susceptibility to external shocks. This suggests that Bitcoin is heavily influenced by market movements and volatility in other asset classes, reinforcing its position as a reactive asset, which is also supported in previous empirical literature [
26]. The Digix Gold Token (DGX) exhibits a neutral stance in the median quantile, reflecting a balanced state of shock transmission (It neither significantly influences nor is influenced by other assets.). However, in extreme quantiles, DGX acts as a net receiver, indicating that during market stress periods, it absorbs more shocks from other assets, showcasing its sensitivity to overall market dynamics.
Tether Gold (XAUT) demonstrates a dynamic role as a strong transmitter at the beginning of 2021 and again at the end of 2023 across all quantiles. This demonstrates its significant influence during periods of both market recovery and renewed interest in gold-backed assets. Throughout the entire period, XAUT maintains a significant transmission status in extreme quantiles, indicating its ability to affect other assets during periods of market turbulence.
The Japanese Yen (JPY/USD) index is a strong net receiver in the median quantile during 2022, suggesting it is significantly influenced by external shocks in that year. Outside of this period, JPY/USD acts as a weak receiver but transitions to a transmitter in extreme quantiles. This shift indicates a change in its role, as it becomes more influential during periods of market distress, potentially reflecting its traditional status as a safe-haven currency.
The Swiss Franc to US Dollar (CHF/USD) shows a strong receiving status in both 2021 and 2023 in the median quantile, suggesting its vulnerability to shocks during these years. However, in extreme quantiles, CHF transforms into a strong transmitter, indicating a more active role in influencing other assets during turbulent market conditions. This behavior underscores the dual nature of the Swiss Franc as both a reactive and influential asset depending on the market regime.
Finally, gold (XAU/USD) is characterized as a strong transmitter at the start of 2021 and during 2023, indicating its central role in the financial ecosystem during these times. In the median quantile, gold maintains a moderate transmission status, reflecting its consistent influence without being overly reactive. However, in extreme quantiles, it reverts to a strong transmitter, highlighting its capability to affect other assets significantly during periods of severe market volatility. Generally, these findings illustrate the complex dynamics of interdependence and shock transmission across various asset classes, with each index playing a unique role depending on market conditions. These outcomes correlate with the study of Kayani et al. [
10], who explored quantile connectedness among digital assets, traditional assets, and renewable energy prices during extreme economic conditions. The periods of low connectedness strengthen the MPT framework by demonstrating windows where digital assets can act as effective risk-mitigating tools in the context of a wider investment portfolio.
Taken together, these results highlight the structural asymmetries and shifting roles of assets under different regimes of market stress. The findings carry important implications for investors seeking dynamic diversification strategies and for policymakers monitoring systemic risk transmission. The observed fragmentation from November 2023 to March 2025 suggests a departure from synchronized global behavior toward more segmented asset responses. This evolving pattern emphasizes the need for flexible, quantile-sensitive models capable of capturing non-linear interdependence in both calm and crisis conditions.
The total connectedness through frequencies, as depicted in the
Figure 6, demonstrates the overall level of interdependence among assets over time. The mainstream of this connectedness is driven by short-term interactions, represented by the red area, which dominates the graph from 2021 to 2024. Peaks in total connectedness, particularly in late 2021 and mid-2023, suggest periods of heightened market stress or volatility when asset prices become more correlated over short periods. Also, the long-term connectedness, shown in green, remains consistently low throughout the period, indicating that market dependencies are primarily short-term in nature. This dominance of short-term spillovers supports Hypothesis 1, confirming that extreme shocks result in immediate, though often temporary, synchronization across asset classes. The observed pattern also aligns with network theory, emphasizing the role of rapidly shifting linkages during crisis periods rather than stable long-term integration.
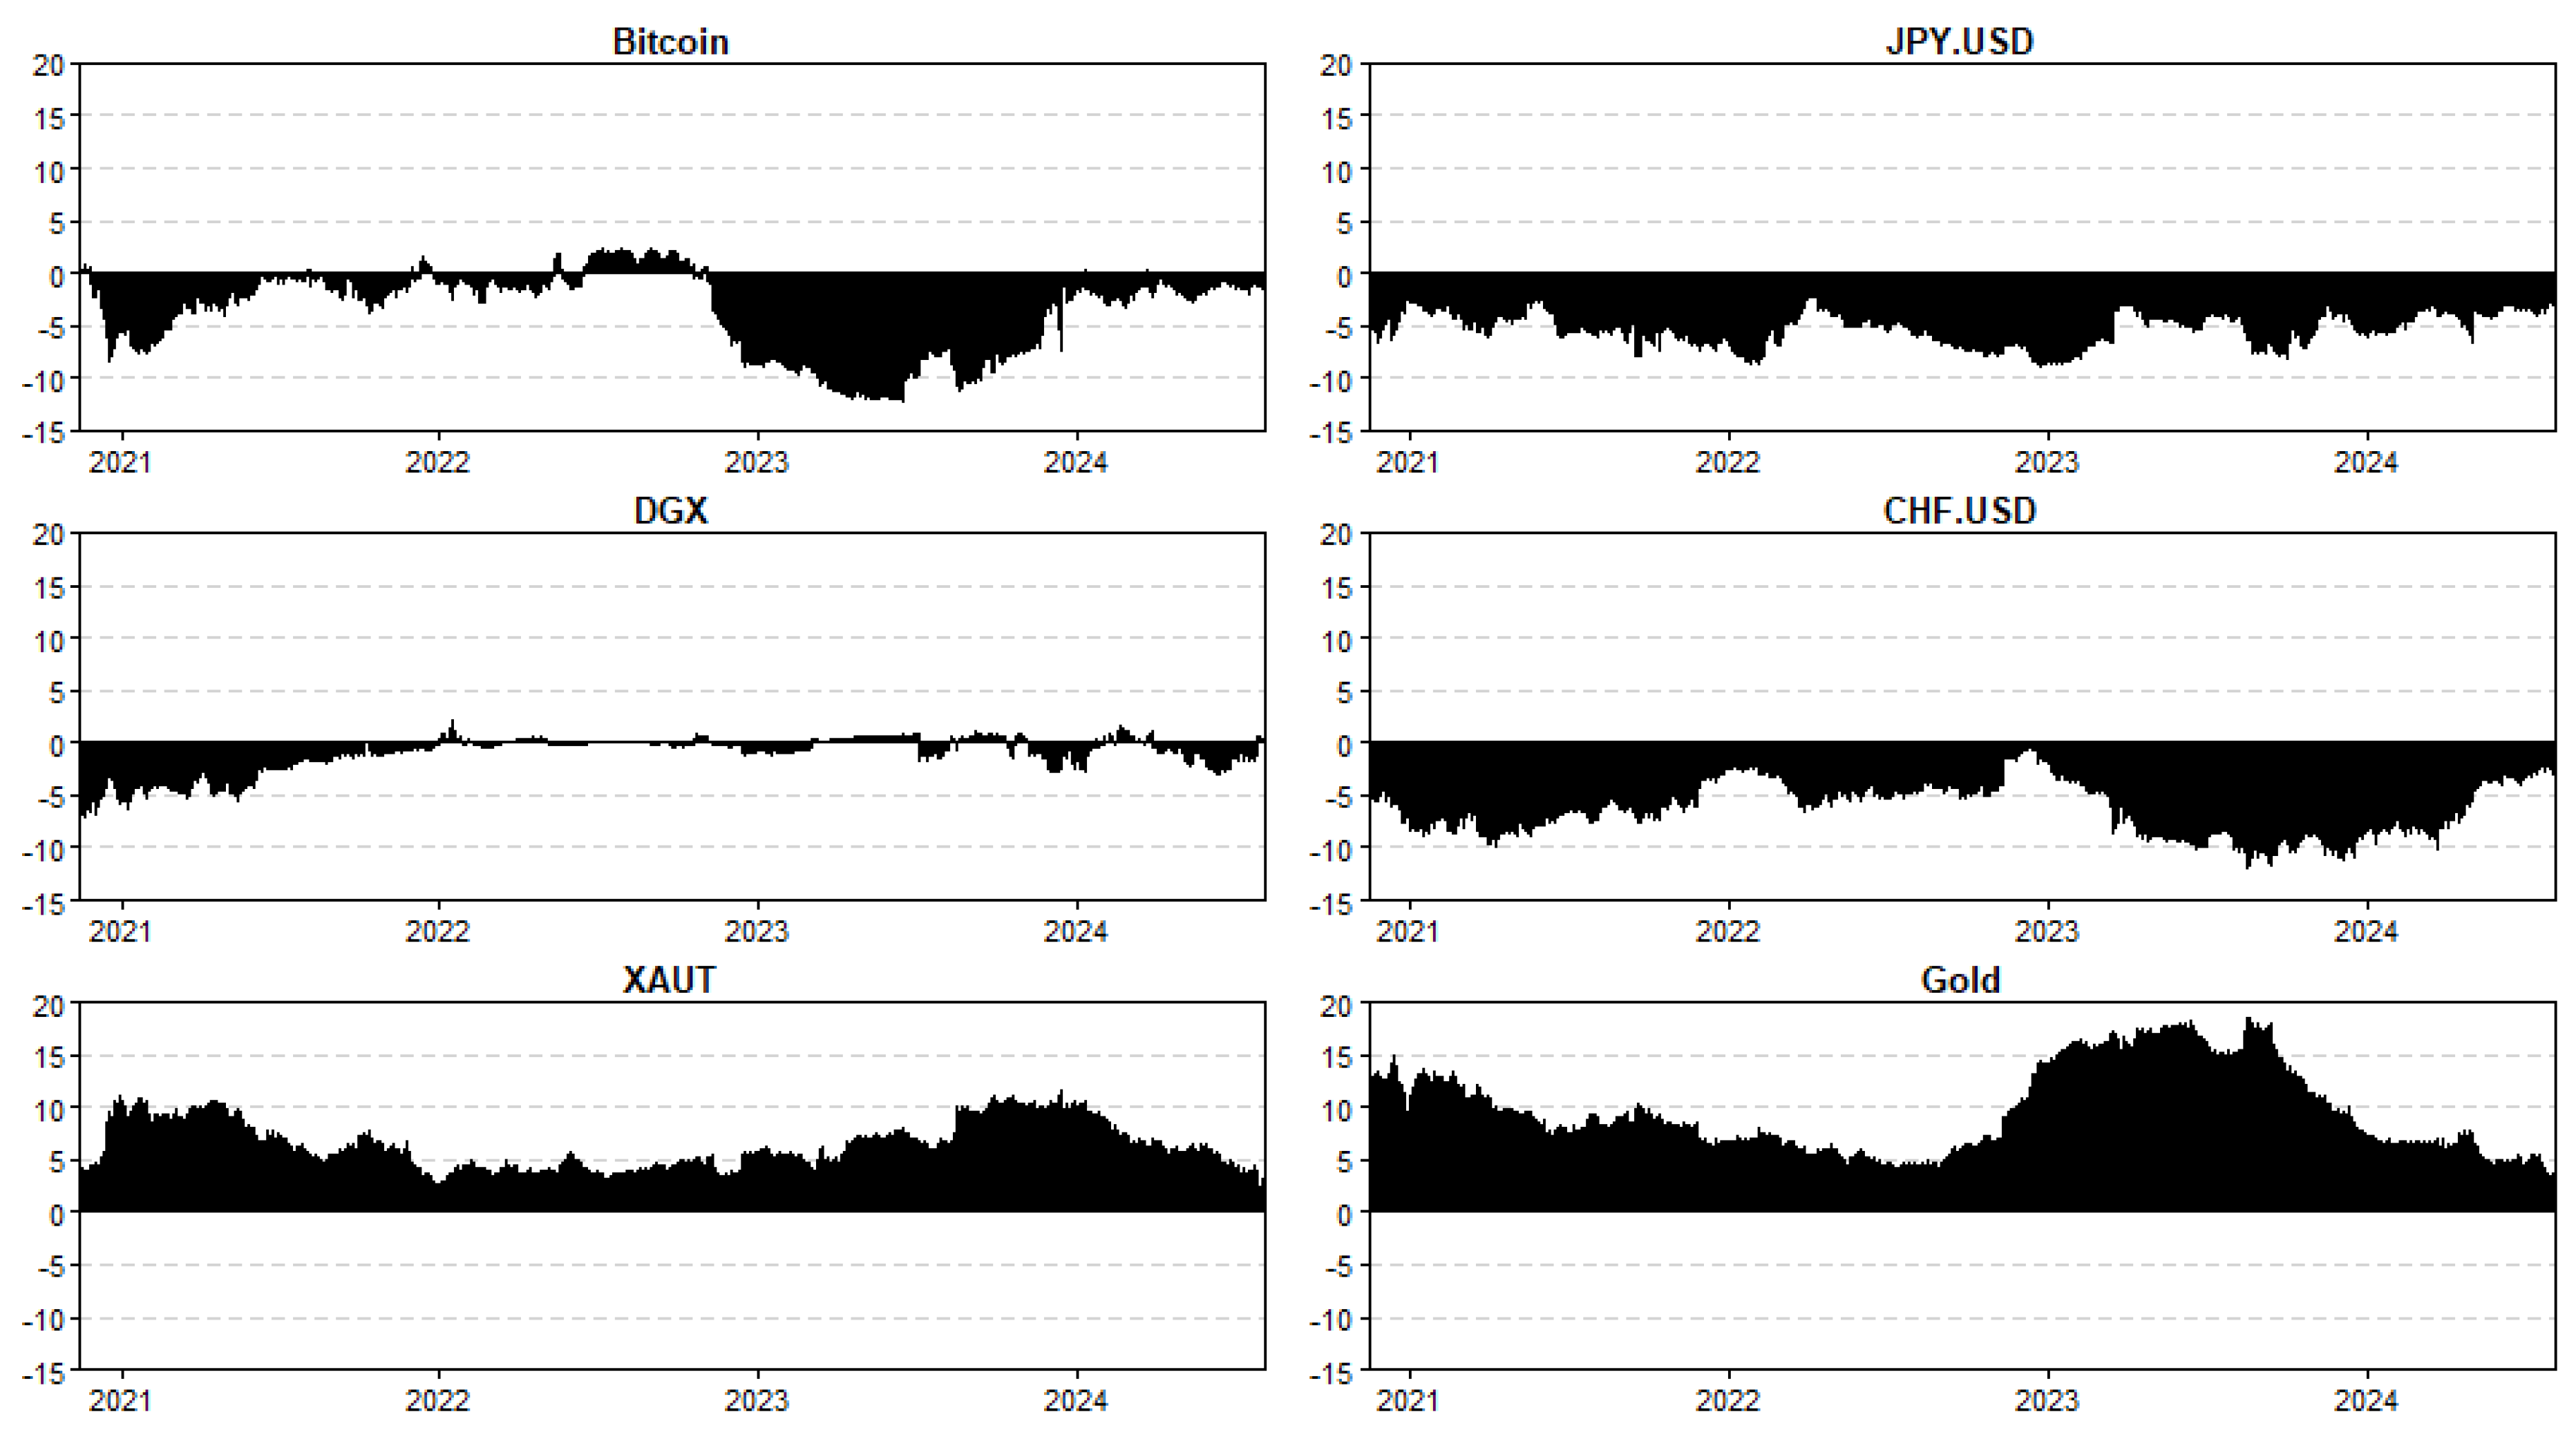
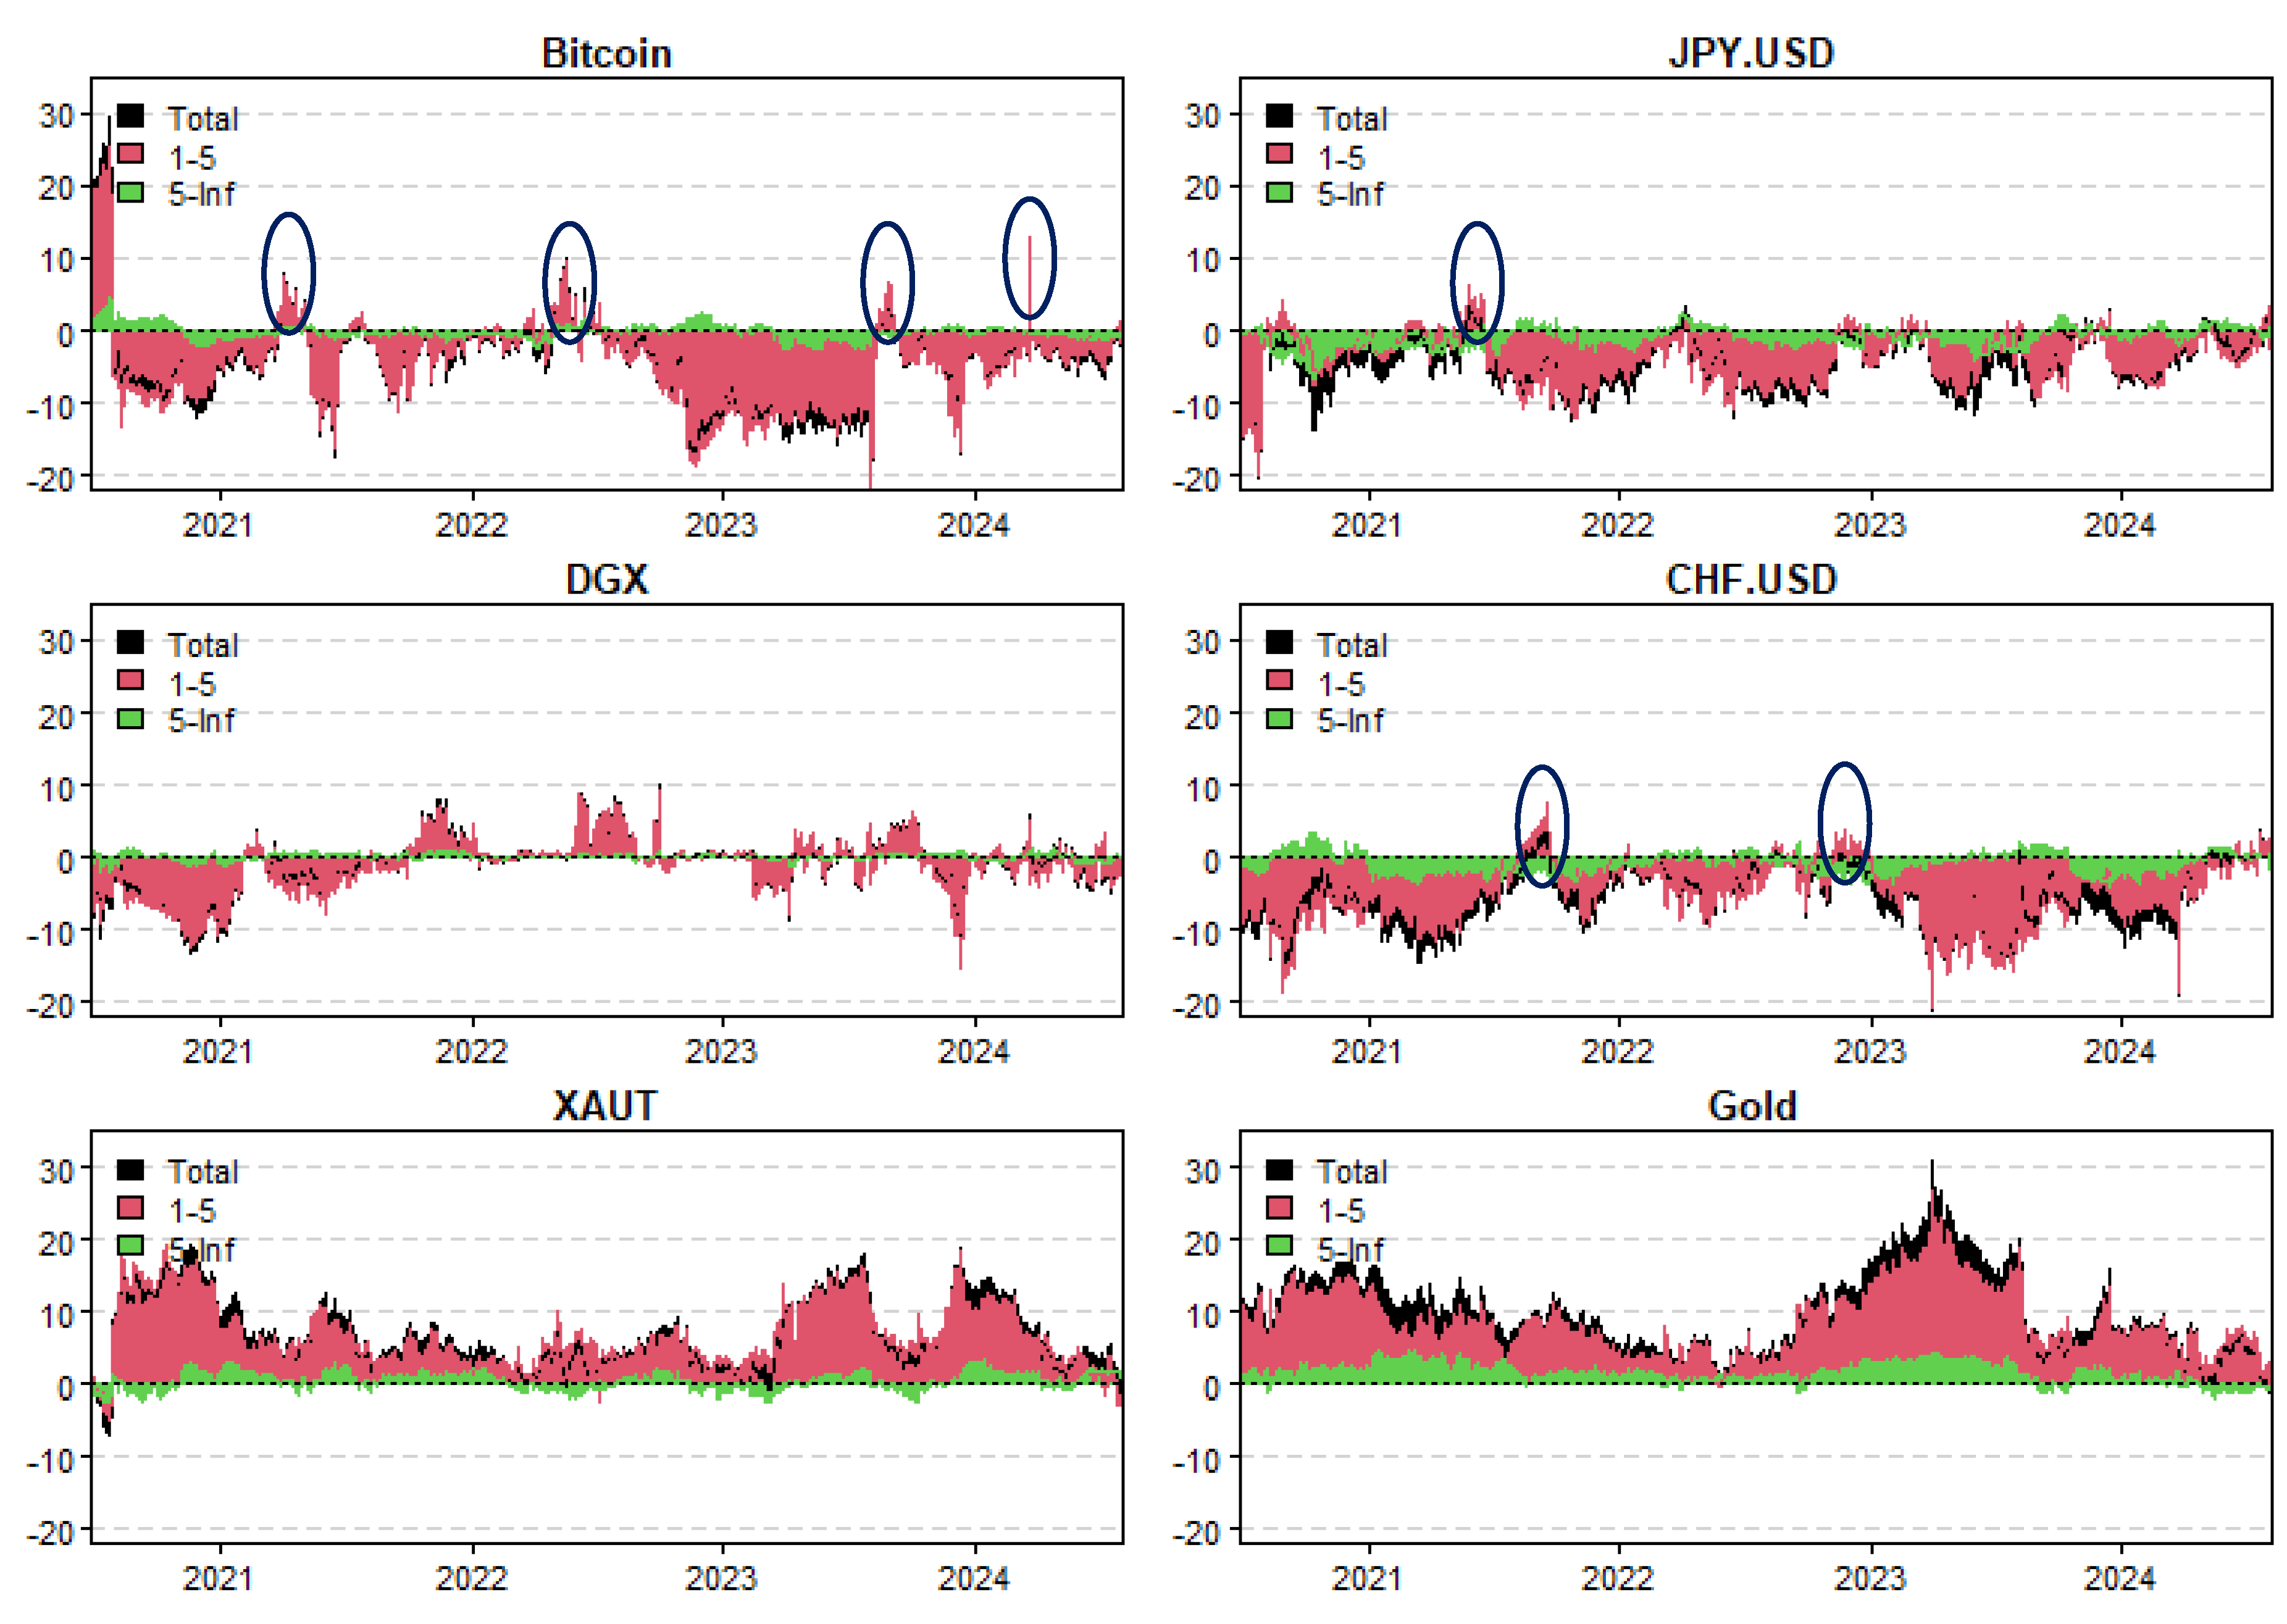
When breaking down the net total connectedness for individual assets in
Figure 7, we find that Bitcoin, along with the currency pairs JPY/USD and CHF/USD, primarily act as receivers of market shocks. However, they alternate as transmitters during specific periods, as indicated by the fluctuations marked by the blue circles in the figure. For example, Bitcoin shows significant fluctuations in its net connectedness, especially in early 2021 and mid-2022 and -2023, where it switches between receiving and transmitting shocks. This indicates that while Bitcoin can sometimes amplify market movements, it is more frequently a receiver of external shocks, reflecting its volatile nature during crises.
Correspondingly, JPY/USD and CHF/USD tend to behave as receivers of shocks, with smaller fluctuations compared to Bitcoin. They sometimes transmit shocks during precise periods, but their overall behavior suggests that they are more reactive to global market dynamics rather than being consistent drivers of volatility. This alternating pattern reinforces the idea that although these currency pairs are generally more stable than volatile assets like Bitcoin, they can still impact the broader market during certain episodes. Short-term dynamics play a key role in their connectedness, but their overall fluctuations are moderate compared to those of Bitcoin.
Lastly, gold-related assets such as gold and XAUT show spikes in net total connectedness during end 2020 and around mid-2023, indicating their increased importance as transmitters of shocks during these periods (The heightened role of gold in connectedness may be explained by macroeconomic factors such as inflation concerns or shifts in global monetary policy, which often drive investors toward safe-haven assets). These observations further support Hypotheses 2 and 3, demonstrating that gold-backed assets act as dominant shock transmitters, while Bitcoin and fiat currencies predominantly absorb shocks across frequencies. Moreover, the switching roles of certain assets, particularly Bitcoin and CHF/USD, highlight the importance of dynamic risk transmission mechanisms emphasized by network theory under stress conditions. The proliferation of shocks from equity markets to crypto-assets exhibited in our results outline network effects, where financial stress spreads through interconnected nodes, reinforcing prominent tenets of network theory.
Both short-term and long-term dynamics contribute to the connectedness of gold, though short-term interactions still dominate.
Table 3 indicates that DGX exhibits the highest total connectedness at 89.13, underscoring its key role as a shock transmitter within the financial network. Bitcoin also plays a significant role, with a total connectedness of 81.56, underlining its importance in influencing market dynamics. XAUT shows a moderate influence with a total connectedness of 42.95. In contrast, JPY/USD and CHF/USD exhibit lower levels of interconnectedness, with scores of 57.21 and 56.17, respectively. These results suggest that while DGX and Bitcoin are central to the financial network, other assets like XAUT, JPY/USD, and CHF/USD contribute to the overall dynamics but to a lesser extent.
The short-run analysis in
Table 4 demonstrates that the interconnectedness diminishes, with Bitcoin’s connectedness dropping to 75.04, while DGX maintains a score of 82.40. XAUT shows a minor decrease to 39.07, reflecting reduced interactions in the short term. This trend indicates that the immediate impact of these assets is notable; nevertheless, the strength of their interconnectedness is not constant over shorter time frames.
On the contrary,
Table 5 illustrates the long-term dynamics, where connectedness further declines, with Bitcoin at 6.52 and DGX at 6.73. This indicates that, while significant in the short run, the effect of these assets lessens over extended periods, suggesting that market dynamics may shift over time. The decline in connectedness in the long run highlights the necessity for investors and portfolio managers to consider time horizons when evaluating the relationships among assets.
Generally, these findings underscore Bitcoin and DGX as key players in the return connectedness landscape, while other assets like JPY/USD and CHF/USD contribute less significantly. This interconnectedness is crucial for understanding portfolio management and risk assessment strategies within the context of financial markets.
4. Conclusions
The analysis of asset connectivity from 2021 to 2024 reveals how financial markets are dynamic in light of global economic events and market volatility. The results demonstrate the significant role that gold and gold-backed assets, such as Tether Gold (XAUT), play as leading shock transmitters, especially when uncertainty is high. Fiat currencies and cryptocurrencies are frequently the net recipients of volatility transmitted by these assets, which serve as stabilizing anchors in the system.
Bitcoin, while one of the biggest players in the cryptocurrency industry, demonstrates a reactive nature and often absorbs shocks from other asset classes. This behavior reveals Bitcoin’s dual status as a speculative asset and as an asset influenced by wider market trends. However, traditional fiat currencies, such as JPY/USD and CHF/USD, play diverse roles that strengthen their status as defensive assets in periods of crisis by switching, based on market conditions, between net recipients and transmitters.
The dynamic analysis across quantiles and frequencies shows how connectedness increases under risky market circumstances and highlights the systemic risks revealed by economic shocks. The predominance of short-term connections highlights the direct impact of global events on asset connectedness, while the relatively weak long-term connectivity indicates that these connections are still ephemeral rather than permanent.
The findings of the study have both theoretical and practical implications. Theoretically, the study adds to a deeper understanding of asset interconnectedness, particularly in how digital assets, like Bitcoin and gold-backed cryptocurrencies, interact with traditional assets during periods of market upheavals. These insights contradict existing models by highlighting the dual nature of cryptocurrencies as both speculative assets and reactive instruments influenced by broader market trends. Practically, this study offers significant guidance for investors, emphasizing the importance of diversifying portfolios to mitigate systemic risks, especially during economic uncertainty. The findings suggest that gold-related assets, fiat currencies, and digital assets can serve as complementary hedges, providing risk management strategies during crises. This study emphasizes the necessity for dynamic models to capture the nuanced connections among assets, permitting policymakers and investors to respond successfully to evolving market circumstances. The interconnectedness among cryptocurrencies, fiat currencies, and gold-backed assets illustrates the wider incorporation of digital assets into the financial system, driven by market instability and global economic changes. These insights have important ramifications for portfolio diversification, risk management, and the understanding of financial market dynamics in a global economy that becomes more interconnected by the day. From a regulatory perspective, this study underlines the need for dynamic models to better capture the evolving interconnectedness among assets, helping policymakers and regulators respond effectively to shifting market conditions. In a broader macroeconomic context, the study highlights how global economic events and market instability are driving the integration of digital assets into the financial system, signaling the necessity for continued adaptation in investment strategies and regulatory frameworks as digital markets mature.
In conclusion, we can say that the present study offers key insights to understanding the dynamic interconnectedness among digital assets and traditional financial assets, but as the digital asset market in the context of cryptocurrencies and gold-backed cryptocurrencies are still in infancy, the study findings are subject to changing market perception about digital assets. Market behavior, investor sentiment, and regulatory frameworks are evolving rapidly, making it difficult to generalize findings over time. The perceptions and roles assigned to these assets are continuously shifting, influenced by technological developments, regulatory changes, and adoption trends. As such, any conclusions drawn may quickly become outdated as these assets mature and market dynamics evolve. The fluid nature of these assets introduces significant uncertainty in assessing their long-term interconnectedness with traditional assets.


