

A Systematic Review of Evidence on the Role of Ready-to-Eat Cereals in Diet and Non-Communicable Disease Prevention


Abstract
1. Introduction
2. Methods
2.1. Nutrient Intakes from National Surveys
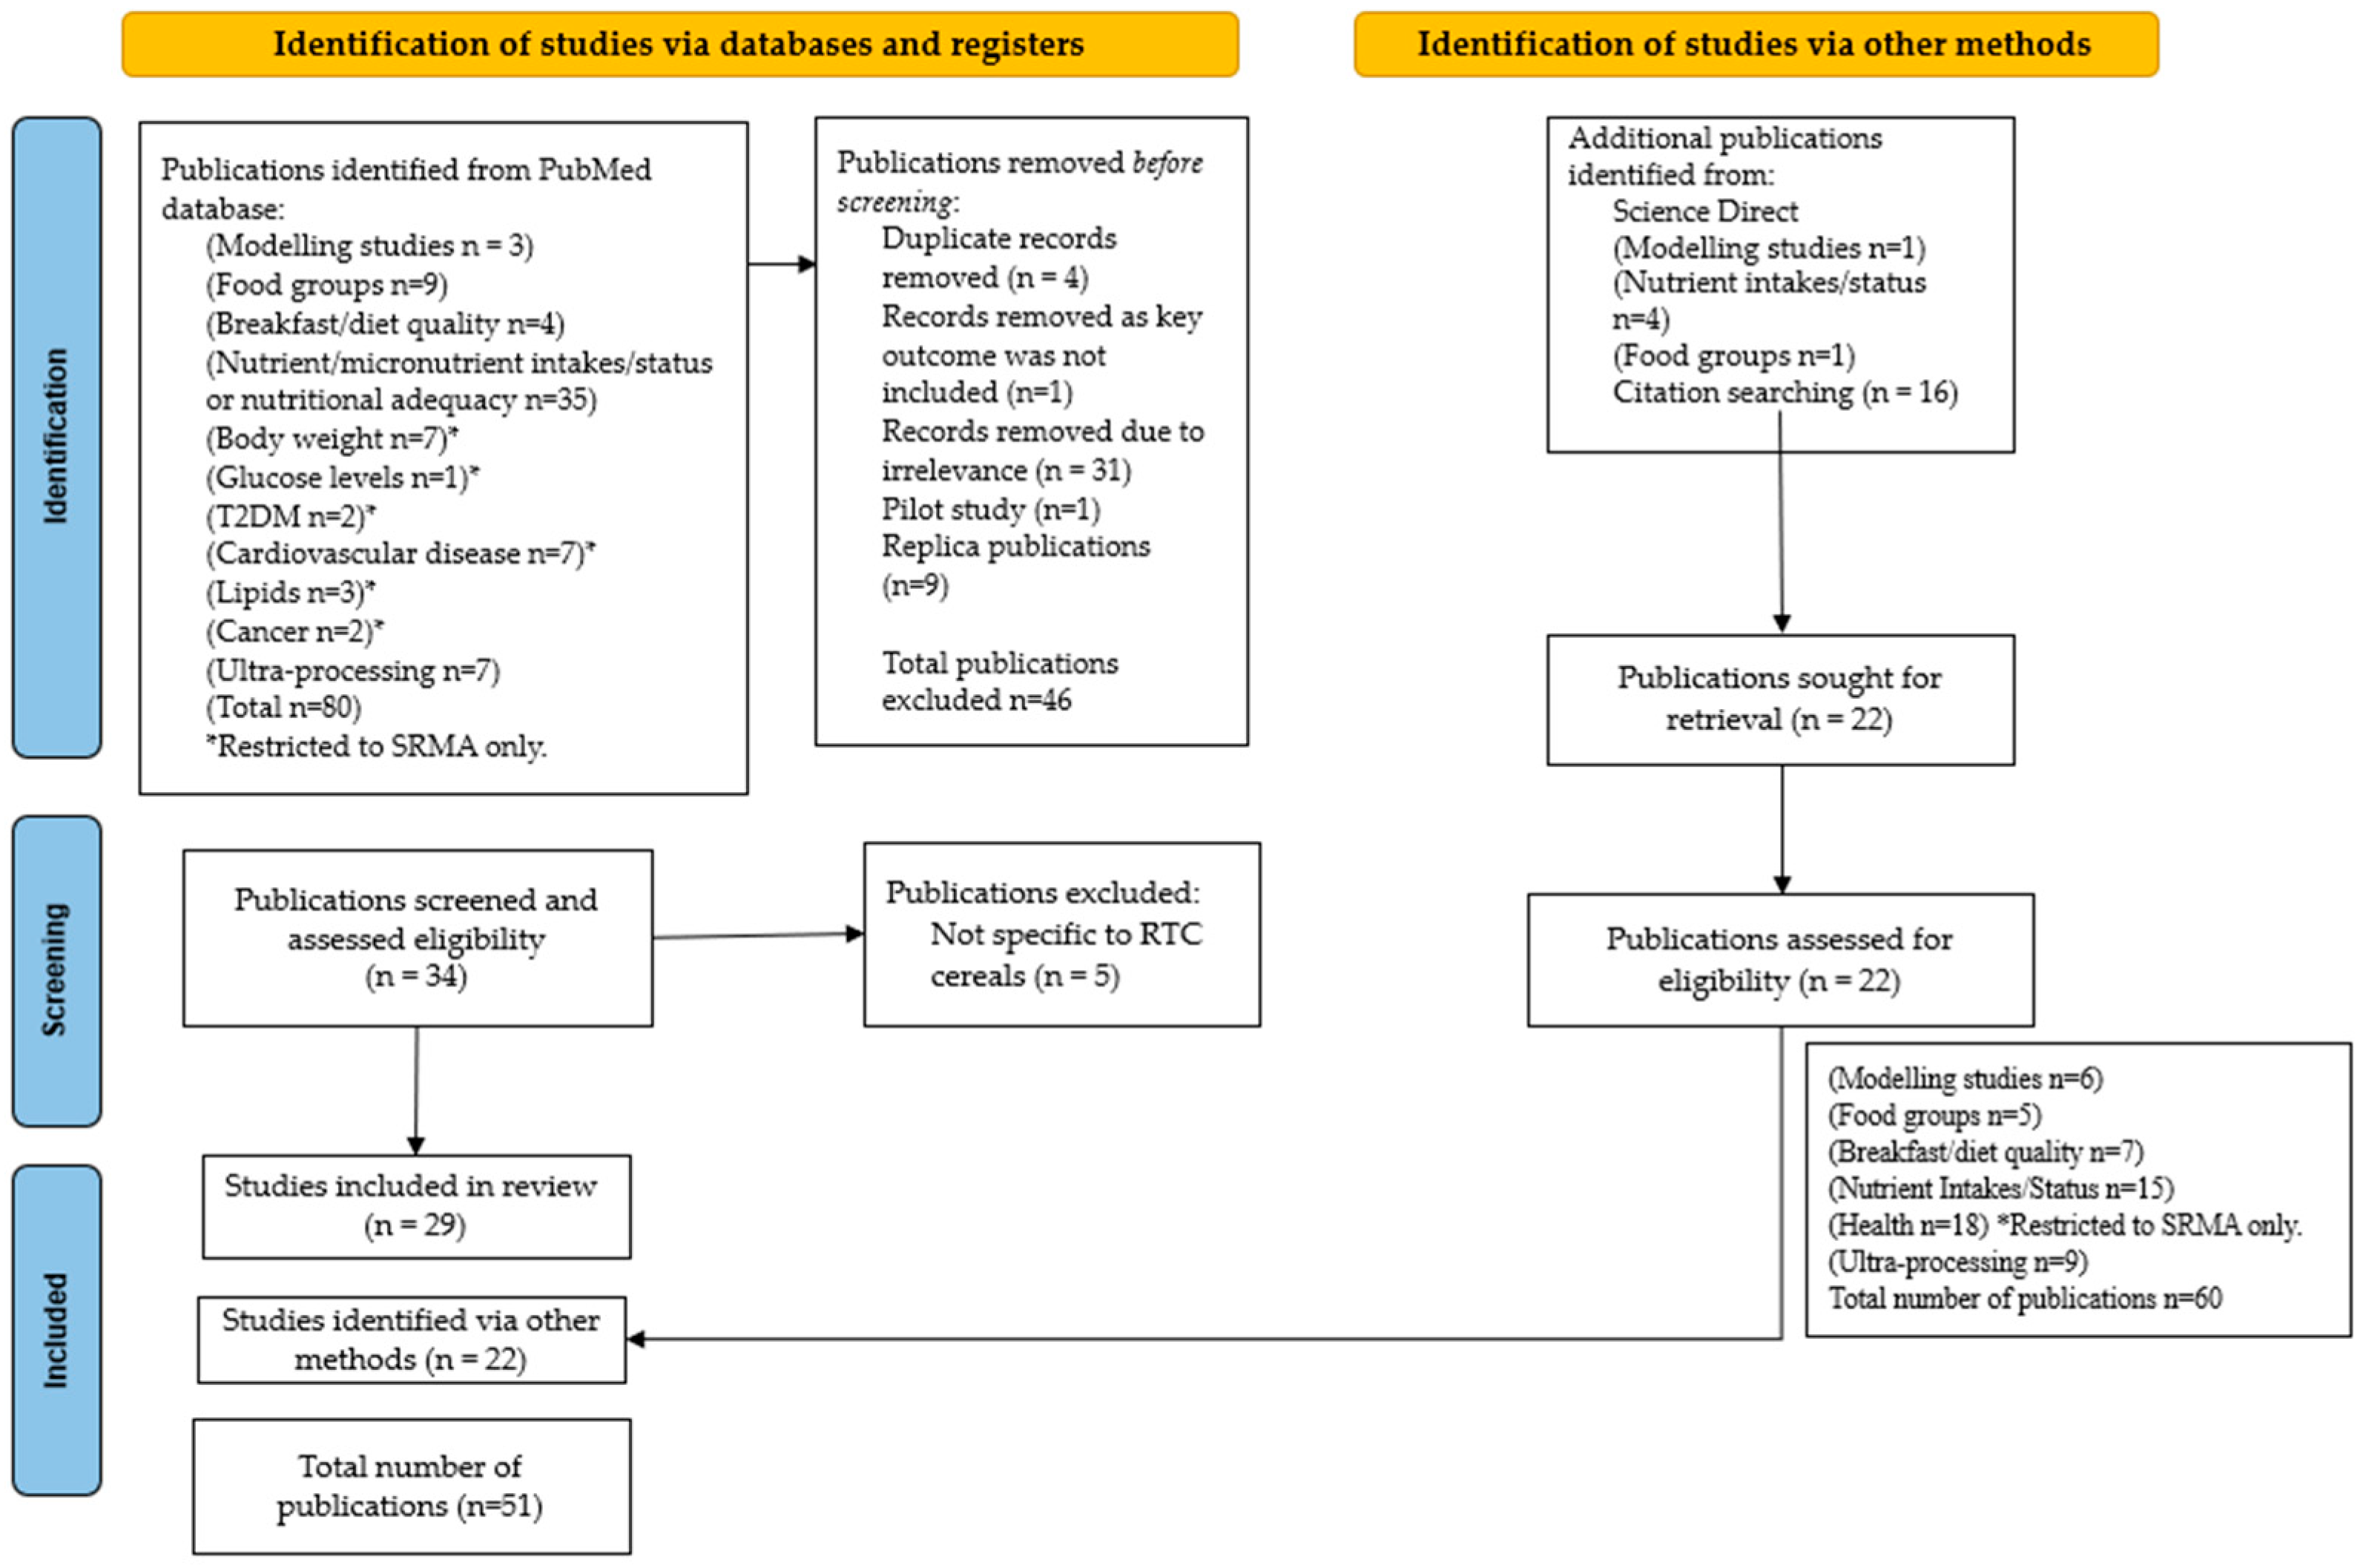
2.2. Systematic Review Search Strategy
2.3. Inclusion/Exclusion Criterion
2.4. Data Extraction
3. Results
3.1. Contribution to Nutrient Intakes
3.2. Modelling Studies
3.3. Contribution to Food Groups
3.4. Breakfast and Diet Quality
3.5. Nutrient Intakes
3.6. NCDs and Markers of Health
3.6.1. Body Weight and Composition
3.6.2. Type 2 Diabetes
3.6.3. Cardiovascular Disease and Lipid Levels
3.6.4. Cancer
3.6.5. Subgroups of UPFs Including RTECs and Health Outcomes
4. Discussion
5. Potential Mechanisms of Action
6. Recommendations on Potential Policy Messages
7. Conclusions
Author Contributions
Funding
Data Availability Statement
Acknowledgments
Conflicts of Interest
Abbreviations
| AS | Added Sugars |
| BMI | Body Mass Index |
| BQI | Breakfast Quality Index |
| BQS | Breakfast Quality Score |
| C | Consumers |
| CCHS | Canadian Community Health Survey |
| CHD | Coronary Heart Disease |
| CI | Confidence Interval |
| CS | Cross-Sectional |
| CVD | Cardiovascular Disease |
| DALYs | Disability-adjusted life-years |
| DFE | Dietary Folate Equivalents |
| DQI | Diet Quality Index |
| EAR | Estimated Average Requirement |
| EI | Energy Intake |
| EPIC | European Prospective Investigation into Cancer |
| FBDGs | Food-Based Dietary Guidelines |
| FS | Free Sugars |
| GBD | Global Burden of Disease |
| GI | Glycemic Index |
| HEI | Healthy Eating Index |
| HELENA | Healthy Lifestyle in Europe by Nutrition in Adolescence |
| HFC | High-Fibre Cereals |
| HI | High Income |
| HR | Hazard Ratio |
| IBRI | International Breakfast Research Initiative |
| INCA | l’Institut National du Cancer |
| IUNA | Irish Universities Nutrition Alliance |
| LDL-C | Low-Density Lipoprotein Cholesterol |
| LFC | Low-Fibre Cereals |
| LI | Low Income |
| MA | Meta-Analysis |
| MD | Mean Difference |
| MI | Middle Income |
| NANS | National Adult Nutrition Survey |
| NC | Non-Consumers |
| NCD | Noncommunicable diseases |
| NCFS | National Children’s Food Survey |
| NDNS | National Health and Nutrition Examination Survey |
| NTDs | Neural Tube Defects |
| NTFS | National Teens’ Food Survey |
| PCS | Prospective Cohort Studies |
| PIR | Poverty-to-Income Ratio |
| PMID | PubMed ID |
| PRISMA | Preferred Reporting Items for Systematic Reviews and Meta-Analyses |
| RCTS | Randomised Controlled Trials |
| RNI | Reference Nutrient Intake |
| RPS | Rolling Programme Survey |
| RR | Relative Risk |
| RTEC | Ready-To-Eat Cereal |
| SCFAs | Short-Chain Fatty Acids |
| SDS | Slowly Digestible Starch |
| SIGN | Scottish Intercollegiate Guidelines Network |
| SMD | Standard Mean Difference |
| SNDA-II | School Nutrition Dietary Assessment Study |
| SR | Systematic Review(s) |
| SR/MA | Systematic Review/Meta-Analyses |
| TS | Total Sugars |
| T2D | Type 2 Diabetes |
| UK NDNS | United Kingdom National Diet and Nutrition Survey |
| UL | Upper Limit |
| UPF | Ultra-Processed Food |
| US NHANES | United States National Health and Nutrition Examination Survey |
| WIC | Special Supplemental Nutrition Programme for Women, Infants, and Children |
| y/yrs | Years |
Appendix A
Applied Search Words and Terminologies

| “ready-to-eat cereal” [tiab] OR “RTE cereal” [tiab] OR “RTEC” [tiab] OR “breakfast cereals” [tiab] AND “modelling” [tiab] |
| “ready-to-eat cereal” [tiab] OR “RTE cereal” [tiab] OR “RTEC” [tiab] OR “breakfast cereals” [tiab] AND “food groups” [tiab] |
| ““ready-to-eat cereal” [tiab] OR “RTE cereal” [tiab] OR “RTEC” [tiab] OR “breakfast cereals” [tiab] AND “breakfast quality” OR “diet quality” [tiab] |
| “ready-to-eat cereal” [tiab] OR “RTE cereal” [tiab] OR “RTEC” [tiab] OR “breakfast cereals” [tiab] AND “nutrient intakes” [tiab] OR “nutritional adequacy” OR “micronutrient” [tiab] |
| “ready-to-eat cereal” [tiab] OR “RTE cereal” [tiab] OR “RTEC” [tiab] OR “breakfast cereals” [tiab] AND “body weight” [tiab] |
| “ready-to-eat cereal” [tiab] OR “RTE cereal” [tiab] OR “RTEC” [tiab] OR “breakfast cereals” [tiab] AND “glucose levels” [tiab] |
| “ready-to-eat cereal” [tiab] OR “RTE cereal” [tiab] OR “RTEC” [tiab] OR “breakfast cereals” [tiab] AND “type 2 diabetes” [tiab] OR “T2DM” [tiab] |
| “ready-to-eat cereal” [tiab] OR “RTE cereal” [tiab] OR “RTEC” [tiab] OR “breakfast cereals” [tiab] AND “cardiovascular disease” [tiab] OR “CVD” [tiab] |
| “ready-to-eat cereal” [tiab] OR “RTE cereal” [tiab] OR “RTEC” [tiab] OR “breakfast cereals” [tiab] AND “lipid*” [tiab] |
| “ready-to-eat cereal” [tiab] OR “RTE cereal” [tiab] OR “RTEC” [tiab] OR “breakfast cereals” [tiab] AND “cancer” [tiab] |
| “ready-to-eat cereal” [tiab] OR “RTE cereal” [tiab] OR “RTEC” [tiab] OR “breakfast cereals” [tiab] AND “ultra process*” [tiab] |
Appendix B
Appendix B.1. Modelling Studies Focusing on RTECs/Breakfast Cereals
| Author, Year, PMID | Country | Dataset | Model/Approach | Number of Participants | Main Focus | Results |
|---|---|---|---|---|---|---|
| Tucker et al. (2024) [46] NA | United States | NHANES 2011–2018 | Modelling replaced RTEC at different levels (10, 25, 50, 100%) with a weighted composite of all breakfast intakes except RTEC. | n = 9292, 2–18 y | Added sugars, whole grain and nutrients | Replacing 100% of RTECs with other breakfast foods yielded minimal reductions in daily AS intakes and reduced intakes of whole grains, fibre, and micronutrients. |
| Estell et al. (2022) [41] PMID: 34668030 | Australia | National Nutrition and Physical Activity Survey 2011–12 | Dietary modelling examined the nutritional adequacy of sample diets including grain-based UPFs as aligned with Australian Dietary Guidelines and another containing replacements for grain-based UPF. | n = 12,153 | Nutrient intakes | There was a significant decline (p < 0.05) in the modelled intake of key nutrients when grain-based UPFs were excluded, especially thiamine, folate and iodine, as non-grain substitutions were rarely fortified. |
| Papanikolaou and Fulgoni (2021) [42] PMID: 34552951 | United States | NHANES 2009–2016 | Estimated usual daily intake of shortfall nutrients in the current dietary pattern and when specific percentages (25, 50 and 100%) of fortified/enriched refined grain foods (inc. RTECs) were removed from the diet. | n = 11,169, 19–50 y n = 9641, 51–99 y | Nutrient adequacy | Removal of bread and RTECs increased the percentage of adults not meeting the EAR for magnesium, vitamin A, C and E. |
| Calame et al. (2020) [43] PMID: 32585847 | United Kingdom | NDNS: 2008–2012 | 4 cohorts assessed. The impact of 4.2 μg vit. D fortification per 100 g of RTEC on vit. D intake and status mathematically modelled. | n = 803, 4–10 y n = 884, 11–18 y n = 1655, 19–64 y n = 428, 65 y+ | Vit. D status | Fortification of breakfast cereals can contribute to improving overall vitamin D status. Amongst males aged 4–10, 11–18, 19–64 and 65+ years, there was a 1.04, 3.21, 2.61 and 6.98 nmol/L difference in 25(OH)D levels with compared to without vitamin D fortification. Amongst females aged 4–10, 11–18, 19–64 and 65+ years there was a 1.26, 2.68, 2.70 and 5.55 nmol/L difference in 25(OH)D levels with compared to without vitamin D fortification. |
| Smith et al. (2020) [44] PMID: 31957633 | United States | NHANES 2013–2014 | Used 3 modelling scenarios: (1) baseline fortification, (2) zero fortification and (3) optimised fortification. | n = 559 toddlers, 1–3 y n = 1540 children, 4–12 y n = 992 teens, 13–18 y n = 576 adults, ≥19 y | Nutrient intakes | Fortification of RTEC can be optimised to provide key nutrients and minimise the percentage of the population below the EAR and above the UL. |
| Rehm and Drewnowski (2017) [45] PMID: 28902145 | United States | NHANES 2007–2010 | Model 1 solid foods eaten at breakfast replaced with RTECs on a calorie-per-calorie basis. Model 2 replaced solid breakfast foods with RTECs and milk, on a calorie-per-calorie basis. Beverages and beverage additions were not replaced. | n = 18,112 | Nutrient intakes | Model 1 diets were sig. higher in folic acid (+104.6%), whole grains (+84.6%), iron (+54.5%), fibre (+14.3%), vitamin D (+14.0%), sugar (+5.0%) and lower in solid fats (−10.9%) compared to observed diets. Model 2 diets were additionally higher in dairy (+15.8%), calcium (+11.3%) and potassium (+3.95%). |
Appendix B.2. Studies Investigating RTEC/Breakfast Cereal Consumption and Food Groups
| Author, Year, PMID | Country | Study Design | Number of Studies (Number of Participants) | Results |
|---|---|---|---|---|
| Smith et al. (2022) [53] PMID: 35425801 | United States | Cross-sectional, US nationally representative 2015–2016 and 2017–2018 NHANES | n = 5028, 2–18 y | For children, there were positive associations between RTEC consumption and whole grain and dairy, (p < 0.001) intake. For adults both RTEC and PIR were positively assoc. with whole grain, dairy, and fruit (p < 0.001). |
| Zhu et al. (2022) [5] | United States | Data from NHANES 2017–2018 | n = 2259, 2–18 y n = 4776, 19+ y | Children and adults consuming RTECs for breakfast had higher intakes of whole grains, and total dairy compared to consumers of non-RTEC breakfast or no breakfast. |
| Smith et al. (2019) [37] PMID: 31443588 | United States | Cross-sectional analysis of data from NHANES 2015–2016 | n = 88 RTEC C, 0.5–2 y n = 236 RTEC NC, 0.5–2 y n = 688 RTEC C, >2 to 12 y n = 1169 RTEC NC, >2 to 12 y n = 242 RTEC C, 13–17 y n = 546 RTEC NC, 13–17 y | Children (0.5–17 y) who ate RTECs had a 29% higher total dairy intake (p < 0.0001) and 61% higher whole grain intake (p < 0.0001). RTEC eaters had lower intake of meat, poultry, and seafood (p = 0.0005), eggs (p = 0.0009), but there were no differences in the intake of nuts and seeds, soybean products, or legumes |
| Michels et al. (2015) [54] PMID: 25403942 | Multi-centre European study | Multi-centre European HELENA study | n = 1215, 12.5–17.5 y | RTEC consumers had a more frequent intake of milk/yoghurt and fruit (p < 0.001). Among RTEC consumers there was a higher percentage of consumers of fruit (57 vs. 51%) and milk/yoghurt (81.2 vs. 56%) compared to non-consumers. RTEC consumers were 2.65 times more likely to fulfil the daily milk intake recommendation than RTEC non-consumers (p < 0.001). |
| Affenito et al. (2013) [55] PMID: 23253288 | United States | Cross-sectional data from the third School Nutrition Dietary Assessment Study, 2004–2005 | n = 2298, 5–18 y | Pupils eating RTECs at breakfast and participating in the School Breakfast Programme consumed significantly more whole grains (0.71 oz. equiv) than pupils eating a non-cereal breakfast (0.43 oz. equiv), indicating that the School Breakfast Programme had an important role to play in improving intakes of certain food groups. |
Appendix B.3. Studies Investigating RTEC/Breakfast Cereal Consumption and Breakfast/Diet Quality
| Author, Year, PMID | Country | Study Design | Number of Studies (Number of Participants) | Breakfast/Diet Quality Indices | Results | Level of Evidence |
|---|---|---|---|---|---|---|
| Priebe and McMonagle (2016) [1] PMID: 27749919 | NA | SR of RCT and prospective studies | 8 prospective studies (n = 154,217) | NA | Consumption of RTECs was associated with a healthier dietary pattern. Frequent RTEC consumption (≥5 servings/week) compared to low or no RTEC consumption was consistently associated with a healthier dietary pattern in children and adults in most studies demonstrating a higher consumption of carbohydrates, dietary fibre and a reduction in total fat intake and cholesterol (only for children). Therefore, current dietary recommendations are more likely to be met by RTEC consumers. | Rs1− |
| Harris et al. (2011) [56] PMID: 21149436 | United States | 1-day randomly assigned experimental design on camp where children had a choice of high-sugar cereals, low-sugar cereals or fruit/juice/milk options. | n = 91 children 5–12 y | Inter-associations determined between high/low sugar cereal consumption and other foods eaten at breakfast. | Children in the low-sugar RTEC group were more likely to put fruit on their cereal (54% vs. 8%) and consume a greater portion of total calories from fresh fruit (20% vs. 13%) compared to those eating high-sugar cereals. Compared with serving low-sugar RTECs, high-sugar RTECs increased children’s total sugar consumption and reduced the overall nutritional quality of their breakfast. | RCT2- |
| Poinsot et al. (2024) [57] PMID: 39021597 | France | Data from the French representative cross-sectional (INCA3) dietary survey. | n = 1448, 4–17 y n = 4015 breakfasts | BQS tested by correlations with nutritional indicators and comparison of nutrients and dietary components between tertiles of scores. The BQS ranges from 0 to 100, 100 means that breakfast complied with all of IBRI recommendations. | RTEC breakfasts had the highest BQS (73.5% for children and 73.1% for teenagers) and biscuits and viennoiseries scored the lowest (52% for children and 49.1% for teenagers). This could be attributed to their fibre and micronutrient profile, as well as the co-consumption with milk, which was highest in RTEC breakfasts | NA |
| Bellisle et al. (2018) [58] PMID: 30096946 | France | Nationally representative cross-sectional study | n = 426, children n = 250, adolescents n = 1045 adults | Measured by tertiles of the Nutrient-Rich Food Index 9.3 in children and adolescents (up to 17 y) and adults (18 y+) | Breakfasts of the highest population tertiles contributed more fibre and many vitamins and minerals for the same amount of energy. The highest tertiles consumed more milk, RTE breakfast cereals (notably whole-grain cereals) and bread; the highest tertile of the adult population had more dairy products and fruit, but less “viennoiseries” than lower tertiles. | NA |
| Michels et al. (2015) [54] PMID: 25403942 | Multi-centre European study | Multi-centre European HELENA study. | n = 1215, 12.5–17.5 y | Diet quality calculated from 24 h dietary recalls using the DQI for Adolescents with Meal index (DQI-AM), which assessed the compliance with the Flemish FBDGs. The DQI-AM comprising four pillars: dietary quality, dietary diversity, dietary equilibrium and a meal index | Regarding diet quality, equilibrium and meal index, RTEC non-consumers scored lower than the frequent and daily RTEC consumers. Daily RTEC consumers had a significantly higher DQI score than non-consumers (p = 0.003). Frequent RTEC consumers (eating these 2–4 times a week) also had a significantly higher DQI score than non-consumers (p = 0.016). | NA |
| Smith et al. (2022) [53] PMID: 35425801 | United States | Cross-sectional, US nationally representative 2015–2016 and 2017–2018 NHANES data | n = 5028, 2–18 y n = 9813 19+ y | Diet quality was measured using the HEI-2015 measuring how aligned an individual’s daily dietary intake is with the recommendations of the 2015 Dietary Guidelines for Americans. The maximum HEI score is 100 (highest-quality diet) based on the sum of 13 sub-scores for the intake of total fruits, whole fruit, total vegetables, greens and beans, whole grains, dairy, total protein foods, seafood and plant proteins, fatty acids, refined grains, sodium, added sugar, and saturated fats. | RTEC consumption was significantly associated with higher diet quality for children and adults. For 2015 subcomponents, RTEC consumption, for children and adults, was associated with a higher score (more aligned with dietary guidance) for whole grains (p < 0.0001) total dairy (p < 0.0001), whole fruit (adults only, p < 0.0001), sodium (p ≤ 0.0001), refined grains (p ≤ 0.0006), and saturated fat (p ≤ 0.0003) and lower scores (less aligned with guidelines) for the total protein foods (p ≤ 0.0003), fatty acids (p ≤ 0.0001), and added sugar (children only, p = 0.0024) components. | NA |
| Smith et al. (2019) [37] PMID: 31443588 | United States | Cross-sectional, US nationally representative 2015–2016 NHANES data | n = 2969 | Dietary quality measured using the HEI-2015. As above (Smith et al., 2022) [53]. | Children who ate RTECs had a better diet quality than those who did not, as reflected by the HEI-2015 total score (52.6 versus 47.7, p < 0.0001). | NA |
Appendix B.4. Studies Investigating RTEC/Breakfast Cereal Consumption and Nutrient Intakes/Status
| Author, Year, PMID | Country | Study Design | Number of Studies (Number of Participants) | Outcomes | Results | Level of Evidence |
|---|---|---|---|---|---|---|
| Giménez-Legarre N et al. (2020) [59] PMID: 32824257 | NA | SR and MA of breakfast characteristics in children and teens. | 38 studies (n = 120,193) | Energy, macronutrients | Children who usually skip breakfast had a lower daily EI (Kcal) than children eat RTEC (MD, −7.00; 95% CI: −11.51, −2.49). Children who usually skip breakfast had a sig. lower carbohydrate intake than children who usually consume RTECs (MD, −9.28; 95% CI: −13.44, −5.12). RTEC consumers had a significantly higher fibre intake than breakfast skippers (MD, −6.67; 95% CI: −11.02, −2.32). Breakfast skippers consumed less protein than those eating RTECs for breakfast (MD, −3.03; 95% CI: −4.61, −1.45). Children skipping breakfast had a significantly higher fat intake than children eating RTECs (MD, 11.10; 95% CI: 7.15, 15.04). | Rs/Ma1++ |
| Giménez-Legarre N et al. (2020) [60] PMID: 33092061 | NA | SR and MA of breakfast characteristics in children and teens. | 33 studies–systematic review (n = 85,023) 7 studies–meta-analysis (NR) | Micronutrient intakes | Several articles assessed the consumption of RTECs (n = 22, 66.6%) In children, RTEC consumers had significantly higher daily consumption of thiamine (vitamin B1) than children who usually skip breakfast (SMD, −16.378; 95% CI: −29.110, −3.647). RTEC consumers also had significantly higher daily intake of riboflavin (vitamin B2) than children who usually skip breakfast (SMD, −14.757; 95% CI: −20.247, −9.268). Children who usually consume RTECs had a significantly higher intake of vitamins A and C than those who usually skip breakfast (SMD, −10.407; 95% CI: −14.147, −6.667 and SMD, −4.127; 95% CI: −5.091, −3.162), respectively. Children who usually ate RTECs at breakfast had significantly higher daily consumption of calcium and iron than children who skipped breakfast (SMD, −12.650; 95% CI: −14.616, −10.685 and SMD, −19.534; 95% CI: −27.887, −11.181, respectively) Children eating RTECs had a significantly higher magnesium and potassium intake than breakfast skippers (SMD, −10.903; 95% CI: −18.078, −3.729) and (SMD, −6.972; 95% CI: −10.689, −3.254), respectively. No differences were observed for sodium. | Rs/Ma1++ |
| Priebe MG and McMonagle (2016) [1] PMID: 27749919 | NA | SR of RCT and prospective studies. | 8 prospective studies (n = 154,217) | Micronutrient intakes | Those consuming RTECs frequently (≥5 times/week) had a lower risk of inadequate micronutrient intakes especially for vitamin A, calcium, folate, vitamin B 6, magnesium and zinc compared to non-consumers. When using datasets that assessed significance, in children/adolescents and adults, reductions in prevalence of inadequacy due to RTEC consumption were highest for: vitamin A (range: 7–21% and 5–37%, respectively), calcium (17–39% and 6–40%, respectively), folate (5–28% and 7–50%, respectively), magnesium (7–11% and 4–26%, respectively) and zinc (9% and 19–37%, respectively). In adults, high reductions were also seen for vitamin B 6 (7–55%) and C (6–21%). | Rs1− |
| Williams et al. (2014) [25] PMID: 25225349 | NA | SR | 11 intervention trials included (n = 730) | Vitamin and mineral intakes | Children, adolescents and adults who consume RTE breakfast cereals regularly have daily diets that are higher in percentage of energy (%E) from carbohydrate, total sugars, dietary fibre, vitamins A and D, thiamine, riboflavin, niacin, pyridoxine, folate, calcium, iron, magnesium, and zinc; no different in total energy intake, %E from protein, or sodium; and are lower in %E from fat. Children and teens who eat breakfast cereal regularly are less likely to have vitamin and mineral intakes below the recommended daily requirements, especially for calcium. Adults who eat breakfast cereal regularly are less likely to have vitamin and mineral intakes below the recommended daily requirements, especially for thiamine, riboflavin, niacin, folate, vitamin C, calcium, magnesium, iron, zinc, and fibre. | Rs1− |
| Kuriyan et al. (2017) [61] PMID: 28917231 | India | Two-week randomised, controlled 2-arm trial. The intervention group received 30 g of low-fat RTECs (120 mL skim milk) and a serving of fruit/veg., replacing two meals/day for two weeks. The control group was provided with standard dietary guidelines for weight loss. | n = 101 overweight/obese females, 18–44 y | Nutrient intake profile | The low-fat RTEC intervention group had a sig. higher increases in dietary intakes of certain vitamins, fibre and sugar, and significantly higher reductions in total and polyunsaturated fats and sodium intakes, as compared to the control group (p ≤ 0.05). | RCT2+ |
| Powers et al. (2016) [62] PMID: 27418034 | UK | Twelve-week randomised, double-blind, placebo-controlled intervention trial. Receive 50 g fortified or unfortified cereal, with 150 mL semi-skimmed milk, daily, as a breakfast or as a supper. | n = 73, 16–19 y | Micronutrient intakes | Consumption of fortified RTECs increased vitamins B1, B2, niacin, B6, B12, folate and iron (p < 0.001) and of vitamin D (p = 0.007) compared to the unfortified cereal. | RCT2++ |
| Albertson et al. (2009) [64] NA | US | Secondary analyses using data from the Dietary Intervention Study in Children, a randomised, controlled, multicentre, trial. | n = 660, 8–10 y | Nutrient intake | RTEC consumption was positively associated with all measures of nutrients for both sexes. | RCT1+ |
| Ortega et al. (2006) [63] PMID: 17010231 | Spain | Dietary intervention study. Randomly assigned to one of two slightly hypocaloric diets: diet V (inc. veg. consumption) or diet C (inc. a minimum of 3 serves of breakfast cereals or cereal bars per day). | n = 67 overweight/obese women of childbearing age, 20–35 y. | Serum folate concentrations | At the start of the study, 64·2% of all subjects had a folate intake of <67% of the recommended intake; this fell to 3% (7·14% of V subjects and 0% of C subjects) by week 6. 62·1% of all subjects had serum folate concentrations of ≥13·6 nmol/L (associated with a very low risk of NTDs) at the start of the study, while 87·0% (85·2% of V subjects and 88·9% of C subjects) had concentrations of ≥13·6 nmol/L at 6 weeks (p < 0·01). These results indicate that breakfast cereals may help with folate intake/status in women of childbearing age. | RCT2++ |
| Smith et al. (2022) [53] PMID: 35425801 | US | Cross-sectional, US nationally representative 2015–2016 and 2017–2018 NHANES | n = 5028, 2–18 y n = 9813, 19 y+ | Vitamin and mineral intakes | There was a sig. interaction between PIR and RTECs for adults for iron, phosphorus, B vitamins, and dairy (p < 0.001) with PIR category being positively associated with the intake of nutrients. RTECs contributed to one quarter or more of daily intake, across all age and PIR groups, for several B vitamins, iron, zinc, and whole grains. | NA |
| Zhu et al. (2022) [68] NA | US | Cross-sectional, US 2013–2016 NHANES | n = 531, 1–5 y | Nutrient intakes | In total, 45% of women, infants and children ate RTECs. Consumption in children was linked to significantly higher intakes of calcium (18%), iron (75%), zinc (47%), vitamin A (36%) thiamine (39%), riboflavin (32%), niacin (41%), vitamin B6 (53%), folate (116%), vitamin B12 (57%), and vitamin D (28%) compared to non-consumers. | NA |
| Zhu et al. (2021) [66] NA | US | Data from NHANES 2017–2018 | n = 2135, 2–17 y n = 3675, 18–64 y n = 1221, 65 y+ | Nutrient intakes | RTEC consumption was associated with significantly higher intake of calcium, iron, zinc, magnesium, potassium, phosphorus, vitamin A, thiamine, riboflavin, niacin, vitamin B6, folate, vitamin B12, and vitamin D (all p < 0.05), | NA |
| Zhu et al. (2020) NA [67] | US | Cross-sectional US NHANES 2013–2014 | n = 2553, 1–18 y n = 4901, 19 y+ | 25-hydroxyvitamin D status | Children and adults eating RTECs had significantly (p < 0.05) higher levels of serum 25-hydroxyitamin D than those not eating RTEC, and adults were less likely to have vitamin D deficiency. | NA |
| Lepicard et al. (2017) [65] PMID: 27714860 | France | Data collected during a cross-sectional observational study. | n = 529 French children, 9–11 y | Nutrient density | The RTEC + milk breakfast pattern was the most nutrient dense–it was lower in total fat, saturated fatty acids, and cholesterol and was rich in fluids, vitamins B, vitamin C, calcium, and iron. | NA |
| Michels et al. (2015) [54] PMID: 25403942 | Multi-centre European study | Multi-centre European HELENA study. | n = 1215, 12.5–17.5 y | Micronutrient intakes | RTEC consumers had a more favourable daily micronutrient intake (vitamin B2, B5, B7, D, calcium, phosphorus and potassium) compared to non-consumers. | NA |
| Affenito et al. (2013) [55] PMID: 23253288 | US | Data from the third cross-sectional School Nutrition Dietary Assessment Study, 2004–2005. | n = 2298, 5–18 y | Macro- and micronutrient intake | Protein, total sugars and sodium were no different between the breakfast groups. Pupils participating in the School Breakfast Programme and eating RTECs at breakfast consumed significantly more vitamin A (728 vs. 572 µg RAE), iron (19 vs. 14 mg) and dietary fibre (16 vs. 14 g) compared with those who ate a non-cereal breakfast. | NA |
Appendix B.5. Systematic Reviews and Meta-Analysis Studies Investigating RTEC/Breakfast Cereal Consumption and NCD Risk/Aspects of Health
| Author, Year, PMID | Study Design | Number of Studies (Number of Participants) | Outcomes | Results | Level of Evidence |
|---|---|---|---|---|---|
| Body weight (6 publications) | |||||
| de la Hunty et al. (2013) [71] PMID: 23466487 | SR and MA | 11 cross-sectional (n = 30,019) 2 prospective (n = 3039) 1 intervention (n = 147) | Body weight of children and teens | Overweight prevalence and risk of overweight was lower in children and teens who ate breakfast cereals regularly compared to those eating them infrequently. | Rs/Ma1+ |
| Sanders et al. (2023) [69] PMID: 37149263 | SR of observational studies and controlled trials | 14 RCTs (n = 1184) 14 observational studies (n = 298,233) | Adult body weight | RTEC consumers (≥4 servings/wk)) had a lower BMI, prevalence of overweight/obesity, less weight gain and less anthropometric evidence of abdominal adiposity compared with NC, or less frequent consumers. RCTs suggest that RTECs may be used as a meal or snack replacement as part of a hypocaloric diet. RTEC consumption was not associated with sig. less loss of body weight, or with weight gain, in any of the RCTs. | Rs1+ |
| Sanders et al. (2023) [70] PMID: 36811587 | SR of observational studies and controlled trials | 5 RCTs (n = 541) 20 observational studies (n = 65,052) | Body weight and composition of children and teens | Overall, 14 out of 20 observational studies found that children and teens eating RTECs had a lower BMI, prevalence and odds of overweight/obesity and more favourable indicators of abdominal obesity than NC/less frequent consumers. Controlled trials were few–one reported a loss of 0.9 kg in overweight/obese children with RTEC consumption when accompanied by nutrition education. | Rs1+ |
| Kosti et al. (2010) [26] PMID: 20819244 | SR | 12 studies children and adolescents (2 RCTs n = 2179, 8 cross-sectional n = 8272, 2 prospective n = 4758) 9 studies in adults (4 RCTs n = 564, 2 cross-sectional n = 20,670, 3 prospective n = 119,054)) | Obesity/adiposity in children, adolescents and adults | RTEC consumption was associated with a desirable macronutrient profile for obesity prevention, reduced BMI and weight gain (mainly for whole-grain cereals) and could be a potential meal replacement/alternative snacking option in weight-loss programmes. | Rs1+ |
| Priebe and McMonagle (2016) [1] PMID: 27749919 | SR | 9 RCTs (n = 551) 3 prospective studies (n = 19,166) | BMI/Body weight/weight gain | Two RCTs did not find RTEC related to changes in body weight. 7 RCTs examined the effect of low-DF vs. high-DF RTECs and/or wholemeal RTECs on postprandial satiety and five on subsequent energy intake. Three trials reported a sig. difference in satiety/appetite measures. The degree of hunger was lower after ingestion of high- versus low-DF RTECs. Negative inter-relationships between frequent RTEC consumption with body weight gain were found in 3 prospective studies. | Rs1− |
| Williams et al. (2014) [25] PMID: 25225349 | SR | 3 systematic reviews 16 intervention trials focusing on weight management (n = 861) | Weight management | Regular breakfast cereal consumption was associated with a lower body mass index and less risk of being overweight or obese (evidence grade B) | Rs1− |
| Glucose Levels and Type 2 Diabetes (4 publications) | |||||
| Aune et al. (2013) [72] PMID: 24158434 | MA of cohort studies | Three cohort studies focused on whole-grain breakfast cereals (n = 137,142) | Type 2 diabetes | Inverse associations observed for whole-grain cereals and T2D risk based on a few studies (n = 3 studies; RR 0.72 95% CI 0.55–0.93, p = 0.01). For each additional serving of whole-grain breakfast cereal RR 0.73, 95% CI: 0.59, 0.91; p = 0.006) | Ma1− |
| Chen et al. (2023) [73] PMID: 36854188 | SR of three large prospective U.S. cohort studies | Nurses’ Health Study (n = 71,871) Nurses’ Health Study II (n = 87,918) Health Professional Follow-Up Study (n = 38,847) | Type 2 diabetes mellitus | Ultra-processed cereals were associated with lower T2D risk (HR 0.78; 95% CI 0.96–0.99). Among the ultra-processed breads and cereals further subdivision showed that intakes of ultra-processed cereals and ultra-processed dark breads and whole-grain breads were associated with lower T2D risk whilst ultra-processed refined breads were associated with higher risk. | Rs1+ |
| Priebe and McMonagle et al. (2016) [1] PMID: 27749919 | SR | 6 RCTs (n = 130) 2 prospective studies included (n = 96,673) | Type 2 diabetes | Two studies showed that fibre-rich RTECs could benefit postprandial insulinemia other findings were less conclusive. Evidence from prospective studies suggests that whole-grain RTECs may have beneficial effects on the development of type 2 diabetes including positive effects of fibre-rich RTECs on postprandial insulinemia. | Rs1− |
| Williams et al. (2014) [25] PMID: 25225349 | SR | 3 of the 16 cohorts reported on breakfast cereal outcomes (n = 210,334) | Type 2 diabetes | Whole-grain or high-fibre breakfast cereals were associated with a lower risk of diabetes (evidence grade B). | Rs1− |
| Cardiovascular disease/lipid levels (7 studies) | |||||
| Sun et al. (2023) [74] PMID: 36803836 | SR and dose–response MA of prospective studies | 64 studies (for breakfast cereals 2 cohorts n = 453,632) | Cardiovascular disease mortality | There were protective associations for breakfast cereals and cardiovascular disease mortality (HR: 0.80; 95% CI: 0.70, 0.90). | Ma1++ Rs1++ |
| Aune et al. (2016) [76] PMID: 27301975 | Dose–response MA of prospective studies | 45 cohort studies (64 publications) n = 4 for CHD n = 2 on CVD | Coronary heart disease Cardiovasular disease | Intake of whole-grain breakfast cereals and CHDs–high v low analysis (n = 4, RR 0.72, 95% CI 0.64–0.82, p = 0.92). Whole-grain breakfast cereals and CHDs (30 g/d dose, RR 0.81, 0.75–0.88, p = 0.69) Intake of whole-grain breakfast cereals and CVDs–high v low analysis (n = 2, RR 0.74, 95% CI 0.65–0.84, p = 0.31). Whole-grain breakfast cereals and CVDs (30 g/d dose, RR 0.84, 0.78–0.90, p = 0.82) | Ma1+ |
| Kwok et al. (2019) [75] PMID: 30971126 | MA | 2 whole-grain breakfast cereal prospective studies (n = 206,200) | Cardiovascular disease and all-cause mortality | Among carbohydrates, there was a dose–response association for the benefit of whole-grain breakfast cereals (RR 0.84, 95% CI0.78–0.90, two studies). | Ma1− |
| Mendoza et al. (2024) [78] PMID: 39286398 | SR of prospective cohorts | Nurses’ Health Study (n = 75,735) Nurses’ Health Study II (n = 90,813) Health Professionals Follow-Up Study (n = 40,409) | Cardiovascular disease and Stroke | Cold cereals were inversely associated with CVDs (HR 0.92), CHDs (HR 0.90) and stroke risk (HR 0.93). Foods in the bread/cold group included breakfast cereals; dark/whole-grain bread; refined-grain bread. | Rs1+CVD Rs1− Stroke |
| Beserra et al. (2020) [77] PMID: 33295516 | SR | 14 studies (n = 15,420) | Lipid profile of children and teens | Two out of fourteen studies found that increased intake of RTECs was related to reductions in total cholesterol and LDL-c. | Rs1− |
| Priebe MG and McMonagle JR (2016) [1] PMID: 27749919 | SR of RCT and prospective studies | 5 RCTs focused on blood lipids (n = 214) 3 prospective studies (n = 35,404) | Hypertension and blood lipids | Consumption of RTECs with soluble fibre helps to reduce LDL cholesterol in hypercholesterolemic men. Evidence from prospective studies suggests that whole-grain RTECs may have beneficial effects on hypertension. RTECs fortified with folate can reduce plasma homocysteine. | Rs1− |
| Williams et al. (2014) [25] PMID: 25225349 | SR | 5 cohort and case–control studies on breakfast cereals and CVDs (n = 139,552) 6 studies on breakfast cereal and hypertension (n = 28,467) | Health outcomes | Regular consumption of oat-, barley- or psyllium-based breakfast cereals can help lower total and LDL cholesterol concentrations (evidence grade A) Whole-grain or high-fibre breakfast cereals are associated with a lower risk of cardiovascular disease (evidence grade C). | Rs1− |
| Cancer (1 study) | |||||
| Aune et al. (2016) [76] PMID: 27301975 | SR and dose–response MA of prospective studies | 45 cohort studies (64 publications) | Cancer | Relative risks per 90 g/day increase in whole grain intake (90 g equivalent to one bowl of cereal was associated with a reduced risk of total cancer 0.83 (0.77 to 0.90; I(2) = 83%, n = 11). Note: This finding is for 90 g increase in whole grain in general, which included whole-grain breakfast cereals, whole-grain bread, added bran, total bread and breakfast cereals. | Rs/Ma1+ |
Appendix B.6. Studies Investigating Subgroups of UPFs Including RTEC and Health Outcomes
| Author, Year, PMID | Country | Study Design | Number of Studies (Number of Participants) | Results | Level of Evidence |
|---|---|---|---|---|---|
| Taneri et al. (2022) [80] PMID: 35231930 | NA | SR and MA | 40 prospective cohort studies (n = 5750,133) | Breakfast cereals were associated with a lower mortality risk (RR = 0.85, 95% CI, 0.79, 0.92). | Rs/Ma1++ |
| Mendoza et al. (2024) [78] PMID: 39286398 | US | SR and MA of three prospective cohorts | Nurses’ Health Study (n = 75,735) Nurses’ Health Study II (n = 90,813) Health Professionals Follow-Up Study (n = 40,409) | Colds cereals were inversely associated with CVD (HR 0.92), CHD (HR 0.90) and stroke risk (HR 0.93). | Rs1+CVD Rs1− Stroke |
| Chen et al. (2023) [73] PMID: 36854188 | US | MA of three large prospective U.S. cohort studies | Nurses’ Health Study (n = 71,871) Nurses’ Health Study II (n = 87,918) Health Professional Follow-Up Study (n = 38,847) | Ultra-processed cereals were associated with lower T2D risk (HR 0.78). | Rs1+ |
| Beserra et al. (2020) [77] PMID: 33295516 | NA | SR of cross-sectional and longitudinal studies, with or without intervention | 14 studies (n = 15,420) | Of the 14 studies included, 9 demonstrated that ultra-processed food consumption was related to increased LDL-c, total cholesterol, triglycerides and a reduction in HDL-c. Three studies found no relationship. Two found that increased intake of RTECs was related to reductions in total cholesterol and LDL-c. | Rs1+ |
| Dicken et al. (2024) [81] PMID: NA | Europe | Prospective cohort analysis of EPIC | n = 311,892 n = 14,236 T2DM cases | Breakfast cereals, breads and biscuits (as a group) were associated with lower-incident type 2 diabetes mellitus (HR 0.65, 0.57–0.73) for each 10%g/day increase in the diet | Coh2− |
| Cordova et al. (2023) [24] PMID: 38115963 | Europe | Multinational EPIC cohort | n = 266,666 (60% women) | The subgroup of ultra-processed breads and cereals (HR: 0.97, 95% CI: 0.94, 1.00) was not associated with risk of cancer and cardiometabolic diseases. | Coh2+ |
| Hang et al. (2023) [82] PMID: 36477589 | US | 3 prospective cohorts | n = 142 052 | High-risk polyps were associated with ultra-processed breads and breakfast foods (HR: 1.13, 95% CI = 1.03 to 1.24). This category included breakfast bars, cold breakfast cereal, English muffins, bagels, rolls, rye, pumpernickel bread, white bread, and whole-grain bread. | Coh2+ |
| Lo et al. (2022) [83] PMID: 34461300 | US | Prospective cohort study | n = 245,112 | Ultra-processed breads and breakfast foods were more strongly associated with Crohn’s Disease (HR: 1.18, 95% CI 1.07–1.29). This category included cold breakfast cereal, English muffins, bagels, and rolls, white bread. | Coh2− |
| Belchor et al. (2022) [84] PMID: 36317890 | Brazil | Cross-sectional study | n = 1069 students in Florianopolis, southern Brazil | Breakfast cereal consumption was inversely assoc. with the ultra-processed dietary profile (−0.070; Kaiser–Meyer–Olkin statistical test). | NA |
References
- Priebe, M.G.; McMonagle, J.R. Effects of Ready-to-Eat-Cereals on Key Nutritional and Health Outcomes: A Systematic Review. PLoS ONE 2016, 11, e0164931. [Google Scholar] [CrossRef] [PubMed]
- Fast, R.; Caldwell, E. Chapter 2: Manufacturing Technology of Ready-to-Eat Cereals. In Breakfast Cereals and How They Are Made, 2nd ed.; American Associan of Cereal Chemists: St. Paul, MN, USA, 2000; pp. 17–54. [Google Scholar]
- Weiss, E.; Kislev, M.; Simchoni, O.; Nadel, D. Small-grained wild grasses as staple food at the 23,000-year-old site of Ohalo II, Israel. Econ. Bot. 2004, 58, S125–S134. [Google Scholar] [CrossRef]
- FAO. Food and Agriculture Organization of the United Nations. Crop Prospects and Food Situation. Quarterly Global Reports. 2018. Available online: http://www.fao.org/3/CA2726EN/ca2726en.pdf (accessed on 9 April 2025).
- Zhu, Y.; Jain, N.; Normington, J.; Holschuh, N.; Sanders, L.M. Ready-to-eat cereal is an affordable breakfast option associated with better nutrient intake and diet quality in the US population. Front. Nutr. 2022, 9, 1088080. [Google Scholar] [CrossRef]
- Oghbaei, M.; Prakash, J. Effect of primary processing of cereals and legumes on its nutritional quality: A comprehensive review. Cogent Food Agric. 2016, 2, 1136015. [Google Scholar] [CrossRef]
- Lewis, I.M.; Boote, L.; Butler, T. Effect of breakfast cereal type on portion size and nutritional implications. Public Health Nutr. 2021, 24, 3276–3285. [Google Scholar] [CrossRef]
- van der Kamp, J.W.; Jones, J.M.; Miller, K.B.; Ross, A.B.; Seal, C.J.; Tan, B.; Beck, E.J. Consensus, Global Definitions of Whole Grain as a Food Ingredient and of Whole-Grain Foods Presented on Behalf of the Whole Grain Initiative. Nutrients 2021, 14, 138. [Google Scholar] [CrossRef]
- Sharma, S.; Kaur, S.; Dar, B.N.; Singh, B. Storage stability and quality assessment of processed cereal brans. J. Food Sci. Technol. 2014, 51, 583–588. [Google Scholar] [CrossRef]
- Welch, R.W.; Mitchell, P.C. Food processing: A century of change. Br. Med. Bull. 2000, 56, 1–17. [Google Scholar] [CrossRef]
- van Boekel, M.; Fogliano, V.; Pellegrini, N.; Stanton, C.; Scholz, G.; Lalljie, S.; Somoza, V.; Knorr, D.; Jasti, P.R.; Eisenbrand, G. A review on the beneficial aspects of food processing. Mol. Nutr. Food Res. 2010, 54, 1215–1247. [Google Scholar] [CrossRef]
- Los, A.; Ziuzina, D.; Bourke, P. Current and Future Technologies for Microbiological Decontamination of Cereal Grains. J. Food Sci. 2018, 83, 1484–1493. [Google Scholar] [CrossRef]
- Thielecke, F.; Lecerf, J.M.; Nugent, A.P. Processing in the food chain: Do cereals have to be processed to add value to the human diet? Nutr. Res. Rev. 2021, 34, 159–173. [Google Scholar] [CrossRef] [PubMed]
- Hennessy, A.; Walton, J.; Flynn, A. The impact of voluntary food fortification on micronutrient intakes and status in European countries: A review. Proc. Nutr. Soc. 2013, 72, 433–440. [Google Scholar] [CrossRef] [PubMed]
- WHO. World Health Organisation. Noncommunicable Diseases. 2024. Available online: https://www.who.int/news-room/fact-sheets/detail/noncommunicable-diseases (accessed on 3 April 2025).
- EC. European Commission. Cost of Non-Communicable Diseases in the EU. Available online: https://knowledge4policy.ec.europa.eu/health-promotion-knowledge-gateway/cost-non-communicable-diseases-eu_en (accessed on 5 April 2025).
- Hofmarcher, T.; Lindgren, P.; Wilking, N.; Jonsson, B. The cost of cancer in Europe 2018. Eur. J. Cancer 2020, 129, 41–49. [Google Scholar] [CrossRef]
- EHN. European Heart Network, European Cardiovascular Disease Statistics. 2017. Available online: https://ehnheart.org/wp-content/uploads/2023/07/CVD-Statistics.pdf (accessed on 5 April 2025).
- Okunogbe, A.; Nugent, R.; Spencer, G.; Powis, J.; Ralston, J.; Wilding, J. Economic impacts of overweight and obesity: Current and future estimates for 161 countries. BMJ Glob. Health 2022, 7, e009773. [Google Scholar] [CrossRef] [PubMed]
- Budreviciute, A.; Damiati, S.; Sabir, D.K.; Onder, K.; Schuller-Goetzburg, P.; Plakys, G.; Katileviciute, A.; Khoja, S.; Kodzius, R. Management and Prevention Strategies for Non-communicable Diseases (NCDs) and Their Risk Factors. Front. Public Health 2020, 8, 574111. [Google Scholar] [CrossRef]
- Qiao, J.; Lin, X.; Wu, Y.; Huang, X.; Pan, X.; Xu, J.; Wu, J.; Ren, Y.; Shan, P.F. Global burden of non-communicable diseases attributable to dietary risks in 1990–2019. J. Hum. Nutr. Diet. 2022, 35, 202–213. [Google Scholar] [CrossRef]
- Gibney, M.J. Ultra-processed foods in public health nutrition: The unanswered questions. Br. J. Nutr. 2023, 129, 2191–2194. [Google Scholar] [CrossRef]
- Jones, J.M. Food processing: Criteria for dietary guidance and public health? Proc. Nutr. Soc. 2019, 78, 4–18. [Google Scholar] [CrossRef]
- Cordova, R.; Viallon, V.; Fontvieille, E.; Peruchet-Noray, L.; Jansana, A.; Wagner, K.H.; Kyro, C.; Tjonneland, A.; Katzke, V.; Bajracharya, R.; et al. Consumption of ultra-processed foods and risk of multimorbidity of cancer and cardiometabolic diseases: A multinational cohort study. Lancet Reg. Health Eur. 2023, 35, 100771. [Google Scholar] [CrossRef]
- Williams, P.G. The benefits of breakfast cereal consumption: A systematic review of the evidence base. Adv. Nutr. 2014, 5, 636S–673S. [Google Scholar] [CrossRef]
- Kosti, R.I.; Panagiotakos, D.B.; Zampelas, A. Ready-to-eat cereals and the burden of obesity in the context of their nutritional contribution: Are all ready-to-eat cereals equally healthy? A systematic review. Nutr. Res. Rev. 2010, 23, 314–322. [Google Scholar] [CrossRef] [PubMed]
- Sninsky, J.A.; Shore, B.M.; Lupu, G.V.; Crockett, S.D. Risk Factors for Colorectal Polyps and Cancer. Gastrointest. Endosc. Clin. N. Am. 2022, 32, 195–213. [Google Scholar] [CrossRef] [PubMed]
- Page, M.J.; McKenzie, J.E.; Bossuyt, P.M.; Boutron, I.; Hoffmann, T.C.; Mulrow, C.D.; Shamseer, L.; Tetzlaff, J.M.; Akl, E.A.; Brennan, S.E.; et al. The PRISMA 2020 statement: An updated guideline for reporting systematic reviews. BMJ 2021, 372, n71. [Google Scholar] [CrossRef]
- Arieta-Miranda, J.M.; Ruiz-Yasuda, C.C.; Perez Vargas, L.F.; Torres Ricse, D.A.; Diaz, S.P.; Arieta, Y.C.; Victorio, D.J.B.; Ramos, G.T. New Pyramid Proposal for the Levels of Scientific Evidence According to SIGN. Plast. Reconstr. Surg. 2022, 149, 841e–843e. [Google Scholar] [CrossRef] [PubMed]
- INCA-3. Étude Individuelle Nationale des Consommations Alimentaires 3. 2017. Available online: https://www.anses.fr/sites/default/files/NUT2014SA0234Ra.pdf (accessed on 7 May 2025).
- IUNA. IUNA NCFS II. National Children’s Food Survey II; Irish Universities Nutrition Alliance (IUNA): Dublin, Ireland, 2017. [Google Scholar]
- Vatanparast, H.; Islam, N.; Patil, R.P.; Shamloo, A.; Keshavarz, P.; Smith, J.; Chu, L.M.; Whiting, S. Consumption of Ready-to-Eat Cereal in Canada and Its Contribution to Nutrient Intake and Nutrient Density among Canadians. Nutrients 2019, 11, 1009. [Google Scholar] [CrossRef]
- IUNA. Irish Universities Nutrition Alliance. National Teens’ Food Survey II. NTFS II (2019–2020) Summary Report; IUNA: Dublin, Ireland, 2021; Available online: https://irp.cdn-website.com/46a7ad27/files/uploaded/NTFS%20II%20Summary%20Report.pdf (accessed on 7 May 2025).
- PHE. Results from Years 9 to 11 (2016 to 2017 and 2018 to 2019). Results from the National Diet and Nutrition Survey Rolling Programme for 2016 to 2017 and 2018 to 2019 for Food Consumption, Nutrient Intakes and Nutritional Status; Public Health England; NDNS: London, UK, 2020. Available online: https://www.gov.uk/government/statistics/ndns-results-from-years-9-to-11-2016-to-2017-and-2018-to-2019 (accessed on 7 May 2025).
- IUNA. Irish Universities Nutrition Alliance. National Adult Nutrition Survey II. NANS II (2021–2022) Summary Report; IUNA: Dublin, Ireland, 2024; Available online: https://irp.cdn-website.com/46a7ad27/files/uploaded/NANS_II_Summary_Report_(May_2024).pdf (accessed on 7 May 2025).
- Sanders, L.M.; Zhu, Y.; Jain, N.; Normington, J.; Holschuh, N.; Nechanicky, M.; Tucker, M.; Garcia-Bailo, B. Ready-to-eat cereal consumption is associated with improved nutrient intakes and diet quality in Canadian adults and children across income levels. Front. Nutr. 2024, 10, 1282252. [Google Scholar] [CrossRef]
- Smith, J.D.; Zhu, Y.; Vanage, V.; Jain, N.; Holschuh, N.; Hermetet Agler, A. Association between Ready-to-Eat Cereal Consumption and Nutrient Intake, Nutritional Adequacy, and Diet Quality among Infants, Toddlers, and Children in the National Health and Nutrition Examination Survey 2015–2016. Nutrients 2019, 11, 1989. [Google Scholar] [CrossRef]
- Zhu, Y.; Jain, N.; Vanage, V.; Holschuh, N.; Agler, A.H.; Smith, J.D. Association between Ready-to-Eat Cereal Consumption and Nutrient Intake, Nutritional Adequacy, and Diet Quality in Adults in the National Health and Nutrition Examination Survey 2015–2016. Nutrients 2019, 11, 2952. [Google Scholar] [CrossRef]
- Mela, D.J.; Woolner, E.M. Perspective: Total, Added, or Free? What Kind of Sugars Should We Be Talking About? Adv. Nutr. 2018, 9, 63–69. [Google Scholar] [CrossRef]
- SACN. SACN Carbohydrates and Health Report. The Scientific Advisory Committee on Nutrition Recommendations on Carbohydrates, Including Sugars and Fibre. 2015. Available online: https://www.gov.uk/government/publications/sacn-carbohydrates-and-health-report (accessed on 7 May 2025).
- Estell, M.L.; Barrett, E.M.; Kissock, K.R.; Grafenauer, S.J.; Jones, J.M.; Beck, E.J. Fortification of grain foods and NOVA: The potential for altered nutrient intakes while avoiding ultra-processed foods. Eur. J. Nutr. 2022, 61, 935–945. [Google Scholar] [CrossRef]
- Papanikolaou, Y.; Fulgoni, V.L.I. The Role of Fortified and Enriched Refined Grains in the US Dietary Pattern: A NHANES 2009-2016 Modeling Analysis to Examine Nutrient Adequacy. Front. Nutr. 2021, 8, 655464. [Google Scholar] [CrossRef] [PubMed]
- Calame, W.; Street, L.; Hulshof, T. Vitamin D Serum Levels in the UK Population, including a Mathematical Approach to Evaluate the Impact of Vitamin D Fortified Ready-to-Eat Breakfast Cereals: Application of the NDNS Database. Nutrients 2020, 12, 1868. [Google Scholar] [CrossRef]
- Smith, J.D.; Jain, N.; Bailey, R.L. Ready-to-eat cereal fortification: A modelling study on the impact of changing ready-to-eat cereal fortification levels on population intake of nutrients. Public Health Nutr. 2020, 23, 2165–2178. [Google Scholar] [CrossRef]
- Rehm, C.D.; Drewnowski, A. Replacing American Breakfast Foods with Ready-To-Eat (RTE) Cereals Increases Consumption of Key Food Groups and Nutrients among US Children and Adults: Results of an NHANES Modeling Study. Nutrients 2017, 9, 1010. [Google Scholar] [CrossRef]
- Tucker, M.; Gracia-Jackson, B.; Fulgoni, V. Modeling the Impact of Replacing Ready-to-eat Cereal with Other Breakfast Foods on Intakes of Added Sugars, Whole Grain, and Nutrients of Public Health Concern Among U.S. Children. J. Acad. Nutr. Diet. 2024, 124, A97. [Google Scholar] [CrossRef]
- Eykhoff, P. System Identification; Parameter and State Estimation; John Wiley & Sons Ltd.: Chester, UK, 1974. [Google Scholar]
- Stephen, A.M.; Champ, M.M.; Cloran, S.J.; Fleith, M.; van Lieshout, L.; Mejborn, H.; Burley, V.J. Dietary fibre in Europe: Current state of knowledge on definitions, sources, recommendations, intakes and relationships to health. Nutr. Res. Rev. 2017, 30, 149–190. [Google Scholar] [CrossRef] [PubMed]
- Brouwer-Brolsma, E.M.; Bischoff-Ferrari, H.A.; Bouillon, R.; Feskens, E.J.; Gallagher, C.J.; Hypponen, E.; Llewellyn, D.J.; Stoecklin, E.; Dierkes, J.; Kies, A.K.; et al. Vitamin D: Do we get enough? A discussion between vitamin D experts in order to make a step towards the harmonisation of dietary reference intakes for vitamin D across Europe. Osteoporos. Int. 2013, 24, 1567–1577. [Google Scholar] [CrossRef]
- Bath, S.C.; Rayman, M.P. Has the UK really become iodine sufficient? Lancet Diabetes Endocrinol. 2018, 6, 89–90. [Google Scholar] [CrossRef]
- PHE. Official Statistics NDNS: Results from Years 9 to 11 (Combined)–Statistical Summary; PHE: London, UK, 2020. [Google Scholar]
- Jones, K.S.; Collins, D.; Meadows, S.R.; Koulman, A.; Page, P. National Diet and Nutrition Survey data reveal a decline in folate status in the United Kingdom population between 2008 and 2019. Am. J. Clin. Nutr. 2023, 118, 1182–1191. [Google Scholar] [CrossRef]
- Smith, J.; Jain, N.; Normington, J.; Holschuh, N.; Zhu, Y. Associations of Ready-to-Eat Cereal Consumption and Income With Dietary Outcomes: Results From the National Health and Nutrition Examination Survey 2015–2018. Front. Nutr. 2022, 9, 816548. [Google Scholar] [CrossRef]
- Michels, N.; De Henauw, S.; Breidenassel, C.; Censi, L.; Cuenca-Garcia, M.; Gonzalez-Gross, M.; Gottrand, F.; Hallstrom, L.; Kafatos, A.; Kersting, M.; et al. European adolescent ready-to-eat-cereal (RTEC) consumers have a healthier dietary intake and body composition compared with non-RTEC consumers. Eur. J. Nutr. 2015, 54, 653–664. [Google Scholar] [CrossRef] [PubMed]
- Affenito, S.G.; Thompson, D.; Dorazio, A.; Albertson, A.M.; Loew, A.; Holschuh, N.M. Ready-to-eat cereal consumption and the School Breakfast Program: Relationship to nutrient intake and weight. J. Sch. Health 2013, 83, 28–35. [Google Scholar] [CrossRef] [PubMed]
- Harris, J.L.; Schwartz, M.B.; Ustjanauskas, A.; Ohri-Vachaspati, P.; Brownell, K.D. Effects of serving high-sugar cereals on children’s breakfast-eating behavior. Pediatrics 2011, 127, 71–76. [Google Scholar] [CrossRef] [PubMed]
- Poinsot, R.; Hopkins, S.; Maillot, M. Evaluation of the nutritional quality of French children breakfasts according to the Breakfast Quality Score (BQS). Front. Nutr. 2024, 11, 1430831. [Google Scholar] [CrossRef]
- Bellisle, F.; Hebel, P.; Salmon-Legagneur, A.; Vieux, F. Breakfast Consumption in French Children, Adolescents, and Adults: A Nationally Representative Cross-Sectional Survey Examined in the Context of the International Breakfast Research Initiative. Nutrients 2018, 10, 1056. [Google Scholar] [CrossRef]
- Gimenez-Legarre, N.; Flores-Barrantes, P.; Miguel-Berges, M.L.; Moreno, L.A.; Santaliestra-Pasias, A.M. Breakfast Characteristics and Their Association with Energy, Macronutrients, and Food Intake in Children and Adolescents: A Systematic Review and Meta-Analysis. Nutrients 2020, 12, 2460. [Google Scholar] [CrossRef]
- Gimenez-Legarre, N.; Miguel-Berges, M.L.; Flores-Barrantes, P.; Santaliestra-Pasias, A.M.; Moreno, L.A. Breakfast Characteristics and Its Association with Daily Micronutrients Intake in Children and Adolescents—A Systematic Review and Meta-Analysis. Nutrients 2020, 12, 3201. [Google Scholar] [CrossRef]
- Kuriyan, R.; Lokesh, D.P.; D’Souza, N.; Priscilla, D.J.; Peris, C.H.; Selvam, S.; Kurpad, A.V. Portion controlled ready-to-eat meal replacement is associated with short term weight loss: A randomised controlled trial. Asia Pac. J. Clin. Nutr. 2017, 26, 1055–1065. [Google Scholar] [CrossRef]
- Powers, H.J.; Stephens, M.; Russell, J.; Hill, M.H. Fortified breakfast cereal consumed daily for 12 wk leads to a significant improvement in micronutrient intake and micronutrient status in adolescent girls: A randomised controlled trial. Nutr. J. 2016, 15, 69. [Google Scholar] [CrossRef]
- Ortega, R.M.; Lopez-Sobaler, A.M.; Andres, P.; Rodriguez-Rodriguez, E.; Aparicio, A.; Bermejo, L.M.; Lopez-Plaza, B. Changes in folate status in overweight/obese women following two different weight control programmes based on an increased consumption of vegetables or fortified breakfast cereals. Br. J. Nutr. 2006, 96, 712–718. [Google Scholar]
- Albertson, A.M.; Affenito, S.G.; Bauserman, R.; Holschuh, N.M.; Eldridge, A.L.; Barton, B.A. The relationship of ready-to-eat cereal consumption to nutrient intake, blood lipids, and body mass index of children as they age through adolescence. J. Am. Diet. Assoc. 2009, 109, 1557–1565. [Google Scholar] [CrossRef] [PubMed]
- Lepicard, E.M.; Maillot, M.; Vieux, F.; Viltard, M.; Bonnet, F. Quantitative and qualitative analysis of breakfast nutritional composition in French schoolchildren aged 9–11 years. J. Hum. Nutr. Diet. 2017, 30, 151–158. [Google Scholar] [CrossRef] [PubMed]
- Zhu, Y.; Jain, N.; Normington, J.; JM, M.; Holschuh, N.; Smith, J. Consumption of Ready-to-Eat Cereal and Its Associations With Nutrient Intake and Nutrition Adequacy in the United States, NHANES 2017–2018. Curr. Dev. Nutr. 2021, 5, 1115. [Google Scholar] [CrossRef]
- Zhu, Y.; Jain, N.; Vanage, V.; Holschuh, N.; Smith, J. Association Between Ready-to-Eat Cereal Consumption and Serum Level of 25-hydroxyvitamin D in US Children and Adults, NHANES 2013–2014. Curr. Dev. Nutr. 2020, 4, nzaa061_142. [Google Scholar] [CrossRef]
- Zhu, Y.; Jain, N.; Normington, J.; Holschuh, N.; Smith, J. Consumption of Ready-to-Eat Cereal and Its Associations with Daily Nutrient Intake in Children Receiving WIC Benefits, NHANES 2013–2016. Curr. Dev. Nutr. 2022, 6, 971. [Google Scholar] [CrossRef]
- Sanders, L.M.; Dicklin, M.R.; Zhu, Y.; Maki, K.C. The Relationship of Ready-to-Eat Cereal Intake and Body Weight in Adults: A Systematic Review of Observational Studies and Controlled Trials. Adv. Nutr. 2023, 14, 671–684. [Google Scholar] [CrossRef]
- Sanders, L.M.; Dicklin, M.R.; Zhu, Y.; Maki, K.C. The Impact of Ready-to-Eat Cereal Intake on Body Weight and Body Composition in Children and Adolescents: A Systematic Review of Observational Studies and Controlled Trials. Adv. Nutr. 2023, 14, 161–172. [Google Scholar] [CrossRef]
- de la Hunty, A.; Gibson, S.; Ashwell, M. Does regular breakfast cereal consumption help children and adolescents stay slimmer? A systematic review and meta-analysis. Obes. Facts 2013, 6, 70–85. [Google Scholar] [CrossRef]
- Aune, D.; Norat, T.; Romundstad, P.; Vatten, L.J. Whole grain and refined grain consumption and the risk of type 2 diabetes: A systematic review and dose-response meta-analysis of cohort studies. Eur. J. Epidemiol. 2013, 28, 845–858. [Google Scholar] [CrossRef]
- Chen, Z.; Khandpur, N.; Desjardins, C.; Wang, L.; Monteiro, C.A.; Rossato, S.L.; Fung, T.T.; Manson, J.E.; Willett, W.C.; Rimm, E.B.; et al. Ultra-Processed Food Consumption and Risk of Type 2 Diabetes: Three Large Prospective U.S. Cohort Studies. Diabetes Care 2023, 46, 1335–1344. [Google Scholar] [CrossRef]
- Sun, T.; Zhang, Y.; Ding, L.; Zhang, Y.; Li, T.; Li, Q. The Relationship Between Major Food Sources of Fructose and Cardiovascular Outcomes: A Systematic Review and Dose-Response Meta-Analysis of Prospective Studies. Adv. Nutr. 2023, 14, 256–269. [Google Scholar] [CrossRef] [PubMed]
- Kwok, C.S.; Gulati, M.; Michos, E.D.; Potts, J.; Wu, P.; Watson, L.; Loke, Y.K.; Mallen, C.; Mamas, M.A. Dietary components and risk of cardiovascular disease and all-cause mortality: A review of evidence from meta-analyses. Eur. J. Prev. Cardiol. 2019, 26, 1415–1429. [Google Scholar] [CrossRef]
- Aune, D.; Keum, N.; Giovannucci, E.; Fadnes, L.T.; Boffetta, P.; Greenwood, D.C.; Tonstad, S.; Vatten, L.J.; Riboli, E.; Norat, T. Whole grain consumption and risk of cardiovascular disease, cancer, and all cause and cause specific mortality: Systematic review and dose-response meta-analysis of prospective studies. BMJ 2016, 353, i2716. [Google Scholar] [CrossRef] [PubMed]
- Beserra, J.B.; Soares, N.; Marreiros, C.S.; Carvalho, C.; Martins, M.; Freitas, B.; Santos, M.M.D.; Frota, K.M.G. Do children and adolescents who consume ultra-processed foods have a worse lipid profile? A systematic review. Cien Saude Colet. 2020, 25, 4979–4989. [Google Scholar] [CrossRef]
- Mendoza, K.; Smith-Warner, S.A.; Rossato, S.L.; Khandpur, N.; Manson, J.E.; Qi, L.; Rimm, E.B.; Mukamal, K.J.; Willett, W.C.; Wang, M.; et al. Ultra-processed foods and cardiovascular disease: Analysis of three large US prospective cohorts and a systematic review and meta-analysis of prospective cohort studies. Lancet Reg. Health Am. 2024, 37, 100859. [Google Scholar] [CrossRef] [PubMed]
- Gibson, S. Micronutrient intakes, micronutrient status and lipid profiles among young people consuming different amounts of breakfast cereals: Further analysis of data from the National Diet and Nutrition Survey of Young People aged 4 to 18 years. Public Health Nutr. 2003, 6, 815–820. [Google Scholar] [CrossRef]
- Taneri, P.E.; Wehrli, F.; Roa-Diaz, Z.M.; Itodo, O.A.; Salvador, D.; Raeisi-Dehkordi, H.; Bally, L.; Minder, B.; Kiefte-de Jong, J.C.; Laine, J.E.; et al. Association Between Ultra-Processed Food Intake and All-Cause Mortality: A Systematic Review and Meta-Analysis. Am. J. Epidemiol. 2022, 191, 1323–1335. [Google Scholar] [CrossRef]
- Dicken, S.; Dahm, C.; Ibsen, D.; Olsen, A.; Tjonneland, A.; Louati-Hajji, M. Food consumption by degree of food processing and risk of type 2 diabetes mellitus: A prospective cohort analysis of the European Prospective Investigation into Cancer and Nutrition (EPIC). Lancet Reg. Health-Eur. 2024, 46, 101043. [Google Scholar] [CrossRef]
- Hang, D.; Wang, L.; Fang, Z.; Du, M.; Wang, K.; He, X.; Khandpur, N.; Rossato, S.L.; Wu, K.; Hu, Z.; et al. Ultra-processed food consumption and risk of colorectal cancer precursors: Results from 3 prospective cohorts. J. Natl. Cancer Inst. 2023, 115, 155–164. [Google Scholar] [CrossRef]
- Lo, C.H.; Khandpur, N.; Rossato, S.L.; Lochhead, P.; Lopes, E.W.; Burke, K.E.; Richter, J.M.; Song, M.; Ardisson Korat, A.V.; Sun, Q.; et al. Ultra-processed Foods and Risk of Crohn’s Disease and Ulcerative Colitis: A Prospective Cohort Study. Clin. Gastroenterol. Hepatol. 2022, 20, e1323–e1337. [Google Scholar] [CrossRef]
- Belchor, A.L.L.; de Assis, M.A.A.; Cezimbra, V.G.; Pereira, L.J.; Roberto, D.M.T.; Giacomelli, S.C.; Vieira, F.G.K.; Di Pietro, P.F.; Hinnig, P.F. Is breakfast consumption among Brazilian schoolchildren associated with an ultra-processed food dietary pattern? Nutr. Bull. 2022, 47, 488–500. [Google Scholar] [CrossRef]
- Gibney, M.J.; Barr, S.I.; Bellisle, F.; Drewnowski, A.; Fagt, S.; Livingstone, B.; Masset, G.; Varela Moreiras, G.; Moreno, L.A.; Smith, J.; et al. Breakfast in Human Nutrition: The International Breakfast Research Initiative. Nutrients 2018, 10, 559. [Google Scholar] [CrossRef] [PubMed]
- Scholz-Ahrens, K.E.; Ahrens, F.; Barth, C.A. Nutritional and health attributes of milk and milk imitations. Eur. J. Nutr. 2020, 59, 19–34. [Google Scholar] [CrossRef] [PubMed]
- Song, W.O.; Chun, O.K.; Kerver, J.; Cho, S.; Chung, C.E.; Chung, S.J. Ready-to-eat breakfast cereal consumption enhances milk and calcium intake in the US population. J. Am. Diet. Assoc. 2006, 106, 1783–1789. [Google Scholar] [CrossRef] [PubMed]
- Trumbo, P.R.; Bleiweiss-Sande, R.; Campbell, J.K.; Decker, E.; Drewnowski, A.; Erdman, J.W.; Ferruzzi, M.G.; Forde, C.G.; Gibney, M.J.; Hess, J.M.; et al. Toward a science-based classification of processed foods to support meaningful research and effective health policies. Front. Nutr. 2024, 11, 1389601. [Google Scholar] [CrossRef]
- Koios, D.; Machado, P.; Lacy-Nichols, J. Representations of Ultra-Processed Foods: A Global Analysis of How Dietary Guidelines Refer to Levels of Food Processing. Int. J. Health Policy Manag. 2022, 11, 2588–2599. [Google Scholar] [CrossRef]
- UN. United Nations Department of Economic and Social Affairs. World Population Projected to Reach 9.8 Billion in 2050, and 11.2 Billion in 2100. Available online: https://www.un.org/en/desa/world-population-projected-reach-98-billion-2050-and-112-billion-2100 (accessed on 7 May 2025).
- Croisier, E.; Hughes, J.; Duncombe, S.; Grafenauer, S. Back in Time for Breakfast: An Analysis of the Changing Breakfast Cereal Aisle. Nutrients 2021, 13, 489. [Google Scholar] [CrossRef]
- EFSA Panel on Nutrition, N.f.; Food, a.; Turck, D.; Castenmiller, J.; De Henauw, S.; Hirsch-Ernst, K.I.; Kearney, J.; Knutsen, H.K.; Maciuk, A.; Mangelsdorf, I.; et al. Beta-glucans from oats and/or barley in a ready-to-eat cereal manufactured via pressure cooking and reduction of blood-glucose rise after consumption: Evaluation of a health claim pursuant to Article 13(5) of Regulation (EC) No 1924/2006. EFSA J. 2021, 19, e06493. [Google Scholar] [CrossRef]
- Barber, T.M.; Kabisch, S.; Pfeiffer, A.F.H.; Weickert, M.O. The Health Benefits of Dietary Fibre. Nutrients 2020, 12, 3209. [Google Scholar] [CrossRef]
- Slavin, J.L.; Martini, M.C.; Jacobs, D.R., Jr.; Marquart, L. Plausible mechanisms for the protectiveness of whole grains. Am. J. Clin. Nutr. 1999, 70, 459S–463S. [Google Scholar] [CrossRef]
- Costabile, A.; Klinder, A.; Fava, F.; Napolitano, A.; Fogliano, V.; Leonard, C.; Gibson, G.R.; KM, T. Whole-grain wheat breakfast cereal has a prebiotic effect on the human gut microbiota: A double-blind, placebo-controlled, crossover study. Br. J. Nutr. 2008, 99, 110–120. [Google Scholar] [CrossRef] [PubMed]
- Schaller, D.R.; Olson, B.H. A food industry perspective on folic acid fortification. J. Nutr. 1996, 126, 761S–764S. [Google Scholar] [CrossRef] [PubMed]
- Chitkara, S.; Gonzalez, A.; Shah, A. The Role of Folic Acid in the Regulation of Homocysteine Levels and Cardiovascular Disease. In Hydrophilic Vitamins in Health and Disease. Advances in Biochemistry in Health and Disease; Shah, A.K., Tappia, P.S., Dhalla, N.S., Eds.; Springer: Berlin/Heidelberg, Germany, 2024; Volume 29. [Google Scholar]
- Liew, C.H. Dietary Fibre for the Prevention of Cardiovascular Disease. Ir. Med. J. 2020, 113, 76. [Google Scholar]
- McCarthy, C.; Papada, E.; Kalea, A.Z. The effects of cereal beta-glucans on cardiovascular risk factors and the role of the gut microbiome. Crit. Rev. Food Sci. Nutr. 2024, 65, 2489–2505. [Google Scholar] [CrossRef]
- Giacco, R.; Della Pepa, G.; Luongo, D.; Riccardi, G. Whole grain intake in relation to body weight: From epidemiological evidence to clinical trials. Nutr. Metab. Cardiovasc. Dis. 2011, 21, 901–908. [Google Scholar] [CrossRef]
- Mathews, R.; Shete, V.; Chu, Y. The effect of cereal Beta-glucan on body weight and adiposity: A review of efficacy and mechanism of action. Crit. Rev. Food Sci. Nutr. 2023, 63, 3838–3850. [Google Scholar] [CrossRef]
- Knudsen, K.; Hartvigsen, M.; Hedemann, M.; Hermansen, K. Chapter 8-Mechanisms Whereby Whole Grain Cereals Modulate the Prevention of Type 2 Diabetes. In Molecular Nutrition and Diabetes Series; Academic Press: Cambridge, MA, USA, 2016; pp. 87–103. [Google Scholar]
- Tullio, V.; Gasperi, V.; Catani, M.V.; Savini, I. The Impact of Whole Grain Intake on Gastrointestinal Tumors: A Focus on Colorectal, Gastric, and Esophageal Cancers. Nutrients 2020, 13, 81. [Google Scholar] [CrossRef]
- Albertson, A.M.; Thompson, D.; Franko, D.L.; Kleinman, R.E.; Barton, B.A.; SJ, C. Consumption of breakfast cereal is associated with positive health outcomes: Evidence from the National Heart, Lung, and Blood Institute Growth and Health Study. Nutr. Res. 2008, 28, 744–752. [Google Scholar] [CrossRef]
- Levine, A.S.; Ubbink, J. Ultra-processed foods: Processing versus formulation. Obes. Sci. Pract. 2023, 9, 435–439. [Google Scholar] [CrossRef]
- Forde, C.G. Beyond ultra-processed: Considering the future role of food processing in human health. Proc. Nutr. Soc. 2023, 82, 406–418. [Google Scholar] [CrossRef]
- Derbyshire, E. Are all ‘ultra-processed’ foods nutritional demons? A commentary and nutritional profiling analysis. Trends Food Sci. Technol. 2019, 94, 98–104. [Google Scholar] [CrossRef]
- Lockyer, S.; Spiro, A.; Berry, S.; He, J.; Loth, S.; Martinez-Inchausti, A.; Mellor, D.; Raats, M.; Sokolovic, M.; Vijaykumar, S.; et al. How do we differentiate not demonise-Is there a role for healthier processed foods in an age of food insecurity? Proceedings of a roundtable event. Nutr. Bull. 2023, 48, 278–295. [Google Scholar] [CrossRef]
- Hu, Y.; Ding, M.; Sampson, L.; Willett, W.C.; Manson, J.E.; Wang, M.; Rosner, B.; Hu, F.B.; Sun, Q. Intake of whole grain foods and risk of type 2 diabetes: Results from three prospective cohort studies. BMJ 2020, 370, m2206. [Google Scholar] [CrossRef]
- Hu, Y.; Willett, W.C.; Manson, J.A.E.; Rosner, B.; Hu, F.B.; Sun, Q. Intake of whole grain foods and risk of coronary heart disease in US men and women. BMC Med. 2022, 20, 192. [Google Scholar] [CrossRef]
- Barrett, E.M.; Foster, S.I.; Beck, E.J. Whole grain and high-fibre grain foods: How do knowledge, perceptions and attitudes affect food choice? Appetite 2020, 149, 104630. [Google Scholar] [CrossRef]
- Michels, N.; De Henauw, S.; Beghin, L.; Cuenca-Garcia, M.; Gonzalez-Gross, M.; Hallstrom, L.; Kafatos, A.; Kersting, M.; Manios, Y.; Marcos, A.; et al. Ready-to-eat cereals improve nutrient, milk and fruit intake at breakfast in European adolescents. Eur. J. Nutr. 2016, 55, 771–779. [Google Scholar] [CrossRef]
- Bailey, R.L.; Pac, S.G.; Fulgoni, V.L., 3rd; Reidy, K.C.; Catalano, P.M. Estimation of Total Usual Dietary Intakes of Pregnant Women in the United States. JAMA Netw. Open 2019, 2, e195967. [Google Scholar] [CrossRef]
- Obeid, R.; Heil, S.G.; Verhoeven, M.M.A.; van den Heuvel, E.; de Groot, L.; Eussen, S. Vitamin B12 Intake from Animal Foods, Biomarkers, and Health Aspects. Front. Nutr. 2019, 6, 93. [Google Scholar] [CrossRef]
- Jalal, C.S.; De-Regil, L.M.; Pike, V.; Mithra, P. Fortification of condiments and seasonings with iron for preventing anaemia and improving health. Cochrane Database Syst. Rev. 2023, 9, CD009604. [Google Scholar] [CrossRef]
- Boyle, N.B.; Adolphus, K.; Caton, S.J.; Croden, F.C.; Dye, L.; Glass, A.; Halliwell, K.; Hansen, G.L.; Holm, L.; Jackson, P.; et al. Increasing fibre intake in the UK: Lessons from the Danish Whole Grain Partnership. Br. J. Nutr. 2024, 131, 672–685. [Google Scholar] [CrossRef]
- Sarmiento-Santos, J.; Souza, M.B.N.; Araujo, L.S.; Pion, J.M.V.; Carvalho, R.A.; Vanin, F.M. Consumers’ Understanding of Ultra-Processed Foods. Foods 2022, 11, 1359. [Google Scholar] [CrossRef]
- ANSES. French Agency for Food, Environmental, and Occupational Health & Safety. AVIS de l’Agence Nationale de Sécurité Sanitaire de l’Alimentation, de l’Environnement et du Travail. Available online: https://www.anses.fr/fr/system/files/NUT2022-SA-0155.pdf (accessed on 6 April 2025).
- FDE. FoodDrink Europe. Ultra-Processed Foods, Position Paper. 2024. Available online: https://www.fooddrinkeurope.eu/wp-content/uploads/2024/10/FDE-UPF-paper_October-2024.pdf (accessed on 7 May 2025).
| Level of Evidence | Descriptor |
|---|---|
| Ma1++ Ma1+ Ma1− | Meta-analyses of high quality with a very low risk of bias. Meta-analyses well-conducted with a low risk of bias. Meta-analyses with a high risk of bias. |
| Rs1++ Rs1+ Rs1− | Systematic review of high quality with a very low risk of bias. Systematic review well-conducted with a low risk of bias. Systematic review with a high risk of bias. |
| RCT1++ RCT1+ RCT1− | RCTs of high quality with a very low risk of bias. RCTs well-conducted with a low risk of bias. RCTs with a high risk of bias. |
| Coh2++ | Cohort studies with a very low risk of confounding or bias and a high probability that the relationship is causal. |
| Coh2+ | Cohort studies with a low risk of confounding or bias and a moderate probability that the relationship is causal. |
| Coh2− | Cohort studies with a high risk of confounding or bias and a significant risk that the relationship is not causal. |
| CaCo2++ | Cohort studies with a very low risk of confounding or bias and a high probability that the relationship is causal. |
| CaCo2+ | Cohort studies with a low risk of confounding or bias and a moderate probability that the relationship is causal. |
| CaCo2− | Cohort studies with a high risk of confounding or bias and a significant risk that the relationship is not causal. |
| The levels of scientific evidence categorised as “1++” and “1+” generate a “type A” recommendation degree. Grade A—A At least one meta-analysis, systematic review, or clinical study rated as 1++ and directly applicable to the target population, or a body of evidence consisting principally of studies rated as 1+, directly applicable to the target population, and demonstrating consistency of results. |
| The level of scientific evidence categorised as “2++” generates a “type B” recommendation degree. Grade B—A body of evidence including studies rated as 2++, directly applicable to the target population and demonstrating overall consistency of results, or extrapolated evidence from studies rated as 1++ or 1+. |
| The level of scientific evidence categorised as “2+” generates a “type C” recommendation degree. Grade C—A body of evidence including studies rated as 2+, directly applicable to the target population and demonstrating overall consistency of results, or extrapolated evidence from studies rated as 2++. |
| The levels of scientific evidence categorised as “3” and “4” generate a “type D” recommendation degree. Grade D—Evidence level 3 or 4 or extrapolated evidence from studies rated as 2+. Recommended best practice based on the clinical experience of a guideline development group. |
| The levels of scientific evidence categorised as “1−” and “2−” are considered “not recommended” due to high bias risk. |
| Energy | Carbohydrate | Protein | Fat | Saturated Fat | Sugar | Fibre | |||||
|---|---|---|---|---|---|---|---|---|---|---|---|
| Reference and Country | Age, y | Cereal | Analysis | % Consumers Only | % | % | % | % | % | % | % |
| NDNS RPS (2016/17–2018/19) years 9–11, 2020 UK [34] | 4–10 | High-fibre breakfast cereals | C+NC | NR | 3 | 5 | 3 | 1 | 1 | 3 FS | 7 |
| NDNS RPS (2016/17–2018/19) years 9–11, 2020 UK [34] | 4–10 | Other breakfast cereals | C+NC | NR | 2 | 4 | 1 | 1 | 1 | 4 FS | 2 |
| NDNS RPS (2016/17–2018/19) years 9–11, 2020 UK [34] | 11–18 | High-fibre breakfast cereals | C+NC | NR | 2 | 3 | 2 | 1 | 1 | 3 FS | 5 |
| NDNS RPS (2016/17–2018/19) years 9–11, 2020 UK [34] | 11–18 | Other breakfast cereals | C+NC | NR | 2 | 4 | 1 | 1 | 1 | 4 FS | 2 |
| NDNS RPS (2016/17–2018/19) years 9–11, 2020 UK [34] | 19–64 | High-fibre breakfast cereals | C+NC | NR | 3 | 5 | 3 | 2 | 2 | 2 FS | 6 |
| NDNS RPS (2016/17–2018/19) years 9–11, 2020 UK [34] | 19–64 | Other breakfast cereals | C+NC | NR | 2 | 2 | 0 | 0 | 0 | 2 FS | 1 |
| IUNA NCFS II (2017–18), Ireland [31] | 5–12 | Breakfast cereals | C+NC | 85% RTEC 59% HFC 54% LFC 28% porridge/hot oat cereals (made up) | 9 | 12 | 6 | 3 | 3 | 7 TS 11 FS | 15 |
| IUNA NTFS II (2019–2020), 2021 Ireland [33] | 13–18 | Breakfast cereals | C+NC | 67% RTEC 45% HFC 37% LFC 17% porridge/hot oats | 7 | 10 | 5 | NR | NR | 6 TS 11 FS | 12 |
| IUNA NANS II (2021–2022), 2024 Ireland [35] | 19–64 | Breakfast cereals | C+NC | 39% RTEC 29% HFC 12% LFC 30% porridge/hot oats | 5 | 8 | 4 | NR | 3 | 4 TS | 8 |
| IUNA NANS II (2021–2022), 2024 Ireland [35] | ≥65 | Breakfast cereals | C+NC | 44% RTEC 33% HFC 17% LFC 47% porridge/hot oats | 7 | 10 | 6 | NR | 4 | 5 TS | 12 |
| INCA 3 (2017), France [30] | 1–10 11–17 | Breakfast cereals and bars | C+NC | 35% B (1–10 y) 37% G (1–10 y) 46% M (11–17 y) 50%F (11–17 y) | 2 1 | 3 5 | 1 2 | 1 1 | 1 1 | 2 TS 4 TS | 3 4 |
| INCA 3 (2017), France [30] | 18–79 | Breakfast cereals and bars | C+NC | 17%M 13%F | 1 | 2 | 1 | 1 | 1 | 1 TS | 1 |
| CCHS 2015, Vatanparast et al., 2019, Canada [32] | 2–12 | RTECs | C | 38% RTEC | 8 | 11 | 4 | 3 | 2 | 8 TS | 16 |
| CCHS 2015, Vatanparast et al., 2019, Canada [32] | 13–18 | RTECs | C | 29% RTEC | 9 | 14 | 5 | 4 | 3 | 11 TS | 19 |
| CCHS 2015, Vatanparast et al., 2019, Canada [32] | ≥19 | RTECs | C | 19% RTEC | 9 | 15 | 6 | 3 | 3 | 10 TS | 23 |
| CCHS 2015 Sanders et al., 2024, Canada [36] | 2–18 | RTECs | C | 36% RTEC LI 35% RTEC MI 36% RTEC HI | ≈6 ≈7 ≈7 | ≈11 ≈12 ≈12 | ≈3 ≈3 ≈4 | ≈2 ≈2 ≈3 | ≈2 ≈1 ≈3 | ≈6 TS ≈7 TS ≈6 TS | ≈14 ≈16 ≈17 |
| CCHS 2015 Sanders et al., 2024, Canada [36] | 19+ | RTECs | C | 22% RTEC LI 23% RTEC MI 21% RTEC HI | ≈8 ≈8 ≈9 | ≈12 ≈12 ≈15 | ≈5 ≈4 ≈5 | ≈2 ≈3 ≈3 | ≈1 ≈3 ≈3 | ≈7 TS ≈8 TS ≈9 TS | ≈22 ≈22 ≈23 |
| NHANES 2015–16 Smith et al., 2019, USA [37] | 0.5–17 | RTECs | C | 36% RTEC | ≈10 | ≈14 | ≈4 | ≈3 | ≈18 AS ≈11 TS | ≈18 | |
| NHANES 2015–16 Smith et al., 2019, USA [37] | 0.5–17 | RTECs | C+NC | -- | ≈3 | ≈6 | ≈2 | ≈1 | ≈6 AS ≈4 TS | ≈7 | |
| NHANES 2015–16 Zhu et al., 2019, USA [38] | 18+ | RTECs | C | 19% RTEC | 10 | 16 | 6 | 3 | -- | 16 AS | 22 |
| NHANES 2015–16 Zhu et al., 2019, USA [38] | 18+ | RTECs | C+NC | -- | 2 | 3 | 1 | 1 | -- | 3 AS | 5 |
| Reference and country | Age, y | Cereal | Analysis | % Consumers Only | Vit A (μg) | Vit B1 (mg) | Vit B2 (mg) | Vit B3 (mg) | Vit B5 (mg) | Vit B6 (mg) | Folate (µg) | Vit B12 (µg) | Vit D (µg) | Ca (mg) | Mg (mg) | K (mg) | Fe (mg) | Zn (mg) |
|---|---|---|---|---|---|---|---|---|---|---|---|---|---|---|---|---|---|---|
| NDNS RPS (2016/17–2018/19) years 9–11, 2020, UK [34] | 4–10 | High-fibre breakfast cereals | C+NC | NR | 1 | NR | 9 | NR | NR | NR | 9 | NR | 6 | 4 | 5 | 3 | 12 | 4 |
| NDNS RPS (2016/17–2018/19) years 9–11, 2020, UK [34] | 4–10 | Other breakfast cereals | C+NC | NR | NR | NR | 7 | NR | NR | NR | 9 | NR | 15 | 1 | 2 | 1 | 9 | 2 |
| NDNS RPS (2016/17–2018/19) years 9–11, 2020, UK [34] | 11–18 | High-fibre breakfast cereals | C+NC | NR | 0 | NR | 7 | NR | NR | NR | 6 | NR | 5 | 3 | 4 | 2 | 8 | 3 |
| NDNS RPS (2016/17–2018/19) years 9–11, 2020, UK [34] | 11–18 | Other breakfast cereals | C+NC | NR | NR | NR | 7 | NR | NR | NR | 8 | NR | 13 | 1 | 2 | 1 | 8 | 1 |
| NDNS RPS (2016/17–2018/19) years 9–11, 2020, UK [34] | 19–64 | High-fibre breakfast cereals | C+NC | NR | 1 | NR | 6 | NR | NR | NR | 5 * | NR | 3 | 3 | 5 | 3 | 8 | 4 |
| NDNS RPS (2016/17–2018/19) years 9–11, 2020, UK [34] | 19–64 | Other breakfast cereals | C+NC | NR | NR | NR | 3 | NR | NR | NR | 3 | NR | 6 | 0 | 1 | 0 | 3 | 1 |
| IUNA NCFS II (2017–18), Ireland [31] | 5–12 | Breakfast cereals | C+NC | 85% RTEC 59% HFC 54% LFC 28% porridge/hot oat cereals (made up) | 2 | 18 | 22 | 15 | - | 18 | 24 | 12 | 23 | 8 | 11 | 5 | 28 | 9 |
| IUNA NTFS II (2019–2020), 2021, Ireland [33] | 13–18 | Breakfast cereals | C+NC | 67% RTEC 45% HFC 37% LFC 17% porridge/hot oats | 8 | NR | 18 | NR | NR | NR | 25 | NR | 19 | 5 | NR | NR | 22 | NR |
| IUNA NANS II (2021–2022), 2024, Ireland [35] | 19–64 | Breakfast cereals | C+NC | 39% RTEC 29% HFC 12% LFC 30% porridge/hot oats | NR | NR | 9 | NR | NR | 6 | 9 | 6 | 6 | 6 | NR | NR | 10 | 6 |
| IUNA NANS II (2021–2022), 2024, Ireland [35] | ≥65 | Breakfast cereals | C+NC | 44% RTEC 33% HFC 17% LFC 47% porridge/hot oats | NR | NR | 11 | NR | NR | 9 | 12 | 8 | 7 | 7 | NR | NR | 14 | 8 |
| INCA 3 (2017), France [30] | 1–10 11–17 | Breakfast cereals and bars | C+NC | 35% B (0–10 y) 37% G (0–10 y) 46% M (11–17 y) 50%F (11–17 y) | 5 8 | 7 11 | 6 10 | 9 11 | 8 12 | 8 11 | 5 8 | 4 6 | 3 6 | 2 4 | 2 3 | 1 2 | 7 11 | 1 2 |
| INCA 3 (2017), France [30] | 18–74 | Breakfast cereals and bars | C+NC | 17%M 13%F | 1 | 3 | 3 | 3 | 4 | 3 | 2 | 1 | 1 | 1 | 1 | 1 | 3 | 1 |
| CCHS 2015, Vatanparast et al., 2019, Canada [32] | 2–12 | RTECs | C | 38% RTEC | <0.01 | 23 | 4 | 9 | NR | 17 | 14 DFE | 0 | 6 | 6 | 9 | 4 | 32 | 9 |
| CCHS 2015, Vatanparast et al., 2019, Canada [32] | 13–18 | RTECs | C | 29% RTEC | <0.01 | 30 | 8 | 11 | NR | 20 | 30 FA | 0 | 9 | 6 | 11 | 5 | 35 | 10 |
| CCHS 2015, Vatanparast et al., 2019, Canada [32] | ≥19 | RTECs | C | 19% RTEC | <0.01 | 29 | 6 | 11 | NR | 17 | 16 DFE | 0.01 | 5 | 6 | 12 | 6 | 32 | 12 |
| CCHS Sanders et al., 2024, Canada [36] | 2–18 | RTECs | C | 36% RTEC LI 35% RTEC MI 36% RTEC HI | NR NR NR | ≈28 ≈27 ≈26 | ≈7 ≈6 ≈4 | ≈8 ≈8 ≈8 | NR NR NR | ≈15 ≈16 ≈15 | 13 DFE 12 DFE 12 DFE | NR NR NR | ≈7 ** ≈7 ** ≈7 ** | ≈4 ≈4 ≈4 | ≈8 ≈9 ≈10 | ≈2 ≈3 ≈4 | ≈32 ≈32 ≈32 | ≈8 ≈9 ≈9 |
| CCHS Sanders et al., 2024, Canada [36] | 19+ | RTECs | C | 22% RTEC LI 23% RTEC MI 21% RTEC HI | NR NR NR | ≈32 ≈29 ≈33 | ≈9 ≈5 ≈4 | ≈10 ≈9 ≈10 | NR NR NR | ≈16 ≈13 ≈15 | 15 DFE 12 DFE 13 DFE | NR NR NR | ≈4 ** ≈3 ** ≈5 ** | ≈4 ≈4 ≈3 | ≈13 ≈12 ≈13 | ≈5 ≈5 ≈5 | ≈33 ≈31 ≈32 | ≈10 ≈10 ≈12 |
| NHANES 2015–16 Smith et al., 2019, USA [37] | 0.5–17 | RTECs | C | 36% RTEC | ≈36 | NR | ≈27 | ≈35 | -- | ≈43 | 34 FA | ≈39 | ≈21 | ≈8 | ≈11 | ≈5 | ≈51 | ≈33 |
| NHANES 2015–16 Smith et al., 2019, USA [37] | 0.5–17 | RTECs | C+NC | -- | ≈17 | NR | ≈12 | ≈15 | -- | ≈20 | ≈12 DFE | ≈19 | ≈11 | ≈3 | ≈4 | ≈2 | ≈24 | ≈14 |
| NHANES 2015–16 Zhu et al., 2019, USA [38] | 18+ | RTECs | C | 19% RTEC | 27 | 33 | 24 | 30 | -- | 41 | ≈12 DFE | 38 | 21 | 6 | 13 | 7 | 49 | 30 |
| NHANES 2015–16 Zhu et al., 2019, USA [38] | 18+ | RTECs | C+NC | -- | 8 | 8 | 6 | 6 | -- | 10 | ≈54 | 11 | 6 | 1 | 3 | 1 | 14 | 7 |
Disclaimer/Publisher’s Note: The statements, opinions and data contained in all publications are solely those of the individual author(s) and contributor(s) and not of MDPI and/or the editor(s). MDPI and/or the editor(s) disclaim responsibility for any injury to people or property resulting from any ideas, methods, instructions or products referred to in the content. |
© 2025 by the authors. Licensee MDPI, Basel, Switzerland. This article is an open access article distributed under the terms and conditions of the Creative Commons Attribution (CC BY) license (https://creativecommons.org/licenses/by/4.0/).
Share and Cite
Derbyshire, E.J.; Ruxton, C.H.S. A Systematic Review of Evidence on the Role of Ready-to-Eat Cereals in Diet and Non-Communicable Disease Prevention. Nutrients 2025, 17, 1680. https://doi.org/10.3390/nu17101680
Derbyshire EJ, Ruxton CHS. A Systematic Review of Evidence on the Role of Ready-to-Eat Cereals in Diet and Non-Communicable Disease Prevention. Nutrients. 2025; 17(10):1680. https://doi.org/10.3390/nu17101680
Chicago/Turabian StyleDerbyshire, E. J., and C. H. S. Ruxton. 2025. "A Systematic Review of Evidence on the Role of Ready-to-Eat Cereals in Diet and Non-Communicable Disease Prevention" Nutrients 17, no. 10: 1680. https://doi.org/10.3390/nu17101680
APA StyleDerbyshire, E. J., & Ruxton, C. H. S. (2025). A Systematic Review of Evidence on the Role of Ready-to-Eat Cereals in Diet and Non-Communicable Disease Prevention. Nutrients, 17(10), 1680. https://doi.org/10.3390/nu17101680