Abstract
Nutrition and oral health are closely related, especially in older adults in whom poor nutrition may lead to oral microbial perturbations, exacerbating poor oral health. In a 6-month randomized controlled trial, we evaluated the effects on oral microbiota and on oral health of dietary advice aimed at increasing protein intake to ≥1.2 g/kg adjusted body weight/day (g/kg aBW/d) in community-dwelling older adults with low habitual protein intake (<1.0 g/kg aBW/d). Food intake was measured via 24 h dietary recalls, oral health was measured via questionnaires, and oral microbial composition was assessed via the 16S rRNA sequencing of tongue swabs. Mean baseline protein intake was 0.8 g/kg aBW/day in both groups. In the high protein group (n = 47), participants increased their protein intake to mean 1.2 g/kg aBW/day at the 6-month follow-up. Protein intake in the control group (n = 43) remained at 0.9 g/kg a BW/day. The intervention did not affect self-reported oral health. While it caused moderate shifts in oral microbiota alpha- and beta-diversity measures, abundances of individual bacterial taxa were not affected. In conclusion, our intervention did not affect self-reported oral health within a period of 6 months, nor did it substantially affect the tongue microbiota composition.
1. Introduction
It is well-established that nutrition and oral health are closely related [1]. This relationship is especially evident in older adults, in whom both oral health and nutritional status are often compromised [2,3]. Poor oral health in older adults is characterized by high rates of caries, periodontal disease, edentulism, and xerostomia [3], which are largely microbiota-associated diseases [4]. Several cross-sectional studies have confirmed associations of poor oral health with lower and less varied nutrient intake [5,6,7], particularly a lower intake of protein [8]. Poor oral health is thought to disturb masticatory function, and lead to decreased food intake and protein-energy malnutrition [9]. Vice versa, it has been suggested that insufficient protein intake aggravates poor oral health in various ways [10,11,12], but evidence is scarce.
Protein deficiency is said to compromise the integrity of dentition and its supporting structures. It is also thought to result in delayed wound healing and poor resistance to oral pathogens [10]. Moreover, protein deficiency is said to reduce salivary flow and alter its composition, limiting its protective abilities [12]. Protein-energy malnutrition may also cause salivary gland atrophy and be related to enamel hypoplasia, predisposing individuals to dental caries [1,12]. It must be noted that the studies underpinning these mechanisms focus on children or animal models [12]. There is also new evidence suggesting that protein intake is associated with the composition of the oral microbiota. A recent cross-sectional observational study of 59 healthy adults found that protein intake was positively associated with several bacterial taxa, including Selenomonas, Johnsonella, Prevotella, Peptostreptococcus, and Actinomyces [11]; however, the clinical implications are unclear. The effect of dietary protein on the oral microbiota composition may constitute a novel pathway by which nutrition affects oral health. As of yet, no interventional studies have been performed to evaluate the effects of increasing protein intake on oral health or the oral microbiota in older adults.
Currently, the European Food Safety Authority recommends 0.83 g protein intake per kg body weight per day, irrespective of age [13]. However, many researchers argue that older adults should at least consume 1.0–1.2 g per kg body weight per day, due to higher protein requirements in older adults [14,15]. We conducted a randomized controlled trial on the effects of dietary advice aimed at increasing protein intake to ≥1.2 g/kg adjusted body weight (aBW)/day in older adults with habitual low protein intake (i.e., <1.0 g/kg aBW/d) on physical functioning [16]. In a subgroup of trial participants, we evaluated the effects on oral health and the oral microbiota composition. We hypothesize that the increase in protein intake will improve oral health and alter the oral microbiota.
2. Materials and Methods
This study was part of the 6 month, multicenter, randomized controlled PROMISS trial, performed from November 2018 to July 2020 at the University of Helsinki, Finland, and the Vrije Universiteit Amsterdam, the Netherlands [16]. PROMISS’s main objective was examining the (cost-)effectiveness of personalized dietary advice aimed at increasing protein intake to 1.2 g/kg aBW/d during a 6-month period on changes in physical functioning in community-dwelling older adults with a habitual protein intake of <1.0 g/kg aBW/d [16]. The full PROMISS study protocol has been published elsewhere [16]. Moreover, the intervention’s effect on the gut microbiota and appetite has also been published in a prior ancillary study [17]. The present ancillary study evaluates the effect of the intervention on oral health and the oral microbiota composition. All participants provided written informed consent before enrolling in the trial. The trial was registered at ClinicalTrials.gov (NCT03712306). It was approved by both the Institutional Review Boards of the Amsterdam UMC, location VUMC in Amsterdam, the Netherlands (approval code: 2018.399, approval date: 5 June 2019), and by the University of Helsinki (approval code: HUS/1530/2018, approval date: 12 June 2019). It was conducted in accordance with the Declaration of Helsinki (version 2013).
2.1. Participants
As reported earlier [16,17], a total of 276 participants were included in the PROMISS main trial. Inclusion criteria for PROMISS were: age ≥ 65 years, community-dwelling, habitual protein intake <1.0 g/kg aBW/d, BMI ≥ 18.5 kg/m2 and ≤32.0 kg/m2, and ability to walk 400 m within 15 min without the use of a walker and with no rest >60 s. Participants were excluded if they adhered to a vegan diet, had severe food allergies, purposefully lost or gained >3 kg in past 3 months, had diagnosed severe kidney disease, type 1 diabetes or insulin dependent type 2 diabetes, an eating disorder, severe acute heart disease in the past 3 months, or poor cognitive status determined by a mini-mental state examination score ≤ 20 [18]. Additionally, participants were excluded from this ancillary microbiota study if they had inflammatory bowel disease, had been institutionalized (>4 weeks) in the past 3 months, or had used systemic antibiotics in the past 3 months.
PROMISS participants were randomized into 3 groups. One group received dietary advice aimed at increasing protein intake (n = 96). One group received dietary advice aimed at increasing protein intake and were advised to consume their protein in close proximity to physical exercise (n = 89). And one control group received no intervention (n = 91). Participants were stratified based on baseline habitual protein intake (<0.9 or 0.9–1.0 g/kg aBW/d) and sex. For the current microbiota ancillary study, only participants from the first intervention group and the control group were included. At first, only Dutch participants were included in the ancillary microbiota study. However, because of a slow inclusion rate, inclusion was later expanded to the Finnish PROMISS participants as well.
A total of 90 participants were included, 47 from the high protein group and 43 from the control group (Figure 1).
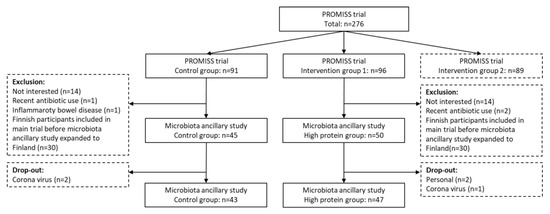
Figure 1.
Flowchart of inclusion of the PROMISS microbiota ancillary study.
2.2. Intervention
Assessment at the clinic took place at baseline, at 3-month follow-up, and at 6-month follow-up. The high protein group was provided with dietary advice orally and in writing. Patients received individualized advice tailored to their habitual dietary characteristics, body weight, and food preferences [16]. The advice aimed to increase protein intake to ≥1.2 g/kg aBW/d with at least one meal containing ≥35 g protein. We aimed to keep total daily energy intake stable.
Actual body weights were adjusted to the nearest weight that would place a participant in the healthy BMI range. This was performed for those with a BMI of <18.5 kg/m2 (age ≤ 70 years)/< 22.0 kg/m2 (age > 70 years) or a BMI of 25.0–32.0 kg/m2 (age ≤ 70 years)/27.0–32.0 kg/m2 (age > 70 years). This adjustment prevented the overestimation or underestimation of the participants’ protein requirements because of increased protein needs (in case of low body weight) or excessive adipose tissue (in case of high body weight). Food intake was measured using food-diary assisted 24-h dietary recalls at baseline and 3- and 6-month follow-up.
2.3. Oral Health and Bio-Sampling
Data on oral health were collected using a questionnaire, which inquired about the number of remaining teeth, the frequency of tooth brushing and interdental cleaning, and whether participants had experienced caries, bleeding gums, red or swollen gums, oral blisters or soars, toothache when consuming hot or warm drinks or when chewing, lost or loose or broken teeth, halitosis, or xerostomia in the previous 6 months [19].
Participants were asked not to brush their teeth on the day of oral sampling. Unstimulated salivary flow (g/5 min) was collected in 50 participants according to the method of Navazesh [20]. Data on the oral microbiota composition were collected through the 16S rRNA sequencing of a tongue swab samples. Duplicate tongue swab samples were collected by stroking the posterior tongue dorsum 4 times using a Copan eNAT swab (Copan Italia S.p.A., Bréscia, Italy). After collection, the tongue swabs were stored in eNAT RNA/DNA stabilizing and preservation medium. Tongue swabs were initially stored at −20 °C and moved to central storage at −80 °C once a week. Due to the COVID pandemic, not all 6-month follow-up visits could be performed at the research unit. Because of this, 20 participants in the Netherlands were visited at home for final measurements. In Finland, n = 16 participants were sent the questionnaires and materials for tongue swabs and were instructed to fill out the questionnaires and collect the tongue swab samples themselves. The tongue swabs were then kept in their home freezers at −20 °C until all swabs were collected from the participants’ houses and transported to central storage at −80 °C on dry ice. Dates and times of sampling and storage at −20 °C and −80 °C were noted for all samples.
2.4. 16S rRNA Sequencing
For the 16S rRNA amplicon sequencing of the V4 hypervariable region, previously described methods were used [21,22]. Each sample was PCR-amplified using 1 ng of template DNA with primers F515/R806, targeting the V4 hypervariable region of the 16S ribosomal gene [23]. A mixed pure culture isolates (mock), Blanco extraction controls, pooled salivary extraction controls, and pooled DNA amplification controls were included in each sample batch. The amount of DNA per sample was quantified using the Quant-iT™ PicoGreen® dsDNA Assay Kit (Thermo Fisher Scientific, Waltham, MA, USA). The amplicon libraries were pooled in equimolar amounts and purified using the IllustraTM GFXTM PCR DNA and Gel Band Purification Kit (GE Healthcare, Eindhoven, The Netherlands). Amplicon quality and size were analyzed on the Fragment Analyzer (Advanced Analytical). The paired-end sequencing of amplicons was conducted through five separate runs on the Illumina MiSeq platform (Illumina, Eindhoven, The Netherlands). The denoising of sequence data and the identification of amplicon sequence variants (ASVs) were performed using the DADA2 (1.12.1) pipeline [24]. The median sequencing depth was 69,250 reads. In total, 2482 ASVs were identified and were matched to existing species from the Human Oral Microbiome Database [25].
2.5. Statistics
For non-microbiota data, SPSS software version 22 (SPSS Inc., Chicago, IL, USA) was used. Student’s t-test, the Mann–Whitney U-test, and Fisher’s exact test were used to assess between-group baseline characteristics. As reported before [17], mixed effects models were used to test the intervention effect on macronutrient intake over time. Fixed effects were visit (time), group (high protein or control), and baseline values. A random intercept was included to account for repeated measures. If there was a significant difference between groups over time, linear regression analyses were used for the 3- and 6-month follow-ups separately, which was adjusted for baseline values. This was also performed in order to analyze salivary flow rate at the 6-month follow-up. Log transformation was applied in cases of non-parametric distributions skewed to the right. Between-group differences in oral health at the 6-month follow-up were tested with logistic regression adjusted for baseline oral health.
All statistical analyses of the microbiome were carried out using R (version 4.0.3) [26]. Figures were constructed using the ggplot2 package (version 3.2.1) [27]. For all microbiota analyses, except those on alpha-diversity, the microbiota data were filtered to include only those ASVs that contribute to the first 97.5% of all counts in the data, eliminating sparse, low count ASVs from the dataset. Inverse Simpson and Shannon alpha-diversities were calculated using the vegan package (version 2.5–3) [28]. This package was also used to perform multivariate analysis and ordinations, based on Bray–Curtis distances. The multivariate models fitted through PERMANOVA were tested via permutation analysis, using 103 permutations. Linear mixed models from the DESeq2 package (version 1.20.0) and the Dream package (version 1.23.0) were utilized, using the Variance Partition extension [29,30,31] to test for differentially abundant taxa. The Benjamini–Hochberg correction for multiple testing was applied. A p-value <0.05 was considered statistically significant.
3. Results
As reported before [17], the high protein and control groups in our microbiota subsample of PROMISS trial participants did not differ based on age, sex, MMSE-score, or level of education. Nor did they differ based on oral hygiene routines. All baseline characteristics are depicted in Table 1.

Table 1.
Baseline characteristics of microbiota subsamples.
3.1. Dietary Intake
There were no baseline between-group differences in energy and macronutrient intake (Table 1). In our subpopulation, participants from the high protein group increased their mean protein intake from 0.8 ± 0.2 g/kg aBW/d at baseline to 1.3 ± 0.3 g/kg aBW/d at 3-month follow-up and 1.2 ± 0.2 g/kg aBW/d at 6-month follow-up. In contrast, the average protein intake for the control group remained at 0.9 ± 0.2 g/kg aBW/d. These differences in protein intake were statistically significant based on linear mixed models (p < 0.0001) and linear regression analysis for each time point (B = 0.4, p < 0.001; B = 0.3, p < 0.001, for the 3- and 6-month follow-ups, respectively) [17]. Daily energy intake also differed between groups over time: 1873.9 ± 454.2 kcal/d and 1836.1 ± 382.9 kcal/d at 3- and 6-month follow-ups in the high protein group, compared to 1679.2 ± 429.8 kcal/d and 1699.2 ± 341.6 kcal/d at 3- and 6-month follow-ups in the control group (p = 0.0008). This was also true for carbohydrate intake: 187.7 ± 51.0 g/d and 185.0 ± 48.9 g/d at 3- and 6-month follow-ups in the high protein group versus 177.0 ± 54.6 g/d and 174.2 ± 47.7 g/d at 3- and 6-month follow-ups in the control group (p = 0.0367). However, using linear regression models, no significant differences were found in either energy intake or carbohydrate intake for each time point separately. Fat intake remained unaffected by the intervention. The results of the analyses on dietary intake are described more elaborately elsewhere [17].
3.2. Oral Health
There were no baseline differences in dentition, frequency of tooth brushing, or frequency of interdental cleaning (use of floss, toothpicks, or interdental brushes) (Table 1). The intervention did not decrease the frequency with which participants reported caries; bleeding gums; red or swollen gums; blisters or soars; tooth ache when drinking hot or cold drinks or when chewing; lost, loose, or broken teeth; halitosis; or xerostomia at the 6-month follow-up (Table 2). It also did not affect salivary flow rate (B = 1.2, p = 0.165).
Table 2.
Intervention effect on self-reported oral health.
3.3. Oral Microbiota
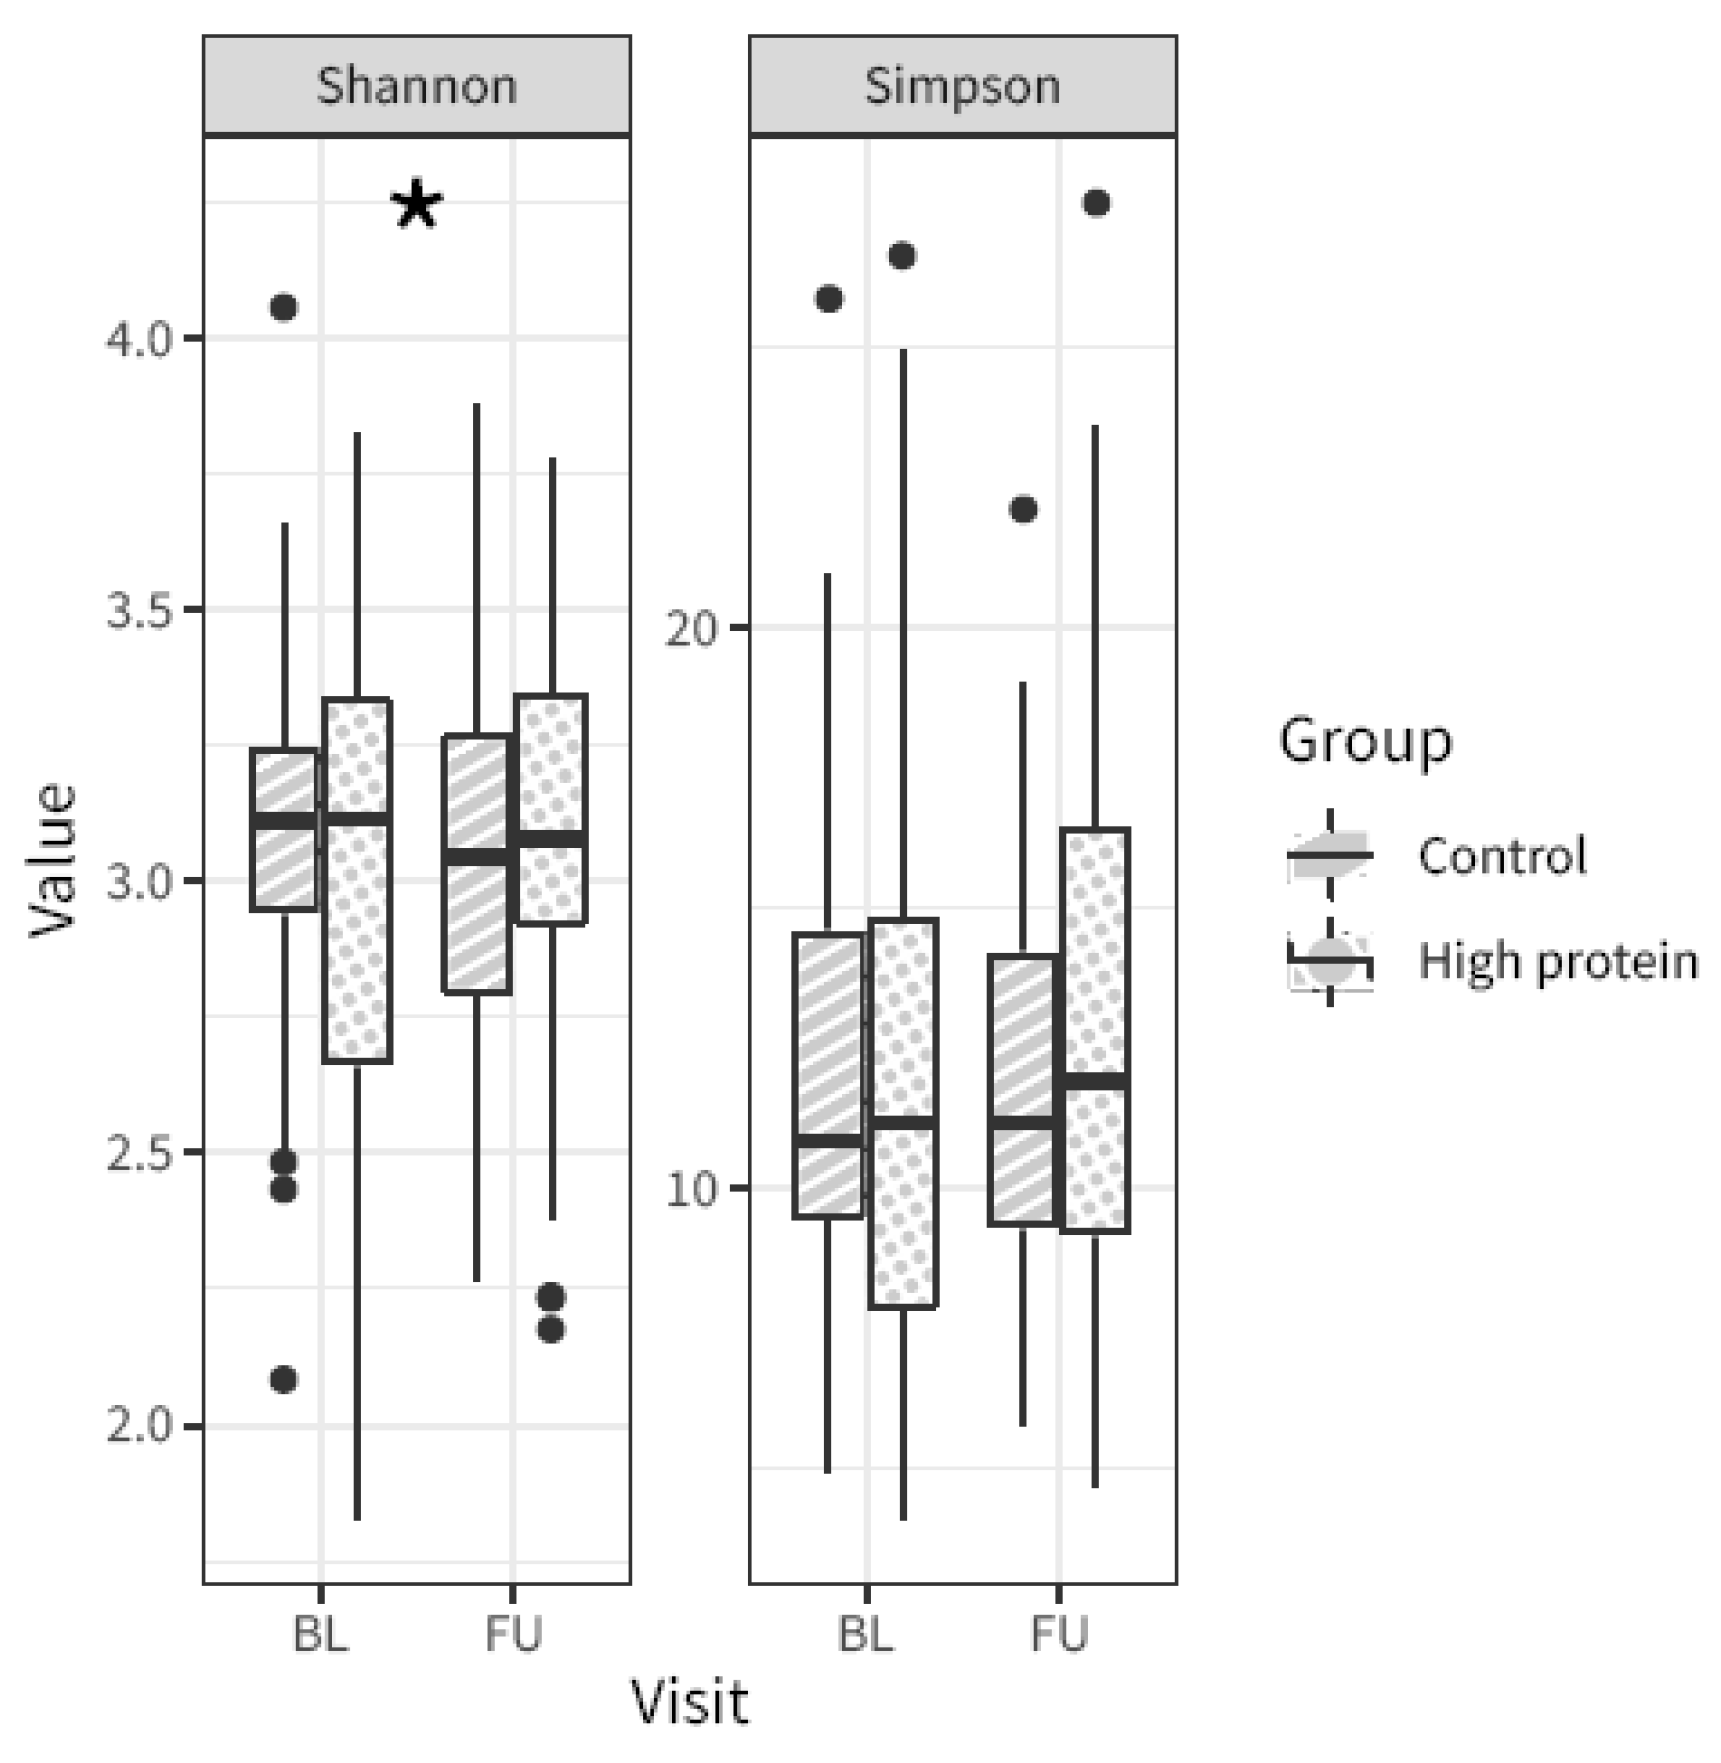
Alpha-diversity (i.e., the microbial diversity of a sample) was calculated using the Shannon and Simpson indices. The Shannon alpha diversity index showed a slight, albeit significant difference in change from baseline to follow-up between the high protein and control group (linear mixed model visit × intervention for the Shannon and Simpson alpha diversity measures p = 0.015 and 0.133, respectively). In particular, the control group showed a slight decrease in alpha-diversity from baseline to follow-up, whereas the high protein group stayed unchanged. There was no difference in the Simpson index (Figure 2).

Figure 2.
Microbiota alpha-diversity from baseline (BL) to follow-up (FU) in the high protein compared to control group, based on the Shannon index and the Simpson index. Asterisk indicates p-value linear mixed model visit × intervention < 0.05. Boxplot center lines indicate median, boxes indicate interquartile ranges, whiskers indicate 1.5× the interquartile ranges and black dots indicate outliers.
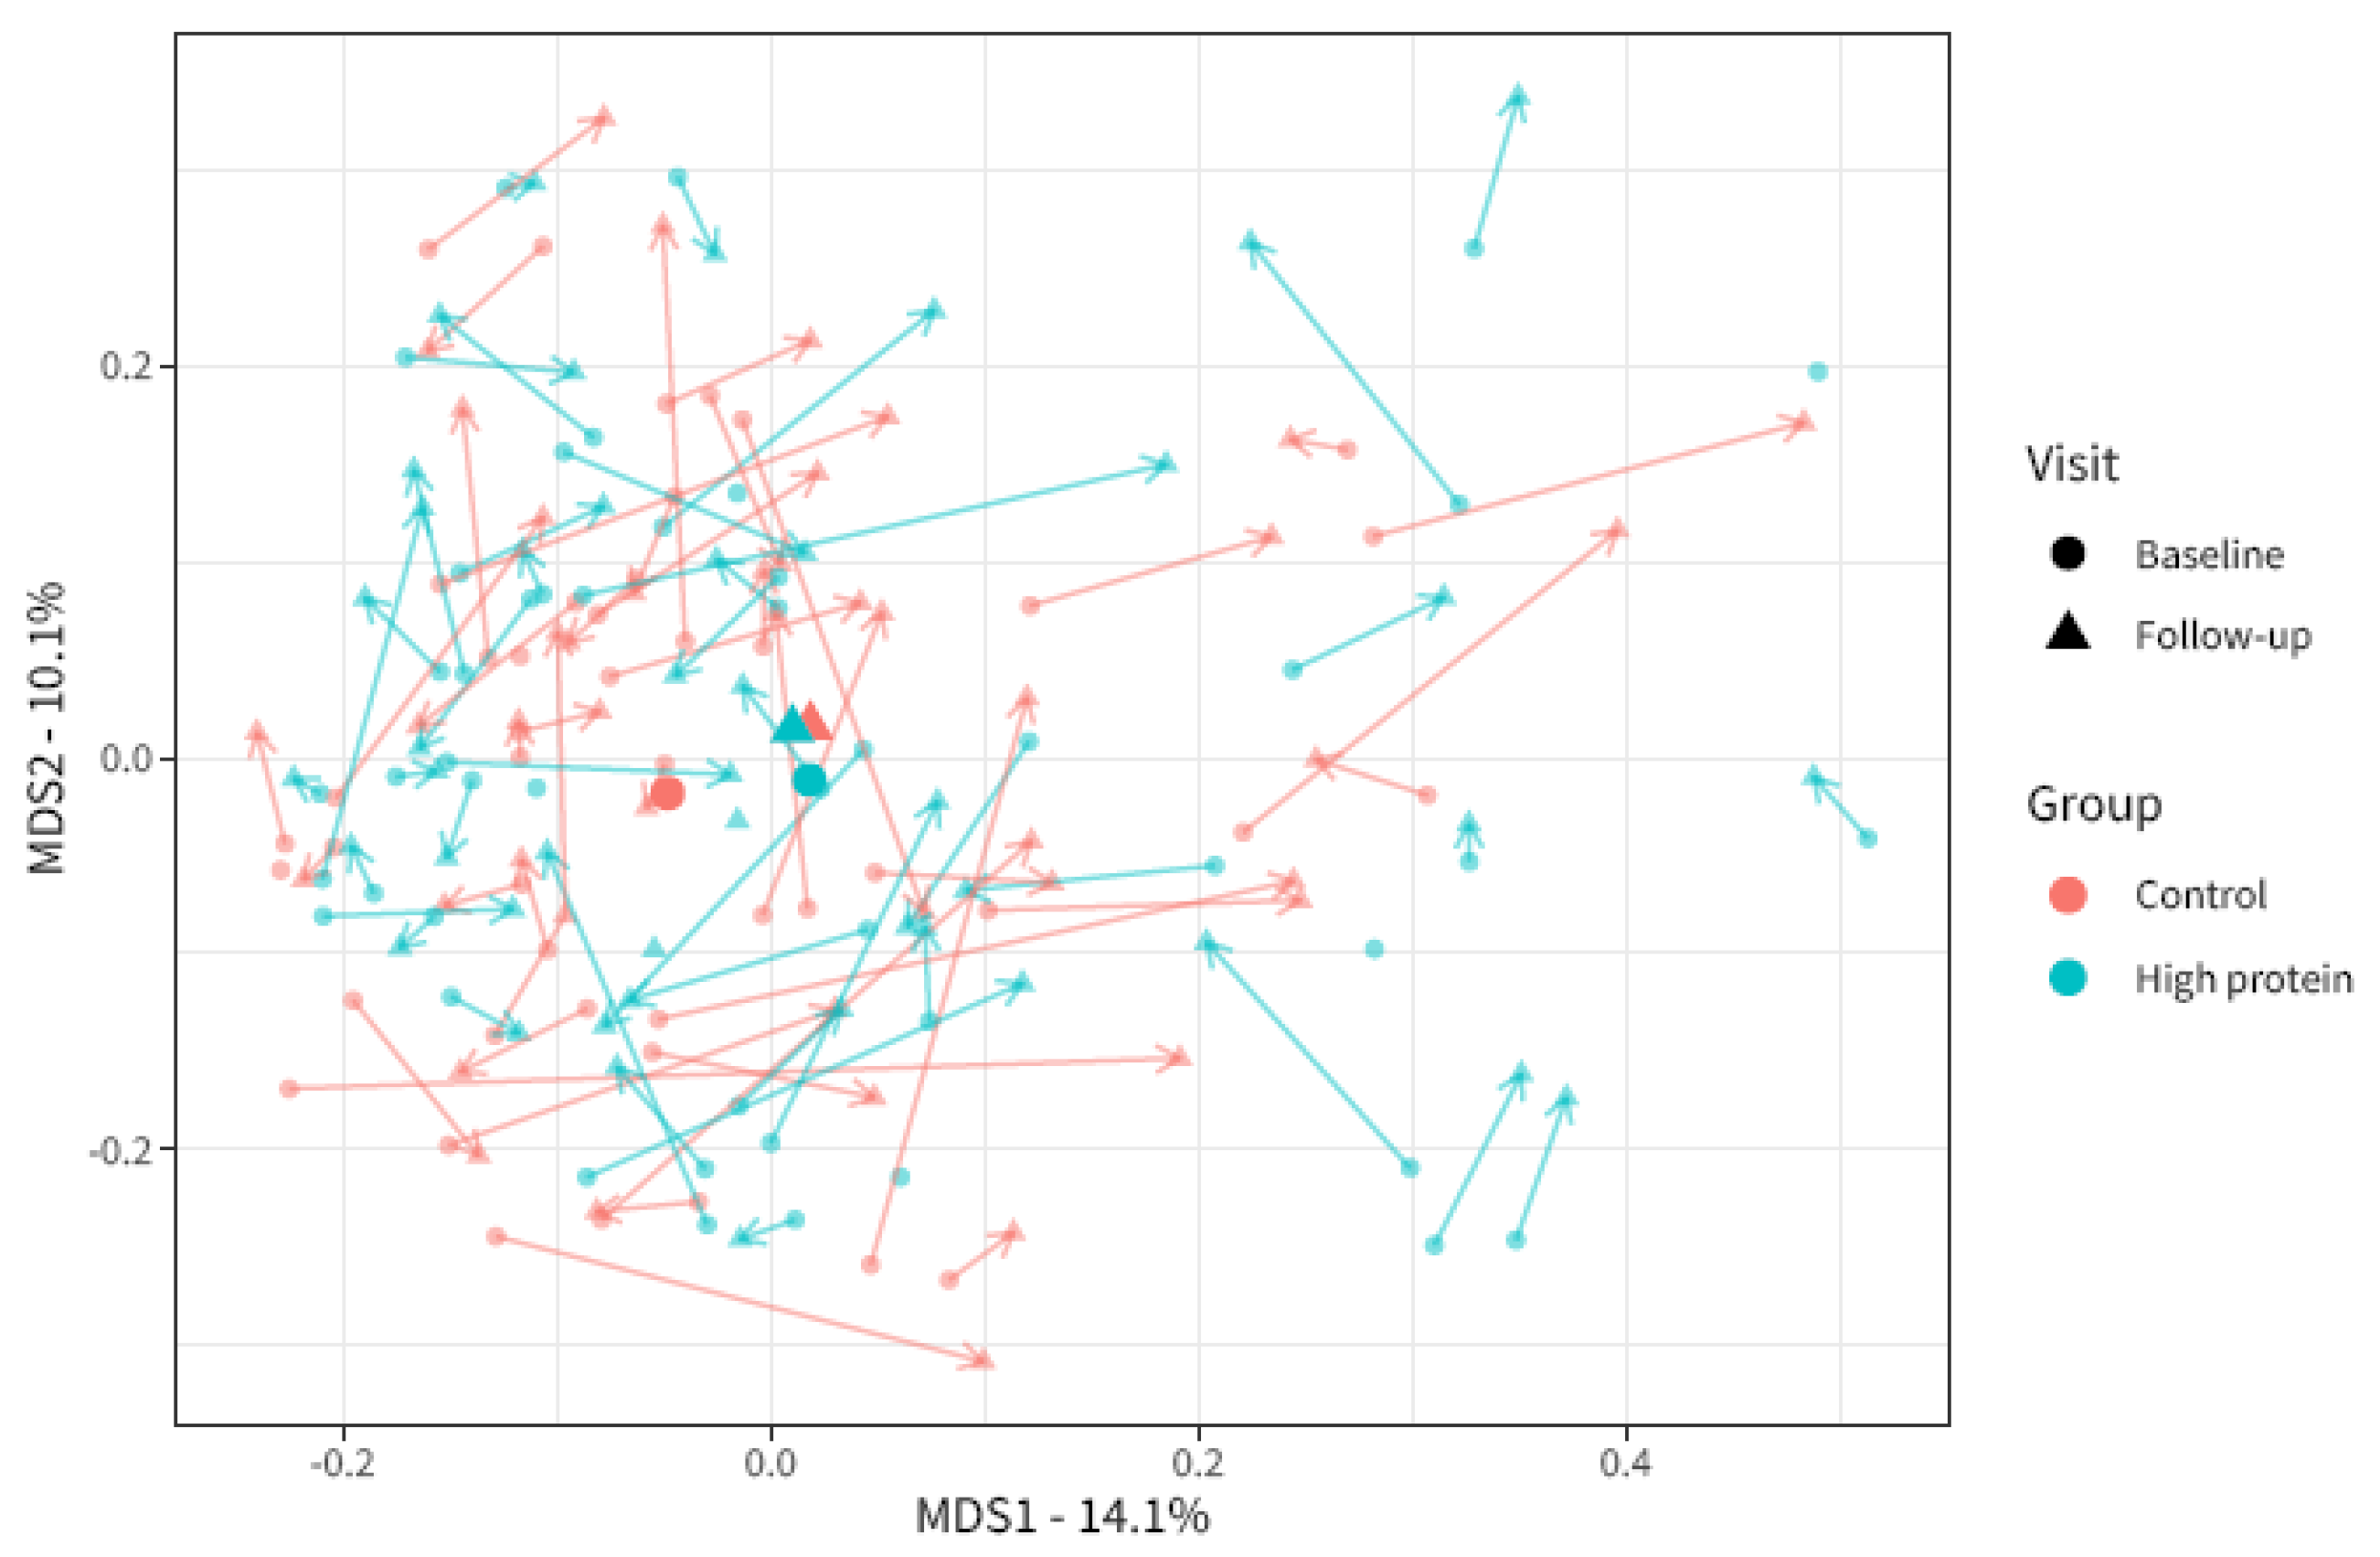
Beta-diversity (i.e., the microbial dissimilarity between samples) was assessed using the Bray–Curtis dissimilarity measure. This was used to evaluate the overall microbial compositional differences between groups. Bray–Curtis dissimilarity changed significantly from baseline to follow-up in the high protein group compared to the control group (Figure 3, PERMANOVA analyses visit × intervention R2 = 0.004, p = 0.013). In other words, the increased protein intake caused a slight shift in the overall microbial community composition compared to control. However, we were not able to identify any individual microbial taxa that were specifically affected by the intervention.
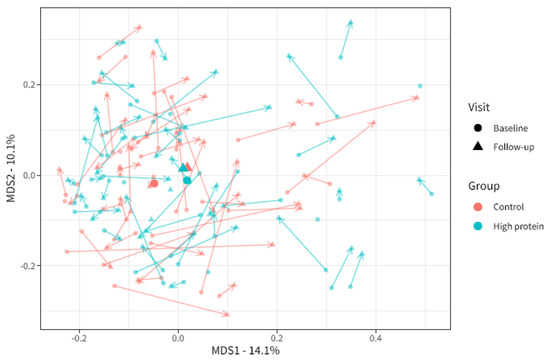
Figure 3.
Multi-dimensional scaling plot of microbiota beta-diversity based on Bray–Curtis dissimilarity for baseline and follow-up visits in the high protein and control groups. Each point indicates one sample from one participant. The larger points depict the centroids. The axis depicts 14.1% and 10.1% of variation in Bray–Curtis dissimilarity in the study population. The closer the points to each other, the more similar the microbial composition. Baseline (BL) and follow-up (FU) samples from the same participants are linked by arrows.
4. Discussion
Our study demonstrates that increasing protein intake from an average of 0.8 g/kg aBW/d to 1.2 g/kg aBW/d does not affect self-reported oral health status in older adults. Moreover, whereas moderate effects were observed on the overall microbiota composition based on alpha- and beta-diversity measures, no individual bacterial taxa were found to be specifically affected.
To our knowledge, we were the first to study the effects of increasing protein intake on either oral health or the oral microbiota composition in older adults. Although protein deficiencies have previously been suggested to negatively impact oral health [1,10,12], increasing protein intake did not improve self-reported oral health in our study. Importantly, even though our participants had low protein intake at baseline, they were not necessarily protein deficient. Possibly, the oral health benefits of increasing dietary protein only occur in cases of more severe protein deficiency. Moreover, our mean increase in protein intake may have been too modest, and the six-month follow-up period too short for our intervention to effectuate a detectable change in some aspects of oral health.
As for the effect of protein intake on the oral microbiota, some studies have demonstrated periodontitis-associated bacterial communities to display the elevated expression of proteolytic genes [32]. This raises the concern that increasing protein intake may increase the substrate for these dysbiotic communities and promote their growth. However, this concern is not substantiated by our results as no specific species were affected by the intervention. Contrary to our results, Cattaneo et al. [11] showed that several bacterial taxa from the tongue dorsum were associated with protein intake, suggesting that altering protein intake could potentially affect these taxa. There are several explanations as to why we could not demonstrate this. First, the associations found by Cattaneo et al. were cross-sectional, based on pre-existing dietary patterns in young adults. The dietary patterns in these participants may have been shaping their oral microbiota for many years. In contrast, our dietary intervention was implemented for 6 months, prior to which our groups had similar intakes of protein and other macronutrients. Second, compared to other body sites, oral microbiota display high levels of intra-individual (alpha) diversity and temporal stability [33,34]. As a result, the oral microbiota may be resilient to dietary interventions.
Strengths and Limitations
To ensure adherence and an accurate increase in protein intake, nutritionists tailored their dietary advice to suit each participant’s personal eating behaviors and preferences. Moreover, throughout the study, participants provided the nutritionists with feedback on the feasibility of their protein-enriched diets, allowing the nutritionists to adjust their dietary advice accordingly. Indeed, the advice succeeded in increasing the average protein intake to 1.2 g/kg aBW/d. Even though the increase in protein intake may have been too moderate to influence oral health or the oral microbiota in a meaningful way, the intervention was in line with the increased recommended daily allowance for protein intake in older adults suggested by expert groups [14,15]. An important limitation is that oral health was assessed by means of questionnaires, rather than oral examination. Possibly, the protein-effect on oral health was not reflected by an altered frequency of self-reported oral discomfort but could have been observed by oral exams. However, self-perceived oral health and clinically determined oral health were previously found to be closely associated [35,36]. Second, microbiota composition was only sampled on the tongue, whereas this constitutes only one of several microbial niches within the oral cavity, each with its own distinct bacterial community [33]. Our protein intervention did not affect the specific taxa of the tongue microbiota but may have affected taxa from other oral niches, such as dental plaque. However, obtaining a standardized plaque sample in older adults is difficult due to the prevalent use of dentures. Additionally, in a previous study, the tongue microbiota were found to be relevant to oral health in community-dwelling older adults [37].
5. Conclusions
Here, we demonstrate that dietary advice aimed at increasing protein intake to at least 1.2 g/kg aBW/d in older adults with habitual low protein intake did not significantly improve self-reported oral health. Although our intervention moderately affected overall microbiota composition (expressed in alpha- and beta-diversity measures), no individual taxa were significantly increased or decreased. A future study implementing a more drastic or more prolonged increase in dietary protein in older adults with more severe protein deficiencies may show a more pronounced effect on oral health or the oral microbiota.
Author Contributions
K.S.F., I.R., H.A.H.W., R.G.I., M.V., M.N. and B.J.F.K. were involved in designing the research. K.S.F., I.R. and H.A.H.W. conducted the research. M.V. and B.J.F.K. provided essential materials. K.S.F., T.v.d.B., R.G.I. and B.J.F.K. were involved in statistical analysis. K.S.F. wrote the paper. All authors have read and agreed to the published version of the manuscript.
Funding
This study was supported by the European Union Horizon 2020 PROMISS project ‘PRevention of Malnutrition in Senior Subjects in the EU’ (grant agreement no. 678732). The content only reflects the author’s view, and the Commission is not responsible for any use that may be made of the information it contains. MN is supported by a personal ZONMW-VIDI grant 2013 (016.146.327), a personal ZONMW-VICI grant 2020 (09150182010020), a Dutch Heart Foundation CVON IN CONTROL Young Talent Grant 2013, and a Transatlantic Networks of Excellence Award from the Leducq Foundation (17CVD01) and from JPI (a healthy diet for a healthy life; 2017-01996_3).
Institutional Review Board Statement
Written informed consent was obtained from all participants prior to study enrollment. The PROMISS trial was registered at ClinicalTrials.gov (NCT03712306) and was approved by both the Institutional Review Boards of the Amsterdam UMC, location VUMC in Amsterdam, the Netherlands (approval code: 2018.399), and by the University of Helsinki (approval code: HUS/1530/2018). It was conducted in accordance with the Declaration of Helsinki (version 2013).
Informed Consent Statement
Informed consent was obtained from all subjects involved in the study.
Data Availability Statement
These clinical trial data can be requested by any qualified researcher who engage in rigorous, independent scientific research, and will be provided upon reasonable request by the corresponding author. The 16S rRNA sequencing data have been deposited in the NCBI Sequence Read Archive (SRA) under accession number PRJNA1029554.
Conflicts of Interest
The authors declare no conflict of interest.
References
- Gondivkar, S.M.; Gadbail, A.R.; Gondivkar, R.S.; Sarode, S.C.; Sarode, G.S.; Patil, S.; Awan, K.H. Nutrition and oral health. Dis. Mon. 2019, 65, 147–154. [Google Scholar] [CrossRef] [PubMed]
- Leij-Halfwerk, S.; Verwijs, M.H.; van Houdt, S.; Borkent, J.W.; Guaitoli, P.R.; Pelgrim, T.; Heymans, M.W.; Power, L.; Visser, M.; Corish, C.A.; et al. Prevalence of protein-energy malnutrition risk in European older adults in community, residential and hospital settings, according to 22 malnutrition screening tools validated for use in adults ≥65 years: A systematic review and meta-analysis. Maturitas 2019, 126, 80–89. [Google Scholar] [CrossRef] [PubMed]
- Gil-Montoya, J.A.; de Mello, A.L.; Barrios, R.; Gonzalez-Moles, M.A.; Bravo, M. Oral health in the elderly patient and its impact on general well-being: A nonsystematic review. Clin. Interv. Aging 2015, 10, 461–467. [Google Scholar] [CrossRef] [PubMed]
- Zhang, Y.; Wang, X.; Li, H.; Ni, C.; Du, Z.; Yan, F. Human oral microbiota and its modulation for oral health. Biomed. Pharmacother. 2018, 99, 883–893. [Google Scholar] [CrossRef] [PubMed]
- Marshall, T.A.; Warren, J.J.; Hand, J.S.; Xie, X.J.; Stumbo, P.J. Oral health, nutrient intake and dietary quality in the very old. J. Am. Dent. Assoc. 2002, 133, 1369–1379. [Google Scholar] [CrossRef] [PubMed]
- Kim, E.J.; Jin, B.H. Comparison of oral health status and daily nutrient intake between elders who live alone and elders who live with family: Based on the Korean National Health and Nutrition Examination Survey (KNHANES VI) (2013–2015). Gerodontology 2018, 35, 129–138. [Google Scholar] [CrossRef] [PubMed]
- Iwasaki, M.; Taylor, G.W.; Manz, M.C.; Yoshihara, A.; Sato, M.; Muramatsu, K.; Watanabe, R.; Miyazaki, H. Oral health status: Relationship to nutrient and food intake among 80-year-old Japanese adults. Community Dent. Oral. Epidemiol. 2014, 42, 441–450. [Google Scholar] [CrossRef]
- Bomfim, R.A.; de Souza, L.B.; Corrente, J.E. Tooth loss and its relationship with protein intake by elderly Brazilians-A structural equation modelling approach. Gerodontology 2018, 35, 51–58. [Google Scholar] [CrossRef]
- Wysokinski, A.; Sobow, T.; Kloszewska, I.; Kostka, T. Mechanisms of the anorexia of aging—A review. Age 2015, 37, 9821. [Google Scholar] [CrossRef]
- Pflipsen, M.; Zenchenko, Y. Nutrition for oral health and oral manifestations of poor nutrition and unhealthy habits. Gen. Dent. 2017, 65, 36–43. [Google Scholar]
- Cattaneo, C.; Riso, P.; Laureati, M.; Gargari, G.; Pagliarini, E. Exploring Associations between Interindividual Differences in Taste Perception, Oral Microbiota Composition, and Reported Food Intake. Nutrients 2019, 11, 1167. [Google Scholar] [CrossRef] [PubMed]
- Moynihan, P.; Petersen, P.E. Diet, nutrition and the prevention of dental diseases. Public. Health Nutr. 2004, 7, 201–226. [Google Scholar] [CrossRef] [PubMed]
- EFSA. Scientific Opinion on Dietary Reference Values for protein. EFSA Panel on Dietetic Products, Nutrition and Allergies (NDA). EFSA J. 2012, 10, 2257. [Google Scholar]
- Bauer, J.; Biolo, G.; Cederholm, T.; Cesari, M.; Cruz-Jentoft, A.J.; Morley, J.E.; Phillips, S.; Sieber, C.; Stehle, P.; Teta, D.; et al. Evidence-based recommendations for optimal dietary protein intake in older people: A position paper from the PROT-AGE Study Group. J. Am. Med. Dir. Assoc. 2013, 14, 542–559. [Google Scholar] [CrossRef] [PubMed]
- Deutz, N.E.; Bauer, J.M.; Barazzoni, R.; Biolo, G.; Boirie, Y.; Bosy-Westphal, A.; Cederholm, T.; Cruz-Jentoft, A.; Krznariç, Z.; Nair, K.S.; et al. Protein intake and exercise for optimal muscle function with aging: Recommendations from the ESPEN Expert Group. Clin. Nutr. 2014, 33, 929–936. [Google Scholar] [CrossRef] [PubMed]
- Reinders, I.; Wijnhoven, H.A.H.; Jyvakorpi, S.K.; Suominen, M.H.; Niskanen, R.; Bosmans, J.E.; Brouwer, I.A.; Fluitman, K.S.; Klein, M.C.; Kuijper, L.D.; et al. Effectiveness and cost-effectiveness of personalised dietary advice aiming at increasing protein intake on physical functioning in community-dwelling older adults with lower habitual protein intake: Rationale and design of the PROMISS randomised controlled trial. BMJ Open 2020, 10, e040637. [Google Scholar] [PubMed]
- Fluitman, K.S.; Wijdeveld, M.; Davids, M.; van Ruiten, C.C.; Reinders, I.; Wijnhoven, H.A.H.; Keijser, B.J.; Visser, M.; Nieuwdorp, M.; IJzerman, R.G. Personalized Dietary Advice to Increase Protein Intake in Older Adults Does Not Affect the Gut Microbiota, Appetite or Central Processing of Food Stimuli in Community-Dwelling Older Adults: A Six-Month Randomized Controlled Trial. Nutrients 2023, 15, 332. [Google Scholar] [CrossRef]
- Folstein, M.F.; Folstein, S.E.; McHugh, P.R. “Mini-mental state” A practical method for grading the cognitive state of patients for the clinician. J. Psychiatr. Res. 1975, 12, 189–198. [Google Scholar] [CrossRef]
- Kiesswetter, E.; Hengeveld, L.M.; Keijser, B.J.F.; Volkert, D.; Visser, M. Oral health determinants of incident malnutrition in community-dwelling older adults. J. Dent. 2019, 85, 73–80. [Google Scholar] [CrossRef]
- Navazesh, M. Methods for collecting saliva. Ann. N. Y Acad. Sci. 1993, 694, 72–77. [Google Scholar] [CrossRef]
- Keijser, B.J.F.; Agamennone, V.; van den Broek, T.J.; Caspers, M.; van de Braak, A.; Bomers, R.; Havekes, M.; Schoen, E.; van Baak, M.; Mioch, D.; et al. Dose-dependent impact of oxytetracycline on the veal calf microbiome and resistome. BMC Genom. 2019, 20, 65. [Google Scholar] [CrossRef] [PubMed]
- Fluitman, K.S.; van den Broek, T.J.; Nieuwdorp, M.; Visser, M.; IJzerman, R.G.; Keijser, B.J.F. Associations of the oral microbiota and Candida with taste, smell, appetite and undernutrition in older adults. Sci. Rep. 2021, 11, 23254. [Google Scholar] [CrossRef]
- Caporaso, J.G.; Lauber, C.L.; Walters, W.A.; Berg-Lyons, D.; Lozupone, C.A.; Turnbaugh, P.J.; Fierer, N.; Knight, R. Global patterns of 16S rRNA diversity at a depth of millions of sequences per sample. Proc. Natl. Acad. Sci. USA 2011, 108, 4516–4522. [Google Scholar] [CrossRef] [PubMed]
- Callahan, B.J.; McMurdie, P.J.; Rosen, M.J.; Han, A.W.; Johnson, A.J.; Holmes, S.P. DADA2: High-resolution sample inference from Illumina amplicon data. Nat. Methods 2016, 13, 581–583. [Google Scholar] [CrossRef] [PubMed]
- Dewhirst, F.E.; Chen, T.; Izard, J.; Paster, B.J.; Tanner, A.C.; Yu, W.H.; Lakshmanan, A.; Wade, W.G. The human oral microbiome. J. Bacteriol. 2010, 192, 5002–5017. [Google Scholar] [CrossRef] [PubMed]
- R Core Team. R: A Language and Environment for Statistical Computing; R Core Team: Vienna, Austria, 2018. [Google Scholar]
- Wickham, H. Elegant Graphics for Data Analysis; Springer: New York, NY, USA, 2016. [Google Scholar]
- Oksanen, J.; Blanchet, F.G.; Friendly, M.; Kindt, R.; Legendre, P.; Minchin, P.R.; O’Hara, R.B.; Solymos, P.; Stevens, M.H.H.; Szoecs, E.; et al. Vegan: Community Ecology Package. R package. 2018. Available online: https://cran.r-project.org/package=vegan (accessed on 7 September 2023).
- Love, M.I.; Huber, W.; Anders, S. Moderated estimation of fold change and dispersion for RNA-seq data with DESeq2. Genome Biol. 2014, 15, 550. [Google Scholar] [CrossRef] [PubMed]
- Hoffman, G.E.; Roussos, P. Dream: Powerful differential expression analysis for repeated measures designs. Bioinformatics 2021, 37, 192–201. [Google Scholar] [CrossRef] [PubMed]
- Hoffman, G.E.; Schadt, E.E. variancePartition: Interpreting drivers of variation in complex gene expression studies. BMC Bioinform. 2016, 17, 483. [Google Scholar] [CrossRef]
- Lamont, R.J.; Koo, H.; Hajishengallis, G. The oral microbiota: Dynamic communities and host interactions. Nat. Rev. Microbiol. 2018, 16, 745–759. [Google Scholar] [CrossRef]
- Hall, M.W.; Singh, N.; Ng, K.F.; Lam, D.K.; Goldberg, M.B.; Tenenbaum, H.C.; Neufeld, J.D.; Beiko, R.G.; Senadheera, D.B. Inter-personal diversity and temporal dynamics of dental, tongue, and salivary microbiota in the healthy oral cavity. NPJ Biofilms Microbiomes 2017, 3, 2. [Google Scholar] [CrossRef]
- Zhou, Y.; Gao, H.; Mihindukulasuriya, K.A.; La Rosa, P.S.; Wylie, K.M.; Vishnivetskaya, T.; Podar, M.; Warner, B.; Tarr, P.I.; Nelson, D.E.; et al. Biogeography of the ecosystems of the healthy human body. Genome Biol. 2013, 14, R1. [Google Scholar] [CrossRef]
- Kim, S.Y.; Kim, J.E.; Kim, H.N.; Jun, E.J.; Lee, J.H.; Kim, J.S.; Kim, J.B. Association of Self-Perceived Oral Health and Function with Clinically Determined Oral Health Status among Adults Aged 35(-)54 Years: A Cross-Sectional Study. Int. J. Environ. Res. Public Health 2018, 15, 1681. [Google Scholar] [CrossRef]
- Douglass, C.W.; Berlin, J.; Tennstedt, S. The validity of self-reported oral health status in the elderly. J. Public Health Dent. 1991, 51, 220–222. [Google Scholar] [CrossRef]
- Asakawa, M.; Takeshita, T.; Furuta, M.; Kageyama, S.; Takeuchi, K.; Hata, J.; Ninomiya, T.; Yamashita, Y. Tongue Microbiota and Oral Health Status in Community-Dwelling Elderly Adults. mSphere 2018, 3, 10–1128. [Google Scholar] [CrossRef]
Disclaimer/Publisher’s Note: The statements, opinions and data contained in all publications are solely those of the individual author(s) and contributor(s) and not of MDPI and/or the editor(s). MDPI and/or the editor(s) disclaim responsibility for any injury to people or property resulting from any ideas, methods, instructions or products referred to in the content. |
© 2023 by the authors. Licensee MDPI, Basel, Switzerland. This article is an open access article distributed under the terms and conditions of the Creative Commons Attribution (CC BY) license (https://creativecommons.org/licenses/by/4.0/).