

Consumption of Extruded Sorghum SC319 Improved Gut Microbiota at Genus Level and Reduced Anthropometric Markers in Men with Overweight: A Randomized Controlled Clinical Trial

 , ,
, ,  , ,
, ,
Abstract
:1. Introduction
2. Materials and Methods
2.1. Raw Materials and Processing
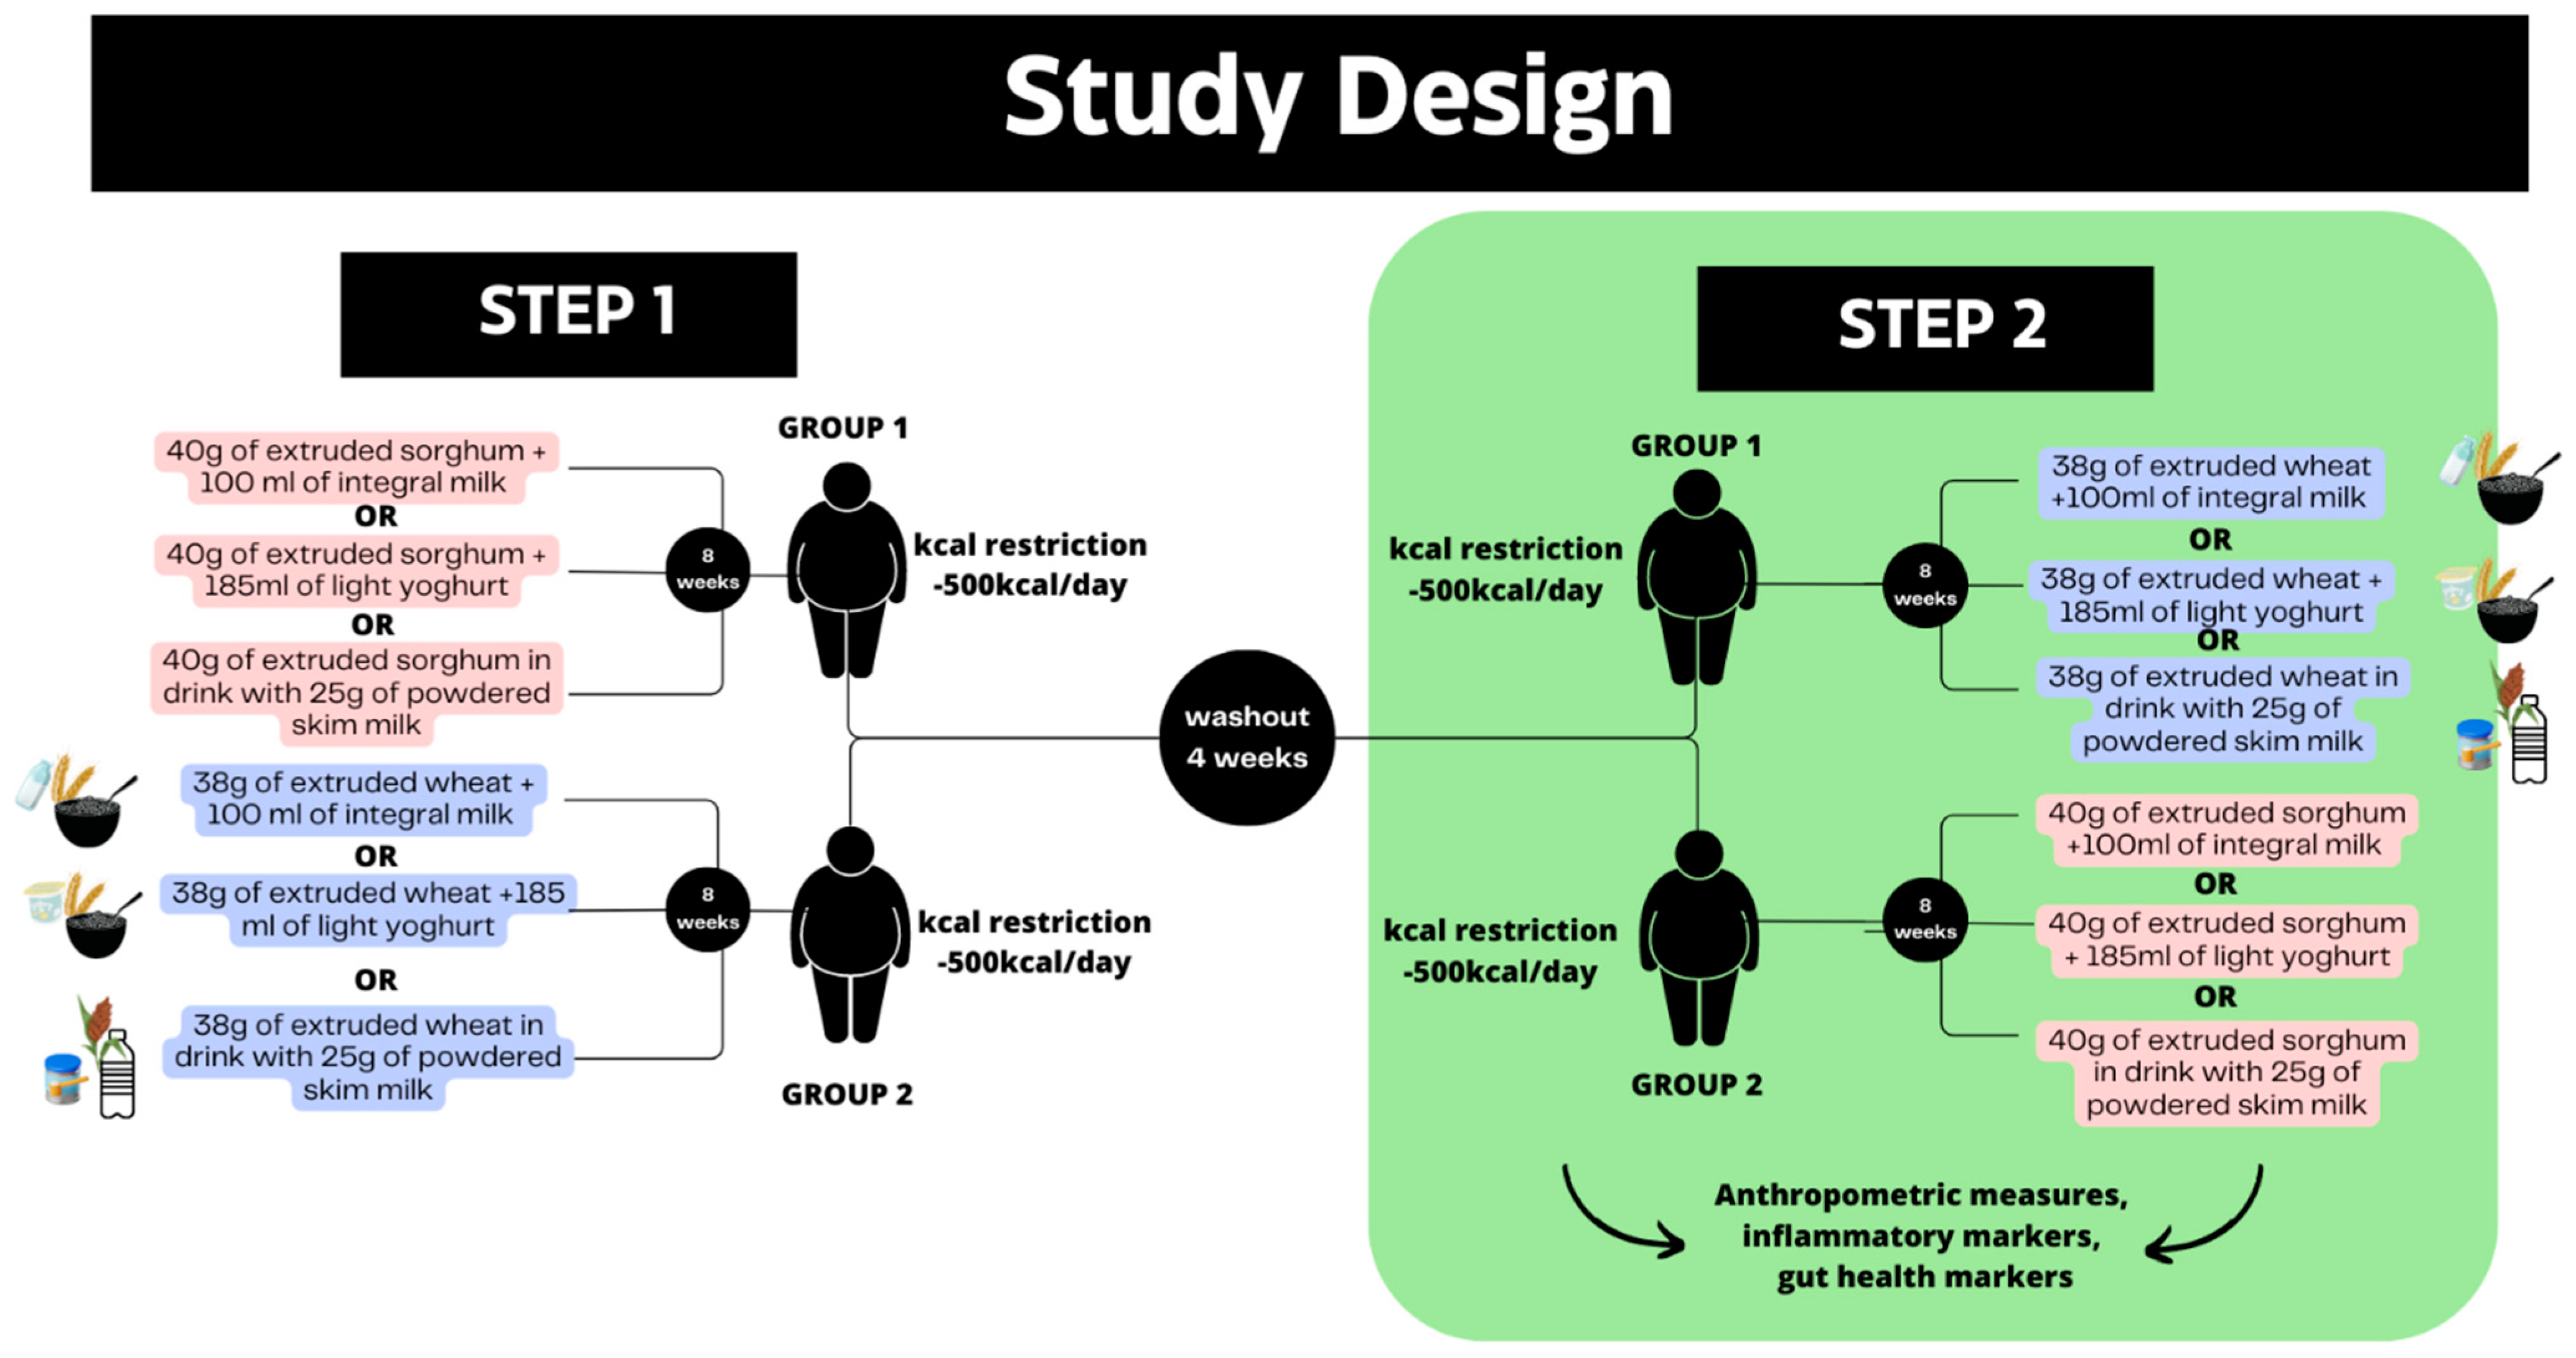
2.2. Trial Design
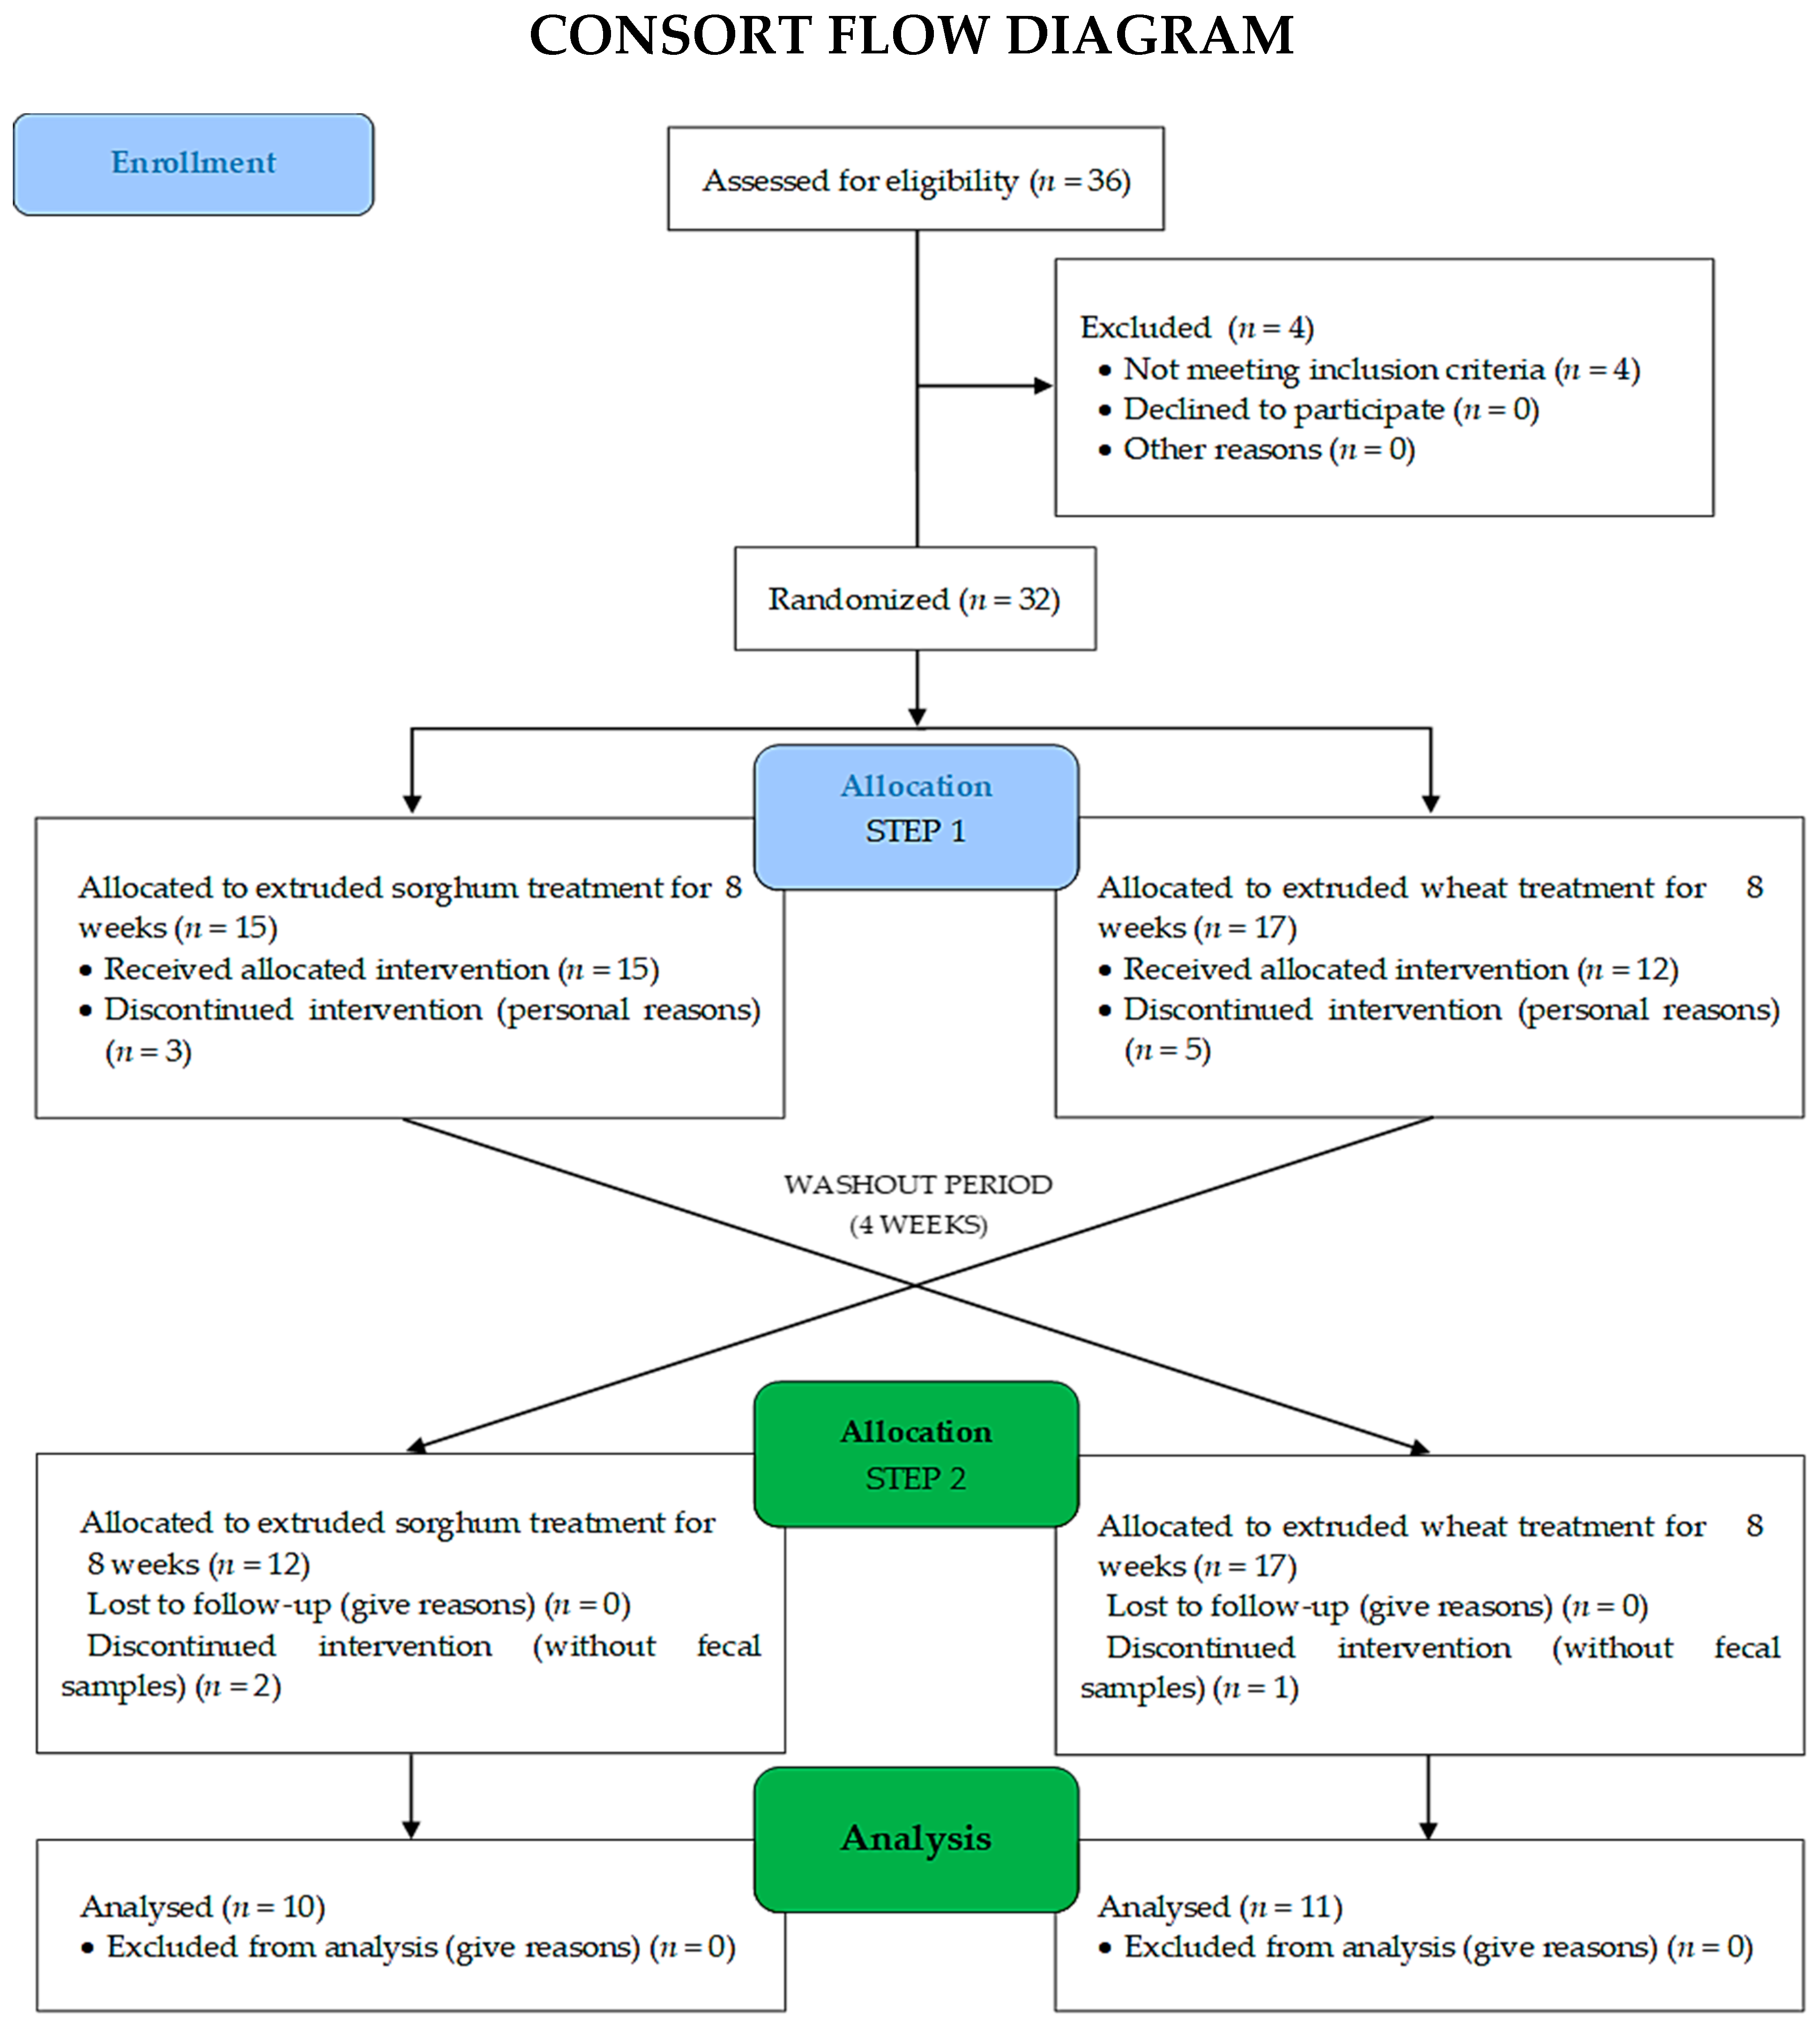
2.3. Participants
2.4. Interventions and Test Meals
2.5. Outcomes
2.6. Randomization, Allocation, and Sample Power
2.7. Assessment of Anthropometry and Body Composition Markers
2.8. Inflammatory Markers
2.9. Fecal Samples
2.10. Fecal pH
2.11. Organic Acid Analysis
2.12. Fecal Sample DNA Extraction
2.13. Quantitative Real-Time Polymerase Chain Reaction (qPCR) Analysis of Gut Microbiota DNA Concentration
2.14. Analysis of Gut Microbiota
2.15. Statistical Analysis
3. Results
3.1. Anthropometric Measures and Inflammatory Markers
3.2. SCFA Synthesis and Gut Microbiota PCR
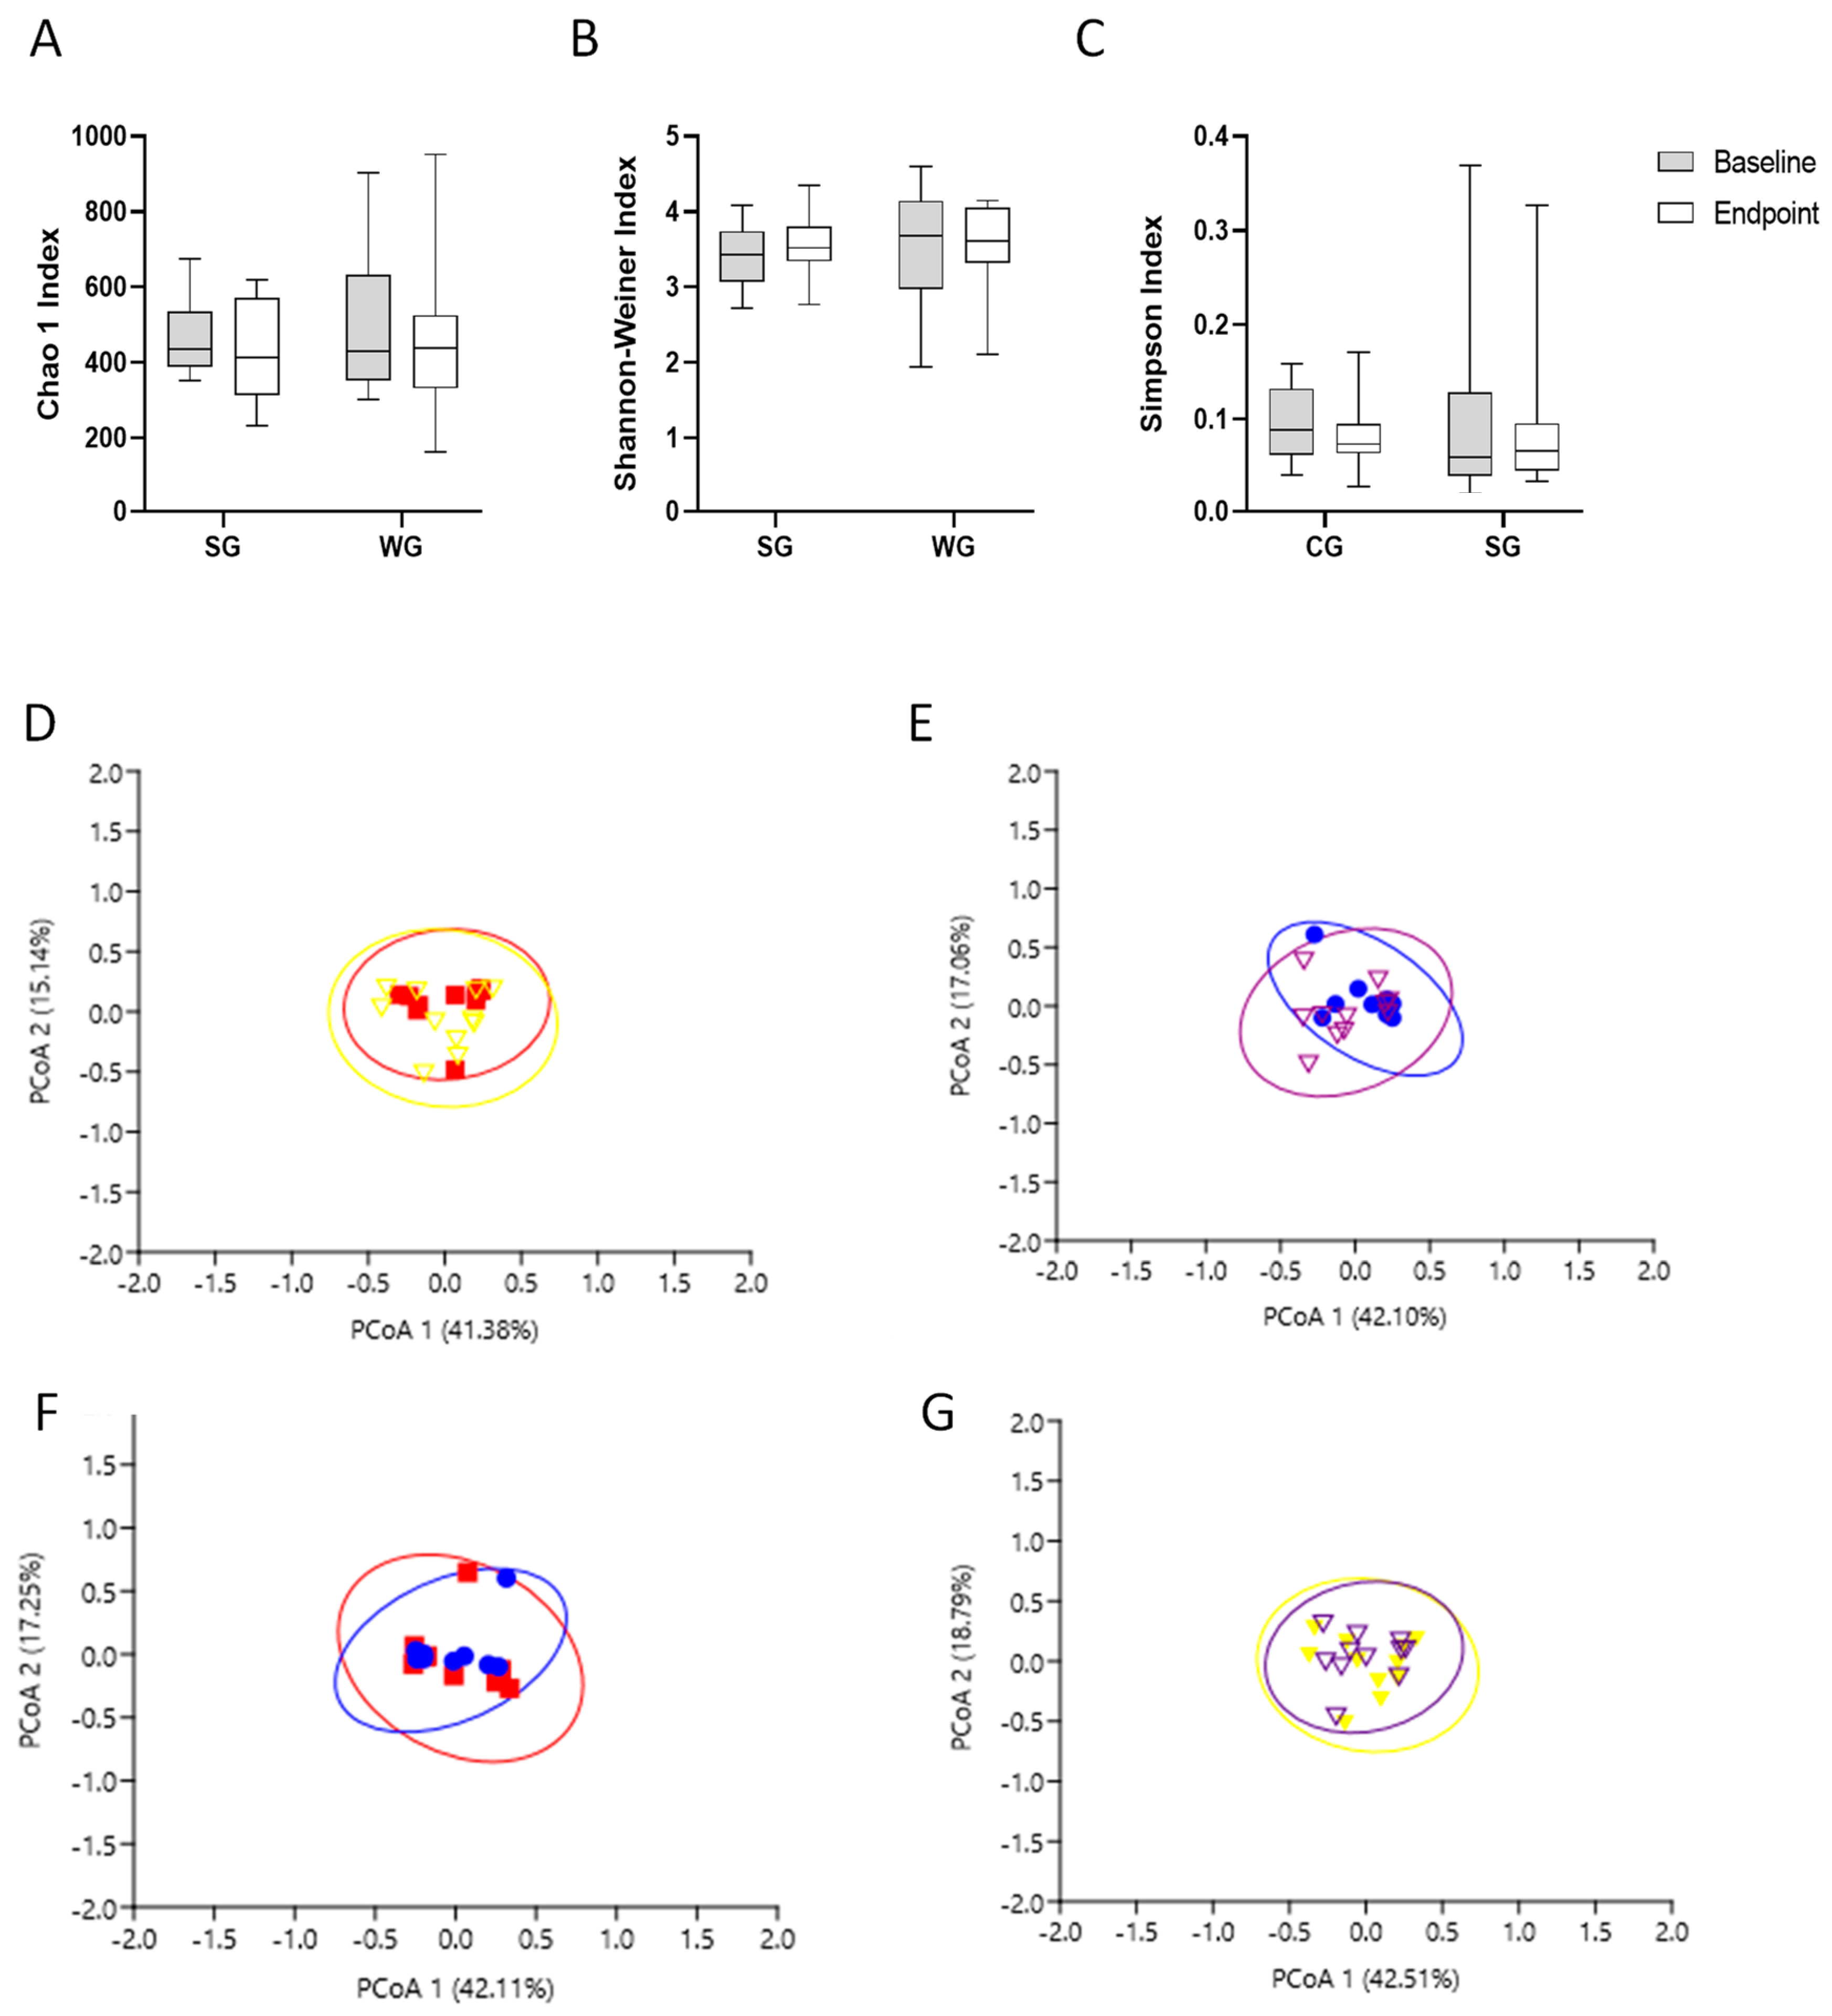
3.3. Gut Microbiota Analysis
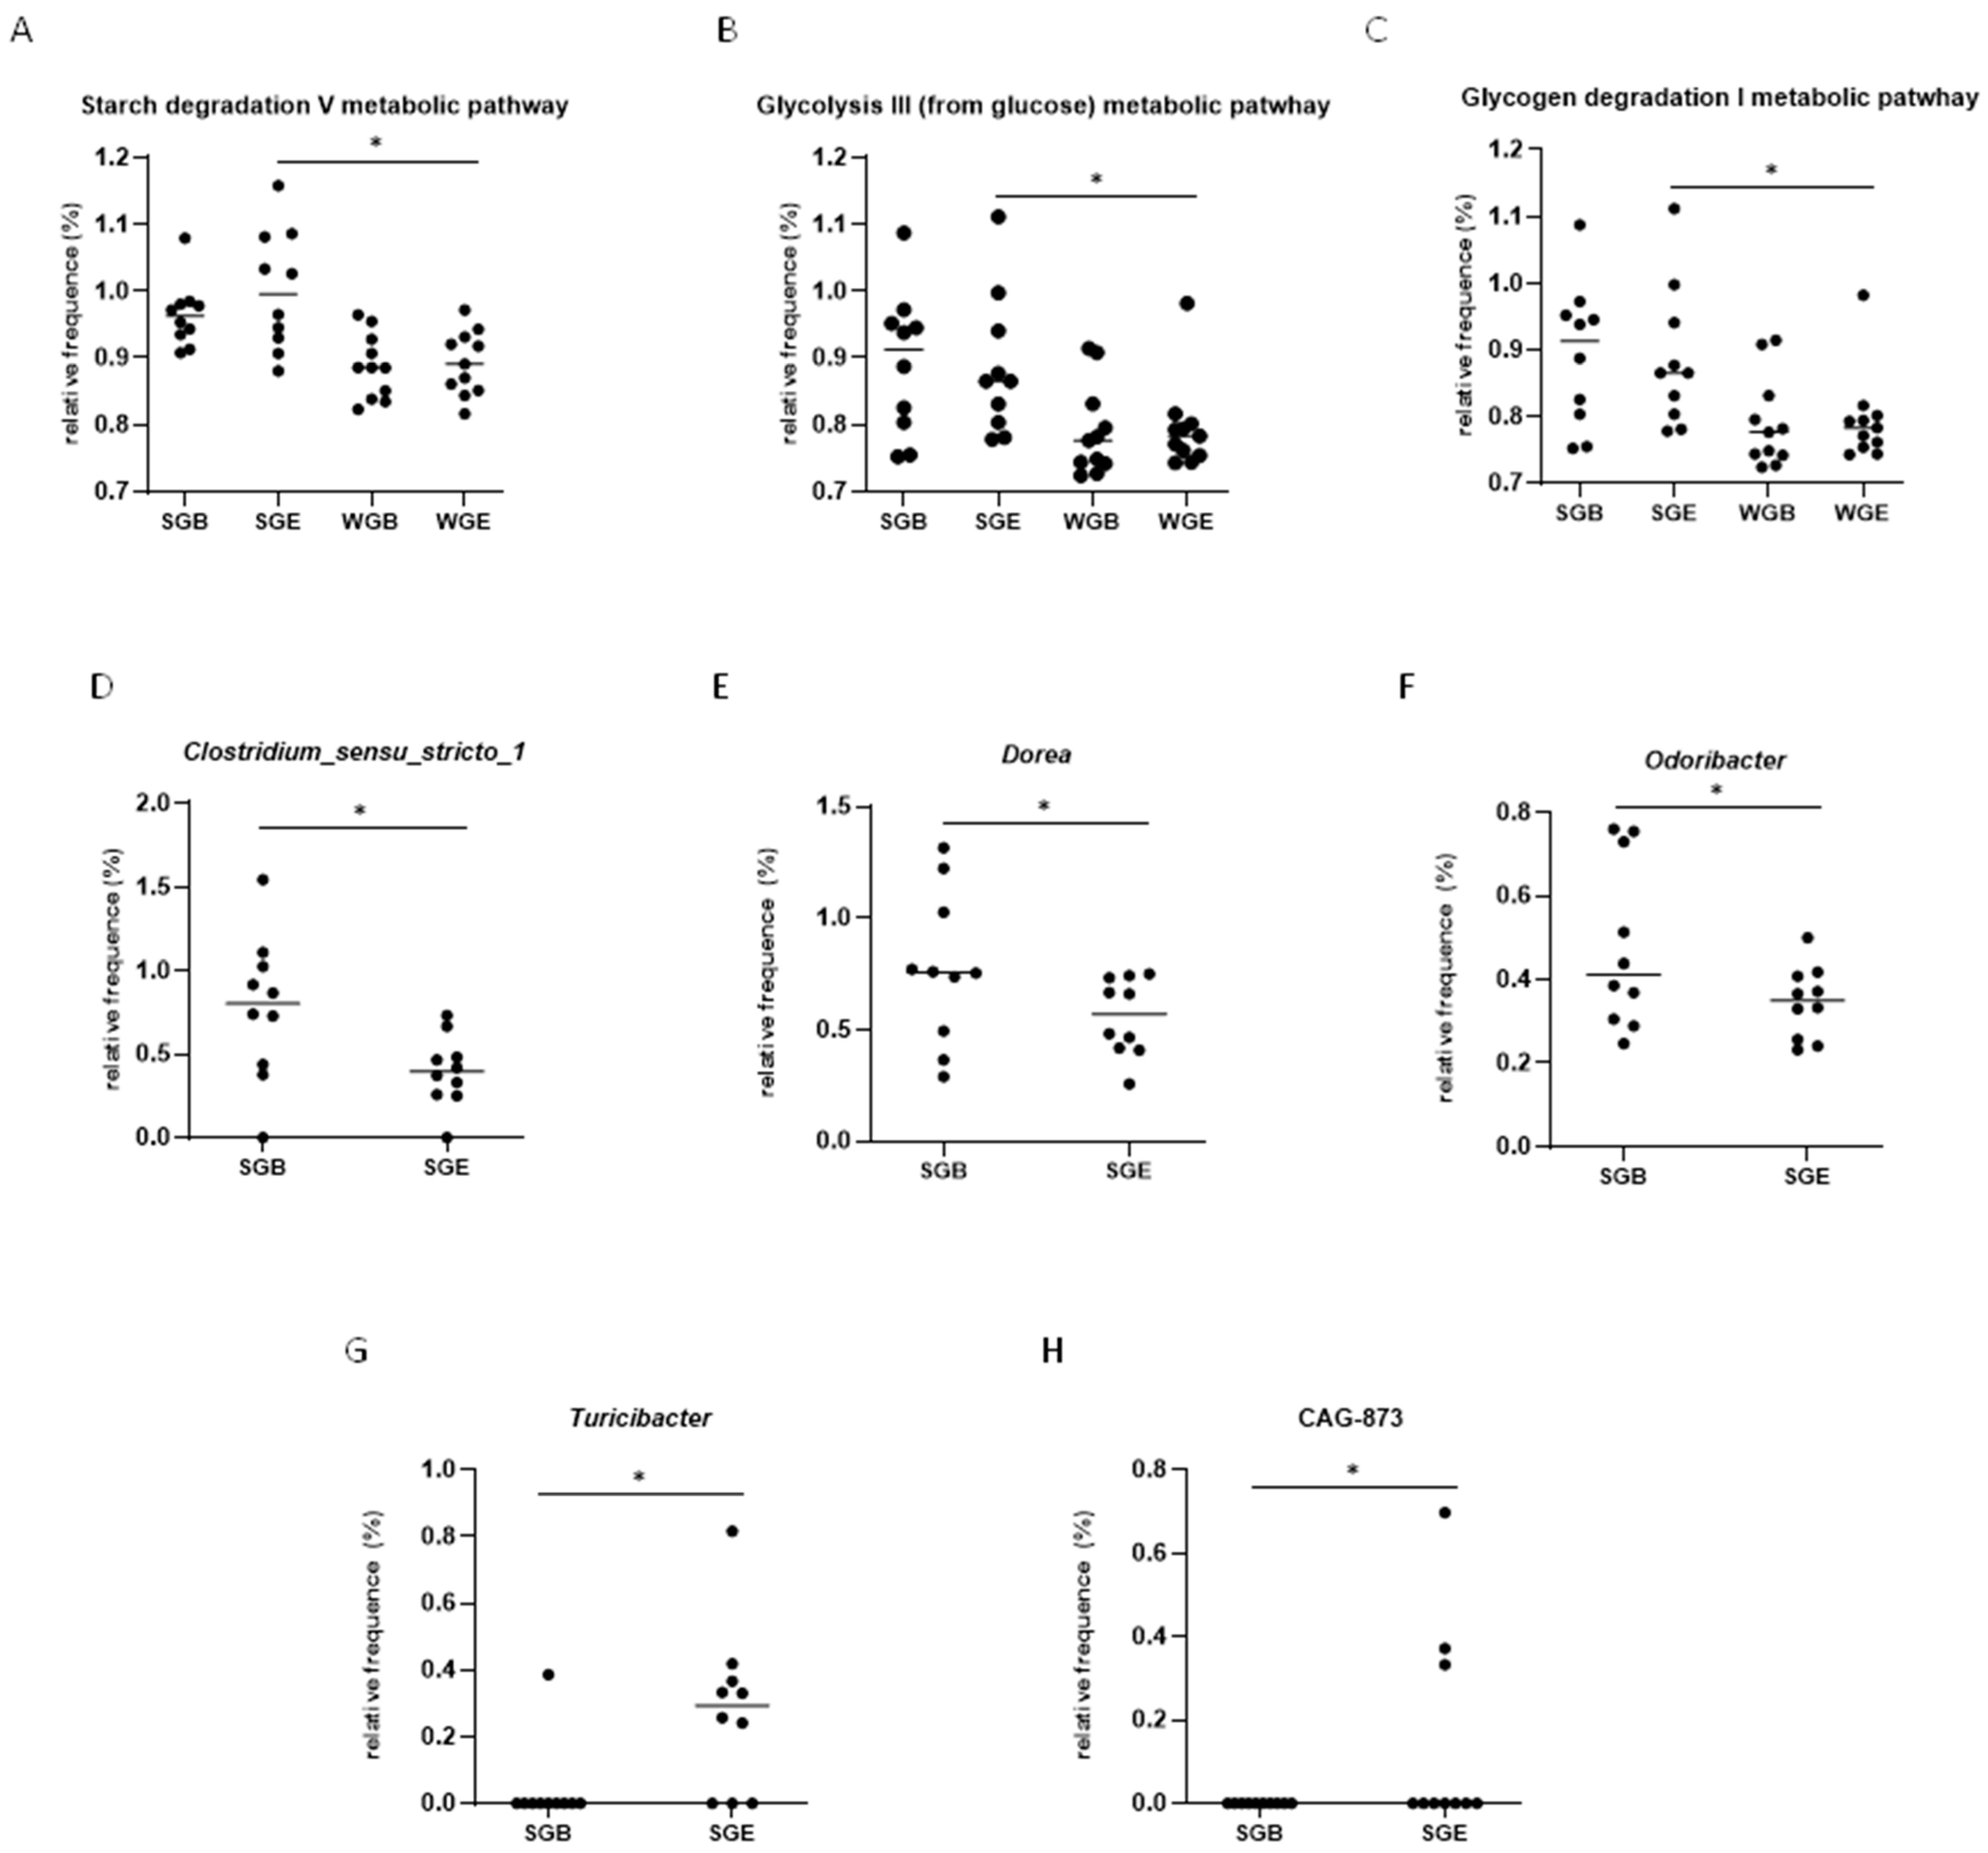
3.4. Functional Prediction Analysis (KEGG Analysis)
3.5. LEfSe Analysis
4. Discussion
5. Conclusions
Supplementary Materials
Author Contributions
Funding
Institutional Review Board Statement
Informed Consent Statement
Data Availability Statement
Acknowledgments
Conflicts of Interest
References
- Cornier, M.A. A review of current guidelines for the treatment of obesity. Am. J. Manag. Care 2022, 28, S288–S296. [Google Scholar] [PubMed]
- Kojta, I.; Chacińska, M.; Błachnio-Zabielska, A. Obesity, Bioactive Lipids, and Adipose Tissue Inflammation in Insulin Resistance. Nutrients 2020, 12, 1305. [Google Scholar] [CrossRef] [PubMed]
- Morigny, P.; Boucher, J.; Arner, P.; Langin, D. Lipid and Glucose Metabolism in White Adipocytes: Pathways, Dysfunction and Therapeutics. Nat. Rev. Endocrinol. 2021, 17, 276–295. [Google Scholar] [CrossRef] [PubMed]
- Barata Cavalcanti, O.; Barquera, S.; Baur, L.; Busch, V.; Buse, K.; Dietz, B.; French, A.; Jackson Leach, R.; van Opzeeland, B.; Powis, J.; et al. Compiled by Tim Lobstein, Hannah Brinsden and Margot Neveux, with Input and Review from Acknowledgments; World Obesity Federation: London, UK, 2022. [Google Scholar]
- Cuevas-Sierra, A.; Ramos-Lopez, O.; Riezu-Boj, J.I.; Milagro, F.I.; Martinez, J.A. Diet, Gut Microbiota, and Obesity: Links with Host Genetics and Epigenetics and Potential Applications. Adv. Nutr. 2019, 10, S17–S30. [Google Scholar] [CrossRef]
- Janczy, A.; Aleksandrowicz-Wrona, E.; Kochan, Z.; Malgorzewicz, S. Impact of Diet and Synbiotics on Selected Gut Bacteria and Intestinal Permeability in Individuals with Excess Body Weight—A Prospective, Randomized Study. Acta Biochim. Pol. 2020, 67, 571–578. [Google Scholar] [CrossRef] [PubMed]
- Vanuytsel, T.; Tack, J.; Farre, R. The Role of Intestinal Permeability in Gastrointestinal Disorders and Current Methods of Evaluation. Front. Nutr. 2021, 8, 717925. [Google Scholar] [CrossRef]
- Ghiselli, F.; Rossi, B.; Piva, A.; Grilli, E. Assessing Intestinal Health. In Vitro and Ex Vivo Gut Barrier Models of Farm Animals: Benefits and Limitations. Front. Vet. Sci. 2021, 8, 723387. [Google Scholar] [CrossRef]
- Inczefi, O.; Bacsur, P.; Resál, T.; Keresztes, C.; Molnár, T. The Influence of Nutrition on Intestinal Permeability and the Microbiome in Health and Disease. Front. Nutr. 2022, 9, 718710. [Google Scholar] [CrossRef]
- Al-Sharif, F.M.; Abd El-Kader, S.M.; Neamatallah, Z.A.; Alkhateeb, A.M. Weight Reduction Improves Immune System and Inflammatory Cytokines in Obese Asthmatic Patients. Afr. Health Sci. 2020, 20, 897–902. [Google Scholar] [CrossRef]
- Siracusa, F.; Schaltenberg, N.; Villablanca, E.J.; Huber, S.; Gagliani, N. Dietary Habits and Intestinal Immunity: From Food Intake to CD4+ TH Cells. Front. Immunol. 2019, 9, 3177. [Google Scholar] [CrossRef]
- Ussar, S.; Griffin, N.W.; Bezy, O.; Fujisaka, S.; Vienberg, S.; Softic, S.; Deng, L.; Bry, L.; Gordon, J.I.; Kahn, C.R. Interactions between Gut Microbiota, Host Genetics and Diet Modulate the Predisposition to Obesity and Metabolic Syndrome. Cell Metab. 2015, 22, 516–530. [Google Scholar] [CrossRef]
- Palleja, A.; Kashani, A.; Allin, K.H.; Nielsen, T.; Zhang, C.; Li, Y.; Brach, T.; Liang, S.; Feng, Q.; Jørgensen, N.B.; et al. Roux-En-Y Gastric Bypass Surgery of Morbidly Obese Patients Induces Swift and Persistent Changes of the Individual Gut Microbiota. Genome Med. 2016, 8, 67. [Google Scholar] [CrossRef] [PubMed]
- Stanislawski, M.A.; Frank, D.N.; Borengasser, S.J.; Ostendorf, D.M.; Ir, D.; Jambal, P.; Bing, K.; Wayland, L.; Siebert, J.C.; Bessesen, D.H.; et al. The Gut Microbiota during a Behavioral Weight Loss Intervention. Nutrients 2021, 13, 3248. [Google Scholar] [CrossRef] [PubMed]
- David, L.A.; Maurice, C.F.; Carmody, R.N.; Gootenberg, D.B.; Button, J.E.; Wolfe, B.E.; Ling, A.V.; Devlin, A.S.; Varma, Y.; Fischbach, M.A.; et al. Diet Rapidly and Reproducibly Alters the Human Gut Microbiome. Nature 2014, 505, 559–563. [Google Scholar] [CrossRef] [PubMed]
- Medina Martinez, O.D.; Lopes Toledo, R.C.; Vieira Queiroz, V.A.; Pirozi, M.R.; Duarte Martino, H.S.; Ribeiro de Barros, F.A. Mixed Sorghum and Quinoa Flour Improves Protein Quality and Increases Antioxidant Capacity in Vivo. LWT 2020, 129, 109597. [Google Scholar] [CrossRef]
- Martinez, O.D.M.; Theodoro, J.M.V.; Grancieri, M.; Toledo, R.C.L.; De Barros, F.A.R.; Tako, E.; Queiroz, V.A.V.; Martino, H.S.D. Dry Heated Sorghum BRS 305 Hybrid Flour as a Source of Resistant Starch and Tannins Improves Inflammation and Oxidative Stress in Wistar Rats Fed with a High-Fat High-Fructose Diet. Food Funct. 2021, 12, 8738–8746. [Google Scholar] [CrossRef]
- Barros, F.; Awika, J.M.; Rooney, L.W. Interaction of Tannins and Other Sorghum Phenolic Compounds with Starch and Effects on in Vitro Starch Digestibility. J. Agric. Food Chem. 2012, 60, 11609–11617. [Google Scholar] [CrossRef]
- Cardoso, L.D.M.; Pinheiro, S.S.; de Carvalho, C.W.P.; Queiroz, V.A.V.; de Menezes, C.B.; Moreira, A.V.B.; de Barros, F.A.R.; Awika, J.M.; Martino, H.S.D.; Pinheiro-Sant’Ana, H.M. Phenolic Compounds Profile in Sorghum Processed by Extrusion Cooking and Dry Heat in a Conventional Oven. J. Cereal Sci. 2015, 65, 220–226. [Google Scholar] [CrossRef]
- de Morais Cardoso, L.; Pinheiro, S.S.; Martino, H.S.D.; Pinheiro-Sant’Ana, H.M. Sorghum (Sorghum bicolor L.): Nutrients, Bioactive Compounds, and Potential Impact on Human Health. Crit. Rev. Food Sci. Nutr. 2017, 57, 372–390. [Google Scholar] [CrossRef]
- Anunciação, P.C.; Cardoso, L.D.M.; Gomes, J.V.P.; Della Lucia, C.M.; Carvalho, C.W.P.; Galdeano, M.C.; Queiroz, V.A.V.; Alfenas, R.d.C.G.; Martino, H.S.D.; Pinheiro-Sant’Ana, H.M. Comparing Sorghum and Wheat Whole Grain Breakfast Cereals: Sensorial Acceptance and Bioactive Compound Content. Food Chem. 2017, 221, 984–989. [Google Scholar] [CrossRef]
- Anunciação, P.C.; Cardoso, L.D.M.; Queiroz, V.A.V.; de Menezes, C.B.; de Carvalho, C.W.P.; Pinheiro-Sant’Ana, H.M.; Alfenas, R.d.C.G. Consumption of a Drink Containing Extruded Sorghum Reduces Glycaemic Response of the Subsequent Meal. Eur. J. Nutr. 2018, 57, 251–257. [Google Scholar] [CrossRef] [PubMed]
- de Sousa, A.R.; de Castro Moreira, M.E.; Grancieri, M.; Toledo, R.C.L.; de Oliveira Araújo, F.; Mantovani, H.C.; Queiroz, V.A.V.; Martino, H.S.D. Extruded Sorghum (Sorghum bicolor L.) Improves Gut Microbiota, Reduces Inflammation, and Oxidative Stress in Obese Rats Fed a High-Fat Diet. J. Funct. Foods 2019, 58, 282–291. [Google Scholar] [CrossRef]
- Arbex, P.M.; Moreira, M.E.D.C.; Toledo, R.C.L.; de Morais Cardoso, L.; Pinheiro-Sant’ana, H.M.; Benjamin, L.d.A.; Licursi, L.; Carvalho, C.W.P.; Queiroz, V.A.V.; Martino, H.S.D. Extruded Sorghum Flour (Sorghum bicolor L.) Modulate Adiposity and Inflammation in High Fat Diet-Induced Obese Rats. J. Funct. Foods 2018, 42, 346–355. [Google Scholar] [CrossRef]
- Medina Martinez, O.D.; Vieira Theodoro, J.M.; Grancieri, M.; Lopes Toledo, R.C.; Vieira Queiroz, V.A.; Ribeiro de Barros, F.A.; Duarte Martino, H.S. Dry Heated Whole Sorghum Flour (BRS 305) with High Tannin and Resistant Starch Improves Glucose Metabolism, Modulates Adiposity, and Reduces Liver Steatosis and Lipogenesis in Wistar Rats Fed with a High-Fat High-Fructose Diet. J. Cereal Sci. 2021, 99, 103201. [Google Scholar] [CrossRef]
- Samtiya, M.; Aluko, R.E.; Dhewa, T.; Moreno-Rojas, J.M. Potential Health Benefits of Plant Food-Derived Bioactive Components: An Overview. Foods 2021, 10, 839. [Google Scholar] [CrossRef]
- Girard, A.L.; Awika, J.M. Sorghum Polyphenols and Other Bioactive Components as Functional and Health Promoting Food Ingredients. J. Cereal Sci. 2018, 84, 112–124. [Google Scholar] [CrossRef]
- Soumya, N.P.P.; Mini, S.; Sivan, S.K.; Mondal, S. Bioactive Compounds in Functional Food and Their Role as Therapeutics. Bioact. Compd. Health Dis. 2021, 4, 24–39. [Google Scholar] [CrossRef]
- Anunciação, P.C.; Cardoso, L.D.M.; Alfenas, R.d.C.G.; Queiroz, V.A.V.; Carvalho, C.W.P.; Martino, H.S.D.; Pinheiro-Sant’Ana, H.M. Extruded Sorghum Consumption Associated with a Caloric Restricted Diet Reduces Body Fat in Overweight Men: A Randomized Controlled Trial. Food Res. Int. 2019, 119, 693–700. [Google Scholar] [CrossRef]
- Durrer Schutz, D.; Busetto, L.; Dicker, D.; Farpour-Lambert, N.; Pryke, R.; Toplak, H.; Widmer, D.; Yumuk, V.; Schutz, Y. European Practical and Patient-Centred Guidelines for Adult Obesity Management in Primary Care. Obes. Facts 2019, 12, 40–66. [Google Scholar] [CrossRef]
- Murphy, S.P.; Poos, M.I. Dietary Reference Intakes: Summary of Applications in Dietary Assessment. Public Health Nutr. 2002, 5, 843–849. [Google Scholar] [CrossRef]
- Jelliffe, D.B. Evolución del Estado de Nutrición de La Comunidad; Organizacion Mundial de la Salud: Geneva, Switzerland, 1968; pp. 53–83. [Google Scholar]
- Wharton, S.; Lau, D.C.W.; Vallis, M.; Sharma, A.M.; Biertho, L.; Campbell-Scherer, D.; Adamo, K.; Alberga, A.; Bell, R.; Boulé, N.; et al. Obesity in Adults: A Clinical Practice Guideline. CMAJ 2020, 192, E875–E891. [Google Scholar] [CrossRef] [PubMed]
- Siegfried, R.; Ruckemann, H.; Stumpf, G. Method for the determination of organic-acids in silage by high-performance liquid-chromatography. Landwirtsch. Forsch. 1984, 37, 298–304. [Google Scholar]
- Schloss, P.D.; Westcott, S.L.; Ryabin, T.; Hall, J.R.; Hartmann, M.; Hollister, E.B.; Lesniewski, R.A.; Oakley, B.B.; Parks, D.H.; Robinson, C.J.; et al. Introducing Mothur: Open-Source, Platform-Independent, Community-Supported Software for Describing and Comparing Microbial Communities. Appl. Environ. Microbiol. 2009, 75, 7537–7541. [Google Scholar] [CrossRef] [PubMed]
- Quast, C.; Pruesse, E.; Yilmaz, P.; Gerken, J.; Schweer, T.; Yarza, P.; Peplies, J.; Glöckner, F.O. The SILVA Ribosomal RNA Gene Database Project: Improved Data Processing and Web-Based Tools. Nucleic Acids Res. 2013, 41, 590–596. [Google Scholar] [CrossRef] [PubMed]
- Hammer, D.A.T.; Ryan, P.D.; Hammer, Ø.; Harper, D.A.T. Past: Paleontological Statistics Software Package for Education and Data Analysis. Palaeontol. Electron. 2001, 4, 4. [Google Scholar]
- Santo, H.E.; Daniel, F. Calcular e Apresentar Tamanhos Do Efeito Em Trabalhos Científicos. Rev. Port. Investig. Comport. Soc. 2017, 1, 3–16. [Google Scholar] [CrossRef]
- Wang, K.; Cao, G.; Zhang, H.; Li, Q.; Yang, C. Effects of Clostridium Butyricum and Enterococcus Faecalis on Growth Performance, Immune Function, Intestinal Morphology, Volatile Fatty Acids, and Intestinal Flora in a Piglet Model. Food Funct. 2019, 10, 7844–7854. [Google Scholar] [CrossRef]
- Palmnäs-Bedard, M.S.A.; Costabile, G.; Vetrani, C.; Åberg, S.; Hjalmarsson, Y.; Dicksved, J.; Riccardi, G.; Landberg, R. The Human Gut Microbiota and Glucose Metabolism: A Scoping Review of Key Bacteria and the Potential Role of SCFAs. Am. J. Clin. Nutr. 2022, 116, 862–874. [Google Scholar] [CrossRef]
- Yu, H.; Li, X.X.; Han, X.; Chen, B.X.; Zhang, X.H.; Gao, S.; Xu, D.Q.; Wang, Y.; Gao, Z.K.; Yu, L.; et al. Fecal Microbiota Transplantation Inhibits Colorectal Cancer Progression: Reversing Intestinal Microbial Dysbiosis to Enhance Anti-Cancer Immune Responses. Front. Microbiol. 2023, 14, 1126808. [Google Scholar] [CrossRef]
- Grant, C.V.; Loman, B.R.; Bailey, M.T.; Pyter, L.M. Manipulations of the Gut Microbiome Alter Chemotherapy-Induced Inflammation and Behavioral Side Effects in Female Mice. Brain Behav. Immun. 2021, 95, 401–412. [Google Scholar] [CrossRef]
- Hamada, K.; Isobe, J.; Hattori, K.; Hosonuma, M.; Baba, Y.; Murayama, M.; Narikawa, Y.; Toyoda, H.; Funayama, E.; Tajima, K.; et al. Turicibacter and Acidaminococcus Predict Immune-Related Adverse Events and Efficacy of Immune Checkpoint Inhibitor. Front. Immunol. 2023, 14, 1164724. [Google Scholar] [CrossRef] [PubMed]
- Vijaykrishnaraj, M.; Kumar, B.V.M.; Muthukumar, S.P.; Kurrey, N.K.; Prabhasankar, P. Antigen-Specific Gut Inflammation and Systemic Immune Responses Induced by Prolonging Wheat Gluten Sensitization in BALB/c Murine Model. J. Proteome Res. 2017, 16, 3514–3528. [Google Scholar] [CrossRef] [PubMed]
- Xiao, J.; Chen, Y.; Huang, Q. Physicochemical Properties of Kafirin Protein and Its Applications as Building Blocks of Functional Delivery Systems. Food Funct. 2017, 8, 1402–1413. [Google Scholar] [CrossRef] [PubMed]
- Lopes, R.D.C.S.O.; Theodoro, J.M.V.; da Silva, B.P.; Queiroz, V.A.V.; de Castro Moreira, M.E.; Mantovani, H.C.; Hermsdorff, H.H.; Martino, H.S.D. Synbiotic Meal Decreases Uremic Toxins in Hemodialysis Individuals: A Placebo-Controlled Trial. Food Res. Int. 2019, 116, 241–248. [Google Scholar] [CrossRef]
- Jamshed, H.; Steger, F.L.; Bryan, D.R.; Richman, J.S.; Warriner, A.H.; Hanick, C.J.; Martin, C.K.; Salvy, S.J.; Peterson, C.M. Effectiveness of Early Time-Restricted Eating for Weight Loss, Fat Loss, and Cardiometabolic Health in Adults with Obesity: A Randomized Clinical Trial. JAMA Intern. Med. 2022, 182, 953–962. [Google Scholar] [CrossRef]


| Variables | Sorghum Group (n = 12) | Wheat Group (n = 10) | Δ p Value 1 | Cohen’s d (95% CI) | ||
|---|---|---|---|---|---|---|
| Baseline | Endpoint | Baseline | Endpoint | |||
| Weight (kg) | 84.37 ± 7.09 a | 83.12 ± 6.96 b | 91.83 ± 11.49 a | 90.68 ± 11.10 a | 0.919 | −0.06 (−0.9; 0.78) |
| BMI (kg/m2) | 28.16 ± 0.96 a | 27.14 ± 0.98 b | 28.83 ± 2.10 a | 28.49 ± 2.38 a | 0.907 | −0.16 (−1.00; 0.68) |
| WC (cm) | 94.46 ± 3.47 a | 92.18 ± 3.84 b | 100.60 ± 6.10 a | 99.59 ± 6.79 a | 0.169 | −0.66 (−1.52; 0.20) |
| SAD (cm) | 20.83 ± 1.20 a | 20.13 ± 0.99 b | 22.64 ± 1.98 a | 22.11 ± 1.46 a | 0.673 | −0.10 (−0.94; 0.74) |
| WHtR | 0.54 ± 0.04 a | 0.53 ± 0.01 b | 0.57 ± 0.04 a | 0.56 ± 0.05 a | 0.346 | −0.37 (−1.21; 0.48) |
| BF (%) | 29.15 ± 4.53 a | 26.18 ± 4.97 b | 31.77 ± 6.68 a | 31.61 ± 6.91 a | 0.005 | −1.67 (−2.64; −0.7) |
| Inflammatory Markers | Baseline | Endpoint | Baseline | Endpoint | Δ p Value 1 | |
| IL-6 (pg/mL) | 0.87 ± 0.19 a | 1.15 ± 0.03 a | 0.77 ± 0.28 a | 1.01 ± 0.18 b | 0.703 | −0.21 (−1.05; 0.64) |
| IL-10 (pg/mL) | 1.50 ± 1.01 a | 1.73 ± 0.88 a | 0.96 ± 0.49 a | 1.17 ± 0.62 a | 0.848 | −0.09 (−0.93; 0.75) |
| TNFα (pg/mL) | 7.54 ± 5.10 a | 9.02 ± 5.34 a | 6.41 ± 2.60 a | 7.02 ± 2.74 a | 0.274 | 0.58 (−0.28; 1.44) |
| Variables | Sorghum Group | Wheat Group | Δ p Value between Groups 2 | Cohen’s d (95% CI) | ||
|---|---|---|---|---|---|---|
| Baseline (n = 10) | Endpoint (n = 10) | Baseline (n = 11) | Endpoint (n = 11) | |||
| Total VFAs 1 | 28.35 ± 11.83 a | 31.82 ± 11.78 a | 29.65 ± 10.41 a | 27.42 ± 12.87 a | 0.436 | 0.06 (−0.78; 0.9) |
| Acetic acid | 14.73 ± 1.96 a | 14.76 ± 3.7 a | 14.09 ± 3.52 a | 14.56 ± 5.40 a | 0.809 | 0.20 (−0.65; 1.04) |
| Propionic acid | 6.32 ± 2.7 a | 6.05 ± 3.12 a | 7.14 ± 3.99 a | 6.18. ± 2.90 a | 0.641 | −0.06 (−0.9; 0.78) |
| Butyric acid | 4.90 ± 2.51 a | 5.46 ± 3.77 a | 5.89 ± 2.99 a | 5.01 ± 2.90 a | 0.456 | 0.35 (−0.5; 1.19) |
| Fecal pH | 6.73 ± 0.37 a | 6.68 ± 0.55 a | 6.85 ± 0.45 a | 6.96 ± 0.53 a | 0.254 | - |
| Target taxon | Baseline (n = 10) | Endpoint (n = 10) | Baseline (n = 11) | Endpoint (n = 11) | Δ p Value between Groups 1 | |
| Bacteroidetes | 108.89 ± 40.00 a | 106.51 ± 24.66 a | 73.96 ± 51.99 a | 106.39 ± 53.13 a | 0.115 | - |
| Proteobacteria | 0.19 ± 0.25 a | 0.20 ± 0.21 a | 1.30 ± 1.67 a | 3.56 ± 11.00 a | 0.075 | - |
| Firmicutes | 4.16 ± 1.53 a | 6.29 ± 4.54 a | 10.74 ± 11.30 a | 4.74 ± 2.97 a | 0.250 | - |
Disclaimer/Publisher’s Note: The statements, opinions and data contained in all publications are solely those of the individual author(s) and contributor(s) and not of MDPI and/or the editor(s). MDPI and/or the editor(s) disclaim responsibility for any injury to people or property resulting from any ideas, methods, instructions or products referred to in the content. |
© 2023 by the authors. Licensee MDPI, Basel, Switzerland. This article is an open access article distributed under the terms and conditions of the Creative Commons Attribution (CC BY) license (https://creativecommons.org/licenses/by/4.0/).
Share and Cite
Lúcio, H.; Anunciação, P.; da Silva, B.; da Silva, A.; Queiroz, V.; de Carvalho, C.; Pinheiro-Sant’Ana, H.; Martino, H. Consumption of Extruded Sorghum SC319 Improved Gut Microbiota at Genus Level and Reduced Anthropometric Markers in Men with Overweight: A Randomized Controlled Clinical Trial. Nutrients 2023, 15, 3786. https://doi.org/10.3390/nu15173786
Lúcio H, Anunciação P, da Silva B, da Silva A, Queiroz V, de Carvalho C, Pinheiro-Sant’Ana H, Martino H. Consumption of Extruded Sorghum SC319 Improved Gut Microbiota at Genus Level and Reduced Anthropometric Markers in Men with Overweight: A Randomized Controlled Clinical Trial. Nutrients. 2023; 15(17):3786. https://doi.org/10.3390/nu15173786
Chicago/Turabian StyleLúcio, Haira, Pamella Anunciação, Barbara da Silva, Alessandra da Silva, Valéria Queiroz, Carlos de Carvalho, Helena Pinheiro-Sant’Ana, and Hercia Martino. 2023. "Consumption of Extruded Sorghum SC319 Improved Gut Microbiota at Genus Level and Reduced Anthropometric Markers in Men with Overweight: A Randomized Controlled Clinical Trial" Nutrients 15, no. 17: 3786. https://doi.org/10.3390/nu15173786
APA StyleLúcio, H., Anunciação, P., da Silva, B., da Silva, A., Queiroz, V., de Carvalho, C., Pinheiro-Sant’Ana, H., & Martino, H. (2023). Consumption of Extruded Sorghum SC319 Improved Gut Microbiota at Genus Level and Reduced Anthropometric Markers in Men with Overweight: A Randomized Controlled Clinical Trial. Nutrients, 15(17), 3786. https://doi.org/10.3390/nu15173786