Abstract
Most chronic diseases are preventable with a healthy diet, although there is debate about the optimal dietary approach. Increasingly more countries are focusing on food-based guidelines rather than the traditional nutrient-based approach. Although there is good agreement on plant foods, controversy remains about the types and amounts of fats and oils. This narrative review aims to systematically summarize and evaluate the latest evidence on the protective effects of extra virgin olive oil (EVOO) on disease risk factors. A systematic search of the relevant literature using PubMed, Cochrane Library, and Embase databases was conducted for the years 2000 through December 2022. A narrative synthesis was then undertaken. Of 281 retrieved articles, 34 articles fulfilled our inclusion criteria and were included. Compared with other dietary fats and low-fat diets, EVOO is superior in the management of clinical biomarkers including lowering blood pressure and LDL-c, increasing protective HDL-c, improving glycemic control, and weight management. The protective effects of EVOO are likely due to its polyphenol content rather than the monounsaturated fat content. It is therefore important to promote the regular use of EVOO in the context of healthy dietary patterns such as the Mediterranean diet for maximal health benefit.
1. Introduction
Chronic non-communicable diseases (NCDs) are responsible for the deaths of 41 million people each year, equivalent to 74% of all deaths globally [1]. Over 80% of all premature NCD deaths are due to cardiovascular diseases (CVDs), which account for the large majority (~40%), followed by cancers, chronic respiratory diseases, and diabetes. An estimated 90% of deaths from CVD can be prevented with modifiable risk factors such as healthy dietary patterns rich in plant foods such as the Mediterranean diet. The traditional Mediterranean diet is a plant-based diet rich in seasonal fruits and vegetables, legumes, nuts, whole-grain cereals, moderate servings of oily fish, and fermented dairy such as feta cheese and yogurt and very low in red meat with a preference for white meats and eggs that are free range [2]. One of the most important ingredients of the Mediterranean diet that is consistent across all Mediterranean countries is extra virgin olive oil consumed liberally as the main added fat. There is now widespread agreement that the Mediterranean diet is important in the prevention of chronic diseases, and this is reflected in many dietary guidelines for chronic diseases worldwide [3,4,5,6]; however, there is very little focus on differentiating healthy fats such as EVOO from other fats and oils in dietary guidelines.
The current dietary guidelines of United States health agencies [3] and most dietary guidelines across the UK [7], Ireland [8], and Australia [9] do not distinguish between dietary oils for health benefit or potential harm. Seed oils (corn, flaxseed, safflower, soybean, and sunflower) can readily oxidize due to the high polyunsaturated fat content [10,11,12], which has the potential to initiate and promote disease processes. Oils that are mainly monounsaturated or saturated fat are less likely to oxidize [10], but harm–benefit associations with health would depend on the individual oils.
The habitual use of extra virgin olive oil (EVOO) is associated with decreasing the risk of a range of diverse chronic diseases including cardiovascular disease [13], cerebral vascular accidents [14], and type 2 diabetes [15,16]; both the prevention [17] and reversion [16] of the metabolic syndrome; the prevention of decline in cognitive function [18]; and reductions in the risk of breast [19,20,21,22] and colorectal [23,24] cancers. EVOO has also been shown to lower the risk of obesity [25] and weight gain over time [26] and to improve overall mortality [27]. This suggests that EVOO may be unique among the dietary fats in its ability to decrease the risk of multiple chronic diseases, and hence, its place in dietary guidelines should be emphasized.
While vegetable seed oils are produced by chemical extraction of the oil, EVOO is produced by crushing the olive fruit with no use of chemical solvents and only water at ambient temperature during malaxation, which would preserve the phenols naturally present in the oil. Thus, olive oil is essentially the juice of olive fruit. To be classified as “extra virgin”, the oil must meet chemical and sensory standards [28]. However, the phenol content of the olive oil provides the health benefits [29], as opposed to the fatty acid composition of the oil. The individual phenols and the amount of the phenols present in the olive oil are influenced by the olive variety and the growing, harvesting, and processing of the olive [30]. In addition to health benefits, the phenols and other minor flavor compounds in EVOO give the sensory characteristics of the oil [31]. The phenols in EVOO have been found to be bioavailable with absorption rates of more than 50% [32], and plasma levels increase in a dose-dependent manner based on the total phenol content of the EVOO [33]. There is evidence that the phenols in EVOO will bind to low- [34] and high-density lipoprotein cholesterol [35], which would preserve the phenols in the blood. The attachment of the phenol to lipoproteins may prevent the oxidation of these lipoproteins and would also provide the phenol transport to cells where they can exert their function.
To understand how EVOO decreases the risk of chronic diseases, the effect of EVOO on risk factors for the diseases needs to be assessed. Herein, this review aims to compare the effect of diets that include EVOO with other defined diets that do not include extra virgin olive oil on clinically relevant cardiometabolic risk factors assessed for heart disease, metabolic syndrome, and type 2 DM. Specifically, it will examine the effects on blood pressure, low- and high-density lipoprotein cholesterol, fasting blood glucose, and body weight. It will also assess from published studies the minimum daily amount of EVOO and the shortest time needed to realize improvements in the risk factors.
2. Methods
This review involved a systematic search with inclusion and exclusion criteria, quality assessment of the studies that were identified, and summary of the study findings [36]. A literature search of PubMed, Cochrane Library, and Embase was conducted for the years 2000 through December 2022 using the search tool EndNote X9®. The search included MeSH terms of “olive oil” with the variables of “blood pressure”; “hypertension”; “glucose”; “insulin”; “insulin resistance”; “cholesterol, LDL”; cholesterol, HDL”; “body weight”; and “weight loss”. The articles retrieved were assessed against inclusion and exclusion criteria. Aligned with the PICO method, the inclusion criteria were original research papers published in English, peer-reviewed journals, human studies (population), randomized controlled trials, testing a known amount of EVOO that was part of the prescribed diet, the extra virgin olive oil being consumed daily (intervention), the comparison being with another defined diet that did not contain EVOO (C), and the cardiometabolic effects of the trials containing EVOO as noted in the search terms above (outcome). Each article was inspected to verify the inclusion of the variable of interest. The exclusion criteria were animal or in vitro studies, lack of randomization, solely postprandial measurements, test of olive oil phenols only, olive oil as a supplement pill, olive oil that had components added, not stated as extra virgin olive oil, stated use of refined or pomace olive oil only, abstracts or presentations, or the article indicating a potential change in medication that could impact one of the variables to be studied. Studies that tested “virgin olive oil” were included if a phenol content was provided. The reference lists from the articles found using searches were manually examined for additional eligible articles to include.
One author (MF) extracted information from the included studies—the population studied, details on the intervention (amount of EVOO and duration of study/EVOO exposure), and effect on outcomes (cardiometabolic risk factor variables)—and evaluated it. The articles retrieved were assessed for quality using the Academy of Nutrition and Dietetics Quality Criteria Checklist (ANDQCC) for primary research [37]. The ANDQCC contains four questions regarding the relevance of the research and ten questions relating to the validity of the research. This checklist evaluates the internal and external bias within the study to determine the quality of the studies’ inclusion/exclusion criteria, data collection and analysis, and the generalizability of the results to grade the quality of the study. A meta-analysis was not performed due to the heterogeneity in the included studies and the difference in the reporting of the outcome variables of interest.
3. Results
Figure 1 summarizes the major elements of this search that met the inclusion criteria. Thirty-four studies are included in this review, and the ANDQCC is presented in Table 1, which shows that all of the studies received a “positive” rating. The results for each risk factor are presented as a comparison of EVOO with another dietary fat, a low-fat (LF) diet, refined olive oil, or EVOO differing in phenol content. The results are presented as they were provided in the journal article. Several of the references were from the Prevencion con Dieta Med (PREDIMED) study, including subgroup studies. The PREDIMED study took place in Spain and enrolled participants from 2003 to 2009. It included 7447 total participants who had either type 2 diabetes or at least three risk factors for cardiovascular disease [38]. Participants were randomly assigned to a low-fat diet (control), a diet with four tablespoons a day of EVOO, or a diet with 30 g a day of nuts. Reports were published at several time points over the course of the trial. This review included papers reporting on the longest time point for a variable and only included an earlier time point if the publication had additional data that were not found in a more recent report.
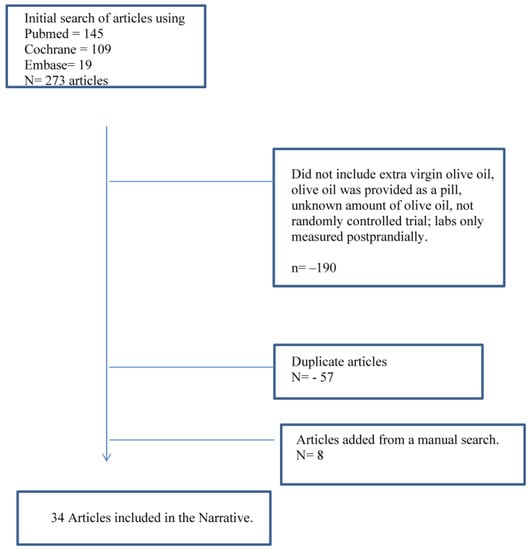
Figure 1.
Flow diagram of the literature review processes evaluating studies comparing extra virgin olive oil with diets with other fats, low-fat diets, or olive oils with differing total phenol contents.

Table 1.
Quality Assessment of Studies Using the Academy of Nutrition and Dietetics Quality Criteria Checklist (ANDQCC) [37].
3.1. Blood Pressure
Sixteen RCTs examined the effect of EVOO on blood pressure [39,41,43,44,46,47,48,51,55,60,62,63,65,66,67,70]. Of these, six included the total phenol content of the EVOO studied [39,41,48,62,63,68]. Five stated that participants had hypertension (HTN) [44,47,55,63,65], one had baseline blood pressure that would be classified as hypertensive [48], and three were PREDIMED results that would have included some participants with hypertension [43,46,70]. Table 2provides the information on the RCTs for blood pressure.
Table 2.
The effect of extra virgin olive oil on blood pressure compared with diets with other fats, low-fat diets, and olive oil varying by phenol content.
For the studies that included participants with HTN, EVOO lowered the systolic blood pressure (SBP) compared with sunflower oil [47,65] but not compared with coconut oil [55]. For the PREDIMED studies comparing the EVOO group with the LF group, DBP was lower in the EVOO group at three months [46], at one year [43], and after four years [70], and SBP was lowered only at three months [46] and one year [43]. An additional study that was not from the PREDIMED trials comparing an LF diet with extra virgin olive oil found no difference in the systolic or diastolic blood pressure between the diets [44]. For the two studies that included both the total phenol content of the olive oil and hypertensive participants, an EVOO with a total phenol of 161 mg/kg [48] and one with 564 mg/kg [63] both lowered SBP, while DBP was lowered only with the 564 mg/kg total phenol olive oil and was borderline significant for the 161 mg/kg total phenols.
For the seven studies that included normotensive participants, three studies reported the olive oil used as “extra virgin olive oil” [51,60,66]. Two reported EVOO lowering only DBP compared with corn [60] or soybean oil [51], and one reported only lowering SBP compared with an intervention that was corn oil, soybean oil, and butter [66]. Three reported a total phenol content of 366 mg/kg, and DBP was lowered compared with refined olive oil [39,41,62]. Of the three studies comparing refined olive oil with 366 mg/kg olive oil [39,41,62], only one of the studies reported a decrease in SBP [39], which was also seen in the Sarapis et al. study that used 360 mg/kg [67], suggesting there may have been different phenols in the oils despite the same total phenol content.
3.2. Low-Density Lipoprotein Cholesterol (LDL-c)
Twenty RTCs examined the effect of EVOO on LDL-c [33,40,45,46,47,48,50,55,56,57,58,59,60,61,62,63,64,65,66,67,68]. Of these, nine included the total phenol content of the EVOO studied [33,41,42,50,53,54,61,62,68]. Eight included participants with a mean baseline greater than 120 mg/dL [41,52,55,59,61,62,69,71]. Table 3 displays the RTCs for LDL-c.
Table 3.
The effect of extra virgin olive oil on low-density lipoprotein cholesterol (LDL-c) compared with diets with other fats, low-fat diets, and olive oil varying by phenol content.
For the studies of participants having a baseline LDL-c greater than 120 mg/dL, those listing the oil as “extra virgin olive oil” found EVOO oil decreased LDL-c compared with sunflower oil [59] but not compared with corn oil [71] or coconut oil [55]. Two PREDIMED reports reported baseline LDL-c, one at three months [69] and the other at one year [52]. Comparing those in the EVOO group with those in the low-fat diet group, LDL-c was not different at three months but was lower in the LF group at one year. Despite no difference in LDL-c, the EVOO group had lower apoprotein B-100 at three months [69], while there was no difference at one year [52]. In addition, the LF diet group at one year had more atherogenic smaller LDL-c particles [52]. Two studies that compared refined olive oil with one with a total phenol content of 366 mg/kg reported the higher phenol content olive oil lowering LDL-c [41,62]. While use of an EVOO with a total phenol content of 150 mg/kg did not lower the total LDL-c, it did decrease LDL oxidation [61].
For studies with a baseline LDL-c less than 120 mg/dL, one compared EVOO with flaxseed oil and found lower LDL-c after flaxseed oil [56]. Five studies compared refined olive oil with known total phenol content [33,42,53,54,68], with four reporting no difference in the total LDL-c between the comparative groups [33,42,53,68]. Two of these measured LDL oxidation and found a total phenol content of 366 mg/kg reduced LDL oxidation [42,53]. One study with baseline LDL-c less than 100 mg/dL comparing refined olive with EVOO with 500–700 mg/kg total phenols found the EVOO decreased LDL-c after six weeks [54]. The study by Hernaez et al. [53] also reported a decrease in total LDL particles and apo B100 with a total phenol content of 366 mg/kg compared with a refined olive oil.
3.3. High-Density Lipoprotein Cholesterol (HDL-c)
Twenty-one RTCs examined the effect of EVOO on HDL-c [33,35,40,41,42,49,50,51,54,55,56,57,58,59,60,61,62,64,65,68,69]. Of these, eight reported the total phenol content of the EVOO [3,35,41,42,50,54,61,62,68]. Sixteen studies reported a baseline HDL-c, and of these, twelve included men with a mean HDL-c of 45 mg/dL or greater [35,41,42,50,55,56,57,60,61,62,68,69]. One study from Brazil reported baseline HDL-c of less than 25.0 mg/dL, which was the only published study retrieved with the search that included participants with an HDL-c below a healthy range, and HDL-c was not changed after nine weeks compared with soybean oil [51]. Table 4 outlines the RTCs for HDL-c.
Table 4.
The effect of extra virgin olive oil on high-density lipoprotein cholesterol (HDL-c) compared with diets with other fats, low-fat diets, and olive oil varying by phenol content.
Studies that compared the effect on HDL-c of other dietary fats with EVOO report inconsistent results. Flaxseed oil [56], sunflower oil [59], soybean oil [51], and corn oil [60] may all produce similar HDL-c compared with EVOO, while compared with sunflower oil [65], HDL-c levels may decrease. In a study comparing the effect on HDL-c of coconut, butter, and extra virgin olive oil, coconut oil produced the highest HDL-c levels [55], although the mean baseline HDL-c was exceptionally high for all participants (70–77 mg/dL).
Compared with lower-fat diets, three of the five studies showed an increase in HDL-c for EVOO [49,64,69]. Studies testing refined olive oil to known total phenol content suggest specific phenols may be important to assessing change. For example, while two studies comparing refined olive oil with olive oil with a total phenol content of 366 mg/kg found no difference in HDL-c after three weeks [41,62], another study testing a total phenol of 150 mg/kg found higher HDL-c levels compared with refined, also after three weeks of study [61]. Two studies compared HDL-c changes with a refined olive oil and two different levels of total phenols, one less than 200 mg/kg and one greater than 300 mg/kg. Both found that HDL-c increased linearly with the phenol content [33,42]. Interestingly, five studies that compared refined olive oil with olive oil with a total phenol content greater than 300 mg/kg found no difference in the total HDL-c level [35,41,54,62,68], but for two of these studies [35,68] the male participants had a mean baseline HDL-c greater than 50 mg/dL. Despite no change in total HDL-c, a 366 mg/kg total phenol olive oil increased both the level of HDL-2 and the efflux capacity of the HDL-c, suggesting that even if total HDL-c does not increase with EVOO, the inclusion of EVOO may improve HDL function [35].
3.4. Fasting Blood Glucose
Fifteen RCTs examined the effect of EVOO on fasting blood glucose (FBG) [41,43,44,46,48,49,50,51,55,56,57,58,59,62,64], and eight included results for insulin [44,46,49,50,51,58,59,64]. Five studies included the phenol content of the EVOO tested [41,44,48,50,62]. Only one RCT testing the effect of EVOO on FBG stated that the participants were type 2 DM [59]. As the PREDIMED trial included people with type 2 diabetes, at least some of the participants in the two RCTs of PREDIMED with results at both three months [46] and one year [43] would have had type 2 diabetes. Table 5 presents the RTCs for FBG.
Table 5.
The effect of extra virgin olive oil on fasting blood glucose (FBG), insulin, and HOMA-IR compared with diets with other fats, low-fat diets, and olive oil varying by phenol content.
The only study where all participants had type 2 diabetes reported the oil used as “extra virgin” [59]. Compared with sunflower oil, the EVOO decreased both FBG and insulin in two weeks of study. A study comparing EVOO with soybean oil for participants with normal baseline FBG found no difference in FBG after nine weeks, but insulin was lower in the EVOO group, and HOMA-IR (Homeostatic Model Assessment of Insulin Resistance) was borderline lower [51]. In the PREDIMED trial, FBG, insulin, and HOMA-IR were all lower in the EVOO group compared with the LF diet group at three months [46]. An assessment at one year only reported FBG and showed a larger decrease in FBG for the EVOO group compared with the LF group [43].
Three of the studies that included total phenol content compared with refined olive oil found no difference in FBG for participants with normal baseline FBG for a total phenol content of 161 mg/kg [48] or 366 mg/kg total phenols [41,62]. Two studies compared a known phenol content olive oil with an LF diet, and the one with 172 mg/kg found no difference for FBG or insulin [44], while the other using 625 mg/kg resulted in a decrease in both FBG and insulin [50].
3.5. Body Weight
Six RCTs examined the effect of EVOO on weight loss [41,45,49,50,51,62]. Of these, three reported the total phenol content of the EVOO tested [41,50,62]. Four included participants with a mean baseline BMI greater than 25.0 kg/m2 [45,49,50,51]. Table 6 presents the RTCs for body weight.
Table 6.
The effect of extra virgin olive oil on body weight compared with diets with other fats, low-fat diets, and olive oil varying by phenol content.
Only one study compared EVOO with another fat source, which was soybean oil for weight loss [51]. While the weight loss was the same between the interventions for nine weeks of weight loss, the participants assigned to EVOO lost more body fat as measured by dual energy X-ray absorptiometry (DXA).
Three studies compared an LF diet to a diet with EVOO [46,49,50]. Two were crossover studies that compared a diet rich in EVOO (three tablespoons a day) with LF diets for eight weeks of weight loss and then six months of follow-up where the participants self-selected one of the diets. In a study of breast cancer survivors [49], of the 15 who started with the EVOO diet, 12 achieved the weight loss goal of at least 5% from baseline, versus four of the 13 who started with the low-fat diet. Despite the greater weight loss, the women reported consuming more total energy while on the EVOO diet (EVOO: 1466 ± 201 kcals vs. LF: 1142 ± 208; p < 0.001). Nineteen of the 22 women who continued after the initial weight loss phase selected the olive oil diet for follow-up. The six months of follow-up resulted in an increase in both HDL-c level and blood levels of measured carotenoids compared with the end of the active weight loss of eight weeks. In a study of 18 men with recurrent prostate cancer on hormone therapy, the weight loss was comparable for the LF diet compared with the olive oil diet, but again participants reported consuming more total energy while on the olive oil diet (EVOO: 1916 ± 482 kcal vs. 1442 ± 477; p < 0.00) [50]. Thirteen of the 18 participants selected the olive oil diet for follow-up where weight loss was maintained, and there was no further improvement in laboratory measures.
The PREDIMED study assessed weight loss between the diets and found after 4.8 years of study, those assigned to the EVOO diet lost more weight than those assigned to the low-fat diet and had a greater reduction in waist size [45]. In addition, the EVOO participants reported consuming 141 (CI 95% 97–185) more total calories per day compared with the low-fat group (p < 0.001).
Two short-term (each three weeks) studies compared weight loss on refined olive oil with an EVOO with 366 mg/kg; both were healthy men with baseline body mass index (BMI) < 25.0 kg/m2 [41,62]. One study found slightly more weight loss for the EVOO with a phenol concentration of 366 mg/kg [41]. The other one found no difference in weight change between the oils [62].
3.6. Quality Assessment
All articles were given an overall positive rating according to the ANDQCC. The only quality assessment that was not predominately positive was blinded treatment with 16 of the 34 studies not being blinded. This is not an uncommon finding in dietary trials due to the difficulty in blinding food-related interventions. The remaining assessment questions were overwhelmingly positive for all studies.
4. Discussion
Compared with other dietary fats or low-fat diets, there is evidence to support EVOO improving SBP in hypertensive patients [43,46,47,65] and also in patients with clinically normal SBP [66]. Studies reporting the total phenol content of the olive oil suggest that specific phenols may be important as compared with a refined olive oil; one with a total phenol of 161 mg/kg improved SBP in patients with HTN [48], while two studies with total phenols greater than 300 mg/kg did not improve SBP in patients with mild HTN [41,67]. Compared with other dietary fats or low-fat diets, EVOO can decrease LDL-c for baseline values greater than 120 mg/dL [59] and increase HDL-c [49,55,64,65] with a linear increase with higher total phenol content [33,42], and diets including daily EVOO are effective for weight loss [41,45,49] and long-term weight management [49,50,72]. In addition, an EVOO with a total phenol content of at least 150 mg/kg has been shown to decrease LDL oxidation [42,53,61]. The effect of EVOO on FBG compared with other diets is not clear, as few studies have included participants with elevated baseline FBG or type 2 diabetes. However, compared with a lower-fat diet, daily EVOO can improve insulin sensitivity as measured by HOMA-IR [46,50,64]. The shortest time to benefit and the minimum daily amount of EVOO required to improve both SBP and DBP [39], LDL-c [41], and HDL-c [42,61] as reported in the literature are three weeks and 25 mL (approximately two tablespoons) a day, with both diastolic blood pressure and LDL-c possibly needing a total phenol content greater than 300 mg/kg to see a benefit. It is possible that FBG could be improved in as few as two weeks with 25 mL of EVOO [59]; however, more studies on type 2 diabetes would be needed to confirm this.
The relationship of EVOO to decreasing the risk of CHD is potentially through the ability of EVOO to improve the clinical biomarkers for CHD of blood pressure, LDL-c, and HDL-c. While a diet that includes vegetable seed oil may decrease LDL more than EVOO [56,60], a diet that includes daily EVOO will produce healthier LDL as the particles will be larger [52] and are less likely to be oxidized [42,61]. In addition, EVOO has been shown to decrease apo protein B-100 [69], indicating fewer LDL particles. Daily use of EVOO increases HDL-c [49,61,64] and will also improve HDL function [35]. In addition to the clinical biomarkers of blood pressure and lipoproteins, EVOO improves other biomarkers that have been recently related to CHD risk. For example, EVOO decreases inflammation as measured by C-reactive protein compared with refined olive oil [63], a low-fat diet, or a diet that includes tree nuts [73]. Compared with a low-fat diet [17,74] or refined olive oil [63], EVOO improves endothelial function and decreases platelet aggregation by improving several factors related to blood clotting [29].
The ability of EVOO to decrease the risk of the metabolic syndrome and type 2 DM is related to its effects on FBG, insulin, and HOMA-IR, which can all be improved by EVOO compared with either a diet that includes an oil rich in polyunsaturated fat (sunflower oil) [59] or a low- fat diet [43,46,50]. One study that compared an EVOO-rich diet with a sunflower oil diet indicated that EVOO improves insulin-stimulated glucose transport in adipocytes [75]; thus, EVOO may improve insulin sensitivity. While more RCTs are needed of participants who have type 2 diabetes or with elevated FBG and to report the total phenol content of the EVOO used to ensure it is EVOO, these results are promising. Based on the benefits of EVOO seen in current studies, studies that compare EVOO with other oils for treatment of type 2 DM would be also useful.
A diet that includes daily EVOO may be an effective alternative for weight loss and weight management, decreasing the risk and progression of chronic diseases. Compared with a lower-fat diet that does not include EVOO, a diet with three [49] or four [45] tablespoons per day of EVOO may produce greater weight loss than a lower-fat diet. In addition, an EVOO-rich diet may be more acceptable for long-term use [49,50]. Even if the weight loss from a diet that includes daily EVOO is equivalent to one that includes vegetable seed oil, EVOO may produce more fat loss [51]. In vitro and animal studies suggest that the potential mechanisms for the additional fat loss are the results of the phenols in EVOO reducing adipocyte proliferation [76] and enhanced thermogenesis from the activation of brown fat tissue [77]. Animal studies suggest beneficial effects of oleanoic acid and other triterpenoids [78], but human studies are lacking. In addition, compared with a lower-fat diet, a diet with daily EVOO may allow for a greater total energy intake for equivalent weight loss [45,49,50].
The current standards for extra virgin olive oil do not require measurement of phenols or tests that would indirectly assess the phenol content. The US FDA currently attributes the health benefits of EVOO to the monounsaturated fat content of the oil [79]. Yet studies with oils labeled “olive oil”, “refined olive oil”, or “pomace”, which are all rich in monounsaturated fat but lacking phenols, show these olive oil classifications do not provide health benefits compared with oils that would qualify as “extra virgin” or have the phenol content listed [80]. This provides strong evidence that the monounsaturated fat is not the source of the health benefits found with EVOO. Of the 35 RTCs currently available that examine the health benefits of EVOO, only 15 include the phenol content of the oil. The interpretation of studies that simply list the olive oil as “extra virgin” may require caution as the phenol content is not known. The phenol content of extra virgin olive oil is highest in olive oil made close to the harvesting of the olive and will decrease with age and storage [81]. Thus, for maximum health benefits the EVOO should be produced and consumed as close to harvesting the fruit as possible. As the phenol content of the olive oil will decrease over time, and producers who have their olive oil tested for phenol content would do so when the olive oil is first made, it is not likely bottles of EVOO will have the phenol content listed on them. However, if the olive oil analysis includes the measurement of pyropheophytins (PPP) and 1,2-diacyl-glycerols (DAG), which are currently included in the standards for both California [82] and Australia [83] for olive oil, these would provide information on the freshness of the olive oil, which would relate to the phenol content [84].
4.1. Clinical Implications
In prescribing diets to decrease the risk or treatment of a chronic disease, EVOO would be a far superior choice compared with other dietary fats, low-fat diets, or refined olive oil. The daily use of EVOO starting at approximately two tablespoons a day will improve a plethora of risk factors in as few as three weeks. In addition, recommending the use of EVOO to cook vegetables will increase the absorption of carotenoids [85], which are fat-soluble, and could increase vegetable consumption by increasing their palatability [49,86]. Vegetables in Mediterranean countries are traditionally cooked in extra virgin olive oil, which has been shown to transfer the olive oil phenols to the vegetables, which increases the antioxidant capacity of the meal [87].
4.2. Strengths
This review only used RCTs, and all of the 34 articles included have a positive score for quality assessment. The included studies compare extra virgin olive oil with other dietary fats and low-fat diets and by olive oil phenol content, thus proving a broad practical comparison. There are no published reviews that focus specifically on the ability of a specific daily amount of extra virgin olive oil to improve risk factors for chronic diseases. The published work to date typically includes all types of olive oil when assessing health benefits [80,88], and the current study indicates this would not be appropriate, as it is only extra virgin olive oil that would provide health benefits.
4.3. Limitations
There are several limitations in our paper relating to the currently available RCTs comparing EVOO with other diets that were included in this review. A major limitation is that most of the studies do not include the phenol content of the olive oil, so studies simply listing “extra virgin olive oil” should be interpreted with caution. Most of the currently available studies were of short duration, and participants had healthy levels of the risk factor being studied. In addition, most of the studies took place in EU populations and in countries where extra virgin olive oil has been part of diet for centuries. Future research should focus on using an EVOO with a known phenol content, participants with unhealthy values for the risk factor(s) being tested, a larger sample size, and populations outside of the EU. As most of the benefits were realized in three weeks or less, longer time periods might not be critical; however, it is not currently known if additional benefits could be realized with a longer time of exposure to EVOO.
Author Contributions
Conceptualization: M.M.F.; methodology: M.M.F., A.T. and C.I.; formal analysis: M.M.F.; investigation: M.M.F.; data curation: M.M.F., A.T. and C.I.; writing- original draft preparation: MF; writing-reviewn and editing: M.M.F., A.T. and C.I. All authors have read and agreed to the published version of the manuscript.
Funding
This research received no external funding.
Conflicts of Interest
The authors declare no conflict of interest.
References
- WHO. Noncommunicable Diseases. 2022. Available online: https://www.who.int/news-room/fact-sheets/detail/noncommunicable-diseases#:~:text=People%20at%20Risk (accessed on 30 March 2023).
- Itsiopoulos, C.; Mayr, H.L.; Thomas, C.J. The anti-inflammatory effects of a Mediterranean diet: A review. Curr. Opin. Clin. Nutr. Metab. Care 2022, 25, 415–422. [Google Scholar] [CrossRef]
- West Virginia Department of Health & Human Resources. Dietary Guidelines for Americans; USDA: Washington, DC, USA, 2015.
- Heart Foundation. Dietary Position Statement: Heart Healthy Eating Pattern; Heart Foundation: Subiaco, Australia, 2019. [Google Scholar]
- Costentino, F.; Grant, P.J.; Aboyans, V.; Cliford, F.B.; Ceriello, A.; Delgado, V.; Federici, M.; Filippatos, G.; Grobbee, D.E.; Hansen, T.B.; et al. ESC Guidelines on diabetes, pre-diabetes, and cardiovascular diseases developed in collaboration with the EASD: The Task Force for diabetes, pre-diabetes, and cardiovascular diseases of the European Society of Cardiology (ESC) and the European Association for the Study of Diabetes (EASD). Eur. Heart J. 2019, 41, 255–323. [Google Scholar]
- Lichtenstein, A.H.; Appel, L.J.; Vadiveloo, M.; Hu, F.B.; Kris-Etherton, P.M.; Rebholz, C.M.; Sacks, F.M.; Thorndike, A.N.; Van Horn, L.; Wylie-Rosett, J.; et al. 2021 Dietary Guidance to Improve Cardiovascular Health: A Scientific Statement from the American Heart Association. Circulation 2021, 144, e472–e487. [Google Scholar] [CrossRef] [PubMed]
- Public Health England. The Eatwell Guide. 2018. Available online: https://www.gov.uk/government/publications/the-eatwell-guide (accessed on 6 April 2023).
- Ireland FSAo. Scientific Recommendations for Healthy Eating Guidelines in Ireland. 2011. Available online: https://www.fsai.ie/science_and_health/healthy_eating.html (accessed on 6 April 2023).
- The Australian Dietary Guidelines. 2013. Available online: https://www.eatforhealth.gov.au/ (accessed on 6 April 2023).
- Choe, E.; Min, D.B. Mechanisms and factors for edible oil oxidation. Compr. Rev. Food Sci. Food Saf. 2006, 5, 13. [Google Scholar] [CrossRef]
- Hammad, S.; Pu, S.; Jones, P.J. Current Evidence Supporting the Link Between Dietary Fatty Acids and Cardiovascular Disease. Lipids 2016, 51, 507–517. [Google Scholar] [CrossRef] [PubMed]
- Parry, S.A.; Rosqvist, F.; Cornfield, T.; Barrett, A.; Hodson, L. Oxidation of dietary linoleate occurs to a greater extent than dietary palmitate in vivo in humans. Clin. Nutr. 2021, 40, 1108–1114. [Google Scholar] [CrossRef]
- Estruch, R.; Ros, E.; Salas-Salvado, J.; Covas, M.I.; Corella, D.; Aros, F.; Gomez-Gracia, E.; Ruiz-Gutierrez, V.; Fiol, M.; Lapetra, J.; et al. Primary Prevention of Cardiovascular Disease with a Mediterranean Diet Supplemented with Extra-Virgin Olive Oil or Nuts. N. Engl. J. Med. 2018, 378, e34. [Google Scholar] [CrossRef]
- Martinez-Gonzalez, M.A.; Dominguez, L.J.; Delgado-Rodriguez, M. Olive oil consumption and risk of CHD and/or stroke: A meta-analysis of case-control, cohort and intervention studies. Br. J. Nutr. 2014, 112, 248–259. [Google Scholar] [CrossRef]
- Salas-Salvado, J.; Bullo, M.; Estruch, R.; Ros, E.; Covas, M.-I.; Ibarrola-Jurado, N.; Corella, D.; Aros, F.; Gomez-Gracia, F.; Ruiz-Gutierrez, V.; et al. Prevention of diabetes with Mediterranean diets: A subgroup analysis of a randomized trial. Ann. Intern. Med. 2014, 160, 1–10. [Google Scholar] [CrossRef]
- Schwingshackl, L.; Lampousi, A.M.; Portillo, M.P.; Romaguera, D.; Hoffmann, G.; Boeing, H. Olive oil in the prevention and management of type 2 diabetes mellitus: A systematic review and meta-analysis of cohort studies and intervention trials. Nutr. Diabetes 2017, 7, e262. [Google Scholar] [CrossRef]
- Esposito, K.; Marfella, R.; Ciotola, M. Effect of a mediterranean-style diet on endothelial dysfunction and markers of vascular inflammation in the metabolic syndrome: A randomized trial. JAMA 2004, 292, 1440–1446. [Google Scholar] [CrossRef] [PubMed]
- Martinez-Lapiscina, E.H.; Clavero, P.; Toledo, E.; Julian, B.S.; Sanchez-Tainta, A.; Corella, D.; Lamuela-Raventos, R.M.; Martinez, J.A.; Martinez-Gonzalez, M. Virgin olive oil supplementation and long-term cognition: The PREDIMED-NAVARRA randomized, trial. J. Nutr. Health Aging 2013, 17, 544–552. [Google Scholar] [CrossRef] [PubMed]
- Martin-Moreno, J.M.; Willett, W.C.; Gorgojo, L.; Banegas, J.R.; Rodriguez-Artalejo, F.; Fernandez-Rodriguez, J.C.; Maisonneuve, P.; Boyle, P. Dietary fat, olive oil intake and breast cancer risk. Int. J. Cancer 1994, 58, 774–780. [Google Scholar] [CrossRef] [PubMed]
- Mourouti, N.; Panagiotakos, D.B. The beneficial effect of a Mediterranean diet supplemented with extra virgin olive oil in the primary prevention of breast cancer among women at high cardiovascular risk in the PREDIMED Trial. Evid. Based Nurs. 2016, 19, 71. [Google Scholar] [CrossRef] [PubMed]
- Sealy, N.; Hankinson, S.E.; Houghton, S.C. Olive oil and risk of breast cancer: A systematic review and dose-response meta-analysis of observational studies. Br. J. Nutr. 2021, 125, 1148–1156. [Google Scholar] [CrossRef] [PubMed]
- Trichopoulou, A. Olive oil and breast cancer. Cancer Causes Control 1995, 6, 475–476. [Google Scholar] [CrossRef]
- Hashim, Y.Z.; Eng, M.; Gill, C.I.; McGlynn, H.; Rowland, I.R. Components of olive oil and chemoprevention of colorectal cancer. Nutr. Rev. 2005, 63, 374–386. [Google Scholar] [CrossRef]
- Stoneham, M.; Goldacre, M.; Seagroatt, V.; Gill, L. Olive oil, diet and colorectal cancer: An ecological study and a hypothesis. J Epidemiol. Community Health 2000, 54, 756–760. [Google Scholar] [CrossRef]
- Soriguer, F.; Rojo-Martinez, G.; Goday, A.; Bosch-Comas, A.; Bordiú, E.; Caballero-Díaz, F.; Calle-Pascual, A.; Carmena, R.; Casamitjana, R.; Castaño, L.; et al. Olive oil has a beneficial effect on impaired glucose regulation and other cardiometabolic risk factors. Di@bet.es study. Eur. J. Clin. Nutr. 2013, 67, 911–916. [Google Scholar] [CrossRef]
- Razquin, C.; Martinez, J.A.; Martinez-Gonzalez, M.A.; Mitjavila, M.T.; Estruch, R.; Marti, A. A 3 years follow-up of a Mediterranean diet rich in virgin olive oil is associated with high plasma antioxidant capacity and reduced body weight gain. Eur. J. Clin. Nutr. 2009, 63, 1387–1393. [Google Scholar] [CrossRef]
- Buckland, G.; Mayen, A.L.; Agudo, A.; Travier, N.; Navarro, C.; Huerta, J.M.; Chirlaque, M.D.; Barricarte, A.; Ardanaz, E.; Moreno-Iribas, C.; et al. Olive oil intake and mortality within the Spanish population (EPIC-Spain). Am. J. Clin. Nutr. 2012, 96, 142–149. [Google Scholar] [CrossRef] [PubMed]
- Food and Agriculture Organization of the United Nations; World Health Organization. Standard for Olive Oils and Olive Pomace Oils, Codex Stan 33-1981. 2015. Available online: https://static.oliveoiltimes.com/library/codexalimentarius-olive-oil-standard.pdf (accessed on 6 April 2023).
- Yubero-Serrano, E.M.; Lopez-Moreno, J.; Gomez-Delgado, F.; Lopez-Miranda, J. Extra virgin olive oil: More than a healthy fat. Eur. J. Clin. Nutr. 2019, 72, 8–17. [Google Scholar] [CrossRef] [PubMed]
- Baiano, A.T.C.; Viggiani, I. Nobile MAD Effects of cultivars and location on quality, phenolic content and antioxidant activity of extra-virgin olive oils. J. Am. Oil Chem. Soc. 2013, 90, 103–111. [Google Scholar] [CrossRef]
- Bendini, A.; Cerretani, L.; Carrasco-Pancorbo, A.; Gómez-Caravaca, A.M.; Segura-Carretero, A.; Fernández-Gutiérrez, A.; Lercker, G.; Simal-Gandara, J. Phenolic molecules in virgin olive oils: A survey of their sensory properties, health effects, antioxidant activity and analytical methods. An overview of the last decade. Molecules 2007, 12, 1679–1719. [Google Scholar] [CrossRef] [PubMed]
- Parkinson, L.; Cicerale, S. The Health Benefiting Mechanisms of Virgin Olive Oil Phenolic Compounds. Molecules 2016, 21, 1734. [Google Scholar] [CrossRef] [PubMed]
- Weinbrenner, T.; Fito, M.; de la Torre, R.; Saez, G.T.; Rijken, P.; Tormos, C.; Coolen, S.; Albaladejo, M.F.; Abanades, S.; Schroder, H.; et al. Olive oils high in phenolic compounds modulate oxidative/antioxidative status in men. J. Nutr. 2004, 134, 2314–2321. [Google Scholar] [CrossRef]
- Tung, W.C.; Rizzo, B.; Dabbagh, Y.; Saraswat, S.; Romanczyk, M.; Codorniu-Hernández, E.; Rebollido-Rios, R.; Needs, P.W.; Kroon, P.A.; Rakotomanomana, N.; et al. Polyphenols bind to low density lipoprotein at biologically relevant concentrations that are protective for heart disease. Arch. Biochem. Biophys. 2020, 694, 108589. [Google Scholar] [CrossRef]
- Hernaez, A.; Fernandez-Castillejo, S.; Farras, M.; Catalan, U.; Subirana, I.; Montes, R.; Sola, R.; Montes, R.; Munoz-Aguayos, D.; Gelabert-Gorgues, A.; et al. Olive oil polyphenols enhance high-density lipoprotein function in humans: A randomized controlled trial. Arterioscler. Thromb. Vasc. Biol. 2014, 34, 2115–2119. [Google Scholar] [CrossRef]
- Ferrari, R. Writing narrative style literature reviews. Med. Writ. 2015, 24, 230–235. [Google Scholar] [CrossRef]
- Dietetics AoNa. Evidence Analysis Manual: Steps in the Academy Evidence Analysis Process. 2016. Available online: https://www.andeal.org/evidence-analysis-manual (accessed on 8 January 2021).
- Kargin, D.; Tomaino, L.; Serra-Majem, L. Experimental Outcomes of the Mediterranean Diet: Lessons Learned from the Predimed Randomized Controlled Trial. Nutrients 2019, 11, 2991. [Google Scholar] [CrossRef]
- Bondia-Pons, I.; Schroder, H.; Covas, M.I.; Castellote, A.I.; Kaikkonen, J.; Poulsen, H.E.; Gaddi, A.V.; Machowetz, A.; Kiesewetter, H.; López-Sabater, M.C. Moderate consumption of olive oil by healthy European men reduces systolic blood pressure in non-Mediterranean participants. J. Nutr. 2007, 137, 84–87. [Google Scholar] [CrossRef]
- Campos, V.P.; Portal, V.L.; Markoski, M.M.; Quadros, A.S.; Bersch-Ferreira, C.; Garavaglia, J.; Marcadenti, A. Effects of a healthy diet enriched or not with pecan nuts or extra-virgin olive oil on the lipid profile of patients with stable coronary artery disease: A randomised clinical trial. J. Hum. Nutr. Diet 2020, 33, 439–450. [Google Scholar] [CrossRef] [PubMed]
- Castaner, O.; Covas, M.I.; Khymenets, O.; Nyyssonen, K.; Konstantinidou, V.; Zunft, H.-F.; de la Torre, R.; Muñoz-Aguayo, D.; Vila, J.; Fitó, M. Protection of LDL from oxidation by olive oil polyphenols is associated with a downregulation of CD40-ligand expression and its downstream products in vivo in humans. Am. J. Clin. Nutr. 2012, 95, 1238–1244. [Google Scholar] [CrossRef] [PubMed]
- Covas, M.I.; Nyyssonen, K.; Poulsen, H.E.; Kaikkonen, J.; Zunft, K.-J.F.; Kiesewetter, H.; Gaddi, A.; de la Torre, R.; Mursu, J.; Baumler, H.; et al. The effect of polyphenols in olive oil on heart disease risk factors: A randomized trial. Ann. Intern. Med. 2006, 145, 333–341. [Google Scholar] [CrossRef] [PubMed]
- Domenech, M.; Roman, P.; Lapetra, J.; de la Corte, F.J.G.; Sala-Vila, A.; de la Torre, R.; Corella, D.; Salas-Salvadó, J.; Ruiz-Gutiérrez, V.; Lamuela-Raventós, R.-M.; et al. Mediterranean diet reduces 24-hour ambulatory blood pressure, blood glucose, and lipids: One-year randomized, clinical trial. Hypertension 2014, 64, 69–76. [Google Scholar] [CrossRef]
- Dos Santos, J.L.; Portal, V.L.; Markoski, M.M.; de Quadros, A.S.; Bersch-Ferreira, A.; Marcadenti, A. Effect of pecan nuts and extra-virgin olive oil on glycemic profile and nontraditional anthropometric indexes in patients with coronary artery disease: A randomized clinical trial. Eur. J. Clin. Nutr. 2022, 76, 827–834. [Google Scholar] [CrossRef]
- Estruch, R.; Martinez-Gonzalez, M.A.; Corella, D.; Salas-Salvadó, J.; Fitó, M.; Chiva-Blanch, G.; Fiol, M.; Gómez-Gracia, E.; Arós, F.; Lapetra, J.; et al. Effect of a high-fat Mediterranean diet on bodyweight and waist circumference: A prespecified secondary outcomes analysis of the PREDIMED randomised controlled trial. Lancet Diabetes Endocrinol. 2019, 7, e6–e17. [Google Scholar] [CrossRef]
- Estruch, R.; Martinez-Gonzalez, M.A.; Corella, D.; Salas-Salvado, J.; Ruiz-Gutierrez, V.; Covas, M.I.; Fiol, M.; Gomez-Gracia, E.; Lopez-Sabater, M.C.; Vinyoles, E.; et al. Effects of a Mediterranean-style diet on cardiovascular risk factors: A randomized trial. Ann. Intern. Med. 2006, 145, 1–11. [Google Scholar] [CrossRef]
- Ferrara, L.A.; Raimondi, A.S.; d’Episcopo, L.; Guida, L.; Russo, A.D.; Marotta, T. Olive oil and reduced need for antihypertensive medications. Arch. Intern. Med. 2000, 160, 837–842. [Google Scholar] [CrossRef]
- Fito, M.; Cladellas, M.; de la Torre, R.; Marti, J.; Alcantara, M.; Pujadas-Bastardes, M.; Marrugat, J.; Bruguera, J.; Lopez-Sabater, M.C.; Vila, J.; et al. Antioxidant effect of virgin olive oil in patients with stable coronary heart disease: A randomized, crossover, controlled, clinical trial. Atherosclerosis 2005, 181, 149–158. [Google Scholar] [CrossRef]
- Flynn, M.M.; Reinert, S.E. Comparing an olive oil-enriched diet to a standard lower-fat diet for weight loss in breast cancer survivors: A pilot study. J. Womens Health 2010, 19, 1155–1161. [Google Scholar] [CrossRef] [PubMed]
- Flynn, M.M.; Cunningham, J.; Renzulli, J.; Mega, A. Including extra virgin olive oil may more improve glycemic control despite similar weight loss compared to the diet recommended by the Prostate Cancer Foundation: A randomized, pilot study. J. Cancer Ther. 2017, 8, 880–890. [Google Scholar] [CrossRef]
- Galvao Candido, F.; Xavier Valente, F.; da Silva, L.E.; Coelho, O.G.L.; Peluzio, M.D.C.G.; Alfenas, R.D.C.G. Consumption of extra virgin olive oil improves body composition and blood pressure in women with excess body fat: A randomized, double-blinded, placebo-controlled clinical trial. Eur. J. Nutr. 2018, 57, 2445–2455. [Google Scholar] [CrossRef]
- Hernaez, A.; Castaner, O.; Goday, A.; Ros, E.; Pintó, X.; Estruch, R.; Salas-Salvadó, J.; Corella, D.; Arós, F.; Serra-Majem, L.; et al. The Mediterranean Diet decreases LDL atherogenicity in high cardiovascular risk individuals: A randomized controlled trial. Mol. Nutr. Food Res. 2017, 61, 1601015. [Google Scholar] [CrossRef]
- Hernaez, A.; Remaley, A.T.; Farras, M.; Fernández-Castillejo, S.; Subirana, I.; Schröder, H.; Fernández-Mampel, M.; Muñoz-Aguayo, D.; Sampson, M.; Solà, R.; et al. Olive Oil Polyphenols Decrease LDL Concentrations and LDL Atherogenicity in Men in a Randomized Controlled Trial. J. Nutr. 2015, 145, 1692–1697. [Google Scholar] [CrossRef]
- Khandouzi, N.; Zahedmehr, A.; Nasrollahzadeh, J. Effect of polyphenol-rich extra-virgin olive oil on lipid profile and inflammatory biomarkers in patients undergoing coronary angiography: A randomised, controlled, clinical trial. Int. J. Food Sci. Nutr. 2021, 72, 548–558. [Google Scholar] [CrossRef] [PubMed]
- Khaw, K.T.; Sharp, S.J.; Finikarides, L.; Afzal, I.; Lentjes, M.; Luben, R.; Forouhi, N.G. Randomised trial of coconut oil, olive oil or butter on blood lipids and other cardiovascular risk factors in healthy men and women. BMJ Open 2018, 8, e020167. [Google Scholar] [CrossRef] [PubMed]
- Kontogianni, M.D.; Vlassopoulos, A.; Gatzieva, A.; Farmaki, A.-E.; Katsiougiannis, S.; Panagiotakos, D.B.; Kalogeropoulos, N.; Skopouli, F.N. Flaxseed oil does not affect inflammatory markers and lipid profile compared to olive oil, in young, healthy, normal weight adults. Metabolism 2013, 62, 686–693. [Google Scholar] [CrossRef]
- Kozic Dokmanovic, S.; Kolovrat, K.; Laskaj, R.; Jukić, V.; Vrkić, N. Effect of Extra Virgin Olive Oil on Biomarkers of Inflammation in HIV-Infected Patients: A Randomized, Crossover, Controlled Clinical Trial. Med. Sci. Monit. 2015, 21, 2406–2413. [Google Scholar]
- Kruse, M.; von Loeffelholz, C.; Hoffmann, D.; Pohlmann, A.; Seltmann, A.-C.; Osterhoff, M.; Hornemann, S.; Pivovarova, O.; Rohn, S.; Jahreis, G.; et al. Dietary rapeseed/canola-oil supplementation reduces serum lipids and liver enzymes and alters postprandial inflammatory responses in adipose tissue compared to olive-oil supplementation in obese men. Mol. Nutr. Food Res. 2015, 59, 507–519. [Google Scholar] [CrossRef]
- Madigan, C.; Ryan, M.; Owens, D.; Collins, P.; Tomkin, G.H. Dietary unsaturated fatty acids in type 2 diabetes: Higher levels of postprandial lipoprotein on a linoleic acid-rich sunflower oil diet compared with an oleic acid-rich olive oil diet. Diabetes Care 2000, 23, 1472–1477. [Google Scholar] [CrossRef] [PubMed]
- Maki, K.C.; Lawless, A.L.; Kelley, K.M.; Kaden, V.N.; Geiger, C.J.; Dicklin, M.R. Corn oil improves the plasma lipoprotein lipid profile compared with extra-virgin olive oil consumption in men and women with elevated cholesterol: Results from a randomized controlled feeding trial. J. Clin. Lipidol. 2015, 9, 49–57. [Google Scholar] [CrossRef]
- Marrugat, J.; Covas, M.I.; Fito, M.; Schröder, H.; Miró-Casas, E.; Gimeno, E.; López-Sabater, M.C.; de la Torre, R.; Farré, M. Effects of differing phenolic content in dietary olive oils on lipids and LDL oxidation—A randomized controlled trial. Eur. J. Nutr. 2004, 43, 140–147. [Google Scholar] [CrossRef]
- Martin-Pelaez, S.; Castaner, O.; Konstantinidou, V.; Subirana, I.; Muñoz-Aguayo, D.; Blanchart, G.; Gaixas, S.; De La Torre, R.; Farré, M.; Sáez, G.T.; et al. Effect of olive oil phenolic compounds on the expression of blood pressure-related genes in healthy individuals. Eur. J. Nutr. 2017, 56, 663–670. [Google Scholar] [CrossRef]
- Moreno-Luna, R.; Munoz-Hernandez, R.; Miranda, M.L.; Costa, A.F.; Jimenez-Jimenez, L.; Vallejo-Vaz, A.J.; Muriana, F.J.G.; Villar, J.; Stiefel, P. Olive oil polyphenols decrease blood pressure and improve endothelial function in young women with mild hypertension. Am. J. Hypertens. 2012, 25, 1299–1304. [Google Scholar] [CrossRef]
- Paniagua, J.A.; de la Sacristana, A.G.; Sanchez, E.; Romero, I.; Vidal-Puig, A.; Berral, F.J.; Escribano, A.; Moyano, M.J.; Peréz-Martinez, P.; López-Miranda, J.; et al. A MUFA-rich diet improves posprandial glucose, lipid and GLP-1 responses in insulin-resistant subjects. J. Am. Coll. Nutr. 2007, 26, 434–444. [Google Scholar] [CrossRef] [PubMed]
- Perona, J.S.; Canizares, J.; Montero, E.; Sánchez-Domínguez, J.M.; Catala, A.; Ruiz-Gutierrez, V. Virgin olive oil reduces blood pressure in hypertensive elderly subjects. Clin. Nutr. 2004, 23, 1113–1121. [Google Scholar] [CrossRef]
- Rozati, M.; Barnett, J.; Wu, D.; Handelman, G.; Saltzman, E.; Wilson, T.; Li, L.; Wang, J.; Marcos, A.; Ordovás, J.M.; et al. Cardio-metabolic and immunological impacts of extra virgin olive oil consumption in overweight and obese older adults: A randomized controlled trial. Nutr. Metab. 2015, 12, 28. [Google Scholar] [CrossRef]
- Sarapis, K.; Thomas, C.J.; Hoskin, J.; George, E.S.; Marx, W.; Mayr, H.L.; Kennedy, G.; Pipingas, A.; Willcox, J.C.; Prendergast, L.A.; et al. The Effect of High Polyphenol Extra Virgin Olive Oil on Blood Pressure and Arterial Stiffness in Healthy Australian Adults: A Randomized, Controlled, Cross-Over Study. Nutrients 2020, 12, 2272. [Google Scholar] [CrossRef]
- Sarapis, K.; George, E.S.; Marx, W.; Mayr, H.L.; Willcox, J.; Powell, K.L.; Folasire, O.S.; Lohning, A.E.; Prendergast, L.A.; Itsiopoulos, C.; et al. Extra-virgin olive oil improves HDL lipid fraction but not HDL-mediated cholesterol efflux capacity: A double-blind, randomized, controlled, cross-over study (OLIVAUS). Br. J. Nutr. 2022. [Google Scholar] [CrossRef] [PubMed]
- Sola, R.; Fito, M.; Estruch, R.; Salas-Salvadó, J.; Corella, D.; De La Torre, R.; Muñoz, M.A.; López-Sabater, M.D.C.; Martínez-González, M.-A.; Arós, F.; et al. Effect of a traditional Mediterranean diet on apolipoproteins B, A-I, and their ratio: A randomized, controlled trial. Atherosclerosis 2011, 218, 174–180. [Google Scholar] [CrossRef] [PubMed]
- Toledo, E.; Hu, F.B.; Estruch, R.; Buil-Cosiales, P.; Corella, D.; Salas-Salvadó, J.; Covas, M.I.; Arós, F.; Gómez-Gracia, E.; Fiol, M.; et al. Effect of the Mediterranean diet on blood pressure in the PREDIMED trial: Results from a randomized controlled trial. BMC Med. 2013, 11, 207. [Google Scholar] [CrossRef] [PubMed]
- Maki, K.C.; Lawless, A.L.; Kelley, K.M.; Kaden, V.N.; Geiger, C.J.; Palacios, O.M.; Dicklin, M.R. Corn oil intake favorably impacts lipoprotein cholesterol, apolipoprotein and lipoprotein particle levels compared with extra-virgin olive oil. Eur. J. Clin. Nutr. 2017, 71, 33–38. [Google Scholar] [CrossRef] [PubMed]
- Estruch, R.; Martinez-Gonzalez, M.A.; Corella, D.; Salas-Salvadó, J.; Fitó, M.; Chiva-Blanch, G.; Fiol, M.; Gómez-Gracia, E.; Arós, F.; Lapetra, J.; et al. Retracted: Effect of a high-fat Mediterranean diet on bodyweight and waist circumference: A prespecified secondary outcomes analysis of the PREDIMED randomised controlled trial. Lancet Diabetes Endocrinol. 2016, 4, 666–676. [Google Scholar] [CrossRef]
- Barcelo, F.; Perona, J.S.; Prades, J.; Funari, S.S.; Gomez-Gracia, E.; Conde, M.; Estruch, R.; Ruiz-Gutierrez, V. Mediterranean-style diet effect on the structural properties of the erythrocyte cell membrane of hypertensive patients: The Prevencion con Dieta Mediterranea Study. Hypertension 2009, 54, 1143–1150. [Google Scholar] [CrossRef]
- Storniolo, C.E.; Casillas, R.; Bullo, M.; Castañer, O.; Ros, E.; Sáez, G.T.; Toledo, E.; Estruch, R.; Ruiz-Gutiérrez, V.; Fitó, M.; et al. A Mediterranean diet supplemented with extra virgin olive oil or nuts improves endothelial markers involved in blood pressure control in hypertensive women. Eur. J. Nutr. 2017, 56, 89–97. [Google Scholar] [CrossRef]
- Ryan, M.; McInerney, D.; Owens, D.; Collins, P.; Johnson, A.; Tomkin, G. Diabetes and the Mediterranean diet: A beneficial effect of oleic acid on insulin sensitivity, adipocyte glucose transport and endothelium-dependent vasoreactivity. QJM 2000, 93, 85–91. [Google Scholar] [CrossRef]
- Rigacci, S.; Stefani, M. Nutraceutical Properties of Olive Oil Polyphenols. An Itinerary from Cultured Cells through Animal Models to Humans. Int. J. Mol. Sci. 2016, 17, 843. [Google Scholar] [CrossRef]
- Melguizo Rodriguez, L.; Illescas-Montes, R.; Costela-Ruiz, V.J.; García-Martínez, O. Stimulation of brown adipose tissue by polyphenols in extra virgin olive oil. Crit. Rev. Food Sci. Nutr. 2021, 61, 3481–3488. [Google Scholar] [CrossRef]
- Claro-Cala, C.M.; Jimenez-Altayo, F.; Zagmutt, S.; Rodriguez-Rodriguez, R. Molecular Mechanisms Underlying the Effects of Olive Oil Triterpenic Acids in Obesity and Related Diseases. Nutrients 2022, 14, 1606. [Google Scholar] [CrossRef]
- FDA. FDA Response to Petition for a Qualified Health Claim for Oleic Acid in Edible Oils and Reduced Risk of Coronary Heart Disease. 2017. Available online: https://www.fda.gov/media/118199/download (accessed on 26 February 2021).
- Tome-Carneiro, J.; Crespo, M.C.; Lopez de Las Hazas, M.C.; Visioli, F.; Davalos, A. Olive oil consumption and its repercussions on lipid metabolism. Nutr. Rev. 2020, 78, 952–968. [Google Scholar] [CrossRef] [PubMed]
- Agbiolab. Polyphenols and Antioxidants in Olive Oil; Agbiolab: Durham, CA, USA, 2014. [Google Scholar]
- California Department of Food & Agriculture. 2020–2021 Grade and Labeling Standards for Olive Oil, Refined-Olive Oil and Olive-Pomace Oil; California Department of Food & Agriculture: Sacramento, CA, USA, 2020.
- Miller, P.; Ravetti, L. Australian Standards Olive Oil and Olive-Pomace Oils; Australian Olive Association: Melbourne, Australia, 2011. [Google Scholar]
- Guillaume, C.; Gertz, C.; Ravetti, L. Pyropheophytin a and 1, 2-diacyl-glycerols over time under different storage conditions in natural olive oils. J. Am. Oil Chem. Soc. 2014, 91, 697–709. [Google Scholar] [CrossRef]
- Brown, M.J.; Ferruzzi, M.G.; Nguyen, M.L.; Cooper, D.; Eldridge, A.L.; Schwartz, S.J.; White, W.S. Carotenoid bioavailability is higher from salads ingested with full-fat than with fat-reduced salad dressings as measured with electrochemical detection. Am. J. Clin. Nutr. 2004, 80, 396–403. [Google Scholar] [CrossRef] [PubMed]
- Flynn, M.; Reinert, S.; Schiff, A.R. A Six-week Cooking Program of Plant-based Recipes Improves Food Security, Body Weight, and Food Purchases for Food Pantry Clients. J. Hunger. Environ. Nutr. 2013, 1, 73–84. [Google Scholar] [CrossRef]
- Ramirez-Anaya Jdel, P.; Samaniego-Sanchez, C.; Castaneda-Saucedo, M.C.; Villalón-Mir, M.; De La Serrana, H.L.-G. Phenols and the antioxidant capacity of Mediterranean vegetables prepared with extra virgin olive oil using different domestic cooking techniques. Food Chem. 2015, 188, 430–438. [Google Scholar] [CrossRef] [PubMed]
- Jabbarzadeh-Ganjeh, B.; Jayedi, A.; Shab-Bidar, S. The effects of olive oil consumption on blood lipids: A systematic review and dose-response meta-analysis of randomised controlled trials. Br. J. Nutr. 2022. [Google Scholar] [CrossRef]
Disclaimer/Publisher’s Note: The statements, opinions and data contained in all publications are solely those of the individual author(s) and contributor(s) and not of MDPI and/or the editor(s). MDPI and/or the editor(s) disclaim responsibility for any injury to people or property resulting from any ideas, methods, instructions or products referred to in the content. |
© 2023 by the authors. Licensee MDPI, Basel, Switzerland. This article is an open access article distributed under the terms and conditions of the Creative Commons Attribution (CC BY) license (https://creativecommons.org/licenses/by/4.0/).