
Cannabidiol (CBD) Dosing: Plasma Pharmacokinetics and Effects on Accumulation in Skeletal Muscle, Liver and Adipose Tissue

1
School of Chemical Engineering, University of Birmingham, Birmingham B15 2TT, UK
2
Legal Products Group Ltd., 26 St Thomas Pl, Ely, Cambridgeshire CB7 4EX, UK
*
Author to whom correspondence should be addressed.
Nutrients 2022, 14(10), 2101; https://doi.org/10.3390/nu14102101
Submission received: 24 March 2022
/
Revised: 10 May 2022
/
Accepted: 12 May 2022
/
Published: 18 May 2022
(This article belongs to the Topic Applied Sciences in Functional Foods)
Abstract
:Oral cannabidiol (CBD) consumption is widespread in North America and Europe, as it has analgesic, neuroprotective and antitumor effects. Although oral CBD consumption in humans affords beneficial effects in epileptic and inflammatory states, its pharmacokinetics and subsequent uptake into tissue are largely unknown. This study investigated plasma pharmacokinetics and accumulation of CBD in gastrocnemius muscle, liver and adipose tissue in adult rats following oral gavage. CBD was fed relative to body mass at 0 (control), 30, 115, or 230 mg/Kg/day for 28 days; with 6 males and 6 females per dosing group. Pharmacokinetics were assessed on day 1 and day 28 in the group receiving CBD at 115 mg/Kg/day. The rise in tissue CBD was closely related to specific pharmacokinetic parameters, and adipose tissue levels were ~10 to ~100 fold greater than liver or muscle. Tissue CBD levels were moderately correlated between adipose and muscle, and adipose and liver, but were highly correlated for liver and muscle. CBD feeding resulted in several gender-specific effects, including changes in pharmacokinetics, relationships between pharmacokinetic parameters and tissue CBD and differences in tissue CBD levels. CBD accumulation in mammalian tissues has the potential to influence receptor binding and metabolism; therefore, the present findings may have relevance for developing oral dosing regimens.
Keywords:
CBD; cannabidiol; cannabis; cannabinoids; pharmacokinetics; muscle; liver; adipose; fat; metabolism1. Introduction
Cannabidiol (CBD) or 2-[(6R)-6-isopropenyl-3-methyl-2-cyclohexen-1-yl]-5-pentyl-1,3-benzene-diol) is naturally present in Cannabis sativa L. and is one of 500 compounds and 100 cannabinoids identified in cannabis [1]. CBD has a tetrahydrobiphenyl skeleton: a bicyclic core and is an adduct formed by the monoterpene, p-cymene and the alkylresorcinol derivative, olivetol [2]. Of the phytogenic cannabinoids discovered to date, CBD is considered atypical because of its promising effects in a wide variety of diseases [3]. Importantly, although CBD is psychoactive [4], unlike Tetrahydrocannabinol (THC), it is not psychotogenic [5,6]. These unusual characteristics make CBD particularly relevant for drug development [3].
Tetrahydrocannabinol (THC) has been the traditional focus of cannabinoid research; however, recent in vitro and in vivo studies highlight CBD’s potential in an increasing range of therapeutic applications. CBD has anti-inflammatory, analgesic, anticonvulsant, anxiolytic, anti-epileptic, neuroprotective and antitumor properties [7]. It is thought to act via diverse molecular targets, including G protein coupled receptors and the cannabinoid receptors CB1 and CB2. Receptors for serotonin, adenosine and opioids are also obvious targets for CBD action and are widely distributed throughout the bodies of mammals [3].
Despite the recognised benefits of CBD administration, there are considerable knowledge gaps regarding its pharmacokinetics and metabolism [8]. For example, many human and animal studies administered CBD intravenously [9], which limits their relevance to oral consumption. These routes of administration bypass absorption by the lymphatic system and increase hepatic first pass extraction [10]. Other human trials, though providing CBD orally, also co-administered THC [11,12,13]. This has a similar structure [14] and lipophilicty (log P = 5.91) [15] to CBD and these characteristics affect CBD pharmacokinetics and metabolism [16]. These effects are partially due to similarities in the time course for plasma appearance [17] and receptor binding [16]. Research on plasma CBD pharmacokinetics may have practical value for determining optimal oral dose–response effects to maximise tissue accumulation. For example, it has recently been proposed that peak plasma concentration (Cmax) may correlate with the pharmacological effect of a substance, while the time to peak plasma concentration (tmax) may relate to the onset of a substance’s action [18]. The effects of long-term feeding of CBD on tissue accumulation are also poorly understood, as most studies have focused solely on THC [19] or co-consumption of THC and CBD from cannabis [20]. The amount of CBD that accumulates in tissue is likely to be more important than pharmacokinetics for exerting its well-documented effects on membrane channels, receptors and enzymes [3].
The present investigation was performed on male and female adult rats to give easy access to relevant tissues and provide novel insights into mammalian CBD metabolism. Three physiologically relevant oral CBD doses were chosen to investigate its dose response accumulation in muscle, liver and adipose tissue. In addition, plasma CBD pharmacokinetics were evaluated in response to acute and chronic intake. This approach allows for the relationship between plasma pharmacokinetics and tissue accumulation to be determined, providing novel insights that are relevant to human research on CBD safety and efficacy.
2. Materials and Methods
2.1. Animals
All experiments were performed in accordance with the Guide for the Care and Use of Laboratory Animals [21].
Animals were 48 Sprague–Dawley CD IGS rats—comprising 24 males and 24 females—which were nulliparous and non-pregnant. All rats were 7 to 8 weeks old and were considered to be adults upon initiation of the trial. On commencing the trial, the variation in body mass was less than ± 20% of the mean mass for each gender. The rats were housed in individual cages with a 12-h light–dark cycle. Temperature and humidity were set at 21 ± 2 °C and 30–70%, respectively, with 10 air changes per hour. Animals were familiarised with the housing facility for at least five days before starting experimental procedures. Tap water and food (Certified Envigo Teklad Global Rodent Diet, Envigo Teklad Inc, Indianapolis, IN, USA) were both provided ad libitum during the familarisation period and experimental trial. Animals were fasted for 15 h prior to pharmacokinetic investigations.
2.2. CBD Characterisation and Administration
The stock CBD for dosing was supplied by cbdMD (manufacturer, Charlotte, NC, USA) and comprised 32.95% CBD in medium chain triglyceride oil (Batch No. 02751). The CBD concentration was independently determined by Liquid Chromatography–Diode Array Detection [22] against a reference standard (Sigma-Aldrich, Saint Louis, MI, USA). The CBD stock was stored at ambient conditions in the dark and prepared on the day of feeding by mixing with medium chain triglycerides (MCT). Each CBD dosing was used within 2 h of preparation and maintained on a stir plate up to the point of administration.
Animals were randomly assigned to four dosing groups, each comprised of 6 males and 6 females. The stock CBD was freshly diluted each day into a medium chain triglyceride carrier and delivered in a volume of 5 mL/kg via oral gavage. Each group was fed CBD relative to body mass at doses of 0 mg/kg/day as a control comprised solely of the CBD carrier, 30 mg/kg/day (“low dose”); 115 mg/kg/day (“medium dose”) and 230 mg/kg/day (“high dose”). This dosing protocol was maintained at the same time of day ± 2 h for 28 days.
2.3. Plasma Pharmacokinetics
In animals fed the 115 mg/kg/day CBD dose, pharmacokinetics were assessed both on Day 1 and Day 28. Blood samples were collected before dosing and then again at 0.5, 2, 4, 8, 12 and 24 hrs. The procedure comprised isoflurane anesthesia prior to collecting 200 μl of blood sublingually into K2EDTA tubes. These were kept on ice until centrifuged at 10,000× g for 10 min at 4 °C, and the resulting plasma was stored at −80 °C until analysis.
CBD concentrations in plasma were used to produce a best fit curve, and the following pharmacokinetic data were derived for each animal using a single compartment model; (i) peak plasma concentration (Cmax), (ii) time to peak plasma concentration (tmax); (iii) area under the curve up to 24 h (AUC0-24); (iv) the absorption rate constant (Ka) and (v) the elimination rate constant (Ke).
2.4. Surgical Procedures
Following an overnight fast, animals were euthanized using CO2 asphyxiation, which was immediately followed by a collection of tissue samples. At least 150 mg of tissue was collected from the following sites: mid-lateral gastrocnemius of the upper leg (without any tendon tissue), the mid portion of the liver’s medial lobe; the epididymal fat in males, and periovarian fat in females. The wet weight of the tissue samples was recorded before immediately freezing at −80 °C.
2.5. Validation of Tissue CBD Measurement
Tissue CBD concentrations were assessed using ultra high performance liquid chromatography with mass spectrometer detection. Multiple steps were used to validate the CBD assay for use on tissue samples. CBD calibration standards were prepared using 1.0 mg/mL CBD (Sigma-Aldrich, USA; batch No. SLCC9048). This was dissolved in rat plasma containing K2EDTA (Bio-IVT, Westbury, NY, USA) to give final concentrations of 5, 10, 40, 100, 400, 1000, 3000, 4500 and 5000 ng/mL. These standards were used to generate a calibration curve, which was linear across the full concentration range (r > 0.995), and across all runs there was a bias of −1.15 to 1.21%, with a CV of 5.21 to 7.68%. Internal calibration standards were prepared using 1.0 mg/mL Cannabidiol-d3 (Cerilliant, Round Rock, TX, USA; batch No. FE12121902). This was dissolved in rat plasma containing K2EDTA (Bio-IVT, USA) to give final concentrations of 5, 15, 200, 2500 and 4000 ng/mL. These standards were used to generate a linear internal standard calibration curve (r > 0.995), and across all runs there was a bias of −7.80 to 0.73%, with a CV of 0.96 to 4.2%. “Matrix blank” samples were comprised of rat plasma with K2EDTA (Bio-IVT, USA) with no analyte or internal standard. Running these samples confirmed that at the limit of detection neither CBD or Cannabidiol-d3 were present in the rat plasma supplied by (Bio-IVT, USA).
Samples of rat plasma with K2EDTA (Bio-IVT, USA) were spiked with Cannabidiol-d3 to give a final concentration of 4 ng/mL and simultaneously spiked with CBD to give final concentrations of 0.3, 50 and 80 ng/mL. These were used to confirm that the internal standard did not interfere with CBD measurement at a concentration of 4 ng/mL. For CBD standards at the lower limit of 5 ng/mL, the respective CV and bias were 5.0% and −1.1%, with these values being 4.8% and −3.0% for the upper limit of 500 ng/mL. For tissue samples, the inter assay CV was in the range of 4.0 to 6.5% with a respective bias of 2.6% and 0%. The absolute recovery of Cannabidiol-d3 ranged from 66 to 68% with a CV of 7.1%, while the absolute recovery of CBD ranged from 88 to 93% with a CV of 6.3%. This resulted in a normalized recovery of CBD in tissue samples between 133 and 139% with a CV of 2.7%.
2.6. Measurement of CBD in Tissue Samples
Tissue samples were thawed at room temperature in 15 mL centrifuge tubes, which also included around 50 Lysing Matrix D beads (1.4 mm diameter) and one to two 6 mm ceramic spheres. To each sample tube, 2 mL of phosphate buffered saline (PBS) was added before being placed on a Geno Grinder 2010 and homogenized until the tissue PBS mix became viscous. An additional 3 mL of PBS was added to each tube and homogenized until the tissue cells were fully dispersed.
Prepared tissue samples were first thawed and then vortex mixed. 20 μl of each prepared tissue or CBD calibration standard was pipetted into separate 2 ml wells of a 96-well plate. To each sample or standard, 80 μl of internal standard solution was added, comprising 50 ng/mL Cannabidiol-d3 in methanol with 10 mM ammonium bicarbonate (1:9 v/v). The wells were then sealed and vortex mixed for 1 min at 2000 g, before adding 300 μl of 0.5% furfuryl alcohol in acetonitrile to each well and then vortex mixing for 5 min. The plate was then centrifuged at 4500× g for 10 min and 120 μl of the supernatant was removed and added to a 96-well plate. The plate wells were then sealed and vortex mixed for 5 min, and the plate was centrifuged at 2000× g for 1 min. Preparation of the tissue samples to the point of injection onto the column were performed at room temperature.
The extracted samples were analysed for CBD using a Shimadzu LC-30AD UHPLC, with an XBridge BEH C18, 2.5 μm, 50 mm × 2.1 mm column (Xbridge, San Jose, CA, USA), maintained at 40 °C. The injection volume was 20 μl and a mobile phase gradient was used to separate CBD which comprised 0.1% formic acid in water (Mobile phase A) and 0.1% formic acid in acetonitrile in water (Mobile phase B) with a flow rate of 0.6 ml/min. The mobile phase gradient comprised 40% mobile phase B at 0.5 min, increasing to 95% mobile phase B at 4.0 min. This was maintained until 5.0 min, before returning to 40% mobile phase B at 5.2 min, resulting in a total run time of 6 min. CBD was detected using an AB Sciex 6500 Triple Quad Mass Spectrometer MS/MS detector with positive ion electrospray ionisation. The ion spray voltage was 5500 V, with a Turbo ion spray temperature of 550 °C, using nitrogen as the curtain gas, CAD gas, nebulising gas and auxiliary gas. Using these parameters, the multiple reaction monitoring transitions were 315.2 to 193.1 (dwell time 50 s) for CBD and 318.2 to 196.1 (dwell time 50 s) for Cannabidiol-d3. With these settings, the retention time for CBD and Cannabidiol-d3 was ~3 min, with excellent separation from adjacent peaks in all samples. A standard curve was generated for CBD with a lower limit of detection of 5 ng/mL and an upper limit of 5000 ng/mL. CBD and Cannabidiol-d3 concentrations were both determined by peak area, relative to CBD and Cannabidiol-d3 standards. The reported CBD values follow normalisation for recovery of the Cannabidiol-d3 internal standard.
2.7. Additional Measurements
The body mass of each animal was assessed at least twice during the familiarisation period, on day 1 of the study and at 7-day intervals thereafter. The mass of food consumed was measured throughout the experimental period. Daily cage side observations were recorded for 5 days prior to the first CBD dosing and were continued until the end of the experiment. These observations were related to skin, fur, eyes and mucus membranes, occurrence of secretions and excretions, and autonomic activity (including lacrimation, piloerection, pupil size and unusual respiratory patterns). Subjective changes in gate, posture, responses to handling, as well as clonic or tonic movements and bizarre behavior were also recorded.
2.8. Statistics
The study was designed to determine if (i) there was a dose response effect regarding the accumulation of CBD in tissue samples, relative to the control; (ii) if there are gender differences in the dose response, (iii) determine if changes in CBD concentrations in one tissue were associated with changes in other tissues, (iv) to determine if there are any associations between plasma pharmacokinetic parameters and changes in tissue CBD levels and (v) to determine if there were gender differences in the associations between plasma pharmacokinetics and tissue CBD accumulation. To address these questions, a multivariate analysis of variance of variance (MANOVA) was employed with three outcome variables (fat, muscle and liver) and two co-variates (groups and gender with interaction) were conducted to assess global differences between genders for tissue CBD responses. A two-factor analysis of variance (ANOVA) with interaction between gender and dose groups was conducted to measure global differences in CBD between genders in adipose, muscle and liver at day 28. When significant differences were detected between groups, pairwise t-tests between genders at each dose level were conducted and the corresponding p-values were adjusted using the Holm method.
Pairwise Pearson’s product–moment correlations were used to investigate the strength of relationship in change in CBD levels between adipose, liver and muscle tissues.
The association between the pharmacokinetic data Cmax, tmax, AUC0-24, Ka and Ke on Day 1 and tissue CBD accumulation were investigated using linear regression models. These were fitted using the change in CBD in adipose, muscle and liver as dependent variables and the pharmacokinetic data on day 1 as the main independent variables, with gender as an additional covariate. An identical approach was used to evaluate the relationship between pharmacokinetic parameters on Day 28 and tissue CBD accumulation.
Data are presented as means ± SEM, and the alpha level for statistical significance was set at p < 0.05. To facilitate interpretation of the data, confidence intervals (CI) are reported when p > 0.01.
3. Results
All animals successfully completed the experimental interventions. Body mass changes between Day 1 and Day 28 were non-significant for males and females, both within and across groups. In addition, there were no significant differences in food intake within or across groups over time. Cage observations did not reveal behavioral changes over the course of the study in any of the groups.
Plasma pharmacokinetics were evaluated on Day 1 and Day 28, and pharmacokinetic profiles for males and females are shown in Figure 1 and Figure 2, respectively. The results of single compartment modeling of the plasma data are shown in Table 1, and modeled data was used in all subsequent statistical analyses.
Pharmacokinetic parameters are shown in Table 1, and significant correlations were observed between individual parameters as a mixed gender group, both on Day 1 and Day 28. These were Ka and tmax (r = −0.98, p < 0.001), Ka and Ke (r = 1, p < 0.001) and Ka and AUC0-24 (r = −0.57, p < 0.05; CI −0.86, 0.01). When split by gender, there were significant correlations between Ka and tmax (r = −0.98, p < 0.001) and Ka and Ke (r = 1.00, p < 0.001) for both females and males on Day 1. On Day 28, there were still significant correlations between Ka and tmax, together with Ka and Ke for females (both r = −1.00, p < 0.001); however, in males only, Ka and Ke were significantly correlated (r = −1.00, p < 0.001). As a mixed gender group, there were no significant changes in pharmacokinetic parameters between Day 1 and Day 28 of CBD feeding. However, males showed a significant reduction in tmax between Day 1 and Day 28 (p < 0.05; CI 0.13, 1.12). During the same time period, females showed an increase in Cmax (p < 0.05; CI −1084, −103). In addition, at 28 Days AUC0-24 was significantly greater in females than in males (p < 0.05; CI −43,599, −317).
In response to CBD feeding, a similar pattern of accumulation was seen in all three tissues (Table 2), with higher values in adipose tissue than muscle or liver. In adipose, CBD was elevated by both the medium and high doses (respectively, p < 0.05; CI 5.73, 226.61 and p < 0.05; CI −1.84, 219.04). In muscle and liver, CBD was elevated in response to both the medium and high doses (Table 2).
The correlations in CBD levels across the different tissues are shown in Table 3. There were “moderate” correlations (r > 0.3) between CBD levels for adipose and muscle (p < 0.05, CI 0.03, 0.54) and adipose and liver (p < 0.01); with a “high” correlation (r > 0.6) between CBD in muscle and liver (p < 0.001).
In females, there were significant correlations between CBD accumulation between muscle and adipose tissue (r = 0.49, p < 0.05; CI 0.11, 0.75); adipose tissue and liver (r = 0.43, p < 0.05; CI 0.03, 0.71) and muscle and liver (r = 0.86, p < 0.001). In contrast, only the correlation between adipose tissue and liver was significant for males (r = 0.62, p < 0.001).
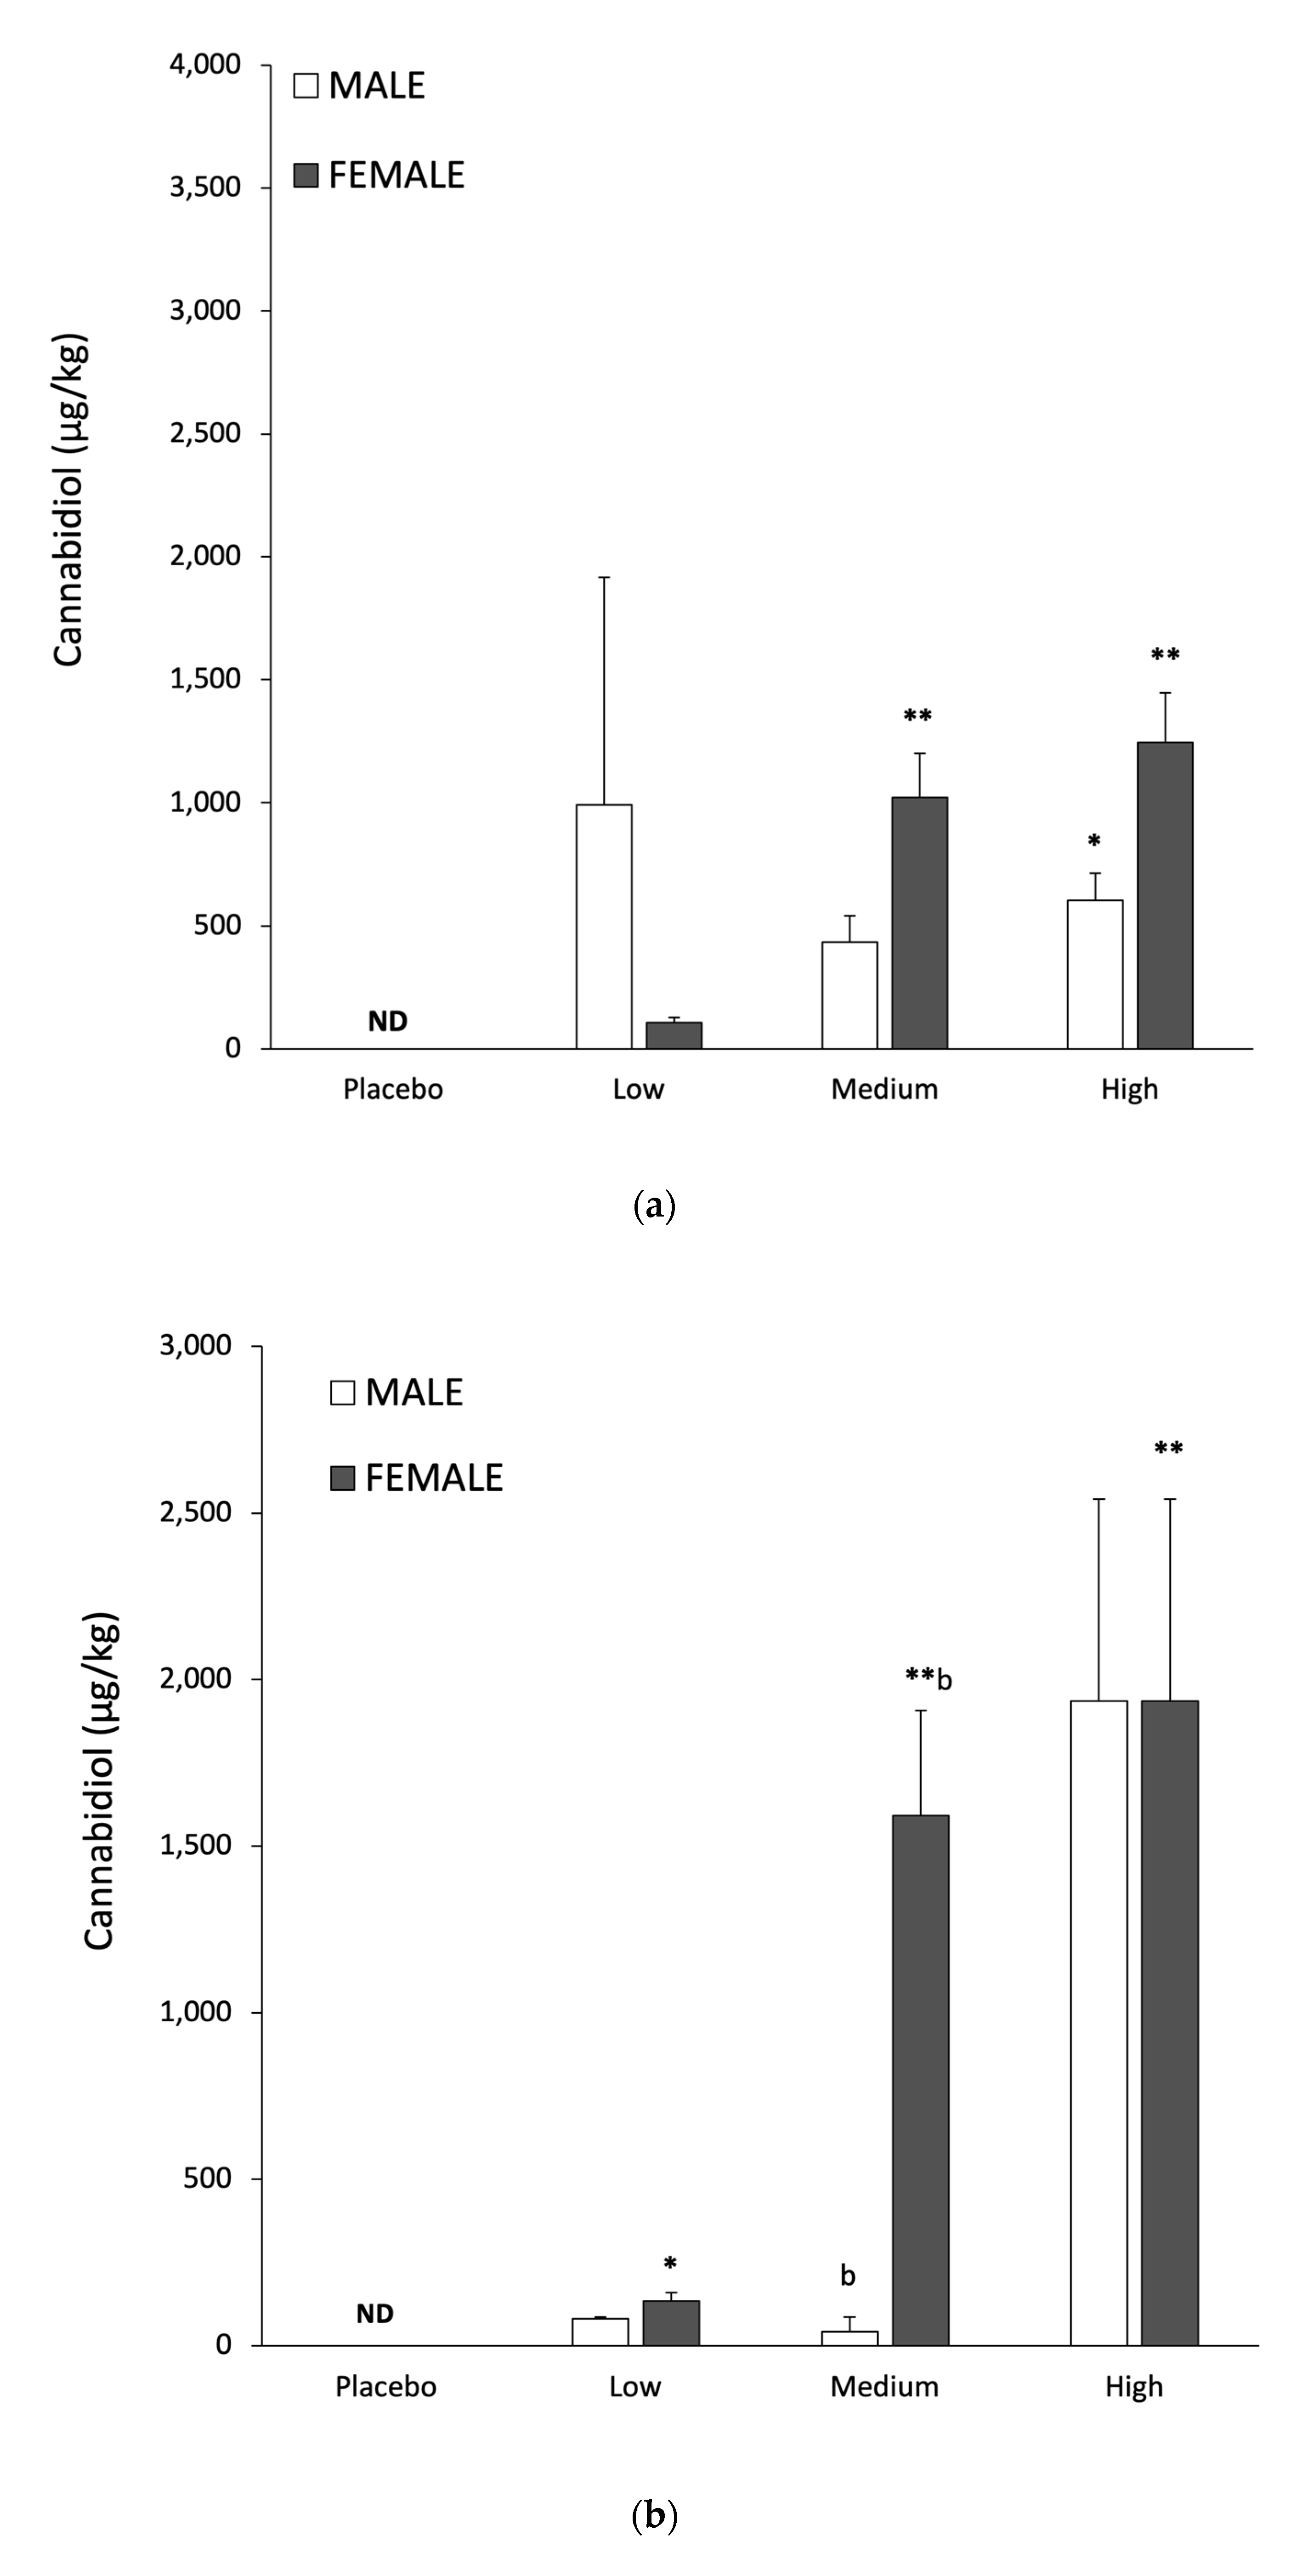
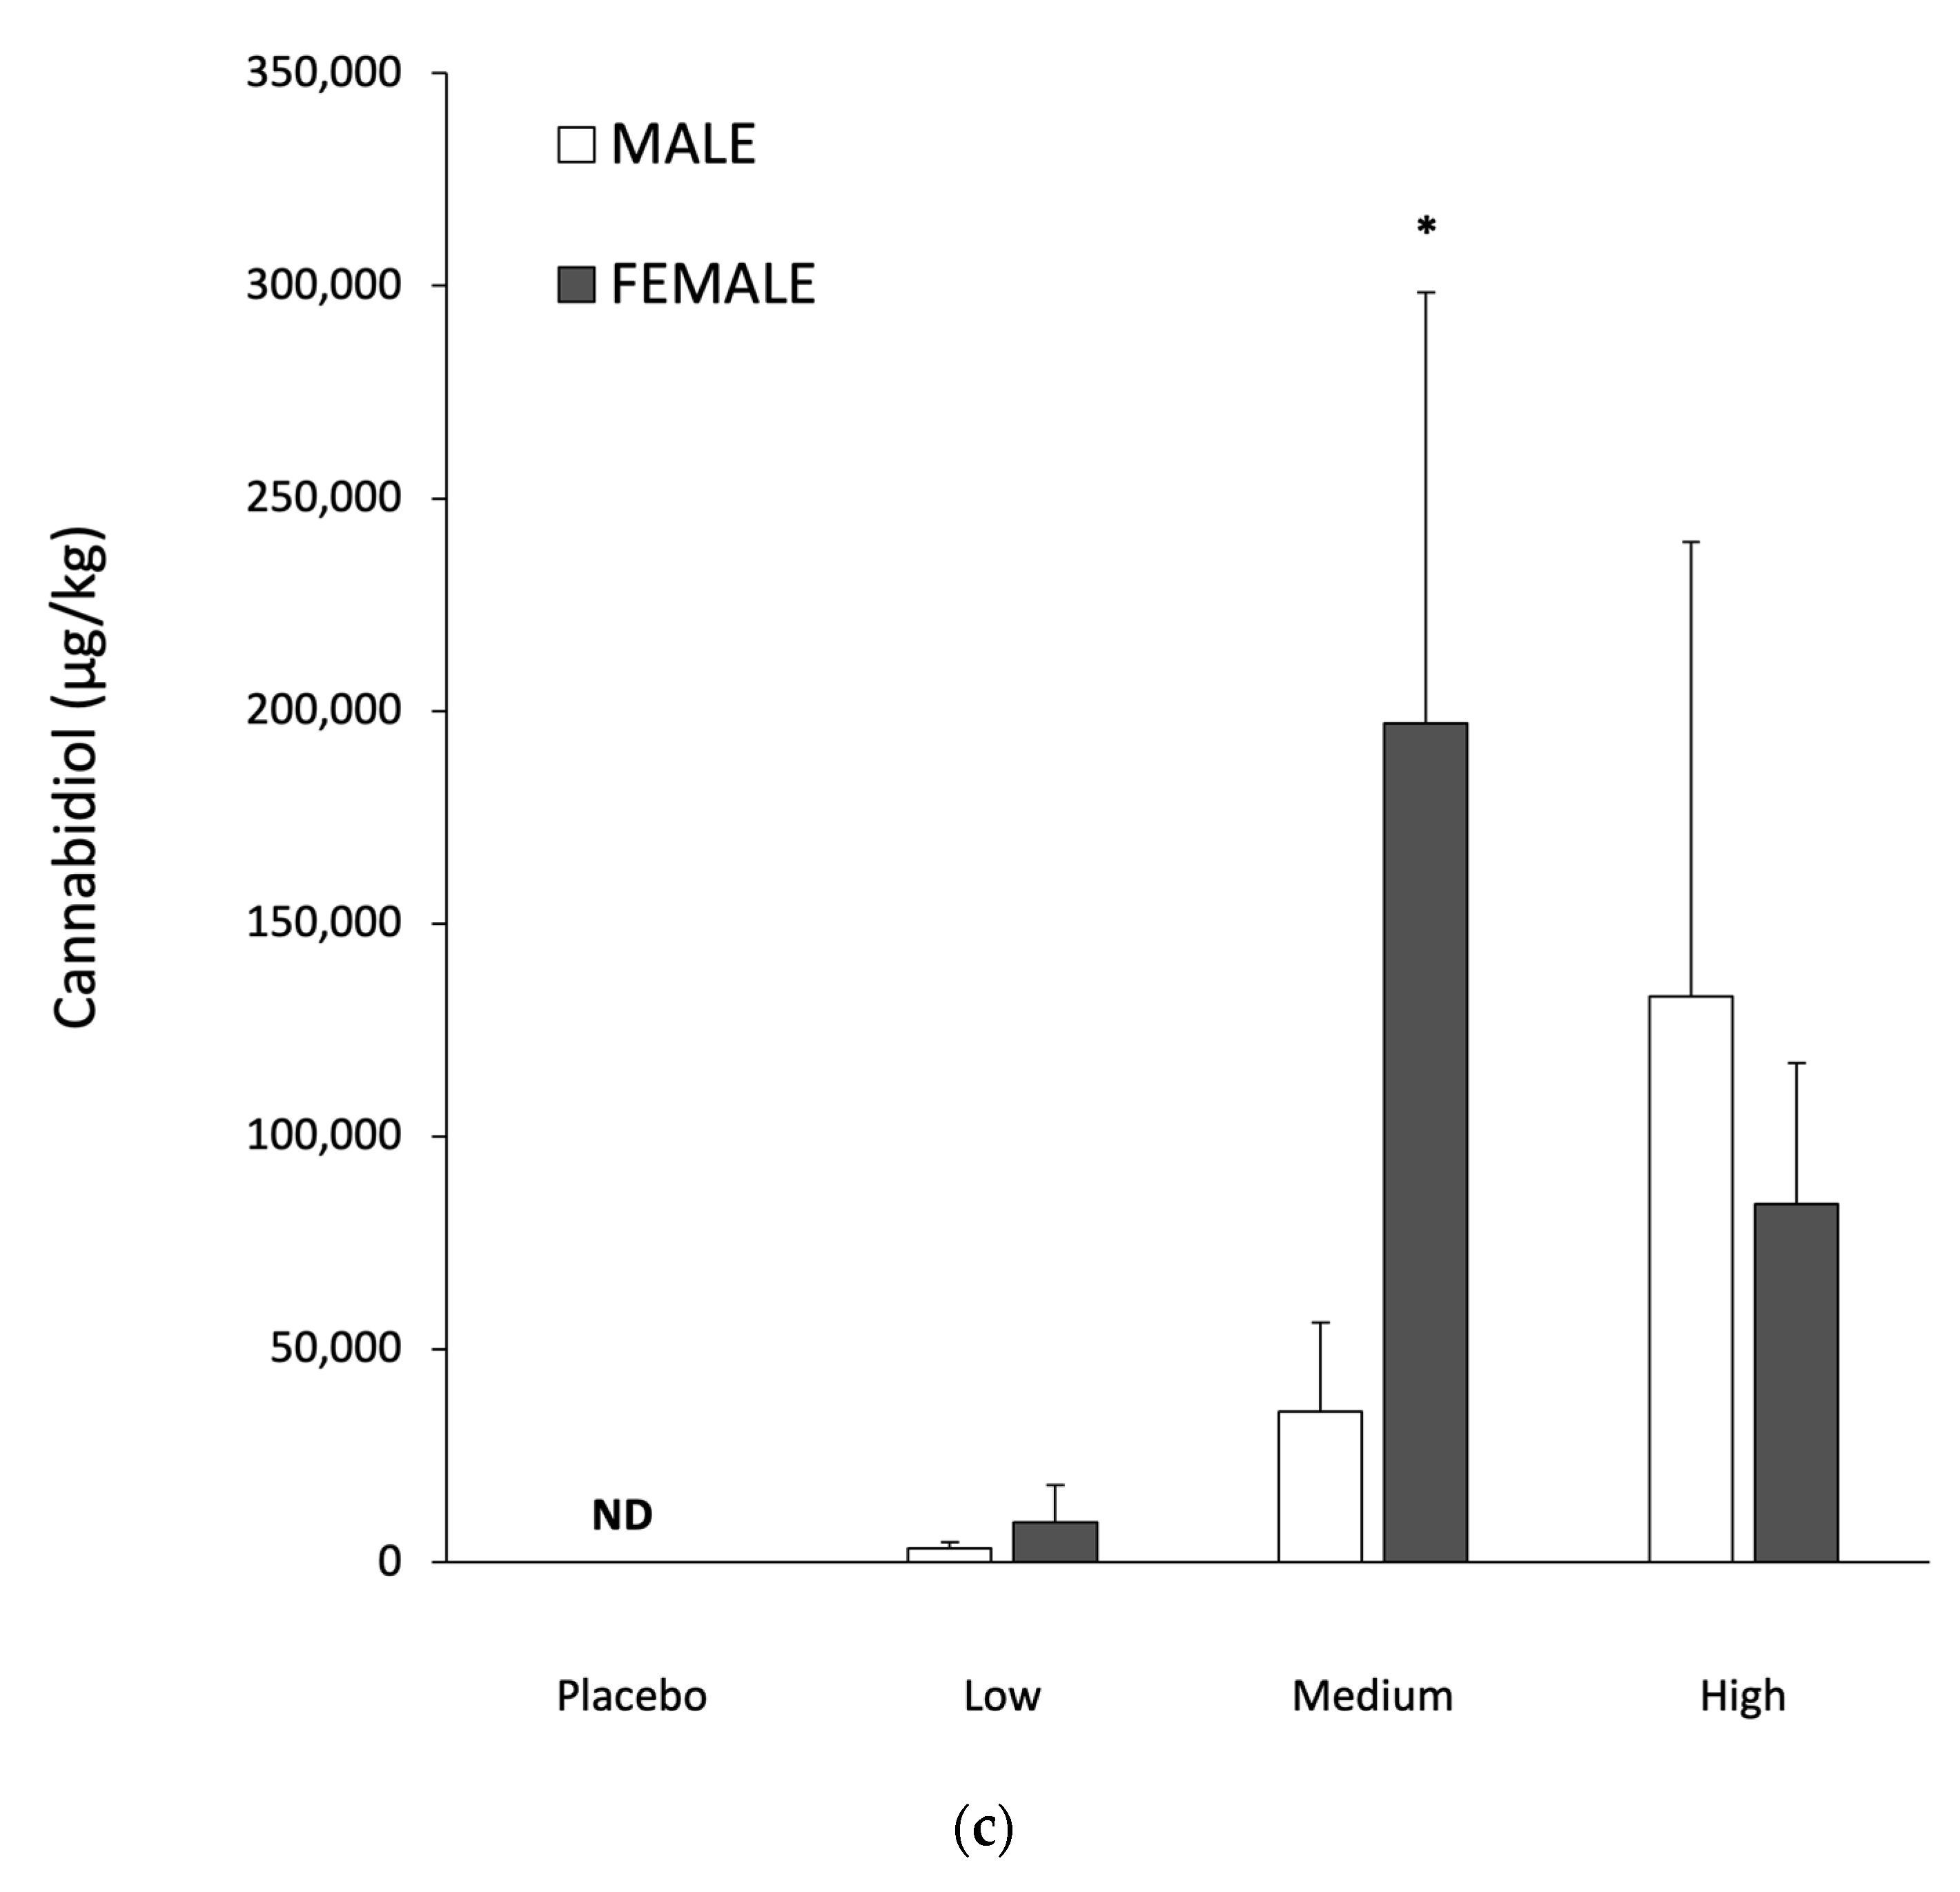
Gender specific differences in tissue CBD responses following low, medium and high dosing are shown in Table 4. There was a significant difference in global tissue CBD responses between genders (p < 0.01, F-Test). A two-factor ANOVA did not reveal statistically significant gender differences between adipose or muscle CBD levels. In contrast, liver CBD levels were higher in females than in males (p < 0.01), with a significant difference between genders with the medium CBD dose (p < 0.05; CI −2.10, −0.48). With CBD in adipose as a response variable and with dose and gender interaction as covariates, there were no significant increases in males. Adipose tissue CBD was significantly elevated in females, but only for the medium dose (p < 0.01). In muscle, females showed significant increases with both medium and high CBD doses (respectively, p < 0.01 and p < 0.001); while males only showed significant increases with the high dose (p < 0.05; CI 0.02, 1.19). Finally, when liver CBD levels in females were measured relative to controls, significant increases were observed with the medium and high doses (both p < 0.001), while the changes in males were non-significant.
Relationship between Plasma Pharmacokinetics and Tissue CBD Accumulation
With a mixed gender group, positive correlations were observed for Ka and Ke on Day 1 and adipose tissue CBD concentrations (both r = 0.73, p < 0.01). In this group, there was a negative correlation between tmax on Day 1 and adipose tissue CBD concentrations (r = −0.66, p < 0.05; CI −0.90, −0.14). No pharmacokinetic parameters were related to adipose tissue CBD levels in females; in contrast, Ka and Ke on Day 28 were both negatively associated with adipose tissue CBD levels in males (both r = −0.99, p < 0.01).
On Day 1 with a mixed gender group, there were positive correlations between Ka and Ke, and muscle CBD (both r = 0.76, p < 0.01). The mixed gender group showed a negative correlation between tmax on Day 1 and muscle CBD (r = −0.82, p < 0.001). In males, tmax decreased between Day 1 and Day 28 (Table 1), and this change was positively correlated with muscle CBD levels (r = 0.83, p < 0.05; CI 0.05, 0.98).
In the mixed gender group, there was a negative correlation between tmax on Day 1 and liver CBD (r = −0.58, p < 0.01; CI −0.87, −0.13). In the mixed gender group, Cmax on Day 28 was positively correlated with CBD in liver (r = 0.59, p < 0.05; CI 0.02, 0.97). In males, tmax decreased between Day 1 and Day 28 (Table 1), and the change in tmax was positively correlated with liver CBD levels (r = 0.82, p < 0.05; CI 0.03, 0.98). A summary of the significant correlations between pharmacokinetic parameters and tissue CBD concentrations is given in Table 5.
4. Discussion
The present study investigated tissue CBD concentrations in response to control (no CBD) and “low”, “medium” and “high” oral doses. Despite recent interest in tissue CBD concentrations [23,24,25], no study has assessed the relationship between dose and uptake into muscle, liver or adipose. In the medium dose group, pharmacokinetics were also assessed to provide initial insights into the relationship to specific parameters and tissue uptake. The disparity in pharmacokinetics between oral and intravenous (iv) administration are relevant to understanding CBD metabolism in free living humans and the efficacy of CBD products. This study provides unique insights into mammalian CBD metabolism regarding pharmacokinetics after acute and chronic intake, subsequent accumulation in tissue, with additional gender specific evaluation of these parameters. There is currently a paucity of data on oral CBD pharmacokinetics, and a recent review highlighted the need for better understanding in this field [8]. Therefore, the prima facie findings from the current investigation have value in understanding CBD metabolism in mammals. These may have direct relevance for the development of optimal oral dosing regimens for humans with regards to therapeutic interventions and dietary supplementation for health.
A single compartment model was considered most appropriate to describe CBD distribution and elimination in response to oral dosing. This model assumes the body acts as a single uniform compartment, from which CBD can both enter and leave. Although the simplest pharmacokinetic models of drug distribution involve intravenous administration, they lack the construct validity provided by oral ingestion.
Gender specific pharmacokinetic data are presented in Figure 1 and Figure 2, with modeled pharmacokinetic data in Table 1. tmax directly relates to the rate of CBD absorption and reflects multiple underlying processes. These include gastric motility, glomerular filtration rate, hormones and differences in hepatic enzyme activity [26,27,28,29]. In the present investigation, tmax was ~8 h for both male and female rats. This is consistent with human studies providing a similar relative CBD dose. For example, tmax was 3 hrs when an acute dose comprising 800 mg CBD (~10 mg/kg bodyweight) was given to male and female cannabis smokers [30], while Taylor and co-workers [31] reported a tmax of 5 hrs in healthy males and females, in response to a 6000 mg CBD bolus (~80 mg/kg). The slightly longer tmax in the present study may reflect the higher relative CBD dose (i.e., 115 mg/kg) and data on healthy humans supports this view [18]. Increasing the oral CBD bolus from 10 mg to 100 mg resulted in tmax increasing from 3 hrs to 3.5 hrs [32]. Following 28 days of CBD feeding in males, we found tmax was reduced from 8 hrs 25 mins to 7 hrs 47 mins, although this effect was not seen in females. Human studies involving repeated CBD administration to men and women for 7 days reported reductions in tmax from 5 to 3 hrs [31]. The mechanisms underpinning this rapid change in tmax with repeated dosing are unclear. They might be modulated by increased lipid transporter activity and/or gut blood flow, in combination with increased liver metabolism and clearance [33,34]. However, it is noteworthy that neither Ka or Ke were significantly altered in males or females following 28 days of CBD feeding (Table 1). It is also surprising that the values for Ka and Ke were almost identical (Table 1). One possibility is that the best-fit lines generated by the single compartment model may have attenuated differences between Ka and Ke. This could be explored in future studies by increasing the frequency and/or duration of blood sampling.
Cmax values in this study were approximately double those reported in healthy men and women [31]. This may reflect the higher CBD dose provided to the animals, superior CBD bioavailability or species differences. Cmax and AUC0-24 are mathematically interdependent and therefore are often closely correlated. Following 28 days of CBD ingestion, this investigation found Cmax and AUC0-24 were respectively increased by 36% and 44% in females. Similar findings were observed in healthy males and females in response to 7 days oral CBD feeding at 750 mg/day; with Cmax increasing by ~50% and AUC by ~225% [31]. However, in the present study, male rats showed the opposite response, with a 22% reduction in AUC0-24 after 28 days of CBD feeding.
The absorption rate constant Ka provides a measure of CBD’s absorption into plasma, while the elimination rate constant Ke (sometimes abbreviated to Kel) relates to removal from plasma. Ka and Ke have previously been measured in response to oral CBD intake without concurrent provision of THC. The study of Williams and co-workers [18] investigated undisclosed preparations providing 30 mg of CBD and reported Ka values of 0.24 to 1.87 l/hr, with Ke values of 0.27 to 0.56 l/hr. The lower range of values for Ka and Ke are comparable to those of the present investigation. However, their findings also highlight that when the CBD dose is low (0.4 g/kg) in relation to co-consumed excipients, it has a profound effect on pharmacokinetics. Other human trials reported Ke values ~3 fold greater than observed in the present investigation after consuming capsules containing CBD and THC [12,32]. The lower Ke values in rats indicate slower CBD clearance, which could be a consequence of the greater relative CBD dose provided to the experimental animals. We found no differences in Ka or Ke, between genders or in response to 28 days of CBD intake. This is surprising, especially when considering the changes in tmax and Cmax we observed, which suggest modification of CBD appearance and/or removal. The finding that specific pharmacokinetic parameters are modified in responsive to regular CBD intake are consistent with limited human data [31]. One human study reported higher Cmax and AUC cannabinoid values for females than males, after co-ingestion of THC and CBD [11]. These findings are also consistent with the findings of [35], who administered CBD with MCT to humans. The authors provided evidence for gender specific differences in cannabinoid pharmacokinetics. The present investigation found evidence for higher Cmax and AUC values in females relative to males, but only after 28 days of CBD administration. Gender specific pharmacokinetic changes in response to repeated CBD dosing are one of the unique findings of the present investigation. These findings may be useful for developing gender specific dosing strategies to optimise tissue CBD elevation.
The present investigation showed a ~20 to 180 fold greater elevation of CBD in adipose relative to muscle or liver (Table 2). It is impossible to directly compare this finding to human research, as CBD has not been assessed in human adipose tissue. However, if THC is a suitable surrogate for CBD accumulation, then the present findings are consistent with the available human data [20,36]. Furthermore, studies in the Large White pig also show greater (~3 to 16 fold) THC accumulation in adipose, than liver or muscle [37].
Tissue responses to different CBD doses with a mixed gender group are shown in Table 2. The large SEM for CBD in adipose tissue for both males and females, regardless of dose (Table 4), is indicative of high variability between animals. As they were of very similar age, reared under identical conditions and given the same relative CBD dose, other factors appear to have influence tissue CBD accumulation. One parameter which might explain the heterogeneity in adipose tissue CBD responses is pharmacogenetic differences in metabolism. High inter-subject variability in CBD pharmacokinetics have previously been reported in humans [8] and recent research has highlighted genetic differences in human CBD metabolism [38] especially when variants of CYP2C9 are present [39].
Gender specific responses to CBD accumulation in muscle, liver and adipose tissue are shown in Figure 3a–c, with quantitative data in Table 4. For the same relative CBD dose females consistently had higher concentrations in muscle and liver than in males (Table 4). Muscle and liver tissue showed a clear dose response in CBD levels for both males and females (Table 4) and these findings may have relevance to humans. Increased CBD concentrations in the liver have the potential to inhibit metabolism of the selective serotonin reuptake inhibitor Citalopram [40]. It has recently been suggested CBD could have therapeutic value for alcohol use disorder and alcohol related liver damage, via both behavioural and biochemical mechanisms [41]. These include reduced alcohol intake, and increased hepatic resistance to inflammation and oxidative damage [41]. The present finding of increased liver CBD provides a theoretical basis to support recent proposals that CBD could exert antioxidant and anti-inflammatory effects in the liver [7,41]. Elevated skeletal muscle CBD could affect contractility, antioxidant protection and exercise recovery [42,43]; which would have implications for training and sports performance [44]. It is important for future studies on the potential benefits of elevated CBD in liver, muscle and adipose employ relevant biomarkers and clinical endpoints.
In adipose tissue there was evidence for a dose response in males (Table 4), but not when considered as a mixed gender group (Table 2). Adipose tissue CBD levels with the medium and high doses were ~100 fold greater than the elevation in muscle or liver, regardless of gender (Table 4). The factors governing the transport, metabolism and accumulation of ingested CBD in tissue are extremely complex. Fatty acid binding proteins (FABP) play a key role in intracellular CBD transport; specifically FABP3, FABP5 and FABP7 [45]. In the extracellular compartment albumen is in the main CBD carrier, with 90% of the CBD being protein bound. The liver is considered the main site of CBD metabolism [40], with extrahepatic metabolism in the brain, intestines and lung [46]. Cytochrome p450 mediated THC metabolism involves glucuronidation to form water-soluble adducts and there is evidence CBD is transported and metabolized via similar pathways [45]. Correlations between CBD levels in adipose and muscle (r = 0.31) and adipose and liver (r = 0.37) were much lower than for muscle and liver (r = 63) (Table 3). This is a surprising finding when considering the importance of the liver in CBD metabolism [40].
The relationship between plasma pharmacokinetics and tissue CBD accumulation were explored to provide insights into CBD metabolism. With a mixed gender group, there was a negative correlation between tmax on Day 1 and adipose tissue CBD uptake. This means the shorter the time to reach Cmax the greater the uptake into adipose tissue. The mixed gender group also showed relationships between Ka and Ke on Day 1 and adipose tissue CBD levels; such that the higher the rate constant for appearance and disappearance the greater the rise in adipose tissue CBD. In contrast, by Day 28 the relationship between Ka and Ke on Day 28 and adipose tissue CBD was negative, but only in males. This indicates the lower the rate constants for CBD appearance and disappearance, the higher the adipose tissue concentration. The changes in the relationship between Ka and Ke, both as a mixed gender group and for males and females separately, demonstrate these pharmacokinetic parameters are not static. One rationale for this is that Ka and Ke may be modified in response to elevated CBD levels. Potential mechanisms might involve increased liver CBD metabolism and/or enhanced excretion of CBD and CBD adducts. When CBD pharmacokinetics and adipose tissue accumulation were considered solely for females no significant relationships were observed. This may indicate that ovarian hormones have a profound influence on CBD uptake into adipose tissue.
In the mixed gender group, muscle CBD was positively correlated to both Ka and Ke on Day 1. This means the higher the rate constants for absorption and elimination the greater the level of CBD in muscle, and is identical to the relationship found in adipose tissue. The mixed gender group also showed a close negative correlation between tmax on Day 1 and muscle CBD (r = −0.82, p < 0.001). So, the shorter tmax on Day 1, the higher the muscle CBD content on Day 28. In males tmax decreased between Day 1 and Day 28 (Table 1) and this change in tmax was positively correlated with muscle CBD levels (r = 0.83, p < 0.05; CI 0.05, 0.98). So, the more tmax decreased the greater the CBD uptake to muscle.
Liver CBD was negatively associated with tmax on Day 1 and positively correlated with Cmax on Day 28 in the mixed gender group. The former finding shows that peak circulating CBD concentrations are associated with higher liver CBD. In males, the reduction in tmax between Day 1 and Day 28 was positively correlated with liver CBD levels. Therefore, the greater the rise in liver CBD the greater the reduction in time taken to reach peak plasma concentrations.
As Cmax and AUC0-24 are key determinants of tissue CBD exposure, we anticipated significant positive correlations between Cmax and AUC0-24 on Day 1 and tissue CBD. Surprisingly, neither AUC24 on Day 1 or Day 28 were correlated with CBD uptake into any tissue. Cmax was only correlated with uptake into liver tissue on Day 28, and even then only within the mixed gender group.
It is important to recognise that the relationship between pharmacokinetic parameters and tissue CBD levels appear to be dynamic. One example of this is tmax, which on Day 1 in a mixed gender group was negatively associated with CBD levels in adipose, muscle and liver. This subsequently changed so that there was no association between tmax on Day 28 and CBD in any tissue. Similarly, pharmacokinetic measurements that had no predictive value regarding tissue CBD uptake on Day 1, did predict tissue CBD levels when re-assessed on Day 28. For example, there was a positive association between Cmax on Day 28 and liver CBD levels. The statically significant associations between pharmacokinetics and tissue CBD levels in the mixed gender group are outlined in Table 5.
This research trial illustrates that the relationships between CBD pharmacokinetics and tissue levels are extremely complex. However, our findings suggest plasma pharmacokinetics could be used to predict CBD accumulation in some tissues. To improve the predictive accuracy of such measures in humans, factors such as gender, prior CBD exposure, age, diet and physical activity levels should also be considered [47,48]. The use of pharmacokinetics to predict tissue CBD levels has several advantages over biopsies. These include less invasive procedures for patients and less costly procedures for experimenters. Understanding tissue CBD responses to different dosing regimes and carriers could be important in clinical and research settings. For example, in attaining therapeutic CBD concentrations in target tissues and/or facilitating the development of CBD dosing strategies for specific populations.
The present study revealed that in a mixed gender group, tmax is the best predictor of tissue CBD levels in response to repeated dosing. It should be noted that these parameters are negatively correlated, such that a shorter tmax indicates higher tissue CBD. The relationship between tmax and tissue CBD uptake has not been assessed in humans. If similar responses were observed they could be valuable for identifying CBD sensitive individuals (CBD responders and non-responders). Such information could be used to personalize oral CBD dosing and maximise therapeutic benefits.
The accumulation of CBD in tissues has the potential to exert antioxidant and anti-inflammatory effects [7,41], in addition to amplifying the effects of other drugs [40,49]. The current findings provide clear evidence that CBD accumulates in adipose, liver and muscle tissue; furthermore, for any given dose there is greater elevation in adipose tissue than muscle or liver.
5. Conclusions
The animal model of oral CBD consumption evaluated in this study produces pharmacokinetic responses that are consistent with oral CBD intake by humans. In addition, we observed the same pattern of CBD elevation in the adipose, muscle and liver of rats that occurs with THC in humans. For the same relative CBD dose, females consistently showed higher levels in muscle and liver and this relationship was also present in adipose with the low and medium CBD doses. Some pharmacokinetic parameters can predict tissue CBD levels; however, there are important gender differences in these responses. Regular CBD intake modifies some pharmacokinetic parameters and their association with tissue CBD concentrations.
Additional work on human CBD pharmacology is necessary to gain insights into its relationship to tissue CBD uptake, this work being particularly important for the dose ranges that are used therapeutically. Research into the long-term effects of oral CBD consumption over several months or years is also warranted. There should also be a specific focus on understanding CBD pharmacokinetics and tissue accumulation in conditions where CBD is commonly consumed, such as epilepsy and addiction disorders. This work will help to extend understanding of the interactions between tissue CBD levels and the drugs most commonly used in these clinical conditions.
Author Contributions
All aspects of this study were performed by M.J.T. and R.B.C. All authors have read and agreed to the published version of the manuscript.
Funding
This research was funded by [cbdMD] grant number [55472] and the APC was funded by [cbdMD].
Institutional Review Board Statement
Ethical review and approval were waived at this study complied with the Final Rules of the Animal Welfare Act, Regulations (9 CFR) and the most recent Guide for the Care and Use of Laboratory Animals. The study was run under Animal Use Protocol P710-719 Repeated Dose Toxicity (oral), reviewed September 2020.
Informed Consent Statement
Not applicable.
Data Availability Statement
Not applicable.
Conflicts of Interest
The authors declare no conflict of interest.
References
- Hanuš, L.; Meyer, S.; Muñoz, E.; Taglialatela-Scafati, O.; Appendino, G. Phytocannabinoids: A unified critical inventory. Nat. Prod. Rep. 2016, 33, 1357–1392. [Google Scholar] [CrossRef] [PubMed] [Green Version]
- Nelson, K.M.; Bisson, J.; Singh, G.; Graham, J.G.; Chen, S.-N.; Friesen, B.J.; Dahlin, J.L.; Niemitz, M.; Walters, M.A.; Paul, G.F. The Essential Medicinal Chemistry of Cannabidiol (CBD). J. Med. Chem. 2020, 63, 12137–12155. [Google Scholar] [CrossRef] [PubMed]
- Morales, P.; Reggio, P.H. CBD: A New Hope? ACS Med. Chem. Lett. 2019, 10, 5694–5695. [Google Scholar] [CrossRef] [PubMed] [Green Version]
- Bhattacharyya, S.; Morrison, P.D.; Fusar-Poli, P.; Martin-Santos, R.; Borgwardt, S.; Winton-Brown, T.; Nosarti, C.; O’ Carroll, C.M.; Seal, M.; Allen, P.; et al. Opposite effects of delta-9-tetrahydrocannabinol and cannabidiol on human brain function and psychopathology. Neuropsychopharmacology 2010, 35, 764–774. [Google Scholar] [CrossRef]
- Hollister, L.E. Cannabidiol and cannabinol in man. Experientia 1973, 29, 825–826. [Google Scholar] [CrossRef]
- D’Souza, D.C.; Perry, E.; MacDougall, L.; Ammerman, Y.; Cooper, T.; Wu, Y.T.; Braley, G.; Gueorguieva, R.; Krystal, J.H. The psychotomimetic effects of intravenous delta-9-tetrahydrocannabinol in healthy individuals: Implications for psychosis. Neuropsychopharmacology 2004, 29, 1558–1572. [Google Scholar] [CrossRef]
- White, C.M. A Review of Human Studies Assessing Cannabidiol’s (CBD) Therapeutic Actions and Potential. J. Clin. Pharmacol. 2019, 59, 923–934. [Google Scholar] [CrossRef]
- Millar, S.A.; Stone, N.L.; Yates, A.S.; O’Sullivan, S.E. A Systematic Review on the Pharmacokinetics of Cannabidiol in Humans. Front. Pharmacol. 2018, 9, 1365. [Google Scholar] [CrossRef]
- Ohlsson, A.; Lindgren, J.E.; Andersson, S.; Agurell, S.; Gillespie, H.; Hollister, L.E. Single-dose kinetics of deuterium-labelled cannabidiol in man after smoking and intravenous administration. Biomed. Environ. Mass Spectrom. 1986, 13, 77–83. [Google Scholar] [CrossRef]
- Franco, V.; Gershkovich, P.; Perucca, E.; Bialer, M. The Interplay Between Liver First-Pass Effect and Lymphatic Absorption of Cannabidiol and Its Implications for Cannabidiol Oral Formulations. Clin. Pharmacokinet. 2020, 59, 1493–1500. [Google Scholar] [CrossRef]
- Nadulski, T.; Pragst, F.; Weinberg, G.; Roser, P.; Schnelle, M.; Fronk, E.M.; Stadelmann, A.M. Randomized, double-blind, placebo-controlled study about the effects of cannabidiol (CBD) on the pharmacokinetics of Delta9-tetrahydrocannabinol (THC) after oral application of THC verses standardized cannabis extract. Ther. Drug Monit. 2005, 27, 799–810. [Google Scholar] [CrossRef] [PubMed] [Green Version]
- Atsmon, J.; Cherniakov, I.; Izgelov, D.; Hoffman, A.; Domb, A.J.; Deutsch, L.; Deutsch, F.; Heffetz, D.; Sacks, H. PTL401, a New Formulation Based on Pro-Nano Dispersion Technology, Improves Oral Cannabinoids Bioavailability in Healthy Volunteers. J. Pharm. Sci. 2018, 107, 1423–1429. [Google Scholar] [CrossRef]
- Cherniakov, I.; Izgelov, D.; Barasch, D.; Davidson, E.; Domb, A.J.; Hoffman, A. Piperine-pro-nanolipospheres as a novel oral delivery system of cannabinoids: Pharmacokinetic evaluation in healthy volunteers in comparison to buccal spray administration. J. Control Release 2017, 266, 1–7. [Google Scholar] [CrossRef] [PubMed]
- Zuardi, A.W.; Crippa, J.A.S.; Hallak, J.E.C.; Bhattacharyya, S.; Atakan, Z.; Martin-Santos, R.; McGuire, P.K.; Guimarães, F.S. A critical review of the antipsychotic effects of cannabidiol: 30 years of a translational investigation. Curr. Pharm. Des. 2012, 18, 5131–5140. [Google Scholar] [CrossRef] [PubMed] [Green Version]
- Furqan, T.; Batool, S.; Habib, R.; Shah, M.; Kalasz, H.; Darvas, F.; Kuca, K.; Nepovimova, E.; Batool, S.; Nurulain, S.M. Cannabis Constituents and Acetylcholinesterase Interaction: Molecular Docking, In Vitro Studies and Association with CNR1 rs806368 and ACHE rs17228602. Biomolecules 2020, 10, 758. [Google Scholar] [CrossRef] [PubMed]
- Nasrin, S.; Watson, C.J.W.; Perez-Paramo, Y.X.; Lazarus, P. Cannabinoid Metabolites as Inhibitors of Major Hepatic CYP450 Enzymes, with Implications for Cannabis-Drug Interactions. Drug Metab. Dispos. 2021, 49, 1070–1080. [Google Scholar] [CrossRef]
- Agurell, S.; Carlsson, S.; Lindgren, J.E.; Ohlsson, A.; Gillespie, H.; Hollister, L. Interactions of delta 1-tetrahydrocannabinol with cannabinol and cannabidiol following oral administration in man. Assay of cannabinol and cannabidiol by mass fragmentography. Experientia 1981, 37, 1090–1092. [Google Scholar] [CrossRef]
- Williams, N.N.B.; Ewell, T.R.; Abbotts, K.S.S.; Harms, K.J.; Woelfel, K.A.; Dooley, G.P.; Weir, T.L.; Bell, C. Comparison of Five Oral Cannabidiol Preparations in Adult Humans: Pharmacokinetics, Body Composition, and Heart Rate Variability. Pharmaceuticals 2021, 14, 35. [Google Scholar] [CrossRef]
- Johansson, E.; Halldin, M.M.; Agurell, S.; Hollister, L.E.; Gillespie, H.K. Terminal elimination plasma half-life of Δ1-tetrahydrocannabinol (Δ1-THC) in heavy users of marijuana. Eur. J. Clin. Pharmacol. 1989, 37, 273–277. [Google Scholar] [CrossRef]
- Gronewold, A.; Skopp, G.A. Preliminary investigation on the distribution of cannabinoids in man. Forensic Sci. Int. 2011, 210, e7–e11. [Google Scholar] [CrossRef]
- National Research Council (US) Committee for the Update of the Guide for the Care and Use of Laboratory Animals. Guide for the Care and Use of Laboratory Animals, 8th ed.; National Academies Press (US): Washington, DC, USA, 2011; 246p. [Google Scholar] [CrossRef]
- Vaclavik, L.; Benes, F.; Fenclova, M.; Hricko, J.; Krmela, A.; Svobodova, V.; Hajslova, J.; Mastovska, K. Quantitation of Cannabinoids in Cannabis Dried Plant Materials, Concentrates, and Oils Using Liquid Chromatography-Diode Array Detection Technique with Optional Mass Spectrometric Detection: Single-Laboratory Validation Study, First Action 2018.11. J. AOAC Int. 2019, 102, 1822–1833. [Google Scholar] [CrossRef] [PubMed]
- Cliburn, K.D.; Huestis, M.A.; Wagner, J.R.; Kemp, P.M. Cannabinoid distribution in fatally-injured pilots’ postmortem fluids and tissues. Forensic Sci. Int. 2021, 329, 111075. [Google Scholar] [CrossRef] [PubMed]
- Spittler, A.P.; Helbling, J.E.; McGrath, S.; Gustafson, D.L.; Santangelo, K.S.; Sadar, M.J. Plasma and joint tissue pharmacokinetics of two doses of oral cannabidiol oil in guinea pigs (Cavia porcellus). J. Vet. Pharmacol. Ther. 2021, 44, 967–974. [Google Scholar] [CrossRef] [PubMed]
- Meneses, V.; Hernandez, M. Cannabinoid distribution in postmortem samples. Forensic Chem. 2021, 23, 100303. [Google Scholar] [CrossRef]
- Craft, R.M.; Marusich, J.A.; Wiley, J.L. Sex differences in cannabinoid pharmacology: A reflection of differences in the endocannabinoid system? Life Sci. 2013, 92, 476–481. [Google Scholar] [CrossRef] [Green Version]
- Berg, U.B. Differences in decline in GFR with age between males and females. Reference data on clearances of inulin and PAH in potential kidney donors. Nephrol. Dial. Transplant. 2006, 21, 2577–2582. [Google Scholar] [CrossRef] [Green Version]
- Vahl, N.; Møller, N.; Lauritzen, T.; Christiansen, J.S.; Jørgensen, J.O. Metabolic effects and pharmacokinetics of a growth hormone pulse in healthy adults: Relation to age, sex, and body composition. J. Clin. Endocrinol. Metab. 1997, 82, 3612–3618. [Google Scholar] [CrossRef]
- Waxman, D.J.; Holloway, M.G. Sex differences in the expression of hepatic drug metabolizing enzymes. Mol. Pharmacol. 2009, 76, 215–228. [Google Scholar] [CrossRef] [Green Version]
- Haney, M.; Malcolm, R.J.; Babalonis, S.; Nuzzo, P.A.; Cooper, Z.D.; Bedi, G.; Gray, K.M.; McRae-Clark, A.; Lofwall, M.R.; Sparenborg, S.; et al. Oral Cannabidiol does not Alter the Subjective, Reinforcing or Cardiovascular Effects of Smoked Cannabis. Neuropsychopharmacology 2016, 41, 1974–1982. [Google Scholar] [CrossRef]
- Taylor, L.; Gidal, B.; Blakey, G.; Tayo, B.; Morrison, G. A Phase I, Randomized, Double-Blind, Placebo-Controlled, Single Ascending Dose, Multiple Dose, and Food Effect Trial of the Safety, Tolerability and Pharmacokinetics of Highly Purified Cannabidiol in Healthy Subjects. CNS Drugs 2018, 32, 1053–1067. [Google Scholar] [CrossRef] [Green Version]
- Atsmon, J.; Heffetz, D.; Deutsch, L.; Deutsch, F.; Sacks, H. Single-Dose pharmacokinetics of oral cannabidiol following administration of PTL101: A new formulation based on gelatin matrix pellets technology. Clin. Pharmacol. Drug Dev. 2017, 7, 751–758. [Google Scholar] [CrossRef] [PubMed]
- Wall, M.E.; Brine, D.R.; Perez-Reyes, M. Metabolism of Cannabinoids in Man. In The Pharmacology of Marihuana; Braude, M.C., Szara, S., Eds.; Raven Press: New York, NY, USA, 1976; pp. 93–113. [Google Scholar]
- Fabritius, M.; Staub, C.; Mangin, P.; Giroud, C. Distribution of free and conjugated cannabinoids in human bile samples. Forensic Sci. Int. 2012, 223, 114–118. [Google Scholar] [CrossRef] [PubMed]
- Knaub, K.; Sartorius, T.; Dharsono, T.; Wacker, R.; Wilhelm, M.; Schön, C. A Novel Self-Emulsifying Drug Delivery System (SEDDS) Based on VESIsorb® Formulation Technology Improving the Oral Bioavailability of Cannabidiol in Healthy Subjects. Molecules 2019, 24, 2967. [Google Scholar] [CrossRef] [PubMed] [Green Version]
- Kudo, K.; Nagata, T.; Kimura, K.; Imamura, T.; Jitsufuchi, N. Sensitive Determination of Δ9-Tetrahydrocannabinol in Human Tissues by GC-MS. J. Anal. Toxicol. 1995, 19, 87–90. [Google Scholar] [CrossRef] [PubMed]
- Brunet, B.; Hauet, T.; Hébrard, W.; Papet, Y.; Mauco, G.; Mura, P. Postmortem redistribution of THC in the pig. Int. J. Legal Med. 2010, 124, 543–549. [Google Scholar] [CrossRef] [PubMed]
- Davis, B.H.; Beasley, T.M.; Amaral, M.; Szaflarski, J.P.; Gaston, T.; Perry Grayson, L.; Standaert, D.G.; Bebin, E.M.; Limdi, N.A. UAB CBD Study Group (includes all the investigators involved in the UAB EAP CBD program). Pharmacogenetic Predictors of Cannabidiol Response and Tolerability in Treatment-Resistant Epilepsy. Clin. Pharmacol. Ther. 2021, 110, 1368–1380. [Google Scholar] [CrossRef] [PubMed]
- Papastergiou, J.; Li, W.; Sterling, C.; van den Bemt, B. Pharmacogenetic-guided cannabis usage in the community pharmacy: Evaluation of a pilot program. J. Cannabis Res. 2020, 2, 24. [Google Scholar] [CrossRef]
- Anderson, L.L.; Doohan, P.T.; Oldfield, L.; Kevin, R.C.; Arnold, J.C.; Berger, M.; Amminger, G.P.; McGregor, I.S. Citalopram and Cannabidiol: In Vitro and In Vivo Evidence of Pharmacokinetic Interactions Relevant to the Treatment of Anxiety Disorders in Young People. J. Clin. Psychopharmacol. 2021, 41, 525–533. [Google Scholar] [CrossRef]
- De Ternay, J.; Naassila, M.; Nourredine, M.; Louvet, A.; Bailly, F.; Sescousse, G.; Maurage, P.; Cottencin, O.; Carrieri, P.M.; Rolland, B. Therapeutic Prospects of Cannabidiol for Alcohol Use Disorder and Alcohol-Related Damages on the Liver and the Brain. Front. Pharmacol. 2019, 10, 627. [Google Scholar] [CrossRef]
- Isenmann, E.; Veit, S.; Starke, L.; Flenker, U.; Diel, P. Effects of Cannabidiol Supplementation on Skeletal Muscle Regeneration after Intensive Resistance Training. Nutrients 2021, 13, 3028. [Google Scholar] [CrossRef]
- Cochrane-Snyman, K.C.; Cruz, C.; Morales, J.; Coles, M. The Effects of Cannabidiol Oil on Noninvasive Measures of Muscle Damage in Men. Med. Sci. Sports Exerc. 2021, 53, 1460–1472. [Google Scholar] [CrossRef] [PubMed]
- Rojas-Valverde, D. Potential Role of Cannabidiol on Sports Recovery: A Narrative Review. Front. Physiol. 2021, 12, 722550. [Google Scholar] [CrossRef] [PubMed]
- Elmes, M.W.; Kaczocha, M.; Berger, W.T.; Leung, K.; Ralph, B.P.; Wang, L.; Sweeney, J.M.; Miyauchi, J.T.; Tsirka, S.E.; Ojima, I.; et al. Fatty acid-binding proteins (FABPs) are intracellular carriers for Δ9-tetrahydrocannabinol (THC) and cannabidiol (CBD). J. Biol. Chem. 2015, 290, 8711–8721. [Google Scholar] [CrossRef] [PubMed] [Green Version]
- Heustis, M.A. Human Cannabinoid Pharmacokinetics. Chem. Biodivers. 2007, 4, 1770–1804. [Google Scholar] [CrossRef] [Green Version]
- Gunasekaran, N.; Long, L.E.; Dawson, B.L.; Hansen, G.H.; Richardson, D.P.; Li, K.M.; Arnold, J.C.; McGregor, I.S. Reintoxication: The release of fat-stored delta(9)-tetrahydrocannabinol (THC) into blood is enhanced by food deprivation or ACTH exposure. Br. J. Pharmacol. 2009, 158, 1330–1337. [Google Scholar] [CrossRef] [Green Version]
- Wong, A.; Montebello, M.E.; Norberg, M.M.; Rooney, K.; Lintzeris, N.; Bruno, R.; Booth, J.; Arnold, J.C.; McGregor, I.S. Exercise increases plasma THC concentrations in regular cannabis users. Drug Alcohol Depend. 2013, 133, 763–767. [Google Scholar] [CrossRef]
- Devinsky, O.; Cross, J.H.; Wright, S. Trial of Cannabidiol for Drug-Resistant Seizures in the Dravet Syndrome. N. Engl. J. Med. 2017, 377, 699–700. [Google Scholar] [CrossRef] [Green Version]
Figure 1.
Plasma CBD pre- and post-28 days oral feeding at 115 mg/kg in males.
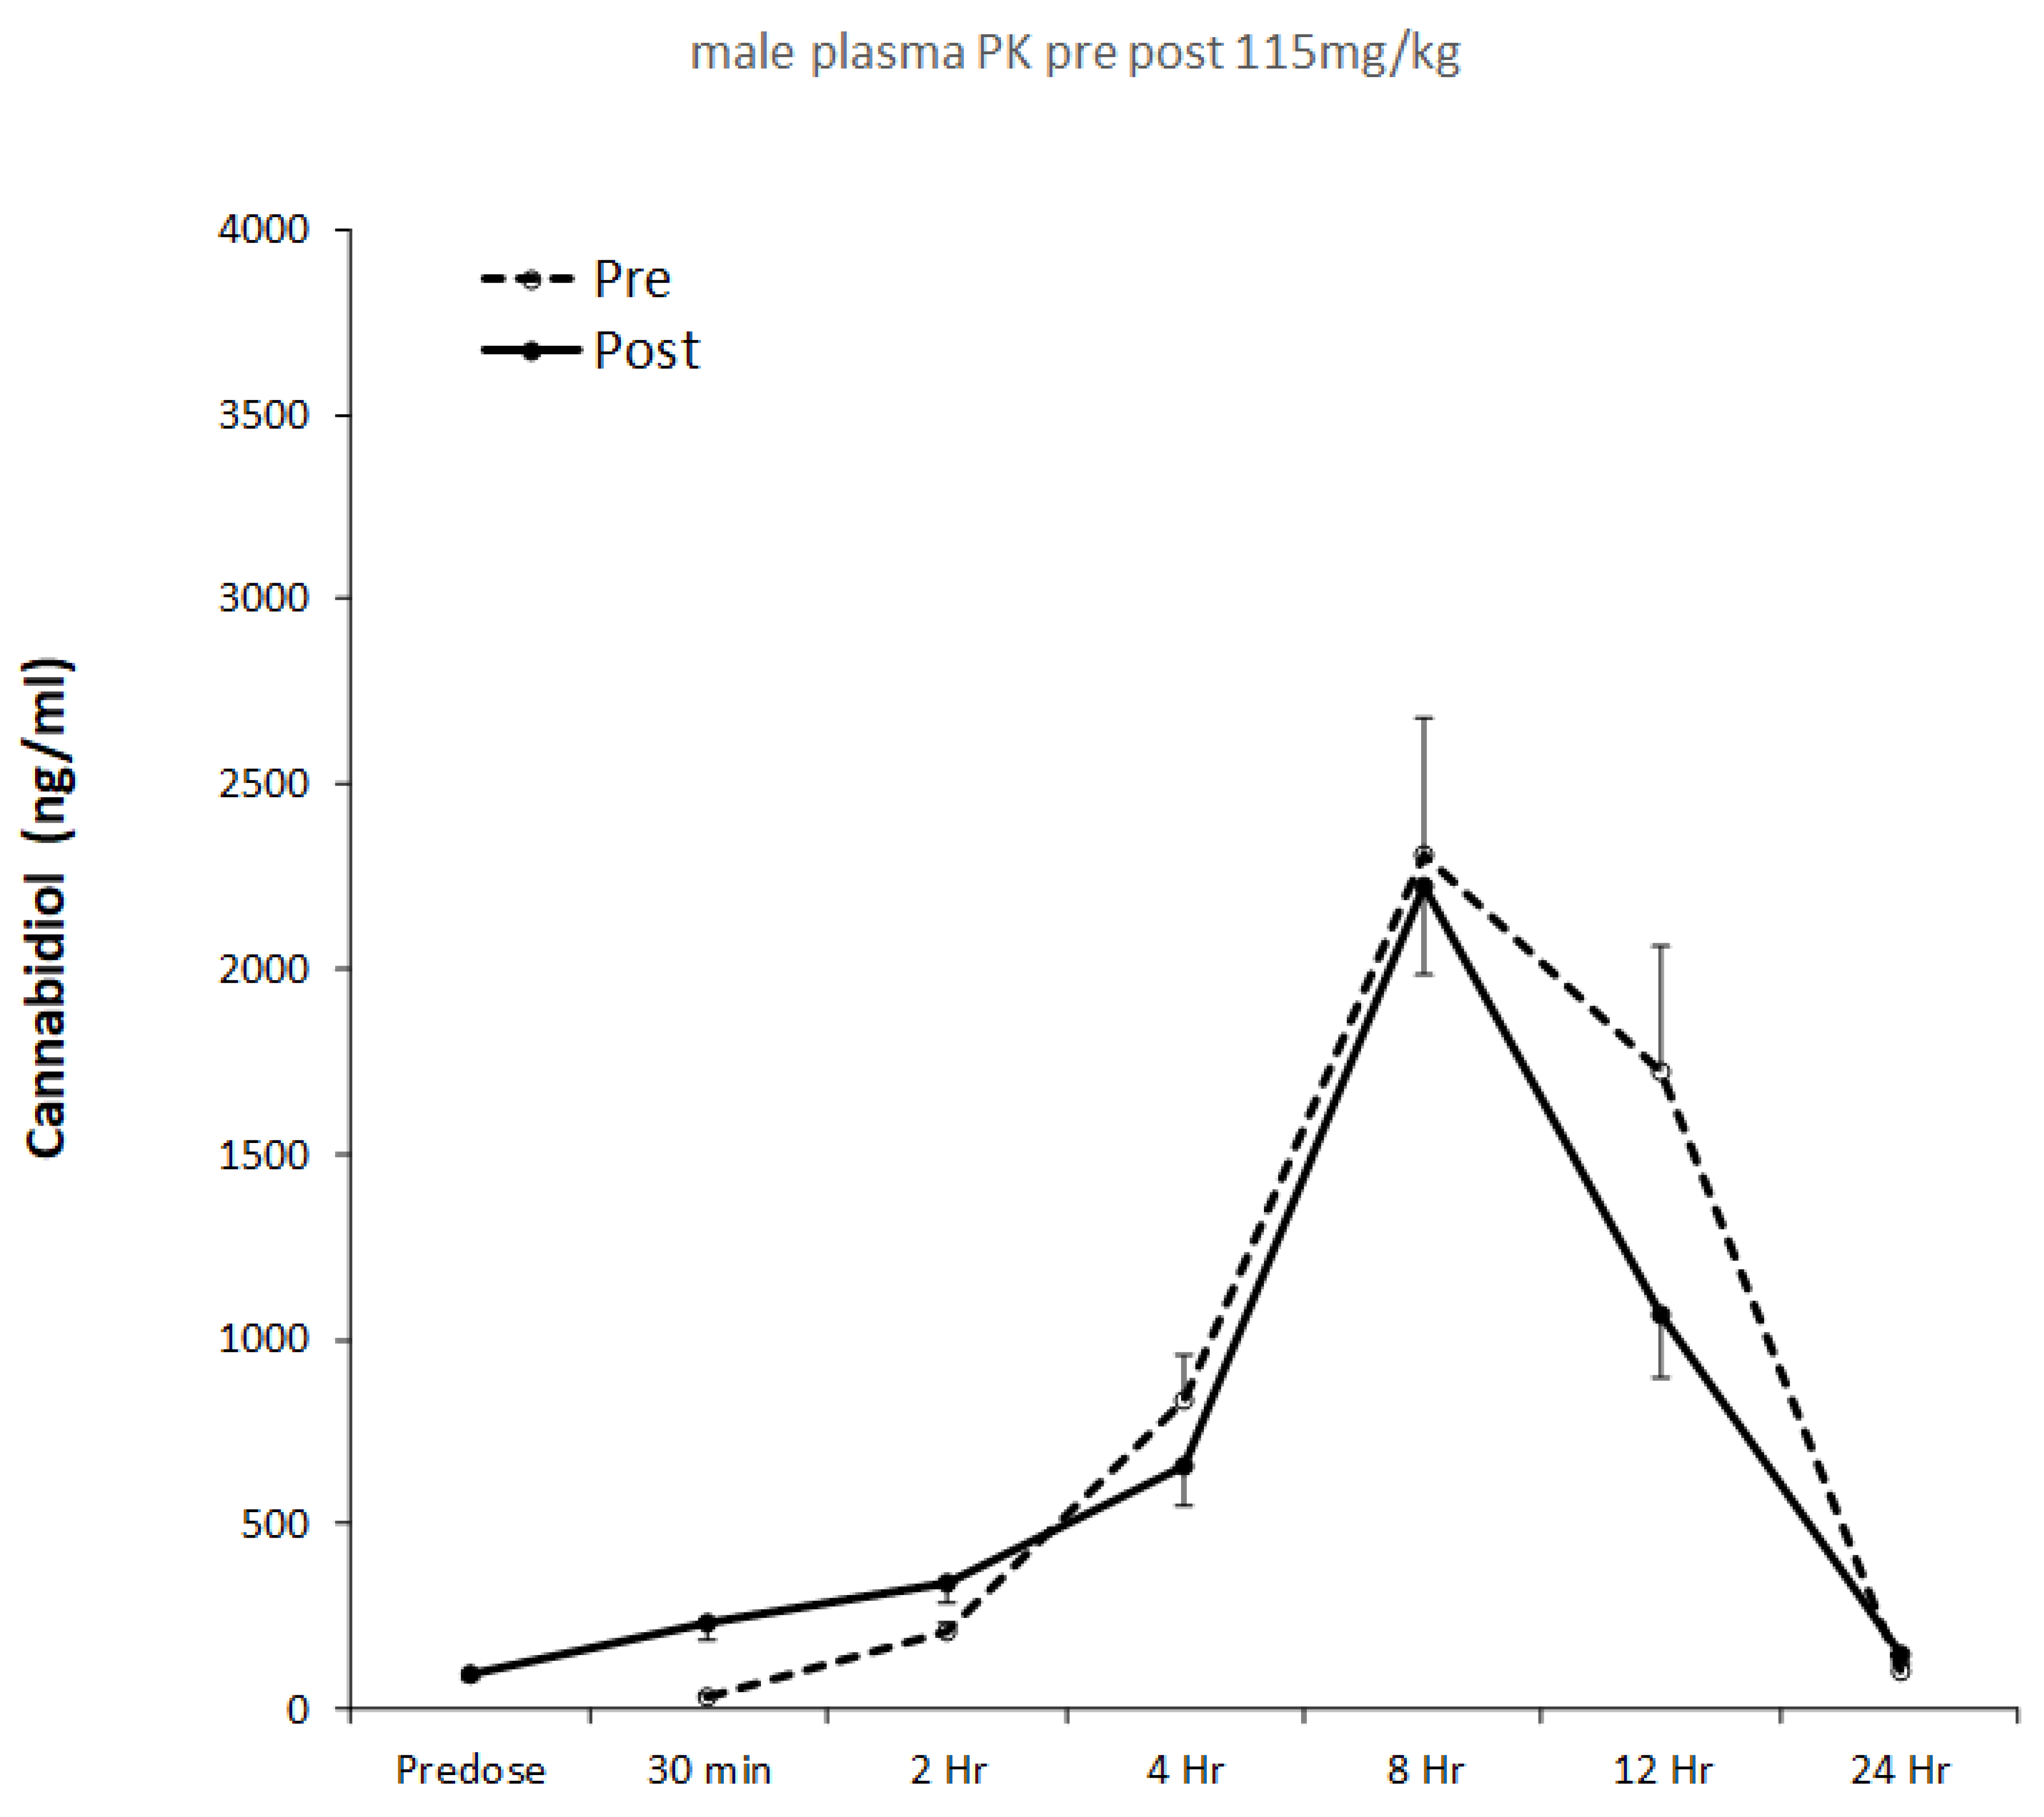
Figure 2.
Plasma CBD pre- and post-28 days oral feeding at 115 mg/kg in females.
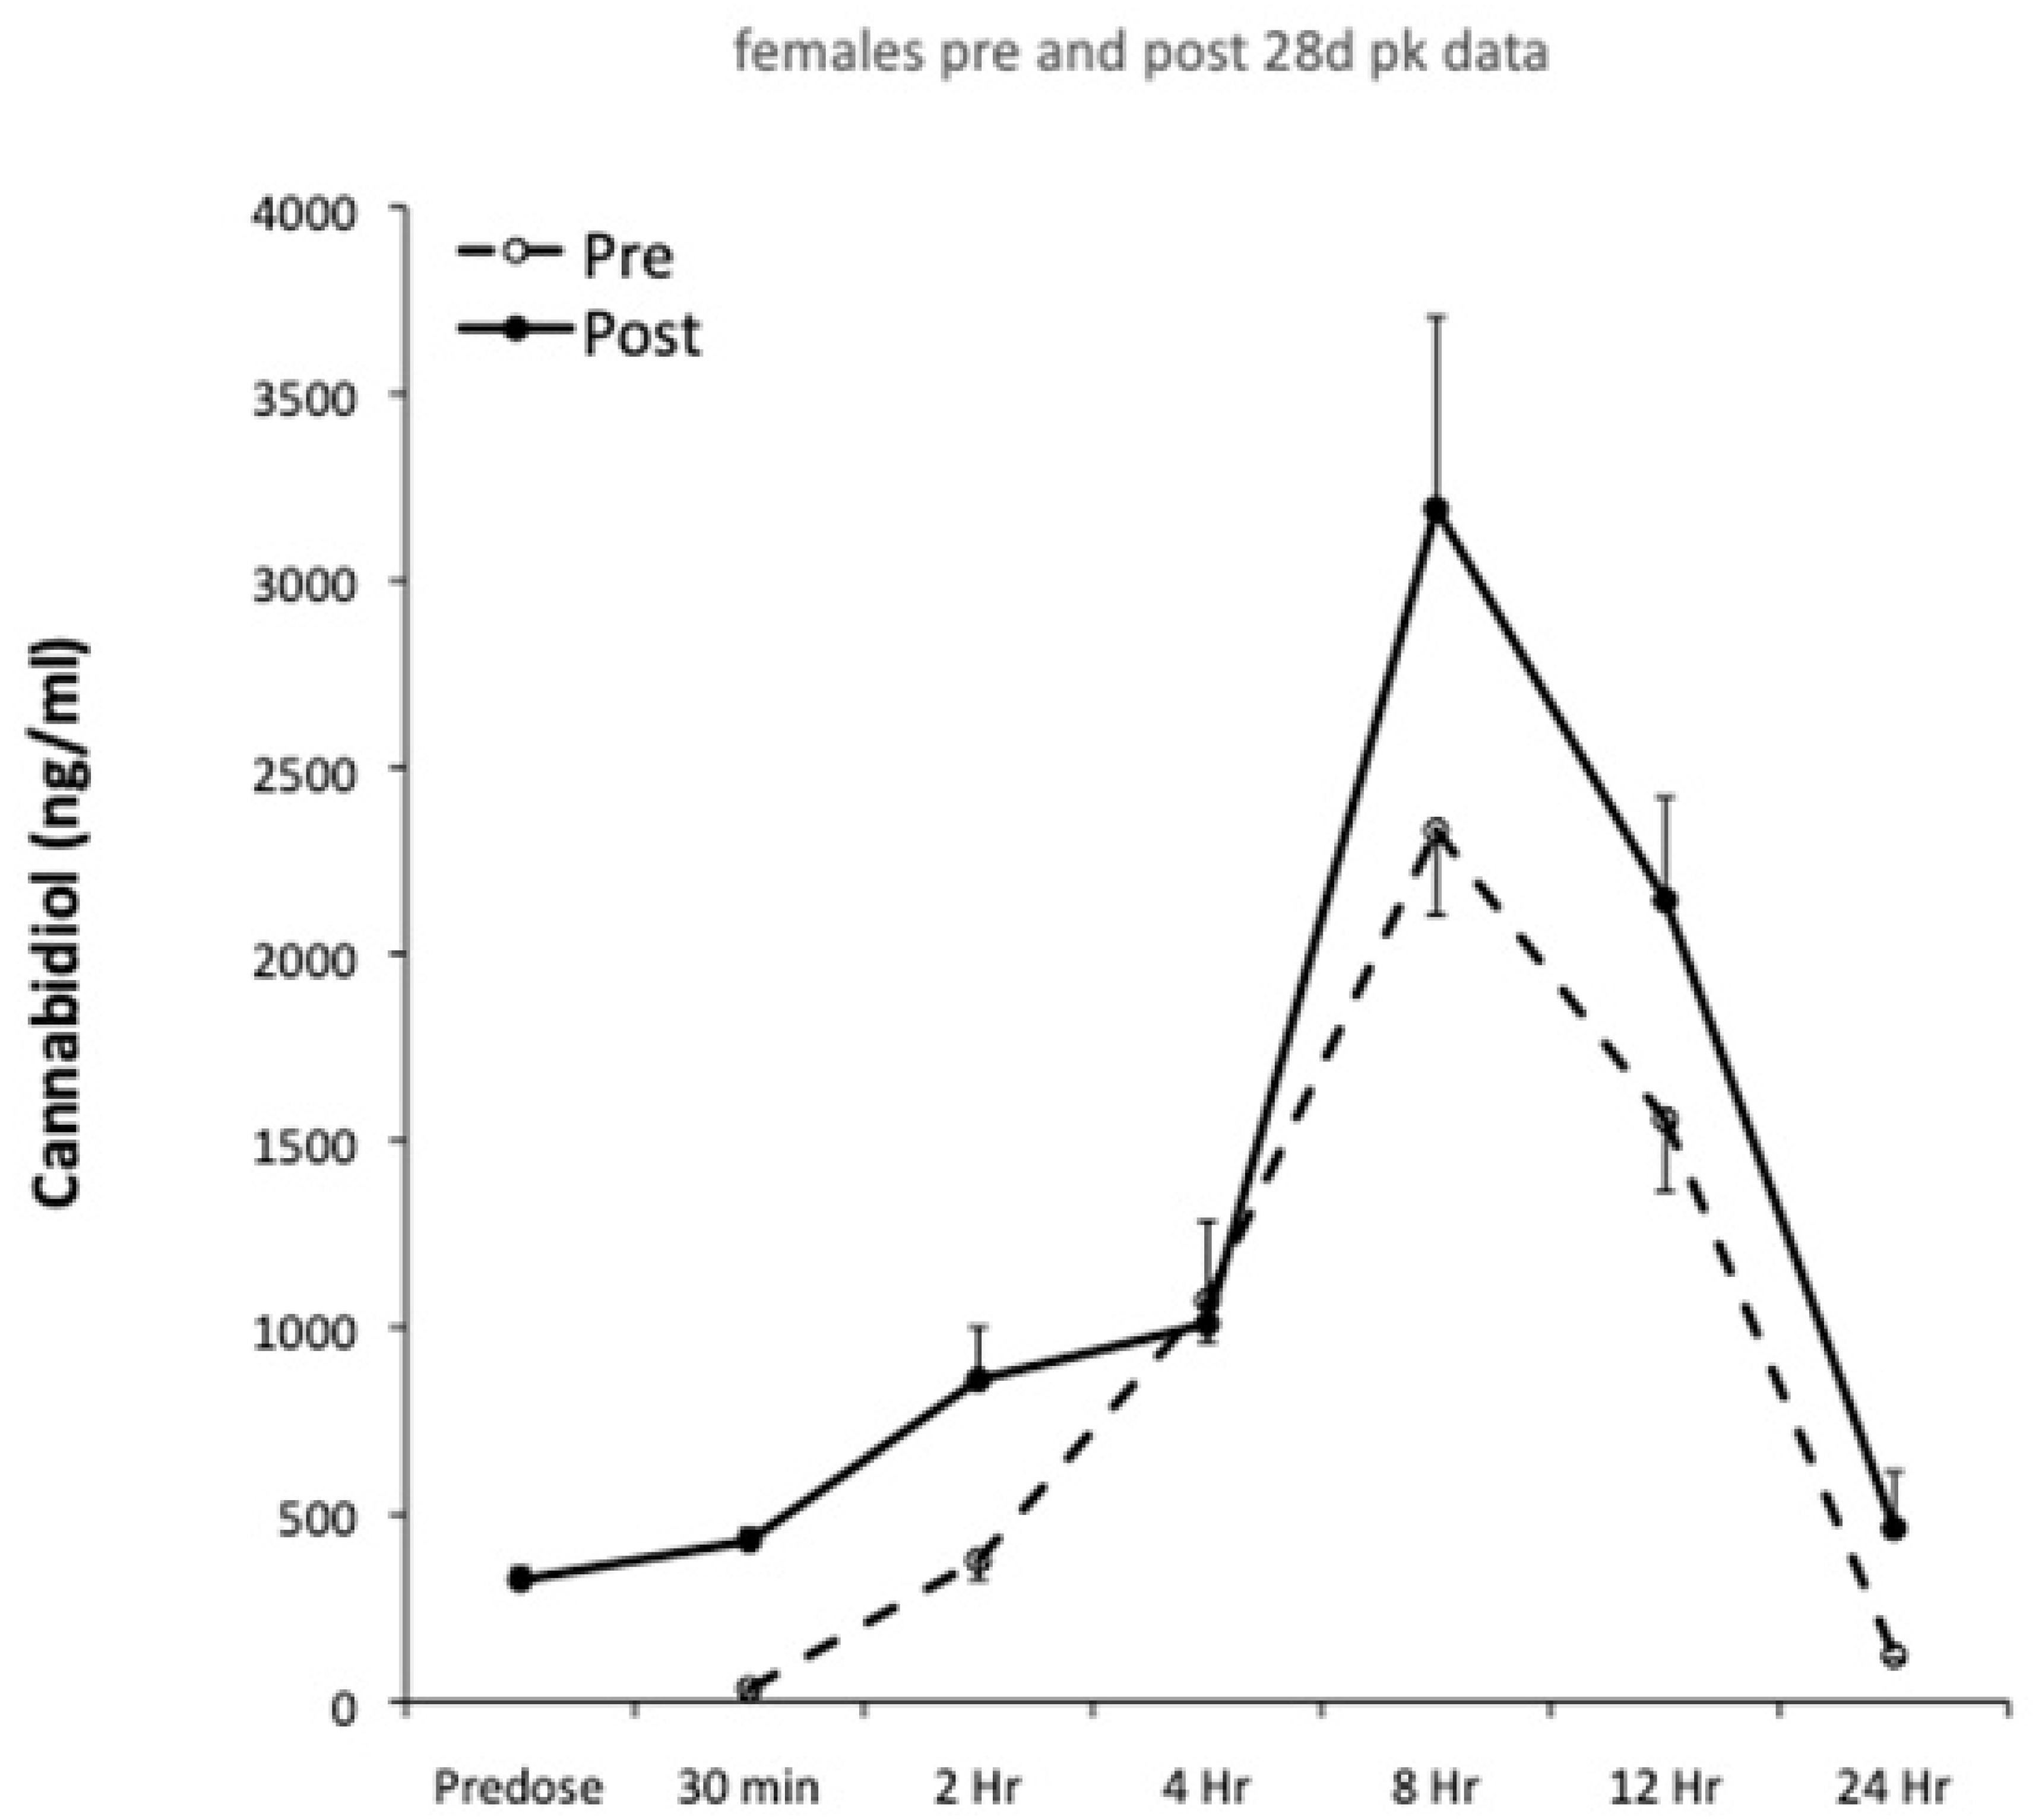
Figure 3.
Male and female muscle (a), liver (b) and adipose (c), tissue CBD concentrations following 28 days feeding at low (30 mg/kg), medium (115 mg/kg), high (230 mg/kg) CBD dosing. Data are means ± SEM, * p < 0.05 and ** p < 0.01 relative to control; b = p < 0.01 dose specific difference between genders. ND = not detectable.

Table 1.
Pharmacokinetic parameters in males and females on Day 1 and Day 28.
| Time Point | Gender | Pharmacokinetic Parameters | ||||
|---|---|---|---|---|---|---|
| tmax (hrs:min) | Cmax (ng/mL) | AUC0-24 (hr × ng/mL) | Ka (L/hr) | Ke (L/hr) | ||
| Day 1 | Female | 7:45 ± 0:46 | 1648 ± 330 | 35,040 ± 8449 | 0.13 ± 0.01 | 0.13 ± 0.01 |
| Male | 8:25 ± 0:32 | 1588 ± 594 | 36,455 ± 13,521 | 0.12 ± 0.01 | 0.12 ± 0.01 | |
| Day 28 | Female | 8.17 ± 0:59 | 2242 ± 529 a | 50,561 ± 15,090 b | 0.12 ± 0.01 | 0.12 ± 0.01 |
| Male | 7:47 ± 0:16 a | 1350 ± 388 | 28,602 ± 8486 b | 0.13 ± 0.00 | 0.13 ± 0.00 | |
Data are means ± SEM, a within group difference, b difference between groups.
Table 2.
The effects of CBD dosing on 28-day tissue concentrations with mixed gender groups.
| Dose | Tissue CBD Concentration (mg/kg) | ||
|---|---|---|---|
| Adipose | Muscle | Liver | |
| Low (30 mg/kg/day) | 5.30 ± 4.24 | 0.27 ± 0.25 | 0.07 ± 0.03 |
| Medium (115 mg/kg/day) | 116.17 ± 61.27 * | 0.64 ± 0.17 ** | 0.95 ± 0.18 ** |
| High (230 mg/kg/day) | 108.60 ± 86.34 * | 0.93 ± 0.31 *** | 1.15 ± 0.34 *** |
Data are means ± SEM, No CBD was detected in control tissue. * p < 0.05; ** p < 0.01; *** p < 0.001 relative to control.
Table 3.
The pairwise correlations between CBD levels across tissues with mixed gender groups.
| Tissue | r-Value |
|---|---|
| Adipose and Muscle | 0.31 * |
| Adipose and Liver | 0.37 ** |
| Muscle and Liver | 0.63 *** |
* p < 0.05; ** p < 0.01, *** p < 0.001.
Table 4.
The gender differences in tissue responses with different CBD doses.
| Dose | Tissue CBD Concentration (mg/kg) | |||||
|---|---|---|---|---|---|---|
| Adipose | Muscle | Liver a | ||||
| Female | Male | Female | Male | Female | Male | |
| Low (30 mg/kg/day) | 7.79 ± 7.29 | 2.79 ± 1.20 | 0.04 ± 0.02 | 0.50 ± 0.47 | 0.09 ± 0.03 * | 0.05 ± 0.02 |
| Medium (115 mg/kg/day) | 197.01 ± 101.52 * | 35.31 ± 21.01 | 0.85 ± 0.22 ** | 0.43 ± 0.11 | 1.59 ± 0.31 **,b | 0.30 ± 0.04 b |
| High (230 mg/kg/day) | 84.24 ± 32.97 | 132.95 ± 106.74 | 1.25 ± 0.20 ** | 0.60 ± 0.11 * | 1.94 ± 0.60 ** | 0.37 ± 0.07 |
Data are means ± SEM; a p < 0.05 group difference between males and females * p < 0.05 and ** p < 0.01 relative to control; b p < 0.01 dose specific difference between genders.
Table 5.
The summary of significant correlations between pharmacokinetics and tissue CBD levels with a mixed gender group.
Table 5.
The summary of significant correlations between pharmacokinetics and tissue CBD levels with a mixed gender group.
| Pharmacokinetic Parameters | Tissue | |||||
|---|---|---|---|---|---|---|
| Adipose | Muscle | Liver | ||||
| Day 1 | Day 28 | Day 1 | Day 28 | Day 1 | Day 28 | |
| tmax | −0.66 * | −0.82 *** | −0.58 ** | |||
| Cmax | 0.59 * | |||||
| Ka | 0.73 ** | 0.76 ** | ||||
| Ke | 0.73 ** | 0.76 ** | ||||
The numbers denote the r value, * p < 0.05; ** p < 0.01; *** p < 0.001.
Publisher’s Note: MDPI stays neutral with regard to jurisdictional claims in published maps and institutional affiliations. |
© 2022 by the authors. Licensee MDPI, Basel, Switzerland. This article is an open access article distributed under the terms and conditions of the Creative Commons Attribution (CC BY) license (https://creativecommons.org/licenses/by/4.0/).
Share and Cite
MDPI and ACS Style
Child, R.B.; Tallon, M.J. Cannabidiol (CBD) Dosing: Plasma Pharmacokinetics and Effects on Accumulation in Skeletal Muscle, Liver and Adipose Tissue. Nutrients 2022, 14, 2101. https://doi.org/10.3390/nu14102101
AMA Style
Child RB, Tallon MJ. Cannabidiol (CBD) Dosing: Plasma Pharmacokinetics and Effects on Accumulation in Skeletal Muscle, Liver and Adipose Tissue. Nutrients. 2022; 14(10):2101. https://doi.org/10.3390/nu14102101
Chicago/Turabian StyleChild, Robert B., and Mark J. Tallon. 2022. "Cannabidiol (CBD) Dosing: Plasma Pharmacokinetics and Effects on Accumulation in Skeletal Muscle, Liver and Adipose Tissue" Nutrients 14, no. 10: 2101. https://doi.org/10.3390/nu14102101
Note that from the first issue of 2016, this journal uses article numbers instead of page numbers. See further details here.