
Melatonin Levels in Children with Obesity Are Associated with Metabolic Risk and Inflammatory Parameters

 , , and
Abstract
:
1. Introduction
2. Materials and Methods
2.1. Subjects
2.2. Clinical Data
2.3. Biochemical Data
2.4. Melatonin Analysis
2.5. Statistics
3. Results
4. Discussion
5. Conclusions
Author Contributions
Funding
Institutional Review Board Statement
Informed Consent Statement
Data Availability Statement
Conflicts of Interest
References
- Tan, D.-X.; Manchester, L.C.; Terron, M.P.; Flores, L.J.; Reiter, R.J. One Molecule, Many Derivatives: A Never-Ending Interaction of Melatonin with Reactive Oxygen and Nitrogen Species? J. Pineal Res. 2007, 42, 28–42. [Google Scholar] [CrossRef] [PubMed]
- Esposito, S.; Laino, D.; D’Alonzo, R.; Mencarelli, A.; Di Genova, L.; Fattorusso, A.; Argentiero, A.; Mencaroni, E. Pediatric Sleep Disturbances and Treatment with Melatonin. J. Transl. Med. 2019, 17, 77. [Google Scholar] [CrossRef] [PubMed]
- Chitimus, D.M.; Popescu, M.R.; Voiculescu, S.E.; Panaitescu, A.M.; Pavel, B.; Zagrean, L.; Zagrean, A.-M. Melatonin’s Impact on Antioxidative and Anti-Inflammatory Reprogramming in Homeostasis and Disease. Biomolecules 2020, 10, 1211. [Google Scholar] [CrossRef] [PubMed]
- Gombert, M.; Carrasco-Luna, J.; Pin-Arboledas, G.; Codoñer-Franch, P. Circadian Rhythm Variations and Nutrition in Children. J. Child Sci. 2018, 8, e60–e66. [Google Scholar] [CrossRef] [Green Version]
- Slominski, R.M.; Reiter, R.J.; Schlabritz-Loutsevitch, N.; Ostrom, R.S.; Slominski, A.T. Melatonin Membrane Receptors in Peripheral Tissues: Distribution and Functions. Mol. Cell. Endocrinol. 2012, 351, 152–166. [Google Scholar] [CrossRef] [Green Version]
- Gombert, M.; Codoñer-Franch, P. Melatonin in Early Nutrition: Long-Term Effects on Cardiovascular System. Int. J. Mol. Sci. 2021, 22, 6809. [Google Scholar] [CrossRef]
- Cipolla-Neto, J.; Amaral, F.G.; Afeche, S.C.; Tan, D.X.; Reiter, R.J. Melatonin, Energy Metabolism, and Obesity: A Review. J. Pineal Res. 2014, 56, 371–381. [Google Scholar] [CrossRef] [Green Version]
- Carrillo-Vico, A.; Lardone, P.; Álvarez-Sánchez, N.; Rodríguez-Rodríguez, A.; Guerrero, J. Melatonin: Buffering the Immune System. Int. J. Mol. Sci. 2013, 14, 8638–8683. [Google Scholar] [CrossRef] [Green Version]
- Reiter, R.J.; Tan, D.; Manchester, L.C.; Qi, W. Biochemical Reactivity of Melatonin with Reactive Oxygen and Nitrogen Species: A Review of the Evidence. Cell Biochem. Biophys. 2001, 34, 237–256. [Google Scholar] [CrossRef]
- Pereira, N.; Naufel, M.F.; Ribeiro, E.B.; Tufik, S.; Hachul, H. Influence of Dietary Sources of Melatonin on Sleep Quality: A Review. J. Food Sci. 2020, 85, 5–13. [Google Scholar] [CrossRef]
- Daugaard, S.; Garde, A.H.; Bonde, J.P.E.; Christoffersen, J.; Hansen, Ä.M.; Markvart, J.; Schlünssen, V.; Skene, D.J.; Vistisen, H.T.; Kolstad, H.A. Night Work, Light Exposure and Melatonin on Work Days and Days Off. Chronobiol. Int. 2017, 34, 942–955. [Google Scholar] [CrossRef] [Green Version]
- Claustrat, B.; Leston, J. Melatonin: Physiological Effects in Humans. Neurochirurgie 2015, 61, 77–84. [Google Scholar] [CrossRef] [PubMed]
- Bonmati-Carrion, M.A.; Arguelles-Prieto, R.; Martinez-Madrid, M.J.; Reiter, R.; Hardeland, R.; Rol, M.A.; Madrid, J.A. Protecting the Melatonin Rhythm through Circadian Healthy Light Exposure. Int. J. Mol. Sci. 2014, 15, 23448–23500. [Google Scholar] [CrossRef] [PubMed]
- Diaz, E.; Diaz, I.; Del Busto, C.; Escudero, D.; Pérez, S. Clock Genes Disruption in the Intensive Care Unit. J. Intensive Care Med. 2020, 35, 1497–1504. [Google Scholar] [CrossRef]
- Cardinali, D.P.; Hardeland, R. Inflammaging, Metabolic Syndrome and Melatonin: A Call for Treatment Studies. Neuroendocrinology 2017, 104, 382–397. [Google Scholar] [CrossRef] [Green Version]
- Peplonska, B.; Bukowska, A.; Sobala, W. Association of Rotating Night Shift Work with BMI and Abdominal Obesity among Nurses and Midwives. PLoS ONE 2015, 10, e0133761. [Google Scholar] [CrossRef]
- Davis, S.; Mirick, D.K.; Chen, C.; Stanczyk, F.Z. Night Shift Work and Hormone Levels in Women. Cancer Epidemiol. Biomark. Prev. 2012, 21, 609–618. [Google Scholar] [CrossRef] [PubMed] [Green Version]
- Morris, C.J.; Purvis, T.E.; Mistretta, J.; Hu, K.; Scheer, F.A.J.L. Circadian Misalignment Increases C-Reactive Protein and Blood Pressure in Chronic Shift Workers. J. Biol. Rhythms 2017, 32, 154–164. [Google Scholar] [CrossRef] [Green Version]
- Ramin, C.; Devore, E.E.; Wang, W.; Pierre-Paul, J.; Wegrzyn, L.R.; Schernhammer, E.S. Night Shift Work at Specific Age Ranges and Chronic Disease Risk Factors. Occup. Environ. Med. 2015, 72, 100–107. [Google Scholar] [CrossRef] [PubMed]
- Linnér, A.; Almgren, M. Epigenetic Programming—The Important First 1000 Days. Acta Paediatr. 2020, 109, 443–452. [Google Scholar] [CrossRef] [PubMed] [Green Version]
- Bonmati-Carrion, M.A.; Middleton, B.; Revell, V.; Skene, D.J.; Rol, M.A.; Madrid, J.A. Circadian Phase Asessment by Ambulatory Monitoring in Humans: Correlation with Dim Light Melatonin Onset. Chronobiol. Int. 2014, 31, 37–51. [Google Scholar] [CrossRef] [Green Version]
- Paine, S.-J.; Gander, P.H. Differences in Circadian Phase and Weekday/Weekend Sleep Patterns in a Sample of Middle-Aged Morning Types and Evening Types. Chronobiol. Int. 2016, 33, 1009–1017. [Google Scholar] [CrossRef]
- Checa-Ros, A.; Muñoz-Hoyos, A.; Molina-Carballo, A.; Muñoz-Gallego, A.; Narbona-Galdó, S.; Jerez-Calero, A.; del Augustín-Morales, M.C. Analysis of Different Melatonin Secretion Patterns in Children with Sleep Disorders: Melatonin Secretion Patterns in Children. J. Child Neurol. 2017, 32, 1000–1008. [Google Scholar] [CrossRef]
- Kim, S. Ppcor: Partial and Semi-Partial (Part) Correlation. 2015. Available online: https://cran.r-project.org/web/packages/ppcor/ppcor.pdf (accessed on 20 September 2021).
- Wickham, H.; Romain, F.; Henry, L.; Müller, K. Dplyr: A Grammar of Data Manipulation. 2021. Available online: https://CRAN.R-project.org/package=dplyr (accessed on 20 September 2021).
- Wickham, H. Ggplot2: Elegant Graphics for Data Analysis; Springer: New York, NY, USA, 2016; ISBN 978-3-319-24277-4. [Google Scholar]
- Mullington, J.M.; Haack, M.; Toth, M.; Serrador, J.M.; Meier-Ewert, H.K. Cardiovascular, Inflammatory, and Metabolic Consequences of Sleep Deprivation. Prog. Cardiovasc. Dis. 2009, 51, 294–302. [Google Scholar] [CrossRef] [Green Version]
- Zerón-Rugerio, M.F.; Longo-Silva, G.; Hernáez, Á.; Ortega-Regules, A.E.; Cambras, T.; Izquierdo-Pulido, M. The Elapsed Time between Dinner and the Midpoint of Sleep Is Associated with Adiposity in Young Women. Nutrients 2020, 12, 410. [Google Scholar] [CrossRef] [Green Version]
- Itagi, A.B.H.; Nagaraja, S.S.; Bondade, S.Y.; Yunus, Y.G. Relationship of Resting Heart Rate with Body Composition and Obesity among Young Adults in India—A cross sectional study. Natl. J. Physiol. Pharm. Pharmacol. 2014, 4, 143–148. [Google Scholar] [CrossRef] [Green Version]
- Millis, R.M.; Austin, R.E.; Hatcher, M.D.; Bond, V.; Faruque, M.U.; Goring, K.L.; Hickey, B.M.; DeMeersman, R.E. Association of Body Fat Percentage and Heart Rate Variability Measures of Sympathovagal Balance. Life Sci. 2010, 86, 153–157. [Google Scholar] [CrossRef] [PubMed] [Green Version]
- Yadav, R.L.; Yadav, P.K.; Yadav, L.K.; Agrawal, K.; Sah, S.K.; Islam, M.N. Association between Obesity and Heart Rate Variability Indices: An Intuition toward Cardiac Autonomic Alteration—A Risk of CVD. Diabetes Metab. Syndr. Obes. Targets Ther. 2017, 10, 57–64. [Google Scholar] [CrossRef] [PubMed] [Green Version]
- Dagnino-Subiabre, A.; Orellana, J.A.; Carmona-Fontaine, C.; Montiel, J.; Díaz-Velíz, G.; Serón-Ferré, M.; Wyneken, U.; Concha, M.L.; Aboitiz, F. Chronic Stress Decreases the Expression of Sympathetic Markers in the Pineal Gland and Increases Plasma Melatonin Concentration in Rats. J. Neurochem. 2006, 97, 1279–1287. [Google Scholar] [CrossRef] [PubMed]
- Chistiakov, D.A.; Orekhov, A.N.; Bobryshev, Y.V. ApoA1 and ApoA1-Specific Self-Antibodies in Cardiovascular Disease. Lab. Investig. J. Tech. Methods Pathol. 2016, 96, 708–718. [Google Scholar] [CrossRef]
- Hoyos, M.; Guerrero, J.M.; Perez-Cano, R.; Olivan, J.; Fabiani, F.; Garcia-Pergañeda, A.; Osuna, C. Serum Cholesterol and Lipid Peroxidation Are Decreased by Melatonin in Diet-Induced Hypercholesterolemic Rats. J. Pineal Res. 2000, 28, 150–155. [Google Scholar] [CrossRef]
- Parandavar, N.; Hojat, M.; Abdali, K.; Keshtgar, S.; Emamghoreishi, M.; Yeganeh, B.S. The Effect of Melatonin on the Lipid Levels in Menopausal Women: A Double-Blind, Controlled, Clinical Trial. J. Educ. Health Promot. 2018, 7, 144. [Google Scholar] [CrossRef]
- Bahrami, M.; Cheraghpour, M.; Jafarirad, S.; Alavinejad, P.; Cheraghian, B. The Role of Melatonin Supplement in Metabolic Syndrome: A Randomized Double Blind Clinical Trial. Nutr. Food Sci. 2019, 49, 965–977. [Google Scholar] [CrossRef]
- Goyal, A.; Terry, P.D.; Superak, H.M.; Nell-Dybdahl, C.L.; Chowdhury, R.; Phillips, L.S.; Kutner, M.H. Melatonin Supplementation to Treat the Metabolic Syndrome: A Randomized Controlled Trial. Diabetol. Metab. Syndr. 2014, 6, 124. [Google Scholar] [CrossRef] [Green Version]
- Karolczak, K.; Watala, C. The Mystery behind the Pineal Gland: Melatonin Affects the Metabolism of Cholesterol. Oxid. Med. Cell. Longev. 2019, 2019, e4531865. [Google Scholar] [CrossRef] [PubMed]
- Waldhauser, F.; Waldhauser, M.; Lieberman, H.R.; Deng, M.-H.; Lynch, H.J.; Wurtman, R.J. Bioavailability of Oral Melatonin in Humans. Neuroendocrinology 1984, 39, 307–313. [Google Scholar] [CrossRef] [PubMed]
- Al-Rawi, N.; Madkour, M.; Jahrami, H.; Salahat, D.; Alhasan, F.; BaHammam, A.; Al-Islam Faris, M.E. Effect of Diurnal Intermittent Fasting during Ramadan on Ghrelin, Leptin, Melatonin, and Cortisol Levels among Overweight and Obese Subjects: A Prospective Observational Study. PLoS ONE 2020, 15, e0237922. [Google Scholar] [CrossRef] [PubMed]
- Tam, C.S.; Clément, K.; Baur, L.A.; Tordjman, J. Obesity and Low-Grade Inflammation: A Paediatric Perspective. Obes. Rev. 2010, 11, 118–126. [Google Scholar] [CrossRef]
- Peuhkuri, K.; Sihvola, N.; Korpela, R. Dietary Factors and Fluctuating Levels of Melatonin. Food Nutr. Res. 2012, 56, 17252. [Google Scholar] [CrossRef] [Green Version]
- Pereira, S.S.; Alvarez-Leite, J.I. Low-Grade Inflammation, Obesity, and Diabetes. Curr. Obes. Rep. 2014, 3, 422–431. [Google Scholar] [CrossRef]
- Sillen, M.; Declerck, P.J. A Narrative Review on Plasminogen Activator Inhibitor-1 and Its (Patho)Physiological Role: To Target or Not to Target? Int. J. Mol. Sci. 2021, 22, 2721. [Google Scholar] [CrossRef]
- Hotamisligil, G.S.; Arner, P.; Caro, J.F.; Atkinson, R.L.; Spiegelman, B.M. Increased Adipose Tissue Expression of Tumor Necrosis Factor-Alpha in Human Obesity and Insulin Resistance. J. Clin. Investig. 1995, 95, 2409–2415. [Google Scholar] [CrossRef] [PubMed]
- Visser, M.; Bouter, L.M.; McQuillan, G.M.; Wener, M.H.; Harris, T.B. Elevated C-Reactive Protein Levels in Overweight and Obese Adults. JAMA 1999, 282, 2131–2135. [Google Scholar] [CrossRef] [Green Version]
- Wright, K.P.; Drake, A.L.; Frey, D.J.; Fleshner, M.; Desouza, C.A.; Gronfier, C.; Czeisler, C.A. Influence of Sleep Deprivation and Circadian Misalignment on Cortisol, Inflammatory Markers, and Cytokine Balance. Brain. Behav. Immun. 2015, 47, 24–34. [Google Scholar] [CrossRef] [PubMed] [Green Version]
- Robinson, T.N.; Banda, J.A.; Hale, L.; Lu, A.S.; Fleming-Milici, F.; Calvert, S.L.; Wartella, E. Screen Media Exposure and Obesity in Children and Adolescents. Pediatrics 2017, 140, S97–S101. [Google Scholar] [CrossRef] [Green Version]
- Shafii, M.; Macmillan, D.R.; Key, M.P.; Kaufman, N.; Nahinsky, I.D. Case Study: Melatonin in Severe Obesity. J. Am. Acad. Child Adolesc. Psychiatry 1997, 36, 412–416. [Google Scholar] [CrossRef] [PubMed]
- Müller, H.L.; Handwerker, G.; Wollny, B.; Faldum, A.; Sörensen, N. Melatonin Secretion and Increased Daytime Sleepiness in Childhood Craniopharyngioma Patients. J. Clin. Endocrinol. Metab. 2002, 87, 3993–3996. [Google Scholar] [CrossRef]


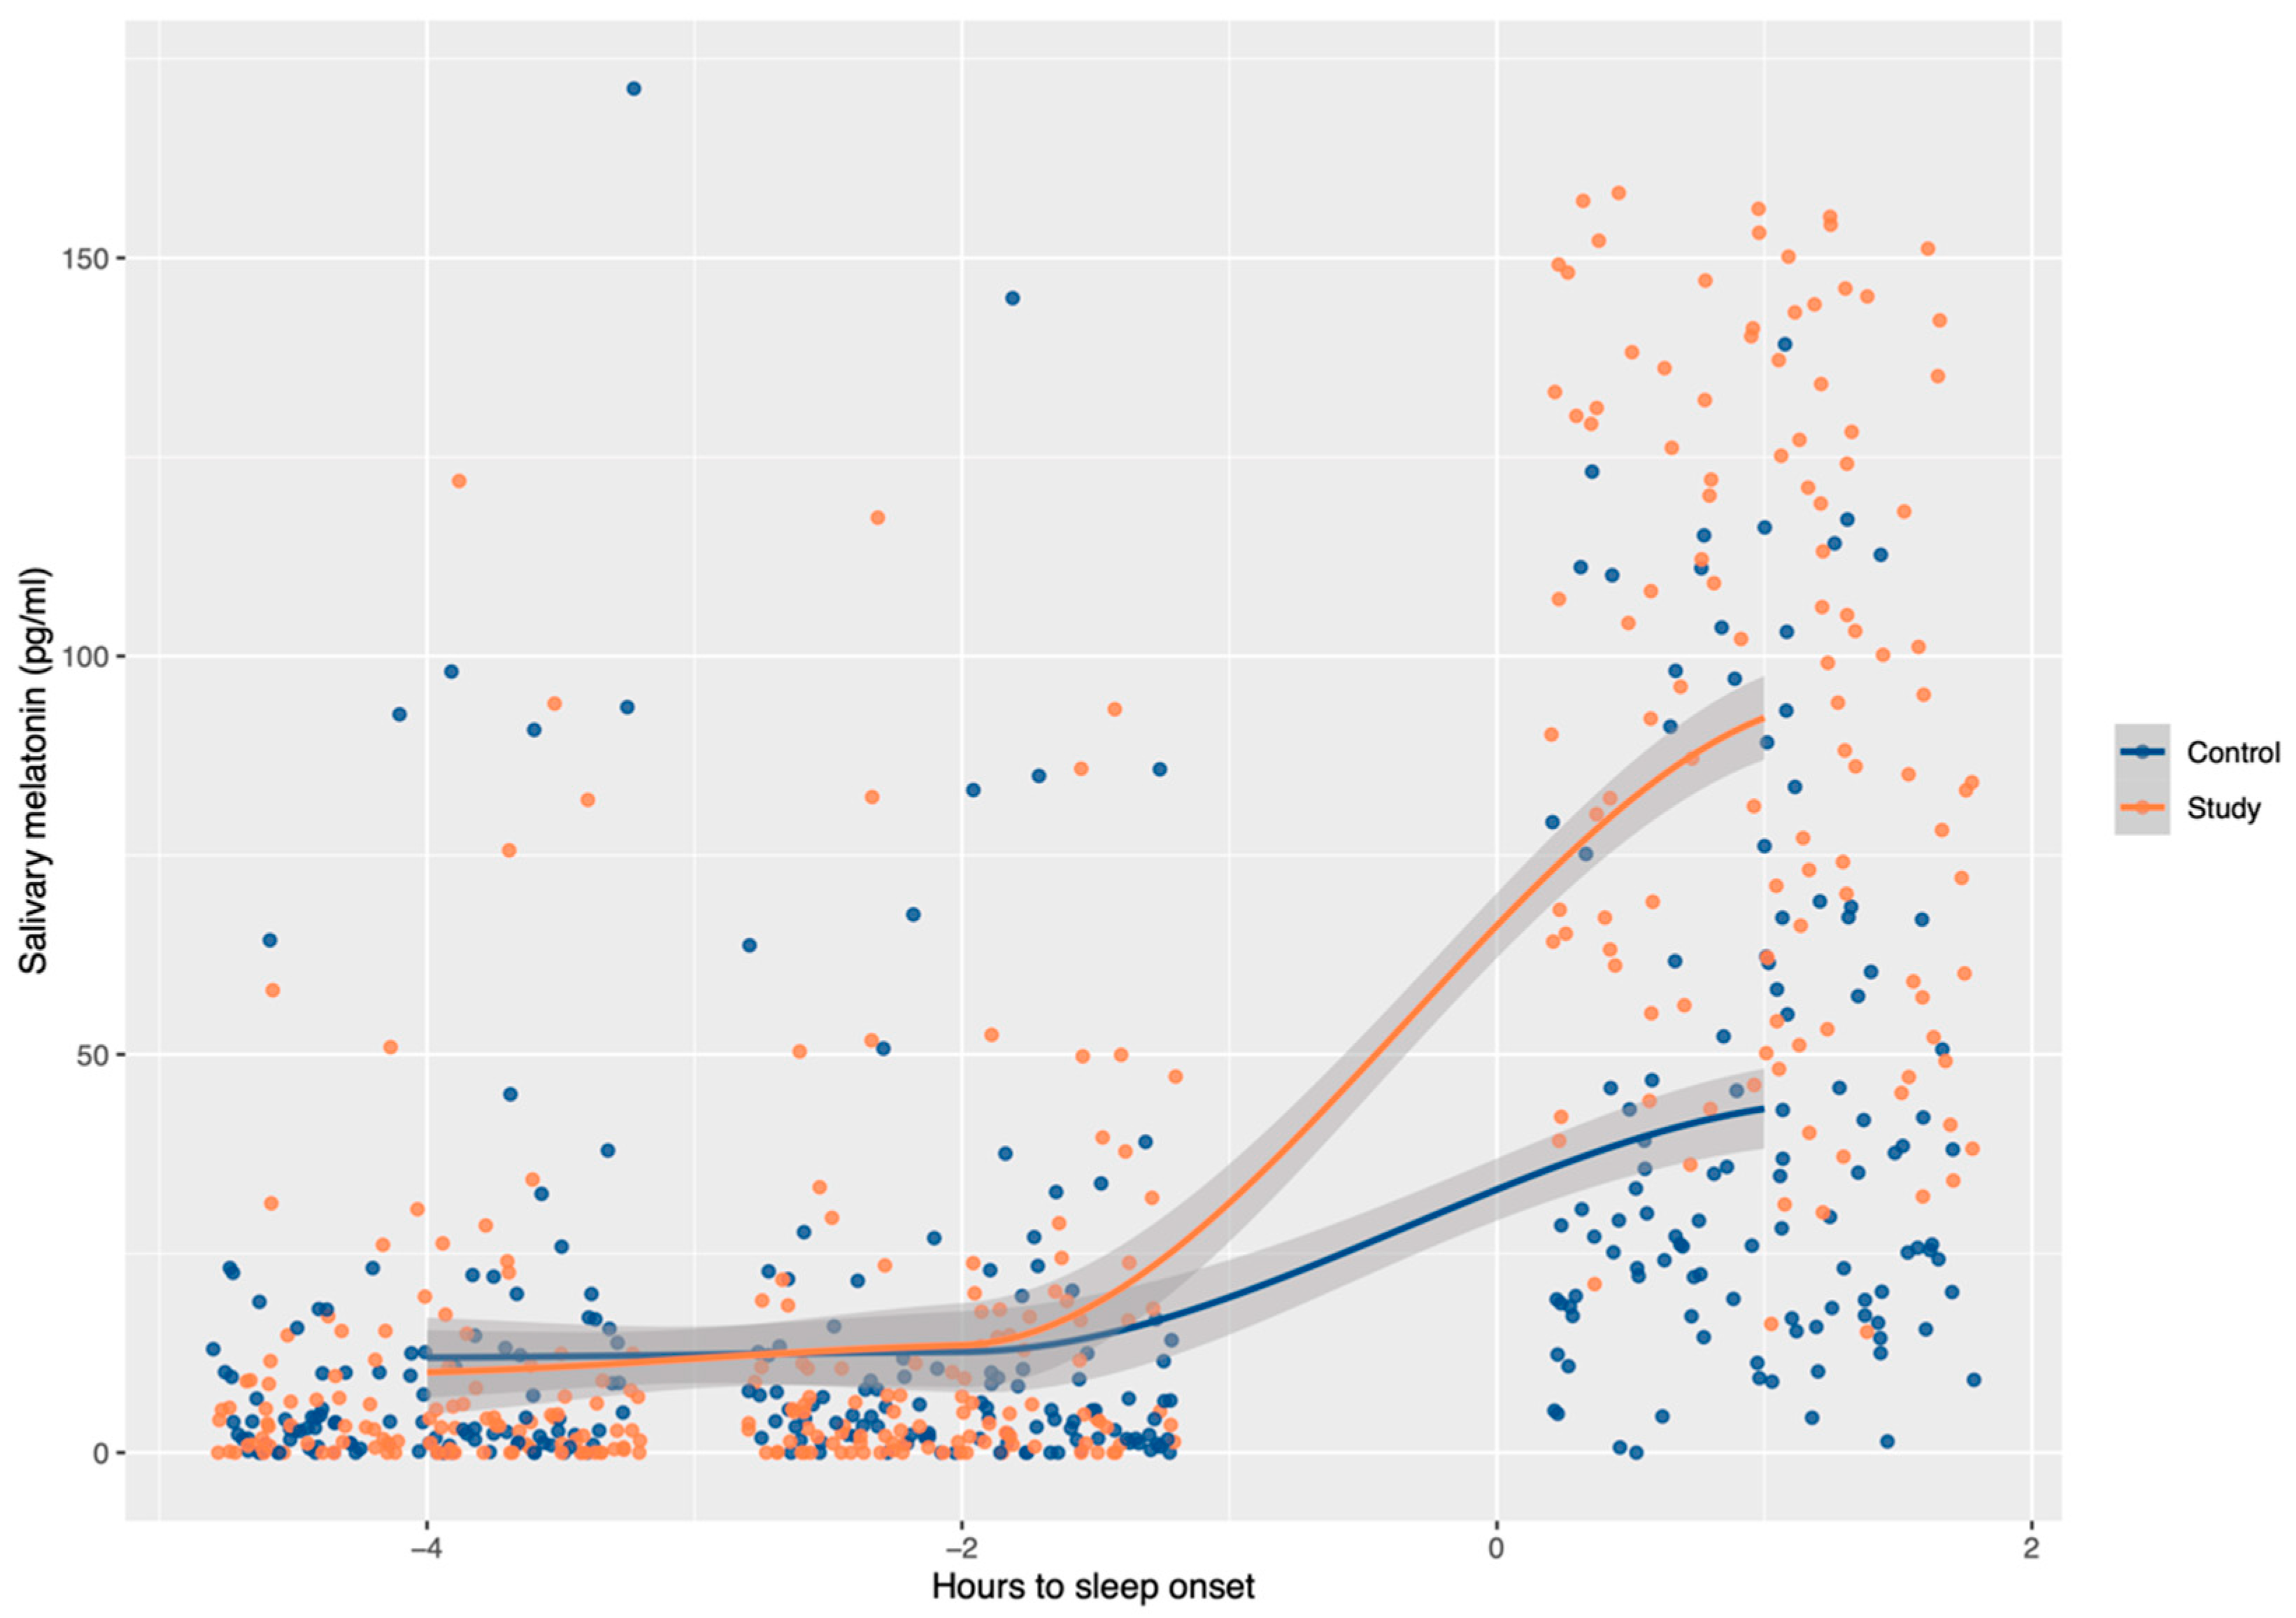
| Time Relative to Sleep Onset | Study Group | Control Group | p-Value |
|---|---|---|---|
| −4 h | 3.55 (0.65–9.23) | 3.72 (0.97–12.60) | 0.659 |
| −2 h | 5.13 (1.22–17.75) | 5.35 (1.84–12.23) | 0.930 |
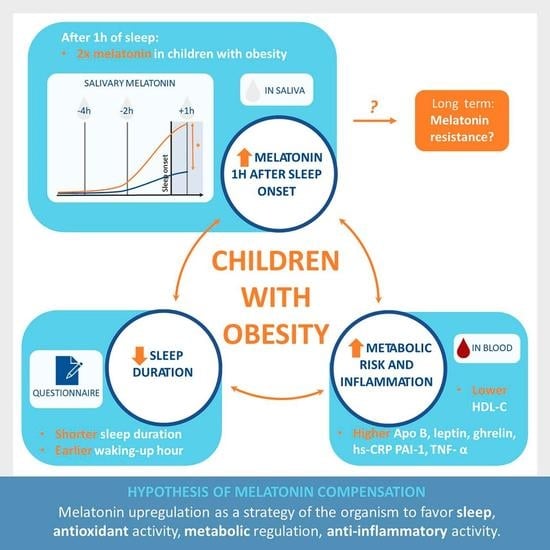
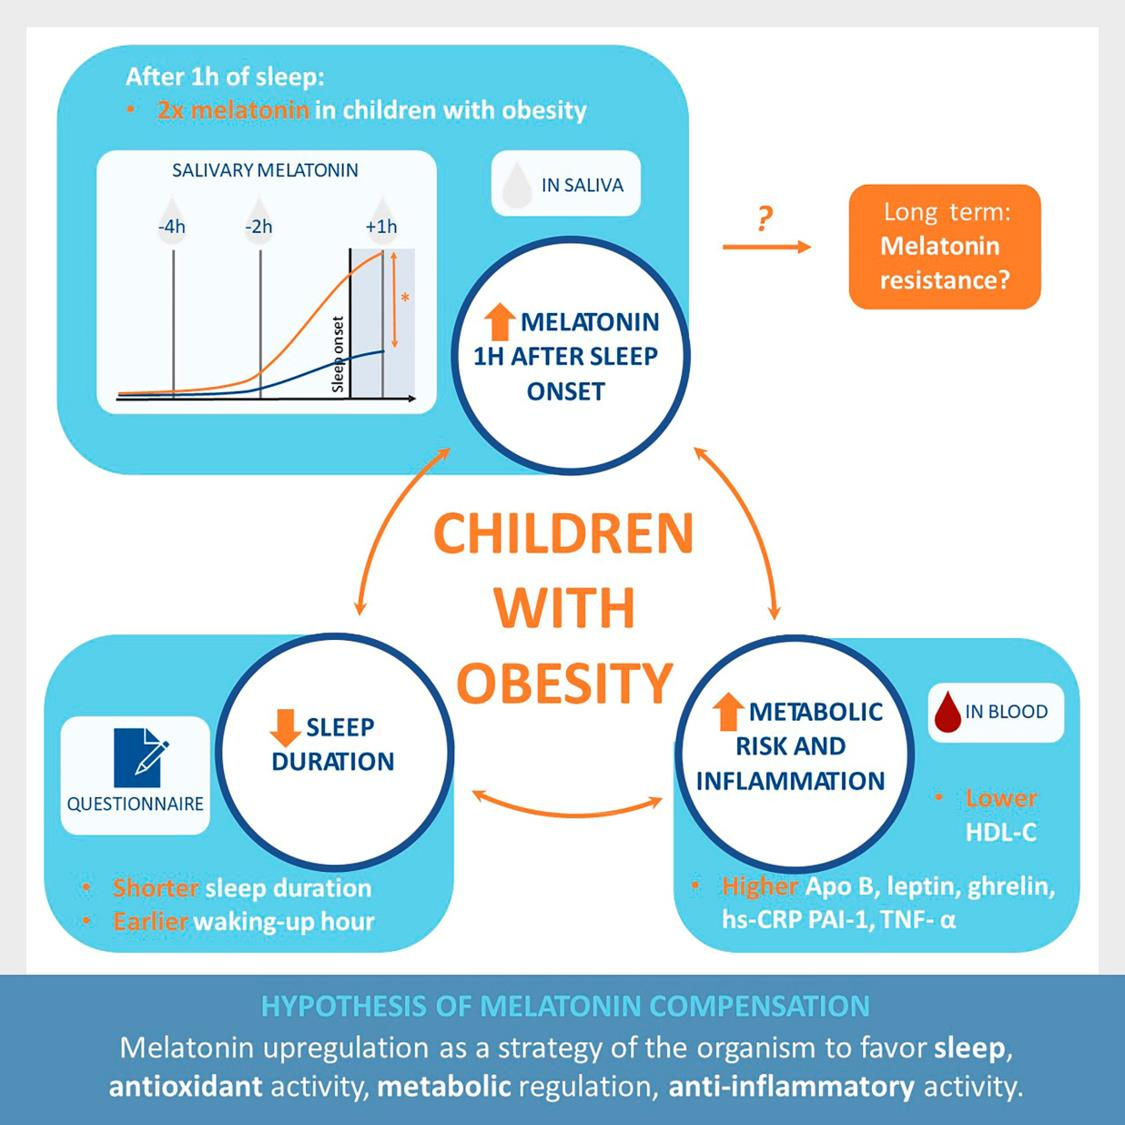
| +1 h | 90.16 (57.16–129.16) * | 29.82 (19.05–61.54) * | <0.001 |
| Study Group | Control Group | p-Value | |
|---|---|---|---|
| Bedtime (h) | 22:30 (22:00–23:00) | 22:30 (22:00–23:00) | 0.166 |
| Wake time (h) | 7:15 (7:00–7:57) | 7:30 (7:00–8:00) | <0.001 |
| Nighttime sleep (h) | 8.45 (8.00–9.30) | 9.00 (8.25–10.00) | 0.002 |
Publisher’s Note: MDPI stays neutral with regard to jurisdictional claims in published maps and institutional affiliations. |
© 2021 by the authors. Licensee MDPI, Basel, Switzerland. This article is an open access article distributed under the terms and conditions of the Creative Commons Attribution (CC BY) license (https://creativecommons.org/licenses/by/4.0/).
Share and Cite
Gombert, M.; Martin-Carbonell, V.; Pin-Arboledas, G.; Carrasco-Luna, J.; Carrasco-García, Á.; Codoñer-Franch, P. Melatonin Levels in Children with Obesity Are Associated with Metabolic Risk and Inflammatory Parameters. Nutrients 2021, 13, 3629. https://doi.org/10.3390/nu13103629
Gombert M, Martin-Carbonell V, Pin-Arboledas G, Carrasco-Luna J, Carrasco-García Á, Codoñer-Franch P. Melatonin Levels in Children with Obesity Are Associated with Metabolic Risk and Inflammatory Parameters. Nutrients. 2021; 13(10):3629. https://doi.org/10.3390/nu13103629
Chicago/Turabian StyleGombert, Marie, Vanessa Martin-Carbonell, Gonzalo Pin-Arboledas, Joaquín Carrasco-Luna, Álvaro Carrasco-García, and Pilar Codoñer-Franch. 2021. "Melatonin Levels in Children with Obesity Are Associated with Metabolic Risk and Inflammatory Parameters" Nutrients 13, no. 10: 3629. https://doi.org/10.3390/nu13103629