Article

A Comprehensive, Multidisciplinary, Personalized, Lifestyle Intervention Program Is Associated with Increased Leukocyte Telomere Length in Children and Adolescents with Overweight and Obesity

by
George Paltoglou
1,
Christina Raftopoulou
2,
Nicolas C. Nicolaides
1,
Sofia M. Genitsaridi
1,
Sofia I. Karampatsou
1,
Marina Papadopoulou
1,
Penio Kassari
1 and
Evangelia Charmandari
1,2,*
1
Division of Endocrinology, Metabolism and Diabetes, First Department of Pediatrics, National and Kapodistrian University of Athens Medical School, ‘Aghia Sophia’ Children’s Hospital, 11527 Athens, Greece
2
Division of Endocrinology and Metabolism, Center for Clinical, Experimental Surgery and Translational Research, Biomedical Research Foundation of the Academy of Athens, 11527 Athens, Greece
*
Author to whom correspondence should be addressed.
Nutrients 2021, 13(8), 2682; https://doi.org/10.3390/nu13082682
Submission received: 15 June 2021 / Revised: 19 July 2021 / Accepted: 21 July 2021 / Published: 2 August 2021
(This article belongs to the Special Issue Nutrition and Endocrine Disorders)

Abstract

:
Leucocyte telomere length (LTL) is a robust marker of biological aging and is associated with obesity and cardiometabolic risk factors in childhood and adolescence. We investigated the effect of a structured, comprehensive, multidisciplinary, personalized, lifestyle intervention program of healthy diet and physical exercise on LTL in 508 children and adolescents (239 males, 269 females; 282 prepubertal, 226 pubertal), aged 10.14 ± 0.13 years. Participants were classified as obese (n = 267, 52.6%), overweight (n = 174, 34.2%), or of normal BMI (n = 67, 13.2%) according to the International Obesity Task Force (IOTF) cutoff points and were studied prospectively for one year. We demonstrated that LTL increased significantly after 1 year of the lifestyle interventions, irrespective of gender, pubertal status, or body mass index (BMI). Waist circumference was the best negative predictor of LTL at initial assessment. The implementation of the lifestyle interventions also resulted in a significant improvement in clinical (BMI, BMI z-score and waist to height ratio) and body composition indices of obesity, inflammatory markers, hepatic enzymes, glycated hemoglobin (HbA1C), quantitative insulin sensitivity check index (QUICKI), and lipid profile in all participants. These findings indicate that the increased LTL may be associated with a more favorable metabolic profile and decreased morbidity later in life.

1. Introduction

Telomeres in humans are tandem repeats of hexameric (5′-TTAGGG-3′) nucleotide sequences at the ends of linear chromosomes, which represent part of a complex ribonucleoprotein structure that caps the end of each chromosome and erodes with each cell division [1]. This cap protects the chromosome from nucleolytic degradation and prevents their recognition as sites of DNA damage [1]. Telomere length preservation or the dysfunction of end-capping was previously linked to genomic instability and ageing [2]. Furthermore, cumulative exposure to agents that result in DNA damage, such as oxidative, inflammatory, and other forms of biological stress lead to telomere attrition [3]. Leucocyte telomere length (LTL) is an established biomarker of biological aging (telomeres shorten in an age-dependent manner), that varies considerably among individuals and is associated with cardiovascular risk factors, such as essential hypertension, insulin resistance and diabetes mellitus type 2, as well as pathological processes associated with oxidative stress [4,5,6,7].
Obesity in childhood or adolescence represents one of the greatest challenges in public health of the 21st century, and the term ‘epidemic’ is commonly used to indicate the rapid increase in its prevalence during the last four decades [8]. In 2015, a total of 107.7 million children and 603.7 million adults had obesity, and the prevalence of obesity increases more rapidly in children than in adults in many countries [9]. The prevalence of overweight and obesity in childhood and adolescence in Greece exceeds 30–35%, which is among the highest rates in Europe [10]. Obesity in childhood and adolescence leads to obesity in adulthood and is associated with significant morbidity and mortality, as well as a significant increase in public health costs [11]. Complications of obesity include insulin resistance, glucose intolerance, diabetes mellitus type 2, dyslipidemia, hypertension, endothelial dysfunction, early onset atherosclerotic cardiovascular disease, hypogonadism, orthopedic problems, fatty liver disease, cholecystitis, social stigmatization, and increased incidence of certain malignancies [8]. Therefore, it is imperative that the prevention and management of overweight and obesity should commence in childhood to ensure improved health in adulthood, as well as reduced medical costs owing to complications of obesity. To address the epidemic of childhood obesity in our country, we developed novel e-Health applications that are expected to play an important role in the prevention and management of overweight and obesity in children and adolescents [12,13]. In addition, we demonstrated that a structured, comprehensive, multidisciplinary intervention program that provides detailed and individualized advice on diet and exercise are effective at reducing the prevalence of overweight and obesity in childhood and adolescence [12,13,14].
Several conditions that arise as complications of obesity are associated with decreased LTL, and this association is evident even in childhood [6,15,16,17,18,19]. Although few in number, these human population studies investigated the association of LTL and obesity in children and adolescents and provided clues that weight loss via a structured multidisciplinary program might increase LTL, while greater LTL could potentially predict a better weight loss response to an intervention program in overweight/obese male adolescents [16]. Furthermore, there is evidence that obesity-associated LTL differences in gender might follow the sexual dimorphic pattern of longevity [7,20,21]. The biology of cardiovascular aging differs between men and women, with men with shorter LTL demonstrating more elevated markers of cardiovascular aging compared with women [20].
The aim of our prospective study was to investigate the effect of a 12-months’ structured, comprehensive, multidisciplinary, personalized lifestyle intervention program of healthy diet and physical exercise on leukocyte telomere length in children and adolescents. The primary aim was to determine differences in LTL before and after the 12-months’ structured intervention program, according to body mass index (BMI), gender and pubertal status, and to define potential factors that influence these changes. Our study included a larger number of participants than previously reported, which allowed us to also investigate the possible role of gender and/or puberty on the association of BMI and LTL.

2. Materials and Methods

2.1. Study Design

This was a prospective study of a cohort of participants attending the Out-patient Clinic for the Prevention and Management of Overweight and Obesity in Childhood and Adolescence, Division of Endocrinology, Metabolism and Diabetes, First Department of Pediatrics, National and Kapodistrian University of Athens Medical School, ‘Aghia Sophia’ Children’s Hospital, who participated in a structured, comprehensive, multidisciplinary, and personalized lifestyle intervention program of diet and exercise for 12 months. The study included data of the initial and annual follow-up visit. The study was conducted in accordance with the Declaration of Helsinki and was approved by the Committee on the Ethics of Human Research of ‘Aghia Sophia’ Children’s Hospital (Approval Number: EB-PASCH-MoM: 28/11/2013, Re: 10290-14/05/2013). The aims and the procedures of the study were fully disclosed to the parents or legal guardians of the participants. Written informed consent was obtained in all cases by a parent/guardian, and assent was given by children older than 7 years. There was no difference to the care given to patients that did not opt to participate or did not complete the study.

2.2. Participants

Five hundred and eight (ntotal = 508; 239 males, 269 females) children and adolescents, aged 10.14 ± 0.13 years (mean ± SE), consecutively attending our Out-patient Clinic for the Prevention and Management of Overweight and Obesity in Childhood and Adolescence were recruited to participate in the study. All participants were evaluated by a Pediatrician, Pediatric Endocrinologist, Pediatric Dietician, a professional fitness Personal Trainer and—when necessary—a Pediatric Clinical Psychologist, and entered a personalized, comprehensive, multidisciplinary management intervention program that provided personalized advice and guidance on healthy diet and physical exercise to participants and their families [13,14].

2.3. Study Protocol

2.3.1. Initial Assessment

All participants were admitted to the Endocrine Unit early in the morning on the day of the first visit, and a single trained observer obtained a detailed medical history and clinical examination, including Tanner pubertal assessment and standard anthropometric measurements (weight, height, waist circumference, hip circumference). Detailed hematologic, biochemical, and endocrinologic investigations, as well as body composition analysis and LTL measurement, were performed at 08:00 h following a 12-h fast. Pediatric Dietician, who advised them to eat regularly throughout the day and have three main meals (breakfast, lunch, and dinner) and two healthy snacks (fruits, vegetables) at mid-morning and mid-afternoon. The composition of main meals was suggested according to the 2010 USDA guidelines and the guidelines proposed by the National Nutritional Guide for Infants, Children, and Adolescents [22]. In addition, they were evaluated by a professional fitness Personal Trainer, and their activities and hobbies throughout the week were recorded. Subsequently, the personal trainer discussed the child’s interests with the family to identify suitable sport activities.

2.3.2. Intervention

At initial assessment participants were classified as obese (n = 267, 52.6%), over-weight (n = 174, 34.2%) or of normal BMI (n = 67, 13.2%) according to the International Obesity Task Force (IOTF) cutoff points [23,24], and according to Tanner criteria as pre-pubertal (n = 282) and pubertal (n = 226). The participants were studied prospectively for one year with scheduled appointments according to a standardized follow-up protocol [10,12,13,14]. Subjects with obesity were followed up every month, those with overweight every 2 months and those with normal-BMI every 3 months. Upon each follow-up visit, all anthropometric measurements (weight, height, waist circumference, hip circumference) were determined, clinical examination and Tanner pubertal assessment were performed, a 24-h diet recall was recorded, and all the goals set at previous sessions were discussed in detail. Subsequently, all participants had their 24-h recall of their diet evaluated based on the USDA method by the Pediatric Dietitian and the Pediatrician, to minimize the reduced validity of 24-h in school aged children, and dietary counseling was provided [23,24].

2.3.3. Annual Follow-Up Visit

All participants were admitted to the Endocrine Unit early in the morning on the day of the annual follow-up visit, and a detailed medical history and clinical examination, including Tanner pubertal assessment and standard anthropometric measurements (weight, height, waist circumference, hip circumference) were obtained by a single trained observer. Following the clinical assessment detailed hematologic, biochemical, and endocrinologic investigations, as well as body composition analysis and LTL measurement, were performed, at 08:00 h following a 12-h fast. Good compliance for the study purposes was evaluated at the annual follow-up appointment and was defined as 100% compliance with the follow-up visits and the above-mentioned separate evaluations of the multidisciplinary team. In total, 407 (80.1%) of the initially 508 enrolled participants completed all the required follow-up visits in the 12 months of the Multidisciplinary Structured Lifestyle Intervention Program [189 males, 218 females; aged 11.23 ± 0.15 years (mean ± SE)]; these were included in the subjects with “good compliance” group and their data were further analyzed. All participants included in the study self-reported good adherence with the advice given on diet and exercise. The clinical characteristics of subjects with “good compliance” are summarized in Table 1A.

2.4. Anthropometric and Body Composition Parameters

Body weight was measured in light clothing and without shoes using the same scale for all participants (Seca GmbH & Co. KG., Hamburg, Germany). Standing height was also measured without shoes using a stadiometer (Holtain Limited, Crymych–Dyfed, UK). Body mass index (BMI) was calculated as body weight (in kg) divided by height (in m) squared and expressed in kg/m2. Subsequently, BMI z-score was calculated according to the Greek standard growth charts [25]. In addition, World Health Organization (WHO) STEPwise approach to Surveillance (STEPS) protocol was used for waist and hip circumferences measurements by employing the same stretch-resistant tape (Seca GmbH & Co. KG., Hamburg, Germany). Waist circumference was measured, with the participant standing, in the horizontal plane midway between the lowest rib and the iliac crest at the end of a normal expiration, while hip circumference was also measured in the horizontal plane at the level of maximum circumference of hips and buttocks. Blood pressure was determined by a sphygmomanometer with an appropriate cuff for the age of the participant (Comfort 20/40, Visomat, Parapharm, Metamorphosi, Attiki, Greece) [14]. Furthermore, each participant underwent bioelectrical impedance analysis (BIA) (TANITA MC-780U Multi Frequency Segmental Body Composition Analyzer, Amsterdam, The Netherlands). Blood samples for baseline hematologic, biochemical, and endocrinologic investigations, and LTL measurement were obtained at 08:00 h after a 12-h overnight fast. Samples were centrifuged and separated immediately after collection and were stored at −80 °C until assayed.

2.5. Assays

Hematologic investigations were performed in the ADVIA 2110i analyzer (Roche Diagnostics GmbH, Mannheim, Germany). The concentrations of glucose, total cholesterol, triglycerides and high-density lipoprotein cholesterol were determined in the ADVIA 1800 Siemens analyzer (Siemens Healthcare Diagnostics, Tarrytown, NY, USA). Apolipoprotein A1, B and lipoprotein (a) concentrations were determined by means of latex particle-enhanced immunonephelometric assays on the BN ProSpec nephelometer (Dade Behring, Siemens Healthcare Diagnostics, Liederbach, Germany). Hemoglobin A1C was measured on an automated glycohemoglobin analyzer HA-8160 (Arkray, Kyoto, Japan) by employing reversed-phase cation exchange high performance liquid chromatography. Insulin resistance was assessed using the homeostasis model assessment (HOMA-IR) method as follows: HOMA-IR = [fasting glucose (mg/dL) × fasting insulin (mU/L)]/405. In addition quantitative insulin sensitivity check index (QUICKI) was calculated using the following formula: QUICKI= 1/[log(fasting insulin µU/mL) + log(fasting glucose mg/dL)].
Follicle-stimulating hormone (FSH), luteinizing hormone (LH), estradiol, ferritin, and insulin concentrations were measured in an automated electrochemiluminescense immunoassays analyzer (Cobas e411, Roche Diagnostics GmbH, Mannheim, Germany). Thyroid-stimulating hormone (TSH), free thyroxine, antithyroid peroxidase antibodies, anti-thyroglobulin antibodies), adrenocorticotropin (ACTH), cortisol, androstenedione, testosterone, dehydroepiandrosterone (DHEA), dehydroepiandrosterone sulfate (DHEAS), insulin-like growth factor-I (IGF-I), insulin-like growth factor binding protein-3 (IGFBP-3), and high-sensitivity C-reactive protein (hsCRP) concentrations were measured by chemiluminescence immunoassays on an IMMULITE 2000 immunoassay system (Siemens Healthcare Diagnostics Products Ltd., Surrey, UK). Total 25-hydroxyvitamin D concentration was measured by employing an automated electrochemiluminescence immunoassay on the Modular Analytics E170 analyzer (Roche Diagnostics, Basel, Switzerland).

2.6. Leucocyte Telomere Length

Leucocyte telomere length (LTL) was determined by employing multiplex monochrome quantitative real-time polymerase chain reaction (PCR) as previously described [18,26]. In brief, QiaGenMaxiprep kit (Qiagen) was used for genomic DNA extraction from peripheral leucocytes. All quantitative real-time PCRs were performed in triplicates in a final volume of 12.5 μL. Briefly, 15 ng of template DNA were mixed with final concentrations of 1 × iTaq™ Universal SYBR® Green Supermix (Bio-Rad Laboratories, Hercules, CA, USA), 900 nm of the primers telg and telc, and 500 nm of hbgd and hbgu as single-copy gene primers. All PCRs were performed in 96-well plates using the CFX real-time PCR detection system (Bio-Rad Laboratories). Five serial dilutions of DNA extracted from peripheral leucocytes of an adult female (reference sample) spanning 3.75–60 ng were run on each plate in duplicates. Two standard curves for each plate were generated from the reference sample DNA dilutions, using the CFX manager software (Bio-Rad Laboratories, Hercules, California, USA): the first standard curve for the telomere amplicon signal (T) and the second standard curve for the single-copy gene (haemoglobin) amplicon signal (S). The T/S ratios were then estimated for each sample as T, the copy number of the telomere template for experimental sample, divided by S, which represented the copy number of the single-copy gene template. Only T/S measurements with coefficient of variation of triplicate samples, of less than 15% were accepted for further analyses.

2.7. Statistical Analysis

All variables were normally distributed. Results are reported as mean ± SE. Statistical significance was set at p < 0.05. All variables assessed at initial assessment and at 12 months’ follow-up were compared by employing repeated-measures analysis of variance test (ANOVA) with obese/overweight/normal-BMI, male/female and prepubertal/pubertal as between subjects’ factors. Significant main effects were revealed by Fischer’s (LSD) post-hoc test. Correlations of the studied variables were evaluated by the Pearson’s R coefficient. To investigate for potential predictors of LTL at initial assessment, at annual assessment and the respective change (Delta) of LTL, all taken as dependent variables, standard forward, stepwise multiple regression models were employed. In the first model that assessed metabolic syndrome parameters, systolic blood pressure (SBP), waist circumference, cholesterol, triglycerides, and high-density lipoprotein (HDL) were taken as independent variables. In the second model that assessed body composition parameters, fat percentage, fat mass, muscle mass, bone mass, fat free mass, total body water, and basal metabolic rate (BMR) were taken as independent variables. In the third model that assessed anthropometric parameters, weight, height, BMI, waist, hip circumference, waist to hip ratio and waist to height ratio measurements were taken as independent variables. In the fourth and final model that assessed glucose metabolism and insulin sensitivity parameters, glucose, insulin, glycated hemoglobin (HbA1C), homeostatic model assessment (HOMA), and quantitative insulin sensitivity check index (QUICKI) measurements were taken as independent variables.
LTL measurements were further retrospectively assessed in participants that were successful at weight loss via two categorical criteria. Participants were considered successful if the respective BMI z-score decreased more than 0.6 at 12 months follow-up or if the respective IOTF category (obese, overweight, normal-BMI) improved by one or more steps. All statistical analyses were performed with the Statistica 8 software (StatSoft, Tulsa, OK, USA).

3. Results

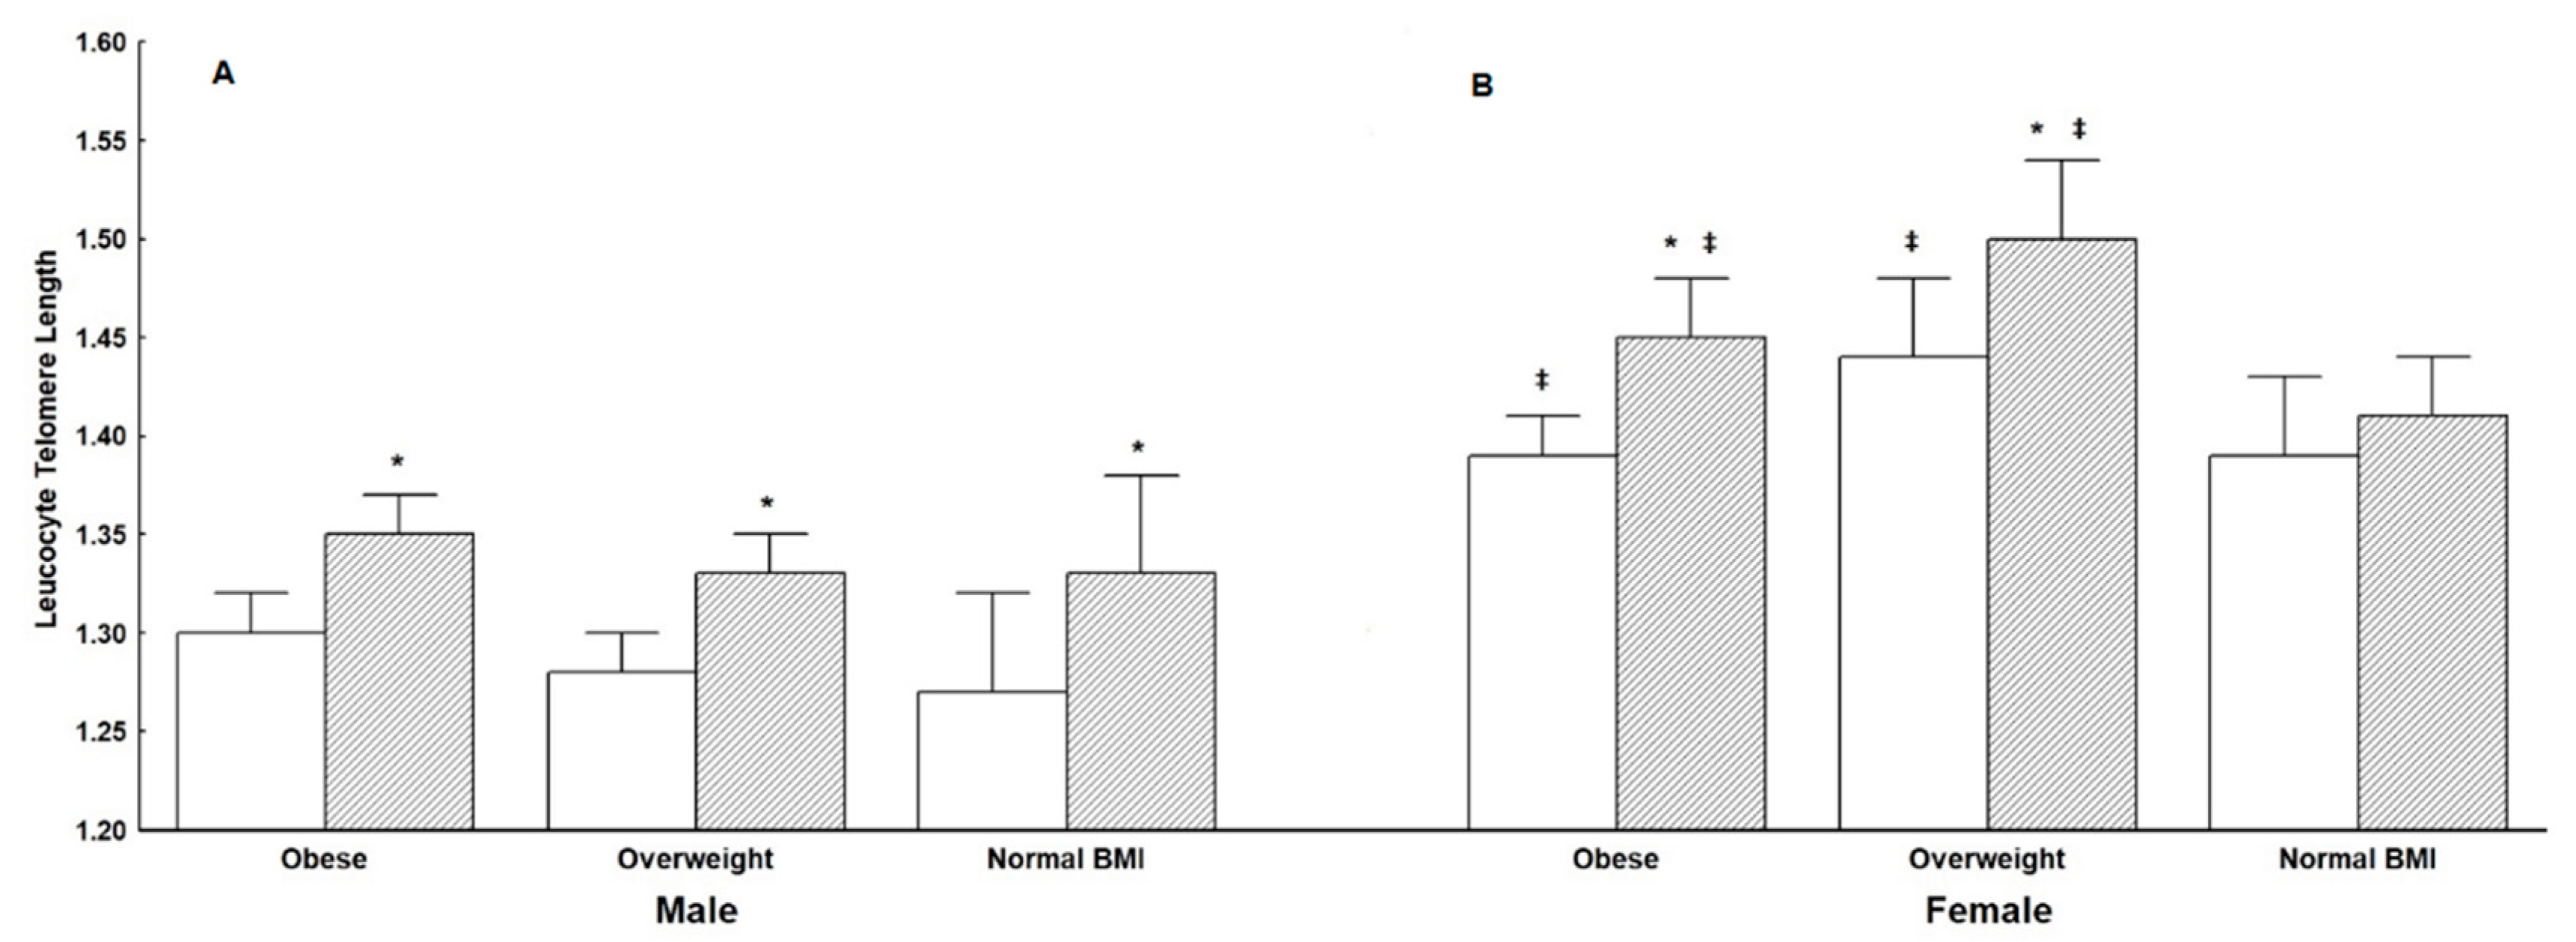
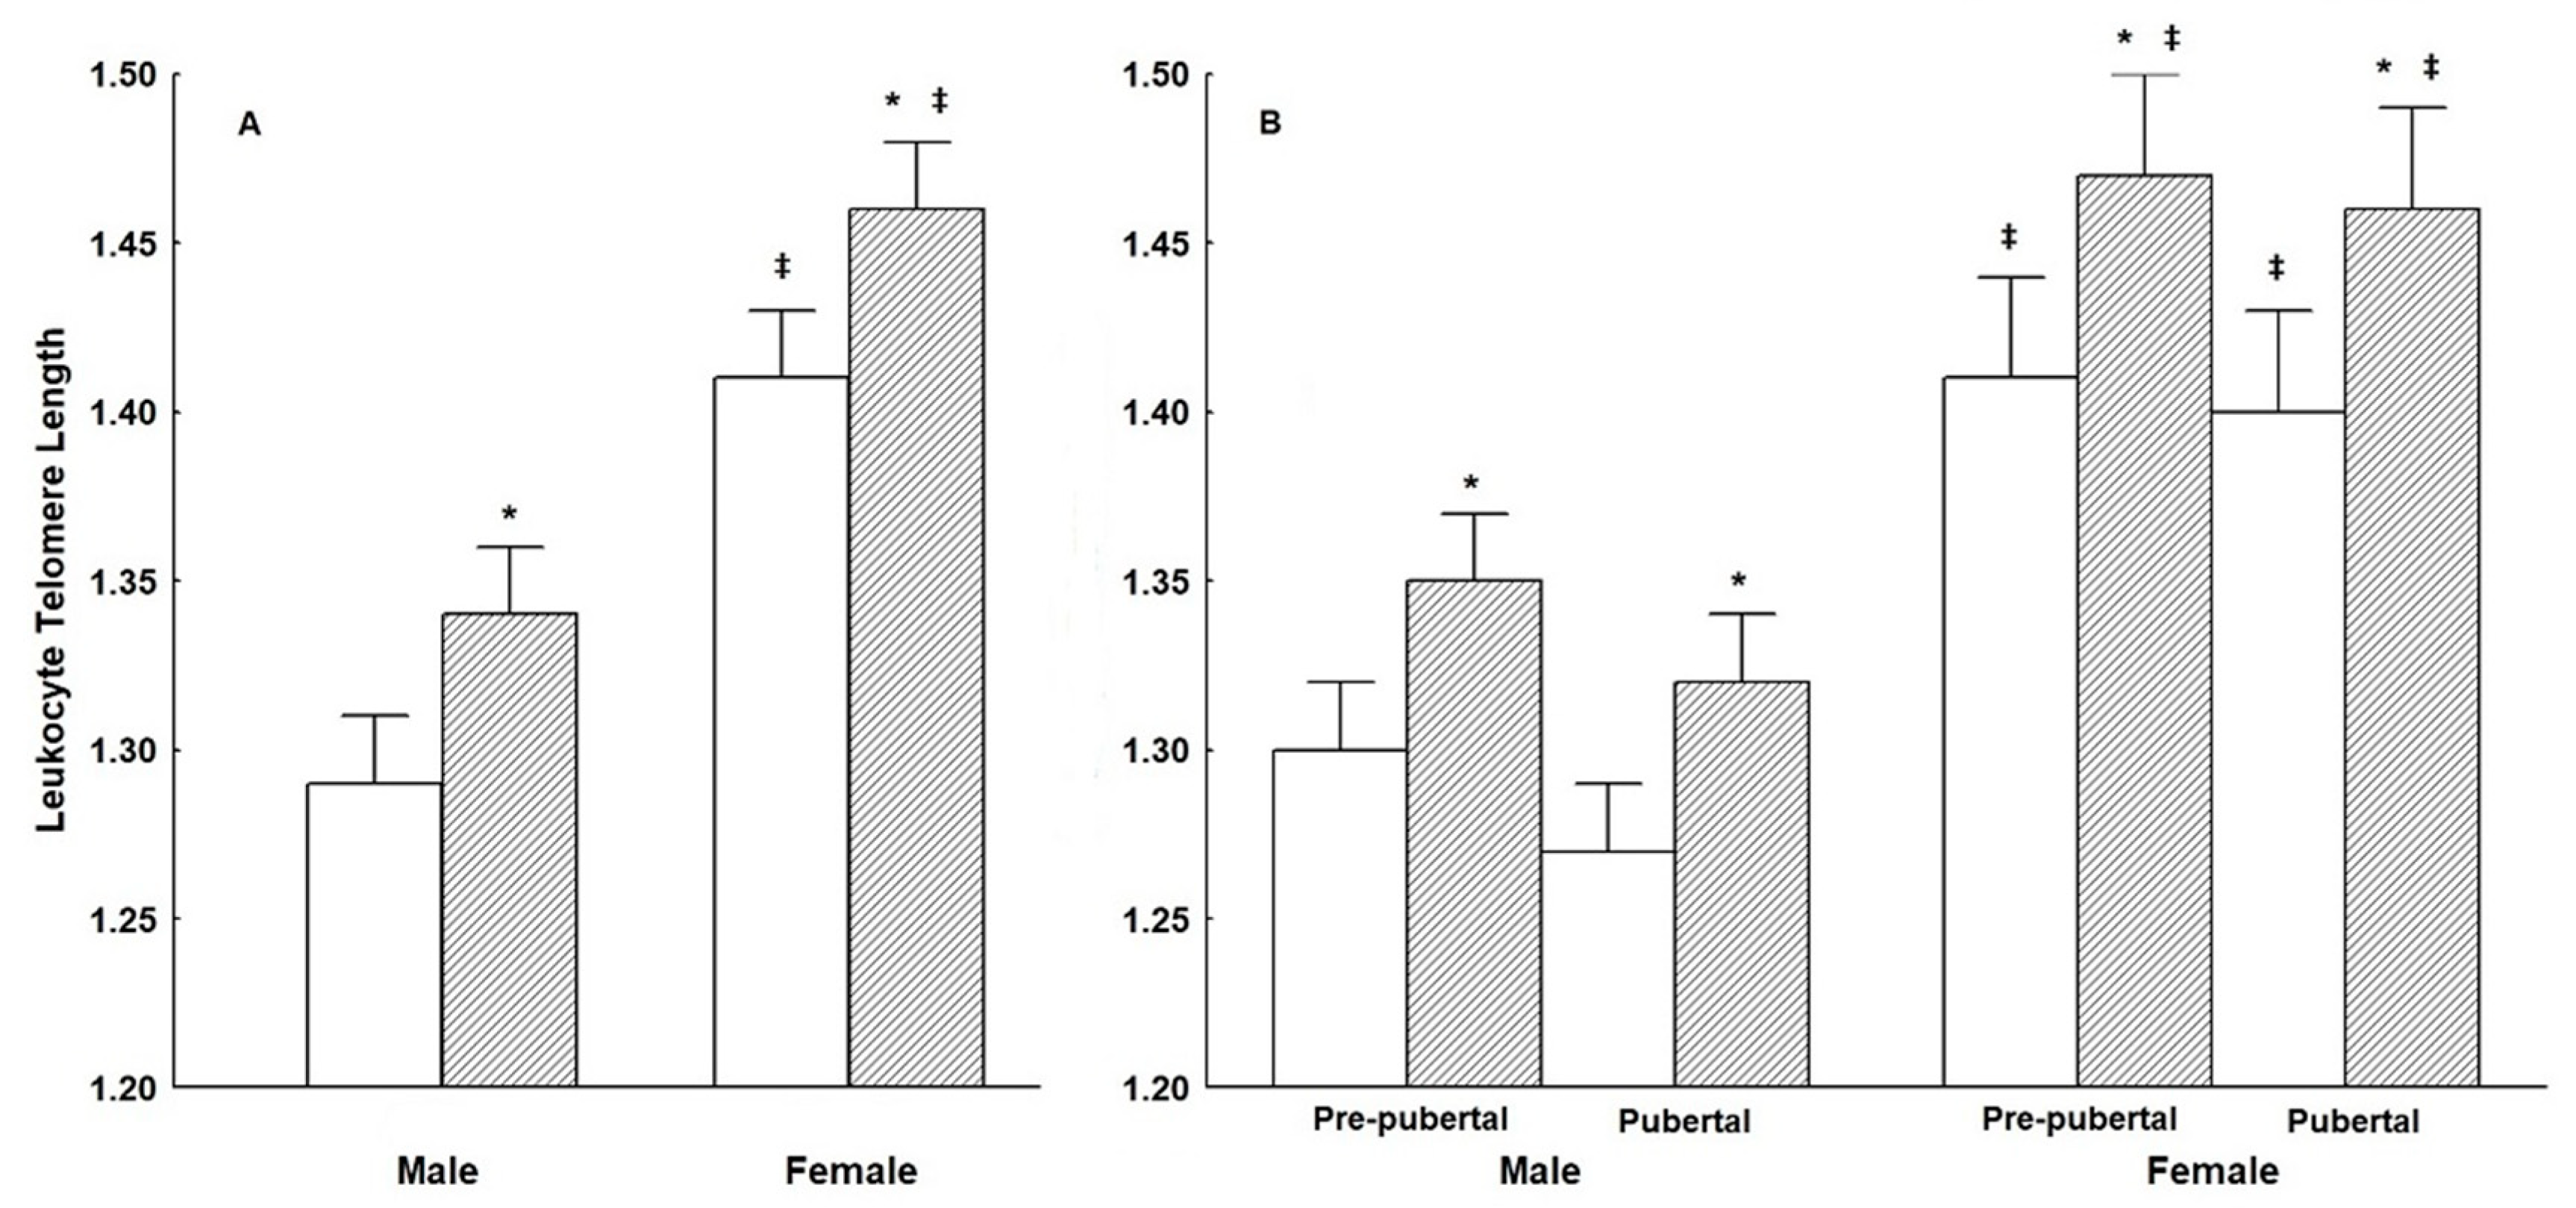
3.1. Leukocyte Telomere Length (LTL)

LTL increased significantly after the 1 year of lifestyle intervention program of healthy diet and physical exercise when all participants were considered (p < 0.01) (Table 2G). This significant increase in LTL following the reduction of BMI persisted when data were analyzed according to gender (as illustrated in Figure 1A) and Tanner pubertal status at initial assessment (as illustrated in Figure 1B). Furthermore, the significant post-intervention increase in LTL was present in obese, overweight, and normal-BMI male participants (as illustrated in Figure 2A), and obese and overweight female participants (as illustrated in Figure 2B).
Table 3 illustrates the LTL measurements of participants with “good compliance” (n = 407), according to the criterion of success at weight loss. Participants were considered successful at losing weight if their respective BMI z-score decreased > 0.6 at 12 months follow-up (Criterion A) or if the respective IOTF category (obese, overweight, normal-BMI) improved by one or more categories (Criterion B). LTL increased in both the successful and not successful at losing weight participants, irrespective of the criterion used (p < 0.01).

3.2. Predictors of Leukocyte Telomere Length (LTL) at Initial and Annual Assessment

Table 4 illustrates the results of the investigation for potential predictors of LTL by employing a standard forward, multiple stepwise linear regression model.
Metabolic syndrome parameters: among metabolic syndrome parameters at initial assessment (SBP, waist circumference, Cholesterol, Triglycerides, HDL), waist circumference at initial assessment was the best negative predictor of LTL both at initial (β: −0.14) and annual (β: −0.13) assessment. No significant predictor of Delta LTL was found.
Body composition parameters: among body composition measurements at initial assessment (fat percentage, fat mass, muscle mass, bone mass, fat free mass, total body water and BMR), BMR at initial assessment was the best negative predictor of LTL both at initial (β: −0.54) and annual (β: −0.49) assessment, while bone mass at initial assessment was the best positive predictor of LTL both at initial (β: 0.43) and annual (β: 0.38) assessment. No significant predictor of Delta LTL was found.
Anthropometric parameters: among anthropometric parameters at initial assessment (Weight, Height, BMI, Waist, Hip circumference, Waist to Hip ratio and Waist to height ratio), waist circumference at initial assessment was the best negative predictor of LTL at initial assessment (β: −0.27). Waist to hip ratio at initial assessment was the best negative predictor of LTL at annual assessment (β: −0.15). Waist to height ratio at initial assessment was the best positive predictor of Delta LTL (β: 0.41).
Glucose metabolism and insulin sensitivity parameters: among glucose metabolism and insulin sensitivity parameters (Glucose, Insulin and HbA1C, HOMA, QUICKI), glucose at initial assessment was the best negative predictor of LTL at initial assessment (β: −0.39), followed by QUICKI (β: −0.3) and insulin (β: −1.1). Glucose concentration at initial assessment were the best and sole negative predictor (β: −0.19) of LTL at the annual assessment. No significant predictor of Delta LTL was found.

3.3. Clinical Characteristics, Body Composition and Hematologic, Biochemical and Endocrinologic Parameters

Table 1 illustrates the clinical characteristics and anthropometric parameters (1A), body composition parameters (1B), as well as hematologic investigations (1C), biochemical investigations (1D), cardiometabolic risk factors (1E), endocrinologic investigations (1F), and leucocyte telomere length measurements (1G) in all participants with “good compliance” (n = 407) at the initial and annual assessment. Participants were classified as obese, overweight, or of normal-BMI according to the IOTF criteria and their BMI status at initial assessment and the three groups were followed prospectively at 12 months. The statistical comparisons among all variables are also reported in Table 1. Children and adolescents with obesity at the initial assessment had significantly higher body weight, BMI, BMI z-score, waist circumference, hip circumference, waist to height ratio, fat percentage, fat mass, basal metabolic rate (BMR), T3 and insulin concentrations, and lower SHBG concentrations and HOMA-IR index than their overweight and normal-BMI counterparts both at the initial and annual assessment. In addition, participants with obesity at the initial assessment had significantly higher ALT, triglycerides, and ApoB concentrations than overweight and normal-BMI participants at the initial assessment and this difference disappeared at the annual assessment. Children and adolescents with obesity at the initial assessment had significantly higher γ-GT and QUICKI index than overweight and normal-BMI participants at the initial assessment and this difference disappeared for overweight participants in the annual assessment. In all three groups of participants, muscle, bone and fat free mass, total body water and BMR, and creatinine, HbA1, IGF-I and FSH concentrations increased significantly at the annual assessment. In subjects with obesity WBC, PLT, folic acid, AST, ALT, γ-GT, LDL, ApoB, HbA1c, and T3 concentrations decreased significantly at the end of the study.
Table 2 illustrates the clinical characteristics and anthropometric parameters (2A), body composition parameters (2B), as well as hematologic investigations (2C), biochemical investigations (2D), cardiometabolic risk factors (2E), endocrinologic investigations (2F), and leucocyte telomere length measurements (2G) in all participants with “good compliance” (n = 407), taken as one group at initial and annual assessment, and their statistical comparisons. Following 1 year of participating in the comprehensive, multidisciplinary, personalized, lifestyle intervention program of healthy diet and physical exercise, on average participants demonstrated a significant decrease in their BMI, BMI z-score, waist to height ratio, fat percentage, white blood cells, platelets, ferritin, AST, ALT, γ-GT, LDL-cholesterol, ApoB, Lp(a), HbA1C concentrations, and QUICKI index (p < 0.05). In addition, they demonstrated a significant increase in muscle mass, bone mass, fat-free mass, as well as in HDL and ApoA1 concentrations (p < 0.05).

4. Discussion

In the present study we investigated the effect of a structured, comprehensive, multidisciplinary, personalized lifestyle intervention program of healthy diet and physical exercise on leukocyte telomere length (LTL) in children and adolescents with obesity, overweight, and normal BMI. We found that LTL increased significantly after 1 year of the lifestyle interventions, irrespective of gender, pubertal status or BMI, and was greater in girls than in boys, irrespective of initial pubertal staging, both at the initial and the annual assessment, in participants that demonstrated good compliance in our interventions follow-up. This is of particular importance given the established in the literature age dependent LTL shortening [6]. The implementation of the lifestyle interventions for 1 year, particularly given the high rate of good compliance, also resulted in a significant improvement in clinical (BMI, BMI z-score and waist to height ratio) and body composition indices of obesity (fat percentage, muscle mass, fat free mass, and total body water), inflammatory markers (WBC, platelets, ferritin), hepatic enzymes (AST, ALT, γ-GT), HbA1C, QUICKI index, and lipid profile (HDL, LDL, ApoA1, ApoB) in all participants. These findings indicate that the increased LTL may be associated with a more favorable metabolic profile and decreased morbidity later in life. The main limitation of this prospective intervention study is the lack of a randomized control group without intervention, since the participants were enrolled following a visit on an Outpatient Clinic and entered our multidisciplinary management program.
To the best of our knowledge this is the second study to assess prospectively the changes in LTL in children and adolescents, and the only one with 12 months’ duration. In the previous EVASYON study, Garcia–Calzon et al. showed that a weight loss intervention over 2 months is accompanied by a significant increase in LTL in overweight and obese adolescents [16]. LTL is influenced by changes in the activity of telomerase (telomere terminal transferase), as well as by the alternative lengthening of telomeres pathway [27]. In somatic cells, telomerase activity is very low, almost undetectable, so telomeres shorten progressively with cell division, ultimately leading to loss of telomere protection and a DNA damage response that induces senescence or cell death [27]. Telomere shortening contributes to the rise in mortality rates from multiple diseases typically seen with ageing [28]. It was suggested that telomere attrition is likely a modifiable factor as there is substantial variability in the rate of telomere shortening that is independent of chronological age [6]. Individual risk factors analysis has shown that telomere length variability may be partially explained by lifestyle practices, with healthy lifestyle being associated with longer LTL [29].
We also demonstrated that LTL increased significantly following the 1 year-intervention program both in the subjects that were successful and those who were not successful at losing weight. This is a major finding indicating that lifestyle interventions can potentially be beneficial, despite apparent lack of success at decreasing the BMI. Previous studies showed a relation between LTL elongation and weight loss either with adherence to Mediterranean diet or bariatric surgery [16,30]. The mechanism responsible for LTL elongation is thought to be the active redistribution of younger naive cells regardless of cell types with longer telomeres in the periphery [2]. Younger cells in the circulation were shown to positively influence longevity in experimental animals, via an unknown mechanism [31]. In our study, following the one-year of multidisciplinary, personalized lifestyle intervention program of healthy diet and physical exercise, we showed a significant improvement in clinical (BMI, BMI z-score and waist to height ratio) and body composition indices of obesity (fat percentage, muscle mass, fat free mass, and total body water), inflammatory markers (WBC, platelets, ferritin), hepatic enzymes (AST, ALT, γ-GT), HbA1C, QUICKI index, and lipid profile (HDL, LDL, ApoA1, ApoB) in all participants. In subjects with obesity at the initial assessment there was also a decrease in HbA1C concentrations at the end of the study. These findings are significant given that metabolic abnormalities are likely to predispose to atherosclerotic cardiovascular disease in adult life. They may also indicate that the increased LTL may be associated with a more favorable prognosis and reduced morbidity and mortality later in life [32,33,34,35,36].
It is important to note that LTL did not differ among obese, overweight, and normal-BMI participants at the initial assessment. Although several previous studies showed a negative association between LTL and BMI [15,16,17,18,37], others showed no association between telomere length and adiposity [19,38]. This may be due to the different methodology used in previous studies, where the association was assessed via correlation analysis, while in the present study a direct criterion of adiposity, the IOTF criteria was employed to categorize participants at the initial assessment as obese, overweight, and normal-BMI, followed by repeated measures of ANOVA analysis to compare the three groups [39]. However, when we used forward stepwise regression analysis to evaluate the effect of potential metabolic syndrome risk factors and anthropometric parameters, we showed that waist circumference, a major marker of adiposity, was the best negative predictor of LTL at the initial assessment. Also, the waist to hip ratio at the initial assessment was the best negative predictor of LTL at the annual assessment, while waist to height ratio was the best positive predictor of the change of LTL. This is accompanied by the significant decrease of waist to height ratio after one year of intervention. Reduction of waist to height ratio in obese and overweight participants is significant given that this is an index of central adiposity, which is positively associated with the development of metabolic syndrome and cardiovascular disease [40]. Waist to height ratio is a stronger indicator of cardiovascular disease risk than waist circumference, waist to hip ratio and BMI, making it the most useful among the anthropometric indices and of higher accuracy screening tool for predicting the cardiometabolic risk in childhood, adolescence, and adulthood [41,42,43,44]. Furthermore, the waist to height ratio was associated with pro-oxidation in pre- and early pubertal boys, providing a mechanistic link to the potential benefits of assessing this marker [45].
It is also important to note that glucose concentrations at initial assessment were the best negative predictor of LTL at initial and annual assessment, followed by QUICKI index and insulin concentrations only at initial assessment. Furthermore, obese participants had significantly higher insulin concentrations, and lower SHBG concentrations and HOMA-IR index than overweight and normal-BMI participants both at the initial and annual assessment, while HbA1c concentrations decreased only in obese individuals. Of note, glucose concentrations were the best negative predictor of LTL at 12 months. These findings indicate that glucose homeostasis and insulin resistance are parts of an ongoing process that would potentially require longer term intervention. Consumption of sweetened drinks was associated with shorter LTL length even at a young age [46]. Insulin resistance represents not only an important target for the prevention of diabetes mellitus type 2 and the progressive ‘burn-out’ of β-cell function associated with advanced disease, but also directly contributes to microvascular damage in a pathway-selective manner that is associated with increased oxidative stress. [47]. Increased oxidative stress was associated with adverse clinical outcomes, even in the absence of diabetes, while the process of LTL shortening is accelerated through exposure to oxidative stress and inflammation [46]. Also it was reported that obesity in pre- and early puberty is associated with increased oxidative stress, as shown by the increased markers of pro-oxidation and decreased markers of anti-oxidation [45,48]. In the present study, when assessing the effect of body composition parameters analysis by a forward stepwise multiple regression model, basal metabolic rate (BMR) was the best negative predictor and bone mass was the best positive predictor of LTL at initial assessment. It was shown that short LTL may reflect an underlying mechanism illustrating chronic subsequent deterioration of a person’s metabolic health [49]. At the same time, a negative association between resting metabolic rate and lifespan is the cornerstone of the rate of living and free-radical damage theories of aging [50]. Resting metabolic rate is affected by body mass in experimental animals, while the role of adipose tissue and the understanding of the adipocyte as an endocrine organ is leading us to new insights into obesity and health [51]. In the present study, T3 concentrations where higher in obese than overweight or normal-BMI children and adolescents, and decreased in obese and overweight subjects following the interventions. Increased T3 concentrations (and TSH) in obesity are a signal, part of an adaptive process, aiming to increase BMR and energy consumption in an effort to maintain body weight by regaining a zero energy balance [52]. The positive association between bone mass and LTL in this study was previously described in women with decrease in BMD and the presence of osteoporosis, implicating LTL as a marker of biological aging of the bone [53]. Of particular interest is the fact that LTL was greater in girls than in boys, irrespective of initial pubertal staging, both at initial and annual assessment, while the LTL length was greater in overweight and obese girls than the respective boys. This is an interesting finding, and it corroborates previous studies that showed greater LTL in women and adolescent girls, while no difference is found in the newborn period [7,19,20,54,55,56]. The sexual dimorphism in human longevity was a long standing challenge for science and most likely reflects genomic adaptations that conceptually commence at a very young age [21].
It appears that a structured, comprehensive, multidisciplinary, personalized lifestyle intervention program of healthy diet and physical exercise for 1 year may lead to a significant increase in LTL in children and adolescents, irrespective of gender, pubertal status or BMI, as well as a significant improvement in metabolic syndrome parameters, including clinical and body composition indices of obesity, inflammatory markers, hepatic enzymes, markers of insulin resistance and lipid profile. These findings highlight the importance of adopting a healthy lifestyle in preventing metabolic abnormalities and reducing the risk of atherosclerotic cardiovascular disease later in life. Given that LTL increased in both the successful and not successful at weight loss participants, the benefits of implementing a lifestyle intervention program are self-evident. Our findings also provide a conceptual link between LTL, a well-studied marker of longevity, and the risk of cardiovascular disease, which may arise in childhood. Finally, our study provides evidence that sexual dimorphism in human longevity is evident at an early age. Further studies describing a randomized experiment in which LTL is compared between a treatment and nonintervention control group are required to delineate the underlying mechanisms responsible for the increased LTL in subjects with an improvement in cardiometabolic profile.

Author Contributions

Conceptualization and study design, G.P., N.C.N. and E.C.; data curation, P.K. and E.C.; formal analysis, G.P. and E.C.; funding acquisition, E.C.; investigation, C.R., G.P., S.M.G., S.I.K., M.P. and P.K.; methodology, E.C.; project administration, P.K. and E.C.; resources, M.P., P.K. and E.C.; software, G.P. and E.C.; supervision, E.C.; validation, E.C.; visualization, G.P. and E.C.; writing—original draft, G.P. and E.C.; writing—review & editing, G.P., C.R., N.C.N., S.M.G., S.I.K., M.P., P.K. and E.C. All authors read and agreed to the published version of the manuscript.

Funding

This research was cofinanced by the European Regional Development Fund of the European Union and Greek national funds through the Operational Program Competitiveness, Entrepreneurship and Innovation, under the call RESEARCH-CREATE-INNOVATE (project code: T1EDK-01386, MIS: 5030543, Acronym: PEDOBESITY).

Institutional Review Board Statement

The study was conducted in accordance with the Declaration of Helsinki and was ap-proved by the Committee on the Ethics of Human Research of ‘Aghia Sophia’ Children’s Hospital (Approval Number: EB-PASCH-MoM: 28/11/2013, Re: 10290-14/05/2013).

Informed Consent Statement

Informed consent was obtained from all subjects involved in the study by a parent/guardian, and assent was given by children older than 7 years.

Data Availability Statement

The data presented in this study are available on request from the corresponding author. The data are not publicly available due to privacy restrictions.

Acknowledgments

We would like to express our appreciation to both the participants and the staff of the Out-Patient Clinic for the Prevention and Management of Overweight and Obesity.

Conflicts of Interest

The authors declare no conflict of interest.

References

  1. Lu, W.; Zhang, Y.; Liu, D.; Songyang, Z.; Wan, M. Telomeres-structure, function, and regulation. Exp. Cell Res. 2013, 319, 133–141. [Google Scholar] [CrossRef] [Green Version]
  2. Epel, E. How "reversible" is telomeric aging? Cancer Prev. Res. 2012, 5, 1163–1168. [Google Scholar] [CrossRef] [PubMed] [Green Version]
  3. Lopez-Otin, C.; Blasco, M.A.; Partridge, L.; Serrano, M.; Kroemer, G. The hallmarks of aging. Cell 2013, 153, 1194–1217. [Google Scholar] [CrossRef] [PubMed] [Green Version]
  4. Haycock, P.C.; Heydon, E.E.; Kaptoge, S.; Butterworth, A.S.; Thompson, A.; Willeit, P. Leucocyte telomere length and risk of cardiovascular disease: Systematic review and meta-analysis. BMJ 2014, 349, g4227. [Google Scholar] [CrossRef] [PubMed] [Green Version]
  5. Salpea, K.D.; Talmud, P.J.; Cooper, J.A.; Maubaret, C.G.; Stephens, J.W.; Abelak, K.; Humphries, S.E. Association of telomere length with type 2 diabetes, oxidative stress and UCP2 gene variation. Atherosclerosis 2010, 209, 42–50. [Google Scholar] [CrossRef] [PubMed] [Green Version]
  6. Aviv, A.; Chen, W.; Gardner, J.P.; Kimura, M.; Brimacombe, M.; Cao, X.; Srinivasan, S.R.; Berenson, G.S. Leukocyte telomere dynamics: Longitudinal findings among young adults in the Bogalusa Heart Study. Am. J. Epidemiol. 2009, 169, 323–329. [Google Scholar] [CrossRef] [Green Version]
  7. Nordfjall, K.; Eliasson, M.; Stegmayr, B.; Melander, O.; Nilsson, P.; Roos, G. Telomere length is associated with obesity parameters but with a gender difference. Obesity 2008, 16, 2682–2689. [Google Scholar] [CrossRef]
  8. Kumanyika, S.; Dietz, W.H. Solving Population-wide Obesity—Progress and Future Prospects. N. Engl. J. Med. 2020, 383, 2197–2200. [Google Scholar] [CrossRef]
  9. Afshin, A.; Forouzanfar, M.H.; Reitsma, M.B.; Sur, P.; Estep, K.; Lee, A.; Marczak, L.; Mokdad, A.H.; Moradi-Lakeh, M.; Naghavi, M.; et al. Health Effects of Overweight and Obesity in 195 Countries over 25 Years. N. Engl. J. Med. 2017, 377, 13–27. [Google Scholar] [CrossRef] [PubMed]
  10. Kassari, P.; Papaioannou, P.; Billiris, A.; Karanikas, H.; Eleftheriou, S.; Thireos, E.; Manios, Y.; Chrousos, G.P.; Charmandari, E. Electronic registry for the management of childhood obesity in Greece. Eur. J. Clin. Investig. 2018, 48, e12887. [Google Scholar] [CrossRef]
  11. Lobstein, T.; Jackson-Leach, R.; Moodie, M.L.; Hall, K.D.; Gortmaker, S.L.; Swinburn, B.A.; James, W.P.; Wang, Y.; McPherson, K. Child and adolescent obesity: Part of a bigger picture. Lancet 2015, 385, 2510–2520. [Google Scholar] [CrossRef] [Green Version]
  12. Tragomalou, A.; Moschonis, G.; Manios, Y.; Kassari, P.; Ioakimidis, I.; Diou, C.; Stefanopoulos, L.; Lekka, E.; Maglaveras, N.; Delopoulos, A.; et al. Novel e-Health Applications for the Management of Cardiometabolic Risk Factors in Children and Adolescents in Greece. Nutrients 2020, 12, 1380. [Google Scholar] [CrossRef]
  13. Tragomalou, A.; Moschonis, G.; Kassari, P.; Papageorgiou, I.; Genitsaridi, S.M.; Karampatsou, S.; Manios, Y.; Charmandari, E. A National e-Health Program for the Prevention and Management of Overweight and Obesity in Childhood and Adolescence in Greece. Nutrients 2020, 12, 2858. [Google Scholar] [CrossRef]
  14. Genitsaridi, S.M.; Giannios, C.; Karampatsou, S.; Papageorgiou, I.; Papadopoulos, G.; Farakla, I.; Koui, E.; Georgiou, A.; Romas, S.; Terzioglou, E.; et al. A Comprehensive Multidisciplinary Management Plan Is Effective in Reducing the Prevalence of Overweight and Obesity in Childhood and Adolescence. Horm. Res. Paediatr. 2020, 93, 94–107. [Google Scholar] [CrossRef] [PubMed]
  15. Buxton, J.L.; Walters, R.G.; Visvikis-Siest, S.; Meyre, D.; Froguel, P.; Blakemore, A.I. Childhood obesity is associated with shorter leukocyte telomere length. J. Clin. Endocrinol. Metab. 2011, 96, 1500–1505. [Google Scholar] [CrossRef] [Green Version]
  16. Garcia-Calzon, S.; Moleres, A.; Marcos, A.; Campoy, C.; Moreno, L.A.; Azcona-Sanjulian, M.C.; Martinez-Gonzalez, M.A.; Martinez, J.A.; Zalba, G.; Marti, A. Telomere length as a biomarker for adiposity changes after a multidisciplinary intervention in overweight/obese adolescents: The EVASYON study. PLoS ONE 2014, 9, e89828. [Google Scholar] [CrossRef] [PubMed] [Green Version]
  17. Kjaer, T.W.; Faurholt-Jepsen, D.; Mehta, K.M.; Christensen, V.B.; Epel, E.; Lin, J.; Blackburn, E.; Wojcicki, J.M. Shorter preschool, leukocyte telomere length is associated with obesity at age 9 in Latino children. Clin. Obes. 2018, 8, 88–94. [Google Scholar] [CrossRef] [PubMed] [Green Version]
  18. Lamprokostopoulou, A.; Moschonis, G.; Manios, Y.; Critselis, E.; Nicolaides, N.C.; Stefa, A.; Koniari, E.; Gagos, S.; Charmandari, E. Childhood obesity and leucocyte telomere length. Eur. J. Clin. Investig. 2019, 49, e13178. [Google Scholar] [CrossRef] [PubMed]
  19. Zhu, H.; Wang, X.; Gutin, B.; Davis, C.L.; Keeton, D.; Thomas, J.; Stallmann-Jorgensen, I.; Mooken, G.; Bundy, V.; Snieder, H.; et al. Leukocyte telomere length in healthy Caucasian and African-American adolescents: Relationships with race, sex, adiposity, adipokines, and physical activity. J. Pediatr. 2011, 158, 215–220. [Google Scholar] [CrossRef] [Green Version]
  20. Benetos, A.; Okuda, K.; Lajemi, M.; Kimura, M.; Thomas, F.; Skurnick, J.; Labat, C.; Bean, K.; Aviv, A. Telomere length as an indicator of biological aging: The gender effect and relation with pulse pressure and pulse wave velocity. Hypertension 2001, 37, 381–385. [Google Scholar] [CrossRef] [Green Version]
  21. Gems, D. Evolution of sexually dimorphic longevity in humans. Aging 2014, 6, 84–91. [Google Scholar] [CrossRef] [PubMed] [Green Version]
  22. Van Horn, L. Development of the 2010 US Dietary Guidelines Advisory Committee Report: Perspectives from a registered dietitian. J. Am. Diet. Assoc. 2010, 110, 1638–1645. [Google Scholar] [CrossRef] [PubMed]
  23. Conway, J.M.; Ingwersen, L.A.; Moshfegh, A.J. Accuracy of dietary recall using the USDA five-step multiple-pass method in men: An observational validation study. J. Am. Diet. Assoc. 2004, 104, 595–603. [Google Scholar] [CrossRef] [PubMed]
  24. Baxter, S.D.; Smith, A.F.; Nichols, M.D.; Guinn, C.H.; Hardin, J.W. Children’s dietary reporting accuracy over multiple 24-hour recalls varies by body mass index category. Nutr. Res. 2006, 26, 241–248. [Google Scholar] [CrossRef] [PubMed] [Green Version]
  25. Chiotis, D.; Krikos, X.; Tsiftis, G.; Hatzisymeon, M.; Maniati-Christidi, M.; Dacou-Voutetaki, A. Body mass index and prevalence of obesity in subjects of Hellenic origin aged 0–18 years living in the Athens area. Ann. Clin. Pediatr. Univ. Athen. 2004, 51, 139–154. [Google Scholar]
  26. Cawthon, R.M. Telomere length measurement by a novel monochrome multiplex quantitative PCR method. Nucleic. Acids Res. 2009, 37, e21. [Google Scholar] [CrossRef] [Green Version]
  27. Zhao, Z.; Pan, X.; Liu, L.; Liu, N. Telomere length maintenance, shortening, and lengthening. J. Cell Physiol. 2014, 229, 1323–1329. [Google Scholar] [CrossRef]
  28. Cawthon, R.M.; Smith, K.R.; O’Brien, E.; Sivatchenko, A.; Kerber, R.A. Association between telomere length in blood and mortality in people aged 60 years or older. Lancet 2003, 361, 393–395. [Google Scholar] [CrossRef]
  29. Sun, Q.; Shi, L.; Prescott, J.; Chiuve, S.E.; Hu, F.B.; De Vivo, I.; Stampfer, M.J.; Franks, P.W.; Manson, J.E.; Rexrode, K.M. Healthy lifestyle and leukocyte telomere length in U.S. women. PLoS ONE 2012, 7, e38374. [Google Scholar] [CrossRef]
  30. Carulli, L.; Anzivino, C.; Baldelli, E.; Zenobii, M.F.; Rocchi, M.B.; Bertolotti, M. Telomere length elongation after weight loss intervention in obese adults. Mol. Genet. Metab. 2016, 118, 138–142. [Google Scholar] [CrossRef] [Green Version]
  31. Conboy, I.M.; Conboy, M.J.; Wagers, A.J.; Girma, E.R.; Weissman, I.L.; Rando, T.A. Rejuvenation of aged progenitor cells by exposure to a young systemic environment. Nature 2005, 433, 760–764. [Google Scholar] [CrossRef]
  32. Yajnik, C.S.; Katre, P.A.; Joshi, S.M.; Kumaran, K.; Bhat, D.S.; Lubree, H.G.; Memane, N.; Kinare, A.S.; Pandit, A.N.; Bhave, S.A.; et al. Higher glucose, insulin and insulin resistance (HOMA-IR) in childhood predict adverse cardiovascular risk in early adulthood: The Pune Children’s Study. Diabetologia 2015, 58, 1626–1636. [Google Scholar] [CrossRef] [PubMed] [Green Version]
  33. Friedemann, C.; Heneghan, C.; Mahtani, K.; Thompson, M.; Perera, R.; Ward, A.M. Cardiovascular disease risk in healthy children and its association with body mass index: Systematic review and meta-analysis. BMJ 2012, 345, e4759. [Google Scholar] [CrossRef] [PubMed] [Green Version]
  34. Ridker, P.M.; Hennekens, C.H.; Buring, J.E.; Rifai, N. C-reactive protein and other markers of inflammation in the prediction of cardiovascular disease in women. N. Engl. J. Med. 2000, 342, 836–843. [Google Scholar] [CrossRef]
  35. Speliotes, E.K.; Massaro, J.M.; Hoffmann, U.; Vasan, R.S.; Meigs, J.B.; Sahani, D.V.; Hirschhorn, J.N.; O’Donnell, C.J.; Fox, C.S. Fatty liver is associated with dyslipidemia and dysglycemia independent of visceral fat: The Framingham Heart Study. Hepatology 2010, 51, 1979–1987. [Google Scholar] [CrossRef] [PubMed] [Green Version]
  36. Song, X.; Jousilahti, P.; Stehouwer, C.D.; Soderberg, S.; Onat, A.; Laatikainen, T.; Yudkin, J.S.; Dankner, R.; Morris, R.; Tuomilehto, J.; et al. Cardiovascular and all-cause mortality in relation to various anthropometric measures of obesity in Europeans. Nutr. Metab. Cardiovasc. Dis. 2015, 25, 295–304. [Google Scholar] [CrossRef] [PubMed]
  37. Al-Attas, O.S.; Al-Daghri, N.; Bamakhramah, A.; Shaun Sabico, S.; McTernan, P.; Huang, T.T. Telomere length in relation to insulin resistance, inflammation and obesity among Arab youth. Acta Paediatr. 2010, 99, 896–899. [Google Scholar] [CrossRef] [PubMed]
  38. Zannolli, R.; Mohn, A.; Buoni, S.; Pietrobelli, A.; Messina, M.; Chiarelli, F.; Miracco, C. Telomere length and obesity. Acta Paediatr. 2008, 97, 952–954. [Google Scholar] [CrossRef]
  39. Cole, T.J.; Bellizzi, M.C.; Flegal, K.M.; Dietz, W.H. Establishing a standard definition for child overweight and obesity worldwide: International survey. BMJ 2000, 320, 1240–1243. [Google Scholar] [CrossRef] [Green Version]
  40. Ashwell, M.; Gunn, P.; Gibson, S. Waist-to-height ratio is a better screening tool than waist circumference and BMI for adult cardiometabolic risk factors: Systematic review and meta-analysis. Obes. Rev. 2012, 13, 275–286. [Google Scholar] [CrossRef] [PubMed]
  41. Bacopoulou, F.; Efthymiou, V.; Landis, G.; Rentoumis, A.; Chrousos, G.P. Waist circumference, waist-to-hip ratio and waist-to-height ratio reference percentiles for abdominal obesity among Greek adolescents. BMC Pediatr. 2015, 15, 50. [Google Scholar] [CrossRef] [PubMed] [Green Version]
  42. Lam, B.C.; Koh, G.C.; Chen, C.; Wong, M.T.; Fallows, S.J. Comparison of Body Mass Index (BMI), Body Adiposity Index (BAI), Waist Circumference (WC), Waist-To-Hip Ratio (WHR) and Waist-To-Height Ratio (WHtR) as predictors of cardiovascular disease risk factors in an adult population in Singapore. PLoS ONE 2015, 10, e0122985. [Google Scholar] [CrossRef]
  43. Maffeis, C.; Banzato, C.; Talamini, G. Waist-to-height ratio, a useful index to identify high metabolic risk in overweight children. J. Pediatr. 2008, 152, 207–213. [Google Scholar] [CrossRef] [PubMed]
  44. Chung, I.H.; Park, S.; Park, M.J.; Yoo, E.G. Waist-to-Height Ratio as an Index for Cardiometabolic Risk in Adolescents: Results from the 1998-2008 KNHANES. Yonsei Med. J. 2016, 57, 658–663. [Google Scholar] [CrossRef]
  45. Paltoglou, G.; Schoina, M.; Valsamakis, G.; Salakos, N.; Avloniti, A.; Chatzinikolaou, A.; Margeli, A.; Skevaki, C.; Papagianni, M.; Kanaka-Gantenbein, C. Interrelations among the adipocytokines leptin and adiponectin, oxidative stress and aseptic inflammation markers in pre-and early-pubertal normal-weight and obese boys. Endocrine 2017, 55, 925–933. [Google Scholar] [CrossRef] [PubMed]
  46. Wojcicki, J.M.; Medrano, R.; Lin, J.; Epel, E. Increased Cellular Aging by 3 Years of Age in Latino, Preschool Children Who Consume More Sugar-Sweetened Beverages: A Pilot Study. Child. Obes. 2018, 14, 149–157. [Google Scholar] [CrossRef]
  47. Groop, P.H.; Forsblom, C.; Thomas, M.C. Mechanisms of disease: Pathway-selective insulin resistance and microvascular complications of diabetes. Nat. Clin. Pract. Endocrinol. Metab. 2005, 1, 100–110. [Google Scholar] [CrossRef]
  48. Paltoglou, G.; Avloniti, A.; Chatzinikolaou, A.; Stefanaki, C.; Papagianni, M.; Papassotiriou, I.; Fatouros, I.G.; Chrousos, G.P.; Kanaka-Gantenbein, C.; Mastorakos, G. In early pubertal boys, testosterone and LH are associated with improved anti-oxidation during an aerobic exercise bout. Endocrine 2019, 66, 370–380. [Google Scholar] [CrossRef]
  49. Revesz, D.; Milaneschi, Y.; Verhoeven, J.E.; Penninx, B.W. Telomere length as a marker of cellular aging is associated with prevalence and progression of metabolic syndrome. J. Clin. Endocrinol. Metab. 2014, 99, 4607–4615. [Google Scholar] [CrossRef] [Green Version]
  50. Duarte, L.C.; Speakman, J.R. Low resting metabolic rate is associated with greater lifespan because of a confounding effect of body fatness. Age 2014, 36, 9731. [Google Scholar] [CrossRef] [PubMed] [Green Version]
  51. Greenberg, A.S.; Obin, M.S. Obesity and the role of adipose tissue in inflammation and metabolism. Am. J. Clin. Nutr. 2006, 83, 461S–465S. [Google Scholar] [CrossRef] [PubMed] [Green Version]
  52. Reinehr, T. Obesity and thyroid function. Mol. Cell Endocrinol. 2010, 316, 165–171. [Google Scholar] [CrossRef] [PubMed]
  53. Valdes, A.M.; Richards, J.B.; Gardner, J.P.; Swaminathan, R.; Kimura, M.; Xiaobin, L.; Aviv, A.; Spector, T.D. Telomere length in leukocytes correlates with bone mineral density and is shorter in women with osteoporosis. Osteoporos. Int. 2007, 18, 1203–1210. [Google Scholar] [CrossRef] [PubMed]
  54. Jeanclos, E.; Schork, N.J.; Kyvik, K.O.; Kimura, M.; Skurnick, J.H.; Aviv, A. Telomere length inversely correlates with pulse pressure and is highly familial. Hypertension 2000, 36, 195–200. [Google Scholar] [CrossRef] [PubMed]
  55. McGrath, M.; Wong, J.Y.; Michaud, D.; Hunter, D.J.; De Vivo, I. Telomere length, cigarette smoking, and bladder cancer risk in men and women. Cancer Epidemiol. Prev. Biomark. 2007, 16, 815–819. [Google Scholar] [CrossRef] [PubMed] [Green Version]
  56. Okuda, K.; Bardeguez, A.; Gardner, J.P.; Rodriguez, P.; Ganesh, V.; Kimura, M.; Skurnick, J.; Awad, G.; Aviv, A. Telomere length in the newborn. Pediatr. Res. 2002, 52, 377–381. [Google Scholar] [CrossRef]
Figure 1. Panel (A): leukocyte telomere length (LTL) (mean ± SE) of male and female subjects with “good compliance” (n = 407), at initial assessment (white bars) and at 12 months (shaded bars). Panel (B): leukocyte telomere length (LTL) of male and female, prepubertal, and pubertal at initial assessment subjects with “good compliance” (n = 407), at initial assessment (white bars) and at 12 months (shaded bars). All measured variables were compared by employing repeated-measures ANOVA. Significant main effects were revealed by LSD post-hoc test. Statistical significance was set at (p < 0.05). * Indicates significant difference between initial assessment and the 12 months follow-up, time-points; ‡ Indicates significant difference from the Male group.
Nutrients 13 02682 g001
Figure 2. (A) Leukocyte telomere length (LTL) (mean ± SE) of male and female subjects with “good compliance” (n = 407), who were grouped as obese, overweight, or of normal-BMI at initial assessment (white bars) and same participants at 12 months (shaded bars). Panel (B): leukocyte telomere length (LTL) of male and female, prepubertal, and pubertal who were grouped as obese, overweight, or of normal-BMI at initial assessment (white bars) and at 12 months (shaded bars). All measured variables were compared by employing repeated-measures ANOVA. Significant main effects were revealed by the LSD posthoc test. Statistical significance was set at (p < 0.05). * Indicates significant difference between initial assessment and 12 months follow-up, time-points; ‡ Indicates significant difference from the Male group.
Nutrients 13 02682 g002
Table 1. Clinical characteristics and anthropometric parameters (1A), body composition parameters (1B), hematology (1C), biochemistry (1D), cardiometabolic (CVD) risk factors (1E), hormonal (1F) and leucocyte telomere length (LTL) (1G) measurements in all subjects with “good compliance” (n = 407) at initial and annual assessment.
A. AnthropometryInitial assessmentAnnual assessmentPbetween timepoints
ObeseOverweightNormal BMIPwithin baselineObeseOverweightNormal BMIPwithin follow-up
Age (years)10.04 ± 0.2010.48 ± 0.209.65 ± 0.39NS11.04 ± 0.22 *11.52 ± 0.21 *10.74 ± 0.44 *NS0.01/0.01/0.01
Body weight (kg)62.54 ± 1.4252.64 ± 1.21 #38.61 ± 1.58 +,#0.0164.06 ± 1.56 *55.13 ± 1.35 *,#43.84 ± 1.72 *,+,#0.010.01/0.01/0.01
Height (cm)144.47 ± 1.17145.43 ± 1.08138.03 ± 2.02NS149.77 ± 1.26 *151.37 ± 1.14 *147.06 ± 2.06 *NS0.01/0.01/0.01
BMI (kg/m2)28.62 ± 0.2824.21 ± 0.21 #19.54 ± 0.35 +,#0.0127.15 ± 0.32 *23.58 ± 0.27 *,#19.81 ± 0.38 +,#0.010.01/0.01/NS
BMI z-score3.22 ± 0.071.53 ± 0.02 #0.14 ± 0.10 +,#0.012.41 ± 0.07 *1.18 ± 0.06 *,#0.25 ± 0.08 +,#0.010.01/0.01/NS
SBP (mmHg)114.10 ± 0.96110.76 ± 0.83104.48 ± 1.32 +0.05114.26 ± 1.06109.64 ± 1.17 #106.65 ± 2.12 #0.01NS/NS/NS
DBP (mmHg)67.02 ± 0.7865.75 ± 0.7861.00 ± 1.17 +,#0.0168.41 ± 0.8465.54 ± 0.8263.70 ± 1.58 #0.05NS/NS/NS
Waist (cm)86.73 ± 0.9078.42 ± 0.80 #67.49 ± 1.31 +,#0.0187.47 ± 1.2480.05 ± 1.27 #70.57 ± 2.10 +,#0.01NS/NS/NS
Hip (cm)92.05 ± 1.0786.60 ± 1.01 #74.72 ± 1.66 +,#0.0594.56 ± 1.3689.08 ± 1.24 #81.89 ± 2.07 *,+,#0.01NS/NS/0.01
Waist to Hip ratio0.96 ± 0.010.91 ± 0.01 #0.92 ± 0.020.050.93 ± 0.010.90 ± 0.01 #0.86 ± 0.02 *,#0.01NS/NS/0.05
Waist to Height ratio0.60 ± 0.010.54 ± 0.01 #0.49 ± 0.01 +,#0.010.58 ± 0.01 *0.53 ± 0.01 #0.48 ± 0.01 +,#0.010.01/NS/NS
B. Body compositionInitial assessmentAnnual assessmentPbetween timepoints
ObeseOverweightNormal BMIPwithin baselineObeseOverweightNormal BMIPwithin follow-up
Fat Percentage (%)37.44 ± 0.3832.23 ± 0.34 #25.6 ± 0.74 +,#0.0135.49 ± 0.42 *31.09 ± 0.39 *,#25.02 ± 0.75 +,#0.010.01/0.01/NS
Fat Mass (kg)24.15 ± 0.6917.17 ± 0.51 #10.37 ± 0.58 +,#0.0123.76 ± 0.7017.76 ± 0.57 #10.89 ± 0.60 +,#0.01NS/NS/NS
Muscle Mass (kg)36.77 ± 0.7933.63 ± 0.7327.55 ± 1.09 +,#0.0139.48 ± 0.83 *36.80 ± 0.75 *,#29.94 ± 1.10 *,+,#0.010.01/0.01/0.01
Bone mass (kg)1.99 ± 0.041.85 ± 0.041.54 ± 0.06 +,#0.012.13 ± 0.04 *2.00 ± 0.04 *,#1.66 ± 0.06 *,+,#0.010.01/0.01/0.01
Fat Free Mass (kg)38.76 ± 0.8335.47 ± 0.7729.09 ± 1.15 +,#0.0141.64 ± 0.88 *38.80 ± 0.79 *,#31.61 ± 1.15 *,+,#0.010.01/0.01/0.01
Total Body Water (kg)28.38 ± 0.6125.97 ± 0.5621.29 ± 0.84 +,#0.0130.46 ± 0.64 *28.40 ± 0.58 *,#23.15 ± 0.84 *,+,#0.010.01/0.01/0.01
BMR (kJ)6491.92 ± 90.376027.06 ± 83.21 #5287.79 ± 102.68 +,#0.016693.43 ± 95.96 *6281.82 ± 84.99 *,#5464.08 ± 105.64 *,+,#0.010.01/0.01/0.01
C. HematologyInitial assessmentAnnual assessmentPbetween timepoints
ObeseOverweightNormal BMIPwithin baselineObeseOverweightNormal BMIPwithin follow-up
WBC7.74 ± 0.137.07 ± 0.15 #7.12 ± 0.27 #0.057.54 ± 0.14 *7.16 ± 0.176.45 ± 0.26 *,+,#0.010.05/NS/0.05
RBC5.02 ± 0.055.06 ± 0.064.93 ± 0.07NS5.20 ± 0.205.05 ± 0.044.99 ± 0.08NSNS/NS/NS
Hb12.97 ± 0.1413.08 ± 0.1912.75 ± 0.12NS12.94 ± 0.0813.19 ± 0.09 *,#12.93 ± 0.150.05NS/0.01/NS
Hct40.49 ± 0.2340.81 ± 0.3240.15 ± 0.35NS40.56 ± 0.2240.96 ± 0.2540.29 ± 0.41NSNS/NS/NS
PLT303.93 ± 4.20292.74 ± 5.06 #297.03 ± 7.610.05288.30 ± 5.27 *290.29 ± 4.81275.93 ± 6.45 *NS0.01/NS/0.05
ESR19.34 ± 0.9218.35 ± 1.0112.38 ± 1.25 +,#0.0518.65 ± 0.9415.93 ± 0.9813.75 ± 1.53 #0.01NS/NS/NS
Ferritin61.71 ± 2.8956.90 ± 2.2851.07 ± 3.26NS56.45 ± 2.37 *52.85 ± 2.8048.08 ± 4.62 *NS0.05/NS/0.05
Folic Acid11.75 ± 0.3912.79 ± 0.8413.60 ± 1.54 #0.059.40 ± 0.49 *9.78 ± 0.43 *12.87 ± 1.65 #0.050.01/0.01/NS
D. BiochemistryInitial assessmentAnnual assessmentPbetween timepoints
ObeseOverweightNormal BMIPwithin baselineObeseOverweightNormal BMIPwithin follow-up
Urea28.84 ± 0.4228.59 ± 0.4628.30 ± 0.88NS28.59 ± 0.4628.56 ± 0.5526.71 ± 0.94NSNS/NS/NS
Creatinine0.49 ± 0.010.50 ± 0.010.46 ± 0.02NS0.52 ± 0.01 *0.52 ± 0.01 *0.52 ± 0.02 *NS0.01/0.01/0.01
Uric Acid7.53 ± 1.015.22 ± 0.585.97 ± 1.95NS4.88 ± 0.085.05 ± 0.456.72 ± 1.80NSNS/NS/NS
K4.44 ± 0.024.37 ± 0.034.37 ± 0.05NS4.39 ± 0.844.43 ± 0.034.45 ± 0.07NSNS/NS/NS
Na137.07 ± 1.33138.60 ± 1.16138.13 ± 2.27NS138.99 ± 1.00139.04 ± 1.07133.02 ± 4.60NSNS/NS/NS
Cl103.76 ± 0.68102.76 ± 0.55104.66 ± 1.69NS101.03 ± 1.55100.47 ± 2.39107.00 ± 3.53NSNS/NS/NS
AST23.88 ± 0.4223.07 ± 0.4523.33 ± 0.49NS22.05 ± 0.43 *22.33 ± 0.52 *24.19 ± 1.02 #0.050.01/0.05/NS
ALT22.36 ± 0.8519.35 ± 0.71 #15.78 ± 0.71 +,#0.0519.52 ± 0.60 *18.62 ± 0.7217.52 ± 1.06NS0.01/NS/NS
γ-GT14.97 ± 0.4213.19 ± 0.34 #11.08 ± 0.38 #0.0113.66 ± 0.35 *13.54 ± 0.4511.21 ± 0.43 +,#0.050.01/NS/NS
Albumin4.70 ± 0.034.72 ± 0.034.67 ± 0.07NS4.58 ± 0.02 *4.64 ± 0.034.68 ± 0.08NS0.01/NS/NS
ALP233.35 ± 5.49231.02 ± 6.09230.13 ± 10.15NS218.56 ± 5.67 *220.84 ± 7.09 *224.71 ± 14.56NS0.01/0.05/NS
PO44.77 ± 0.064.68 ± 0.045.39 ± 0.72NS4.94 ± 0.284.72 ± 0.044.63 ± 0.08NSNS/NS/NS
Ca10.23 ± 0.389.83 ± 0.039.78 ± 0.04NS9.79 ± 0.02 *9.83 ± 0.039.74 ± 0.07NS0.01/NS/NS
E. CVD risk factorsInitial assessmentAnnual assessmentPbetween timepoints
ObeseOverweightNormal BMIPwithin baselineObeseOverweightNormal BMIPwithin follow-up
Cholesterol152.27 ± 2.40154.90 ± 2.46151.63 ± 4.60NS154.75 ± 2.20155.45 ± 2.89147.91 ± 6.33NSNS/NS/NS
Triglycerides84.82 ± 2.6869.74 ± 2.54 #69.40 ± 5.18 #0.0582.74 ± 3.0774.75 ± 3.40 *71.31 ± 5.97NSNS/0.05/NS
HDL50.58 ± 0.8753.46 ± 1.0357.60 ± 1.68 #0.0551.79 ± 0.9655.81 ± 1.12 *,#59.48 ± 2.37 *,#0.01NS/0.01/0.05
LDL89.57 ± 1.5989.72 ± 1.9582.95 ± 3.44NS88.63 ± 1.67 *87.02 ± 2.0580.62 ± 2.90NS0.05/NS/NS
ApoA1137.02 ± 1.66139.80 ± 1.54146.17 ± 3.66NS140.60 ± 1.69143.59 ± 1.83150.60 ± 3.32 #0.05NS/NS/NS
ApoB75.19 ± 1.2072.34 ± 1.26 #68.03 ± 1.97 #0.0172.61 ± 1.14 *70.05 ± 1.4566.05 ± 2.11 #0.050.01/NS/NS
Lp(a)15.93 ± 1.4715.27 ± 1.6614.96 ± 2.66NS16.62 ± 1.8014.38 ± 2.0310.23 ± 1.92NSNS/NS/NS
Glucose79.03 ± 0.5778.35 ± 0.7678.02 ± 1.00NS80.91 ± 0.47 *81.00 ± 0.64 *79.76 ± 0.99NS0.01/0.01/NS
HbA1c5.28 ± 0.025.22 ± 0.025.18 ± 0.03NS5.22 ± 0.02 *5.20 ± 0.025.19 ± 0.0NS<0.01/NS/NS
HbA15.98 ± 0.035.91 ± 0.03 #5.93 ± 0.050.016.02 ± 0.03 *5.94 ± 0.03 *5.98 ± 0.05 *NS0.05/0.01/0.05
HOMA-IR3.62 ± 0.172.55 ± 0.12 #1.83 ± 0.16 #0.053.47 ± 0.172.91 ± 0.14 #1.98 ± 0.16 +,#0.01NS/NS/NS
QUICKI0.33 ± 0.010.34 ± 0.01 #0.37 ± 0.01 +,#0.010.33 ± 0.010.33 ± 0.01 *0.35 ± 0.01 *,+,#0.05NS/0.01/0.05
F. HormonesInitial assessmentAnnual assessmentPbetween timepoints
ObeseOverweightNormal BMIPwithin baselineObeseOverweightNormal BMIPwithin follow-up
TSH2.92 ± 0.092.93 ± 0.132.82 ± 0.20NS3.04 ± 0.122.94 ± 0.152.39 ± 0.17 +,#0.05NS/NS/NS
FT41.76 ± 0.551.13 ± 0.011.31 ± 0.16NS1.10 ± 0.011.10 ± 0.011.09 ± 0.03NSNS/NS/NS
T3148.68 ± 1.71138.40 ± 2.15 #134.98 ± 3.59 #0.01141.90 ± 2.23 *135.51 ± 2.61 *,#131.13 ± 4.00 #0.050.01/0.05/NS
AntiTG21.14 ± 0.6622.86 ± 1.5822.89 ± 1.95NS27.72 ± 5.5626.51 ± 3.6630.08 ± 7.54NSNS/NS/NS
AntiTPO17.11 ± 4.1330.23 ± 8.7530.12 ± 16.22NS18.04 ± 5.1132.10 ± 10.9735.26 ± 22.98NSNS/NS/NS
IGF1304.23 ± 10.27322.79 ± 14.29269.96 ± 20.79NS387.42 ± 14.66 *394.87 ± 16.93 *336.14 ± 22.18 *NS0.01/0.01/0.01
IGFBP35.03 ± 0.075.11 ± 0.084.73 ± 0.15NS6.07 ± 0.685.35 ± 0.115.01 ± 0.15NSNS/NS/NS
PRL11.29 ± 0.3811.63 ± 0.5111.73 ± 0.94NS12.51 ± 0.52 *12.47 ± 0.56 *12.53 ± 0.86NS0.01/0.01/NS
LH1.94 ± 0.192.92 ± 0.621.19 ± 0.22NS2.91 ± 0.26 *3.39 ± 0.402.74 ± 0.52NS<0.01/NS/NS
FSH2.53 ± 0.122.86 ± 0.192.29 ± 0.22NS3.00 ± 0.15 *3.61 ± 0.26 *,#3.42 ± 0.37 *0.050.01/0.01/0.05
ACTH34.35 ± 5.4528.60 ± 1.8122.14 ± 1.41NS29.67 ± 1.6228.72 ± 1.8225.20 ± 2.07NSNS/NS/NS
Cortisol13.53 ± 0.4014.17 ± 0.4915.48 ± 2.31 +,#0.0513.30 ± 0.4413.41 ± 0.4811.39 ± 0.60 *NSNS/NS/0.01
PTH33.41 ± 1.8833.22 ± 0.8735.90 ± 0.90NS35.58 ± 2.0634.55 ± 0.8136.51 ± 0.91NSNS/NS/NS
25OHVitD24.29 ± 1.3824.10 ± 0.7325.74 ± 1.23NS23.81 ± 0.7326.35 ± 2.3228.23 ± 1.91NSNS/NS/NS
Insulin18.24 ± 0.8012.91 ± 0.57 #9.30 ± 0.76 +,#0.0117.22 ± 0.8214.48 ± 0.68 #9.81 ± 0.73 +,#0.01NS/NS/NS
SHBG43.18 ± 1.8153.47 ± 2.49 #80.23 ± 5.79 +,#0.0144.62 ± 2.0952.87 ± 2.43 #73.41 ± 6.59 +,#0.01NS/NS/NS
G. LTLInitial assessmentAnnual assessmentPbetween timepoints
ObeseOverweightNormal BMIPwithin baselineObeseOverweightNormal BMIPwithin follow-up
LTL1.35 ± 0.021.36 ± 0.021.33 ± 0.03NS1.41 ± 0.02 *1.42 ± 0.02 *1.38 ± 0.03 *NS0.01/0.01/0.01
All results are presented as mean ± SE. Subjects were classified as obese, overweight, or with normal BMI according to IOTF criteria at initial assessment. Tables present comparisons among three groups at both initial and annual assessment. All measured variables were compared by employing repeated-measures ANOVA. Significant main effects were revealed by the LSD posthoc test. Statistical significance was set at (p < 0.05, rounded to 0.05 in Table), while strong significance (p < 0.01, rounded to 0.01 in Table) is also noted. NS: nonsignificant (p > 0.05) difference. *: Indicates significant difference between initial and annual assessment, timepoints respectively. +: Indicates significant difference from Overweight group. #: Indicates significant difference from Obese group. p-values between two timepoints refer to obese, overweight, and normal BMI respectively.
Table 2. Clinical characteristics and anthropometric parameters (2A), body composition parameters (2B), hematology (2C), biochemistry (2D), cardiometabolic (CVD) risk factors (2E), hormonal (2F) and leucocyte telomere length (LTL) (2G) measurements in all subjects with “good compliance” (n = 407), at initial and annual assessment.
A. anthropometryInitial assessmentAnnual assessmentPbetween timepoints
Age (years)10.14 ± 0.1311.23 ± 0,15<0.01
Body weight (kg)55.99 ± 0.9558.61 ± 1.03 *<0.01
Height (cm)143.95 ± 0.77150.02 ± 0.82 *<0.01
BMI (kg/m2)25.91 ± 0.2225.06 ± 0.24 *<0.01
BMI z-score2.25 ± 0.061.72 ± 0.06 *<0.01
SBP (mmHg)111.62 ± 0.62112.05 ± 0.77NS
DBP (mmHg)65.75 ± 0.5267.04 ± 0.58NS
Waist (cm)81.41 ± 0.6583.37 ± 0.92NS
Hip (cm)87.95 ± 0.7591.51 ± 0.93NS
Waist to Hip ratio0.94 ± 0.010.91 ± 0.01NS
Waist to Height ratio0.57 ± 0.010.55 ± 0.01 *<0.01
B. Body compositionInitial assessmentAnnual assessmentPbetween timepoints
Fat Percentage (%)34.09 ± 0.3132.57 ± 0.32 *<0.01
Fat Mass (kg)19.92 ± 0.4619.94 ± 0.47NS
Muscle Mass (kg)34.45 ± 0.5237.23 ± 0.32 *<0.01
Bone mass (kg)1.88 ± 0.032.02 ± 0.03 *<0.01
Fat Free Mass (kg)36.33 ± 0.5537.23 ± 0.54 *<0.01
Total Body Water (kg)26.60 ± 0.4028.73 ± 0.42 *<0.01
BMR (kJ)6171.22 ± 59.486382.51 ± 62.21NS
C. HematologyInitial assessmentAnnual assessmentPbetween timepoints
WBC7.43 ± 0.097.28 ± 0.10 *<0.05
RBC5.02 ± 0.035.12 ± 0.11NS
Hb12.88 ± 0.1013.03 ± 0.06 *<0.01
Hct40.56 ± 0.1740.67 ± 0.16NS
PLT299.21 ± 2.99287.54 ± 3.37 *<0.01
ESR18.18 ± 0.6317.14 ± 0.64NS
Ferritin58.66 ± 1.7754.29 ± 1.69 *<0.01
Folic Acid13.17 ± 0.419.88 ± 0.36 *<0.01
D. BiochemistryInitial assessmentAnnual assessmentPbetween timepoints
Urea28.69 ± 0.2928.36 ± 0.33NS
Creatinine0.49 ± 0.010.52 ± 0.01 *<0.01
Uric Acid5.45 ± 0.625.15 ± 0.26NS
K4.41 ± 0.024.40 ± 0.05NS
Na137.73 ± 0.86138.32 ± 0.84NS
Cl103.57 ± 0.47101.53 ± 1.24NS
AST23.54 ± 0.2822.39 ± 0.32 *<0.01
ALT20.50 ± 0.5318.98 ± 0.43 *<0.01
γGT13.86 ± 0.2613.34 ± 0.25 *<0.01
Albumin4.71 ± 0.024.61 ± 0.02 *<0.01
ALP232.13 ± 3.80220.07 ± 4.25 *<0.01
PO44.82 ± 0.104.83 ± 0.15NS
Ca10.04 ± 0.209.80 ± 0.02 *<0.01
E. CVD risk factorsInitial assessmentAnnual assessmentPbetween timepoints
Cholesterol153.08 ± 1.64154.22 ± 1.71NS
Triglycerides77.72 ± 1.8278.64 ± 2.15NS
HDL52.46 ± 0.6354.07 ± 0.71 *<0.01
LDL90.37 ± 1.1687.15 ± 1.20 *<0.01
ApoA1139.14 ± 1.13142.80 ± 1.18 *<0.05
ApoB73.31 ± 0.8170.98 ± 0.83 *<0.01
Lp(a)15.58 ± 1.0215.12 ± 1.22NS
Glucose78.67 ± 0.4280.81 ± 0.36 *<0.01
HbA1c5.25 ± 0.015.21 ± 0.01 *<0.01
HbA15.98 ± 0.025.99 ± 0.02 *<0.01
HOMA-IR3.02 ± 0.113.10 ± 0.10NS
QUICKI0.34 ± 0.010.33 ± 0.01 *<0.01
F. HormonesInitial assessmentAnnual assessmentPbetween timepoints
TSH2.91 ± 0.072.93 ± 0.09NS
FT41.49 ± 0.291.61 ± 0.51NS
T3143.38 ± 1.28138.42 ± 1.58 *<0.01
AntiTG21.96 ± 0.6927.57 ± 3.34NS
AntiTPO23.37 ± 4.2924.98 ± 5.42NS
IGF1306.18 ± 7.81384.02 ± 10.17 *<0.01
IGBP35.02 ± 0.055.69 ± 0.37NS
PRL11.47 ± 0.2912.50 ± 0.35 *<0.01
LH2.18 ± 0.243.06 ± 0.21 *<0.01
FSH2.62 ± 0.093.26 ± 0.13 *<0.01
ACTH30.79 ± 2.9528.82 ± 1.10NS
Cortisol14.00 ± 0.4013.11 ± 0.30 *<0.01
PTH34.64 ± 0,6135.70 ± 0.61NS
25OHVitD24.41 ± 0.7825.24 ± 0.95NS
Insulin15.26 ± 0.5015.40 ± 0.52NS
SHBG51.90 ± 1.6250.97 ± 1.67NS
G. LTLInitial assessmentAnnual assessmentPbetween timepoints
LTL1.35 ± 0.011.41 ± 0.01 *<0.01
All results are presented as mean ± SE. All measured variables were compared by employing repeated-measures ANOVA. Significant main effects were revealed by the LSD posthoc test. Statistical significance was set at (p < 0.05), while strong significance (p < 0.01) is also noted. NS: nonsignificant (p > 0.05) difference. *: Indicates significant difference between baseline and the 12 months follow-up, timepoint.
Table 3. LTL measurements and respective comparisons at baseline and at 12 months follow-up of participants with “good compliance” (n = 407), according to criterion of success at weight loss. Subjects were considered successful at weight loss (“YES” group), either if respective BMI z-score decreased more than 0.6 at 12 months follow-up (Criterion A), or if respective IOTF category (normal weight, overweight and obese) improved by one or more categories (Criterion Β). Unsuccessful participants (“NO” group) were participants not fulfilling the respective criteria.
Criterion AYES (n = 193)Pbetween timepointsNo (n = 214)Pbetween timepoints
Initial
assessment
Annual assessmentInitial
assessment
Annual assessment
LTL1.35 ± 0.021.41 ± 0.02 *<0.011.37 ± 0.021.43 ± 0.02 *<0.01
Criterion BYES (n = 175)Pbetween timepointsNo (n = 232)Pbetween timepoints
Initial
assessment
Annual assessmentInitial
assessment
Annual assessment
LTL1.33 ± 0.021.40 ± 0.02 *<0.011.38 ± 0.021.43 ± 0.02 *<0.01
All results are presented as mean ± SE. All measured variables were compared by employing repeated-measures ANOVA. Significant main effects were revealed by the LSD post-hoc test. Statistical significance was set at (p < 0.05), while strong significance (p < 0.01) is also noted. * Indicates significant difference between baseline and the 12 months follow-up, time-points respectively.
Table 4. Potential predictors in descending order of LTL at initial assessment, at annual assessment and the respective change (Delta) of LTL–dependent variables. Model A (Table 4A) assessed metabolic syndrome parameters, at initial assessment (SBP, waist circumference, cholesterol, triglycerides, and HDL; independent variables). Model B (Table 4B) assessed body composition parameters, at initial assessment (fat percentage, fat mass, muscle mass, bone mass, fat free mass, total body water and BMR; independent variables). Model C (Table 4C) assessed anthropometric parameters, at initial assessment (weight, height, BMI, waist, hip circumference, waist to hip ratio and waist to height ratio; independent variables). Model D (Table 4D) assessed glucose metabolism and insulin sensitivity parameters, at initial assessment (glucose, insulin, HbA1C, HOMA and QUICKI; independent variables).
LTL Initial
Assessment
LTL Annual
Assessment
Delta LTLp
Table 4A
Waist circumferenceβ: −0.14β: −0.13-<0.01/<0.05/NS
Table 4B
BMRβ: −0.54β: −0.49-<0.01/<0.01/NS
Bone massβ: 0.43β: 0.13-<0.05/<0.05/NS
Table 4C
Waist circumferenceβ: −0.27- -<0.01/NS/NS
Waist to hip ratio-β: −0.15 -NS/<0.01/NS
Waist to height ratio--β: 0.41NS/NS/<0.05
Table 4D
Glucoseβ: −0.39β: −0.19-<0.01/0.01/NS
QUICKIβ: −0.3--<0.05/NS/NS
Insulinβ: −1.1--<0.05/NS/NS
Standard forward, stepwise multiple regression models were employed, and beta (β) coefficients are reported. Statistical significance was set at (p < 0.05), while strong significance (p < 0.01) is also noted. NS: Non-significant (p > 0.05) difference.
Publisher’s Note: MDPI stays neutral with regard to jurisdictional claims in published maps and institutional affiliations.

