
Eating Speed, Eating Frequency, and Their Relationships with Diet Quality, Adiposity, and Metabolic Syndrome, or Its Components

 ,
,  and
and
Abstract
:1. Introduction
2. Materials and Methods
2.1. Search Strategy and Selection Criteria
2.2. Inclusion and Exclusion Criteria
2.3. Study Selection
2.4. Exposures
2.5. Outcomes
3. Results
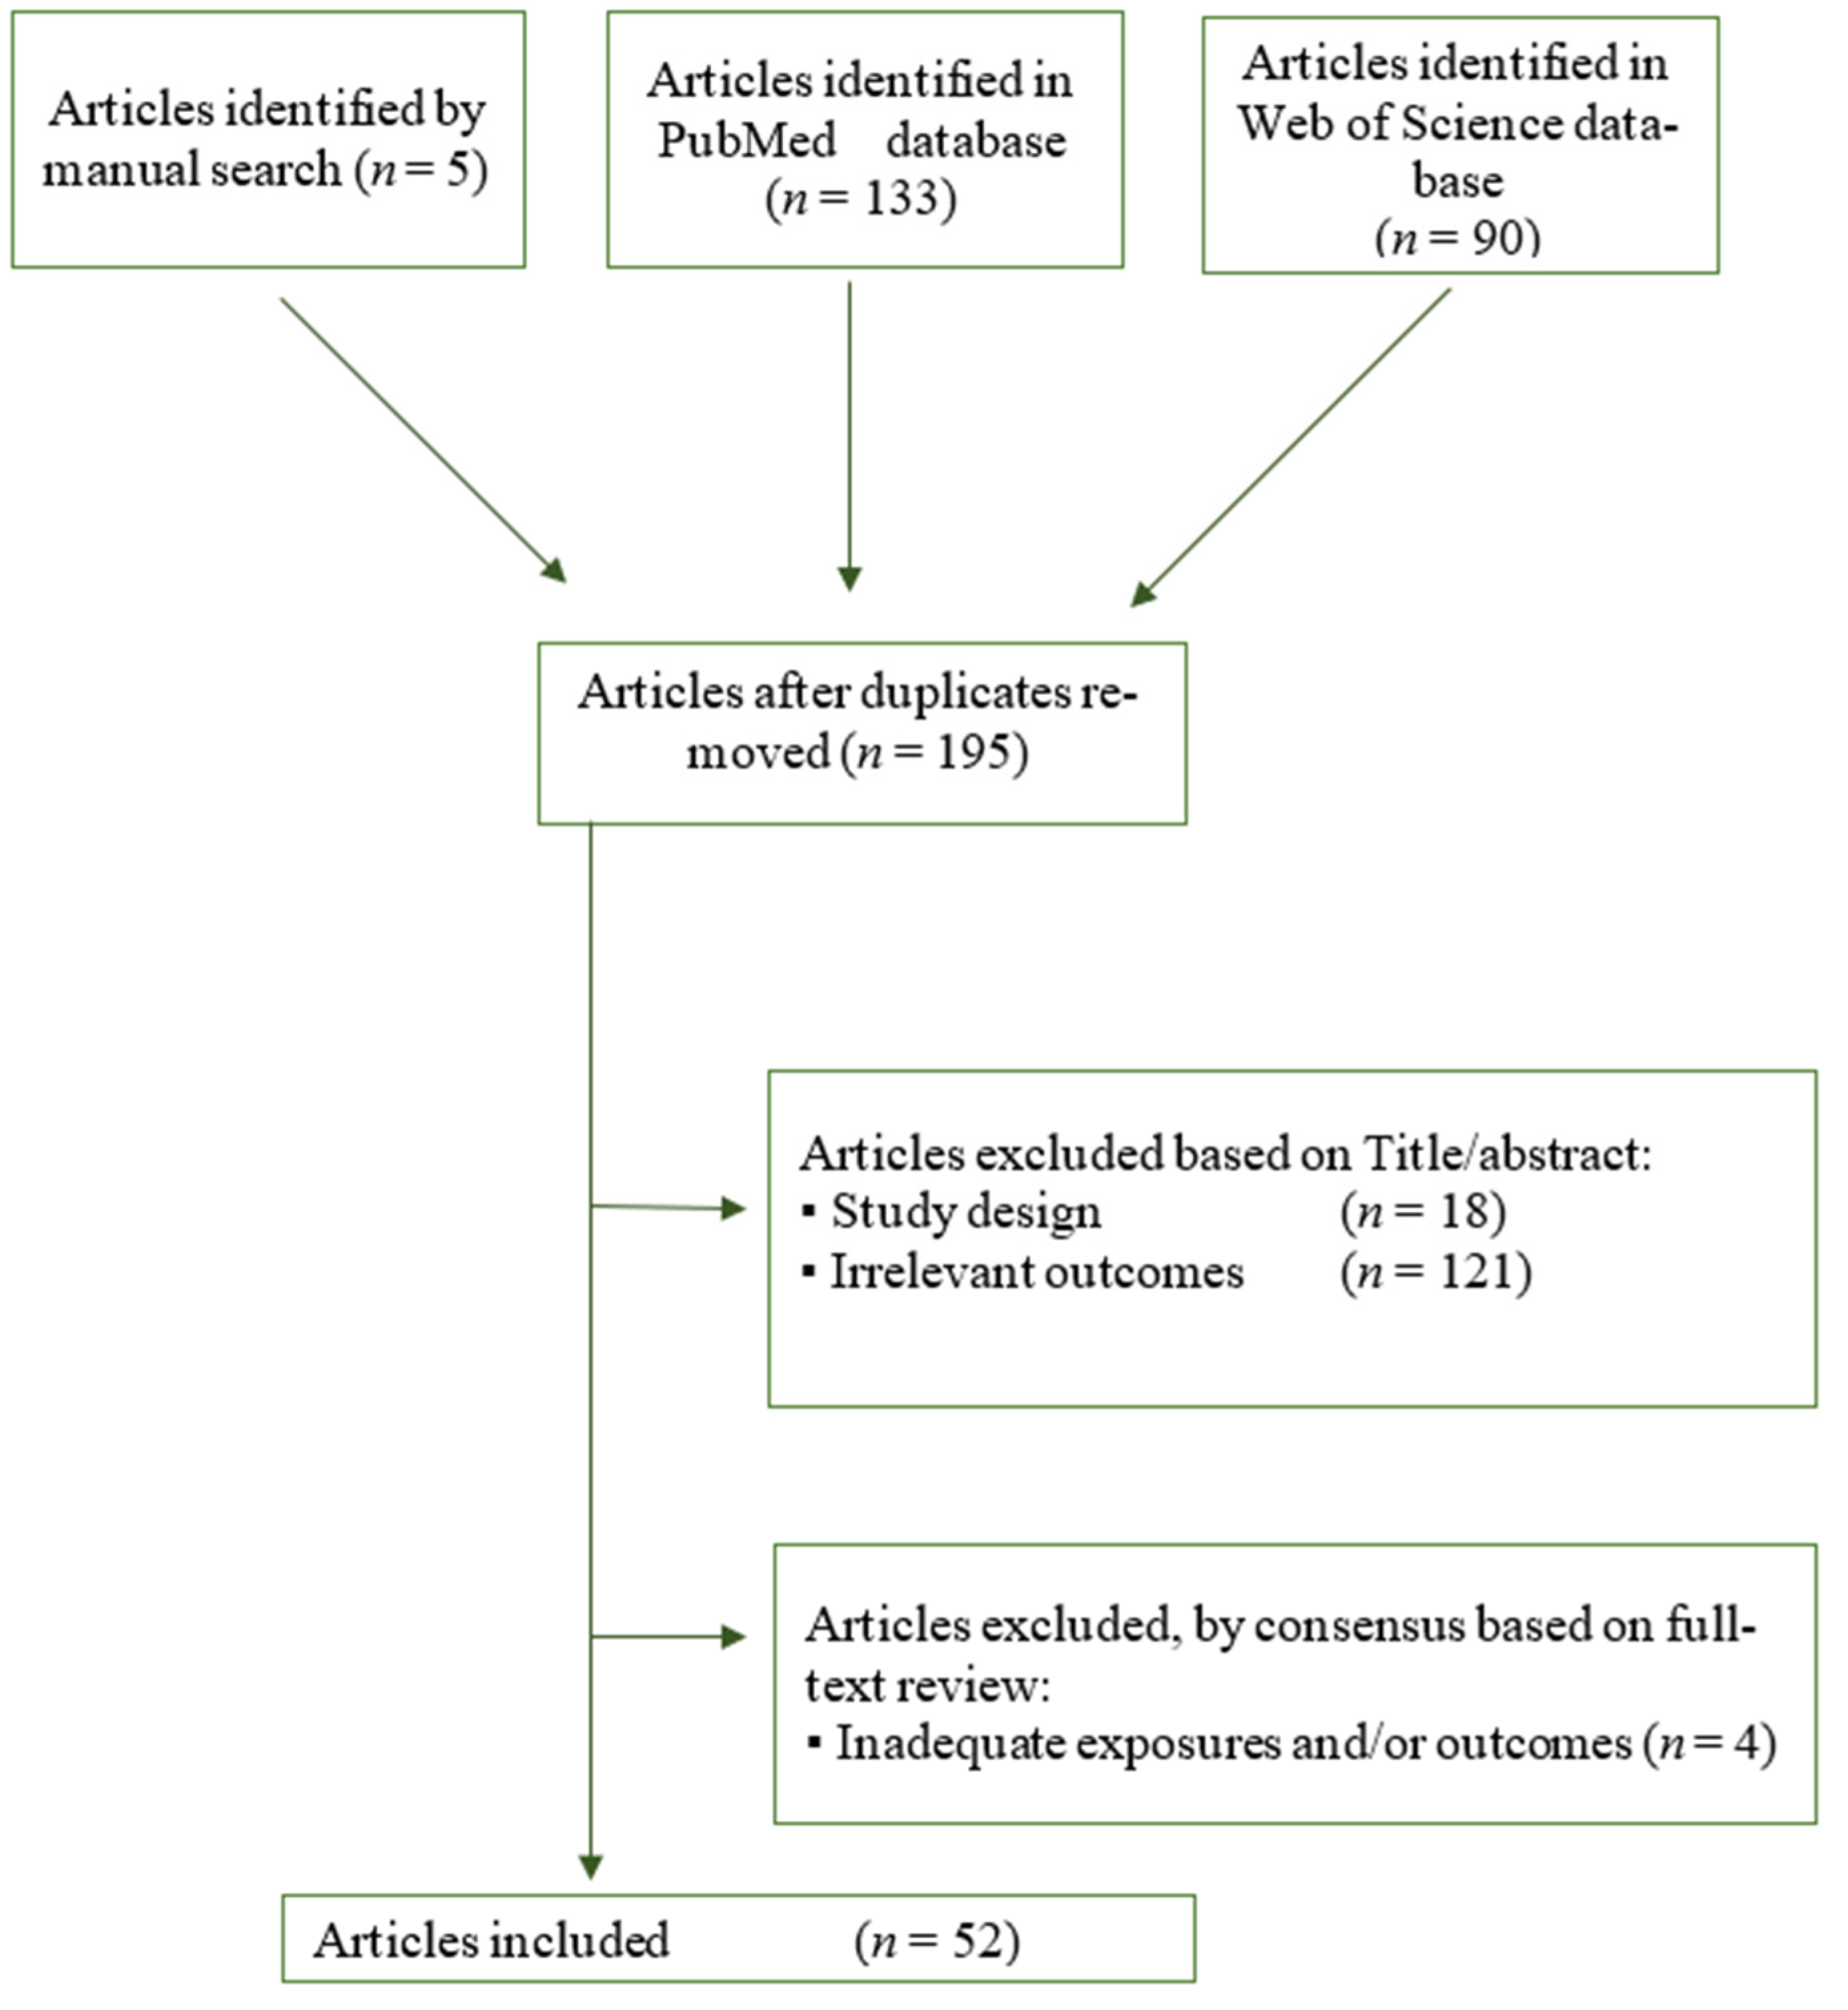
3.1. Study Inclusion
3.2. Study Characteristic
3.3. Cross-Sectional Studies
3.3.1. Eating Speed/Rate
Children
Adults
3.3.2. Eating Frequency
Children
Adults
3.4. Longitudinal Studies
3.4.1. Eating Speed/Rate
Children
Adults
3.4.2. Eating Frequency
Children
Adults
3.5. Interventional Trials
3.5.1. Eating Speed/Rate
Children
Adults
3.5.2. Eating Frequency
Children
Adults
4. Discussion
5. Conclusions
Author Contributions
Funding
Institutional Review Board Statement
Informed Consent Statement
Conflicts of Interest
References
- World Health Organisation (WHO). Obesity and Overweight. Available online: https://www.who.int/news-room/fact-sheets/detail/obesity-and-overweight (accessed on 4 November 2020).
- Yamane, M.; Ekuni, D.; Mizutani, S.; Kataoka, K.; Sakumoto-Kataoka, M.; Kawabata, Y.; Omori, C.; Azuma, T.; Tomofuji, T.; Iwasaki, Y.; et al. Relationships between eating quickly and weight gain in Japanese University students: A longitudinal study. Obesity 2014, 22, 2262–2266. [Google Scholar] [CrossRef]
- Llewellyn, C.; Wardle, J. Behavioral susceptibility to obesity: Gene-environment interplay in the development of weight. Physiol. Behav. 2015, 152, 494–501. [Google Scholar] [CrossRef]
- Taylor, R.W.; Iosua, E.; Heath, A.L.M.; Gray, A.R.; Taylor, B.J.; Lawrence, J.A.; Hanna, M.; Cameron, S.L.; Sayers, R.; Galland, B. Eating frequency in relation to BMI in very young children: A longitudinal analysis. Public Health Nutr. 2017, 20, 1372–1379. [Google Scholar] [CrossRef] [Green Version]
- Zhu, B.; Haruyama, Y.; Muto, T.; Yamazaki, T. Association between eating speed and metabolic syndrome in a three-year population-based cohort study. J. Epidemiol. 2015, 25, 332–336. [Google Scholar] [CrossRef] [PubMed] [Green Version]
- Mok, A.; Haldar, S.; Lee, J.C.Y.; Leow, M.K.S.; Henry, C.J. Postprandial changes in cardiometabolic disease risk in young Chinese men following isocaloric high or low protein diets, stratified by either high or low meal frequency—A randomized controlled crossover trial. Nutr. J. 2016, 15. [Google Scholar] [CrossRef] [PubMed] [Green Version]
- Jahnke, D.L.; Warschburger, P.A. Familial transmission of eating behaviors in preschool-aged children. Obesity 2008, 16, 1821–1825. [Google Scholar] [CrossRef] [PubMed]
- Munsters, M.J.M.; Saris, W.H.M. Body weight regulation and obesity: Dietary strategies to improve the metabolic profile. Annu. Rev. Food Sci. Technol. 2014, 5, 39–51. [Google Scholar] [CrossRef]
- Tanihara, S.; Imatoh, T.; Miyazaki, M.; Babazono, A.; Momose, Y.; Baba, M.; Uryu, Y.; Une, H. Retrospective longitudinal study on the relationship between 8-year weight change and current eating speed. Appetite 2011, 57, 179–183. [Google Scholar] [CrossRef]
- Murakami, K.; Livingstone, M.B.E. Associations of eating frequency with adiposity measures, blood lipid profiles and blood pressure in British children and adolescents. Br. J. Nutr. 2014, 111, 2176–2183. [Google Scholar] [CrossRef] [Green Version]
- Murakami, K.; Livingstone, M.B.E. Associations between Meal and Snack Frequency and Diet Quality in US Adults: National Health and Nutrition Examination Survey 2003–2012. J. Acad. Nutr. Diet. 2016, 116, 1101–1113. [Google Scholar] [CrossRef] [PubMed]
- Faith, M.S.; Diewald, L.K.; Crabbe, S.; Burgess, B.; Berkowitz, R.I. Reduced Eating Pace (RePace) Behavioral Intervention for Children Prone to or with Obesity: Does the Turtle Win the Race? Obesity 2019, 27, 121–129. [Google Scholar] [CrossRef] [PubMed] [Green Version]
- Van den Boer, J.H.W.; Kranendonk, J.; van de Wiel, A.; Feskens, E.J.M.; Geelen, A.; Mars, M. Self-reported eating rate is associated with weight status in a Dutch population: A validation study and a cross-sectional study. Int. J. Behav. Nutr. Phys. Act. 2017, 14. [Google Scholar] [CrossRef] [Green Version]
- Jennings, A.; Cassidy, A.; Van Sluijs, E.M.F.; Griffin, S.J.; Welch, A.A. Associations between eating frequency, adiposity, diet, and activity in 9–10 year old healthy-weight and centrally obese children. Obesity 2012, 20, 1462–1468. [Google Scholar] [CrossRef]
- Murakami, K.; Livingstone, M.B.E. Meal and snack frequency in relation to diet quality in US children and adolescents: The National Health and Nutrition Examination Survey 2003–2012. Public Health Nutr. 2016, 19, 1635–1644. [Google Scholar] [CrossRef] [Green Version]
- Murakami, K.; Livingstone, M.B.E. Associations between meal and snack frequency and diet quality and adiposity measures in British adults: Findings from the National Diet and Nutrition Survey. Public Health Nutr. 2016, 19, 1624–1634. [Google Scholar] [CrossRef] [Green Version]
- Murakami, K.; Livingstone, M.B.E. Decreasing the number of small eating occasions (<15% of total energy intake) regardless of the time of day may be important to improve diet quality but not adiposity: A cross-sectional study in British children and adolescents. Br. J. Nutr. 2016, 115, 332–341. [Google Scholar] [CrossRef] [PubMed] [Green Version]
- Lee, K.S.; Kim, D.H.; Jang, J.S.; Nam, G.E.; Shin, Y.N.; Bok, A.R.; Kim, M.J.; Cho, K.H. Eating rate is associated with cardiometabolic risk factors in Korean adults. Nutr. Metab. Cardiovasc. Dis. 2013, 23, 635–641. [Google Scholar] [CrossRef]
- Tao, L.; Yang, K.; Huang, F.; Liu, X.; Li, X.; Luo, Y.; Wu, L.; Guo, X. Association between self-reported eating speed and metabolic syndrome in a Beijing adult population: A cross-sectional study. BMC Public Health 2018, 18. [Google Scholar] [CrossRef] [Green Version]
- Lee, J.S.; Mishra, G.; Hayashi, K.; Watanabe, E.; Mori, K.; Kawakubo, K. Combined eating behaviors and overweight: Eating quickly, late evening meals, and skipping breakfast. Eat. Behav. 2016, 21, 84–88. [Google Scholar] [CrossRef] [PubMed]
- Paz-Graniel, I.; Babio, N.; Mendez, I.; Salas-Salvadó, J. Association between eating speed and classical cardiovascular risk factors: A cross-sectional study. Nutrients 2019, 11, 83. [Google Scholar] [CrossRef] [Green Version]
- Kim, S.; Park, G.H.; Yang, J.H.; Chun, S.H.; Yoon, H.J.; Park, M.S. Eating frequency is inversely associated with blood pressure and hypertension in Korean adults: Analysis of the Third Korean National Health and Nutrition Examination Survey. Eur. J. Clin. Nutr. 2014, 68, 481–489. [Google Scholar] [CrossRef] [Green Version]
- Kim, S.; Yang, J.H.; Park, G.H. Eating frequency is inversely associated with BMI, waist circumference and the proportion of body fat in Korean adults when diet quality is high, but not when it is low: Analysis of the Fourth Korea National Health and Nutrition Examination Survey (KNHANE IV). Br. J. Nutr. 2018, 119, 918–927. [Google Scholar] [CrossRef] [Green Version]
- Fogel, A.; Goh, A.T.; Fries, L.R.; Sadananthan, S.A.; Velan, S.S.; Michael, N.; Tint, M.-T.; Fortier, M.V.; Chan, M.J.; Toh, J.Y.; et al. Faster eating rates are associated with higher energy intakes during an ad libitum meal, higher BMI and greater adiposity among 4·5-year-old children: Results from the Growing Up in Singapore Towards Healthy Outcomes (GUSTO) cohort. Br. J. Nutr. 2017, 117, 1042–1051. [Google Scholar] [CrossRef] [Green Version]
- House, B.T.; Shearrer, G.E.; Miller, S.J.; Pasch, K.E.; Goran, M.I.; Davis, J.N. Increased eating frequency linked to decreased obesity and improved metabolic outcomes. Int. J. Obes. 2015, 39, 136–141. [Google Scholar] [CrossRef] [PubMed]
- Eloranta, A.M.; Lindi, V.; Schwab, U.; Tompuri, T.; Kiiskinen, S.; Lakka, H.M.; Laitinen, T.; Lakka, T.A. Dietary factors associated with overweight and body adiposity in Finnish children aged 6–8 years: The PANIC Study. Int. J. Obes. 2012, 36, 950–955. [Google Scholar] [CrossRef] [Green Version]
- Okubo, H.; Murakami, K.; Masayasu, S.; Sasaki, S. The Relationship of Eating Rate and Degree of Chewing to Body Weight Status among Preschool Children in Japan: A Nationwide Cross-Sectional Study. Nutrients 2018, 11, 64. [Google Scholar] [CrossRef] [PubMed] [Green Version]
- Okubo, H.; Miyake, Y.; Sasaki, S.; Tanaka, K.; Hirota, Y. Rate of eating in early life is positively associated with current and later body mass index among young Japanese children: The Osaka Maternal and Child Health Study. Nutr. Res. 2017, 37, 20–28. [Google Scholar] [CrossRef] [PubMed]
- Jääskeläinen, A.; Schwab, U.; Kolehmainen, M.; Pirkola, J.; Järvelin, M.R.; Laitinen, J. Associations of meal frequency and breakfast with obesity and metabolic syndrome traits in adolescents of Northern Finland Birth Cohort 1986. Nutr. Metab. Cardiovasc. Dis. 2013, 23, 1002–1009. [Google Scholar] [CrossRef]
- Ritchie, L.D. Less frequent eating predicts greater BMI and waist circumference in female adolescents. Am. J. Clin. Nutr. 2012, 95, 290–296. [Google Scholar] [CrossRef] [Green Version]
- Franko, D.L.; Striegel-Moore, R.H.; Thompson, D.; Affenito, S.G.; Schreiber, G.B.; Daniels, S.R.; Crawford, P.B. The relationship between meal frequency and body mass index in black and white adolescent girls: More is less. Int. J. Obes. 2008, 32, 23–29. [Google Scholar] [CrossRef] [Green Version]
- Kelishadi, R.; Qorbani, M.; Motlagh, M.E.; Heshmat, R.; Ardalan, G.; Bahreynian, M. Association of eating frequency with anthropometric indices and blood pressure in children and adolescents: The CASPIAN-IV Study. J. Pediatr. (Rio. J.). 2016, 92, 156–167. [Google Scholar] [CrossRef] [Green Version]
- Alberti, K.G.M.M.; Eckel, R.H.; Grundy, S.M.; Zimmet, P.Z.; Cleeman, J.I.; Donato, K.A.; Fruchart, J.C.; James, W.P.T.; Loria, C.M.; Smith, S.C. Harmonizing the metabolic syndrome: A joint interim statement of the international diabetes federation task force on epidemiology and prevention; National heart, lung, and blood institute; American heart association; World heart federation; International atherosclerosis society; And international association for the study of obesity. Circulation 2009, 120, 1640–1645. [Google Scholar]
- Lee, S.Y.; Park, H.S.; Kim, D.J.; Han, J.H.; Kim, S.M.; Cho, G.J.; Kim, D.Y.; Kwon, H.S.; Kim, S.R.; Lee, C.B.; et al. Appropriate waist circumference cutoff points for central obesity in Korean adults. Diabetes Res. Clin. Pract. 2007, 75, 72–80. [Google Scholar] [CrossRef]
- Li, C.; Ford, E.S.; Mokdad, A.H.; Cook, S. Recent trends in waist circumference and waist-height ratio among US children and adolescents. Pediatrics 2006, 118. [Google Scholar] [CrossRef] [PubMed]
- Alberti, K.G.M.M.; Zimmet, P.; Shaw, J. The metabolic syndrome—a new worldwide definition. Lancet 2005, 366, 1059–1062. [Google Scholar] [CrossRef]
- Grundy, S.M.; Cleeman, J.I.; Bairey Merz, C.N.; Brewer, H.B.; Clark, L.T.; Hunninghake, D.B.; Pasternak, R.C.; Smith, S.C.; Stone, N.J. Implications of recent clinical trials for the National Cholesterol Education Program Adult Treatment Panel III guidelines. Circulation 2004, 110, 227–239. [Google Scholar] [CrossRef] [Green Version]
- Cleeman, J.I.; Grundy, S.M.; Becker, D.; Clark, L. Expert panel on detection evaluation and treatment of high blood cholesterol in adults Executive summary of the third report (NCEP) -adult treatment panel III. J. Am. Med. Assoc. 2001, 285, 2486–2497. [Google Scholar]
- Chobanian, A.V.; Bakris, G.L.; Black, H.R.; Cushman, W.C.; Green, L.A.; Izzo, J.L.; Jones, D.W.; Materson, B.J.; Oparil, S.; Wright, J.T.; et al. Seventh report of the Joint National Committee on Prevention, Detection, Evaluation, and Treatment of High Blood Pressure. Hypertension 2003, 42, 1206–1252. [Google Scholar] [CrossRef] [Green Version]
- Zimmet, P.; Alberti, G.K.M.M.; Kaufman, F.; Tajima, N.; Silink, M.; Arslanian, S.; Wong, G.; Bennett, P.; Shaw, J.; Caprio, S. The metabolic syndrome in children and adolescents—An IDF consensus report. Pediatr. Diabetes 2007, 8, 299–306. [Google Scholar] [CrossRef] [PubMed]
- Fallah, Z.; Qorbani, M.; Motlagh, M.E.; Heshmat, R.; Ardalan, G.; Kelishadi, R. Prevalence of prehypertension and hypertension in a nationally representative sample of iranian children and adolescents: The CASPIAN-IV study. Int. J. Prev. Med. 2014, 5 (Suppl. S1), S57. [Google Scholar] [PubMed]
- Guenther, P.M.; Kirkpatrick, S.I.; Reedy, J.; Krebs-Smith, S.M.; Buckman, D.W.; Dodd, K.W.; Casavale, K.O.; Carroll, R.J. The healthy eating Index-2010 is a valid and reliable measure of diet quality according to the 2010 dietary guidelines for Americans. J. Nutr. 2014, 144, 399–407. [Google Scholar] [CrossRef] [PubMed] [Green Version]
- Guenther, P.M.; Casavale, K.O.; Reedy, J.; Kirkpatrick, S.I.; Hiza, H.A.B.; Kuczynski, K.J.; Kahle, L.L.; Krebs-Smith, S.M. Update of the Healthy Eating Index: HEI-2010. J. Acad. Nutr. Diet. 2013, 113, 569–580. [Google Scholar] [CrossRef] [PubMed] [Green Version]
- Trichopoulou, A.; Orfanos, P.; Norat, T.; Bueno-de-Mesquita, B.; Ocké, M.C.; Peeters, P.H.M.; van der Schouw, Y.T.; Boeing, H.; Hoffmann, K.; Boffetta, P.; et al. Modified Mediterranean diet and survival: EPIC-elderly prospective cohort study. Br. Med. J. 2005, 330, 991–995. [Google Scholar] [CrossRef] [PubMed] [Green Version]
- Struijk, E.A.; Beulens, J.W.; May, A.M.; Fransen, H.P.; Boer, J.M.A.; De Wit, G.A.; Onland-Moret, N.G.; Van Der Schouw, Y.T.; Hoekstra, J.; Bueno-De-Mesquita, H.B.; et al. Dietary patterns in relation to disease burden expressed in Disability-Adjusted Life Years. Am. J. Clin. Nutr. 2014, 100, 1158–1165. [Google Scholar] [CrossRef] [Green Version]
- Madden, J.P.; Goodman, S.J.; Guthrie, H.A. Validity of the 24-hr. recall. Analysis of data obtained from elderly subjects. J. Am. Diet. Assoc. 1976, 68, 143–147. [Google Scholar]
- Kant, A.K. Indexes of overall diet quality: A review. J. Am. Diet. Assoc. 1996, 96, 785–791. [Google Scholar] [CrossRef]
- Huijbregts, P.; Feskens, E.; Räsänen, L.; Fidanza, F.; Nissinen, A.; Menotti, A.; Kromhout, D. Dietary pattern and 20 year mortality in elderly men in Finland, Italy, and the Netherlands: Longitudinal cohort study. Br. Med. J. 1997, 315, 13–17. [Google Scholar] [CrossRef] [Green Version]
- Thorpe, M.G.; Milte, C.M.; Crawford, D.; McNaughton, S.A. A revised Australian dietary guideline index and its association with key sociodemographic factors, health behaviors and body mass index in peri-retirement aged adults. Nutrients 2016, 8, 160. [Google Scholar] [CrossRef] [PubMed] [Green Version]
- Toft, U.; Kristoffersen, L.H.; Lau, C.; Borch-Johnsen, K.; Jørgensen, T. The Dietary Quality Score: Validation and association with cardiovascular risk factors: The Inter99 study. Eur. J. Clin. Nutr. 2007, 61, 270–278. [Google Scholar] [CrossRef]
- Evans, E.W.; Jacques, P.F.; Dallal, G.E.; Sacheck, J.; Must, A. The role of eating frequency on total energy intake and diet quality in a low-income, racially diverse sample of schoolchildren. Public Health Nutr. 2015, 18, 474–481. [Google Scholar] [CrossRef] [Green Version]
- Sonoda, C.; Fukuda, H.; Kitamura, M.; Hayashida, H.; Kawashita, Y.; Furugen, R.; Koyama, Z.; Saito, T. Associations among obesity, eating speed, and oral health. Obes. Facts 2018, 11, 165–175. [Google Scholar] [CrossRef]
- Hamada, Y.; Miyaji, A.; Hayashi, Y.; Matsumoto, N.; Nishiwaki, M.; Hayashi, N. Objective and subjective eating speeds are related to body composition and shape in female college students. J. Nutr. Sci. Vitaminol. 2017, 63, 174–179. [Google Scholar] [CrossRef] [PubMed] [Green Version]
- Wuren, M.A.; Endoh, K.; Kuriki, K. Eating rate as risk for body mass index and waist circumference obesity with appropriate confounding factors: A cross-sectional analysis of the Shizuoka-Sakuragaoka J-MICC Study. Asia Pac. J. Clin. Nutr. 2019, 28, 79–91. [Google Scholar] [CrossRef]
- Nagahama, S.; Kurotani, K.; Pham, N.M.; Nanri, A.; Kuwahara, K.; Dan, M.; Nishiwaki, Y.; Mizoue, T. Self-reported eating rate and metabolic syndrome in Japanese people: Cross-sectional study. BMJ Open 2014, 4, e005241. [Google Scholar] [CrossRef] [Green Version]
- Leong, S.L.; Gray, A.; Horwath, C.C. Speed of eating and 3-year BMI change: A nationwide prospective study of mid-age women. Public Health Nutr. 2016, 19, 463–469. [Google Scholar] [CrossRef] [PubMed] [Green Version]
- Leech, R.M.; Livingstone, K.M.; Worsley, A.; Timperio, A.; McNaughton, S.A. Meal frequency but not snack frequency is associated with micronutrient intakes and overall diet quality in Australian men and women. J. Nutr. 2016, 146, 2027–2034. [Google Scholar] [CrossRef] [PubMed] [Green Version]
- Holm, L.; Lund, T.B.; Niva, M. Eating practices and diet quality: A population study of four Nordic countries. Eur. J. Clin. Nutr. 2015, 69, 791–798. [Google Scholar] [CrossRef] [Green Version]
- Alamri, E.S. Snacking patterns in relation to waist circumference and body mass index in female Saudi undergraduate students Medical Science. Med. Sci. 2020, 24, 1128–1135. [Google Scholar]
- Barnes, T.L.; French, S.A.; Harnack, L.J.; Mitchell, N.R.; Wolfson, J. Snacking Behaviors, Diet Quality, and Body Mass Index in a Community Sample of Working Adults. J. Acad. Nutr. Diet. 2015, 115, 1117–1123. [Google Scholar] [CrossRef] [PubMed] [Green Version]
- Drummond, S.E.; Crombie, N.E.; Cursiter, M.C.; Kirk, T.R. Evidence that eating frequency is inversely related to body weight status in male, but not female, non-obese adults reporting valid dietary intakes. Int. J. Obes. 1998, 22, 105–112. [Google Scholar] [CrossRef] [PubMed] [Green Version]
- Aljuraiban, G.S.; Chan, Q.; Oude Griep, L.M.; Brown, I.J.; Daviglus, M.L.; Stamler, J.; Van Horn, L.; Elliott, P.; Frost, G.S. The Impact of Eating Frequency and Time of Intake on Nutrient Quality and Body Mass Index: The INTERMAP Study, a Population-Based Study. J. Acad. Nutr. Diet. 2015, 115, 528–536.e1. [Google Scholar] [CrossRef] [Green Version]
- House, B.T.; Shearrer, G.E.; Boisseau, J.B.; Bray, M.S.; Davis, J.N. Decreased eating frequency linked to increased visceral adipose tissue, body fat, and BMI in Hispanic college freshmen. BMC Nutr. 2018, 4, 10. [Google Scholar] [CrossRef]
- O’Connor, L.; Brage, S.; Griffin, S.J.; Wareham, N.J.; Forouhi, N.G. The cross-sectional association between snacking behaviour and measures of adiposity: The Fenland Study, UK. Br. J. Nutr. 2015, 114, 1286–1293. [Google Scholar] [CrossRef] [Green Version]
- Zhu, Y.; Hollis, J.H. Associations between eating frequency and energy intake, energy density, diet quality and body weight status in adults from the USA. Br. J. Nutr. 2016, 115, 2138–2144. [Google Scholar] [CrossRef] [PubMed] [Green Version]
- Zizza, C.A.; Xu, B. Snacking is associated with overall diet quality among adults. J. Acad. Nutr. Diet. 2012, 112, 291–296. [Google Scholar] [CrossRef]
- Kahleova, H.; Lloren, J.I.; Mashchak, A.; Hill, M.; Fraser, G.E. Meal frequency and timing are associatedwith changes in body mass index in Adventist Health Study 2. J. Nutr. 2017, 147, 1722–1728. [Google Scholar] [CrossRef] [Green Version]
- Kanaley, J.A.; Heden, T.D.; Liu, Y.; Fairchild, T.J. Alteration of postprandial glucose and insulin concentrations with meal frequency and composition. Br. J. Nutr. 2014, 112, 1484–1493. [Google Scholar] [CrossRef] [PubMed] [Green Version]
- Alencar, M.K.; Beam, J.R.; McCormick, J.J.; White, A.C.; Salgado, R.M.; Kravitz, L.R.; Mermier, C.M.; Gibson, A.L.; Conn, C.A.; Kolkmeyer, D.; et al. Increased meal frequency attenuates fat-free mass losses and some markers of health status with a portion-controlled weight loss diet. Nutr. Res. 2015, 35, 375–383. [Google Scholar] [CrossRef]
- Carlson, O.; Martin, B.; Stote, K.S.; Golden, E.; Maudsley, S.; Najjar, S.S.; Ferrucci, L.; Ingram, D.K.; Longo, D.L.; Rumpler, W.V.; et al. Impact of reduced meal frequency without caloric restriction on glucose regulation in healthy, normal-weight middle-aged men and women. Metabolism 2007, 56, 1729–1734. [Google Scholar] [CrossRef] [PubMed] [Green Version]
- Megson, M.; Wing, R.; Leahey, T.M. Effects of breakfast eating and eating frequency on body mass index and weight loss outcomes in adults enrolled in an obesity treatment program. J. Behav. Med. 2017, 40, 595–601. [Google Scholar] [CrossRef]
- Stote, K.S.; Baer, D.J.; Spears, K.; Paul, D.R.; Harris, G.K.; Rumpler, W.V.; Strycula, P.; Najjar, S.S.; Ferrucci, L.; Ingram, D.K.; et al. A controlled trial of reduced meal frequency without caloric restriction in healthy, normal-weight, middle-aged adults. Am. J. Clin. Nutr. 2007, 85, 981–988. [Google Scholar] [CrossRef]
- Yildiran, H.; Mercanligil, S.M. Does increasing meal frequency improve weight loss and some biochemical parameters in overweight/obese females? Nutr. Hosp. 2019, 36, 66–72. [Google Scholar] [CrossRef]
- Larsen, S.C.; Heitmann, B.L. More Frequent Intake of Regular Meals and Less Frequent Snacking Are Weakly Associated with Lower Long-Term Gains in Body Mass Index and Fat Mass in Middle-Aged Men and Women. J. Nutr. 2019, 149, 824–830. [Google Scholar] [CrossRef] [PubMed]
- Fábry, P.; Hejl, Z.; Fodor, J.; Braun, T.; Zvolánková, K. The Frequency of Meals Its Relation to Overweight, Hypercholesterolæmia, and Decreased Glucose-Tolerance. Lancet 1964, 284, 614–615. [Google Scholar] [CrossRef]
- Chang, S.H.; Chang, Y.Y.; Wu, L.Y. Gender differences in lifestyle and risk factors of metabolic syndrome: Do women have better health habits than men? J. Clin. Nurs. 2019, 28, 2225–2234. [Google Scholar] [CrossRef]
- Johnson, C.M.; Henderson, M.S.; Tripicchio, G.; Rozin, P.; Heo, M.; Pietrobelli, A.; Berkowitz, R.I.; Keller, K.L.; Faith, M.S. Observed parent–child feeding dynamics in relation to child body mass index and adiposity. Pediatr. Obes. 2018, 13, 222–231. [Google Scholar] [CrossRef] [PubMed]
- Birch, L.L.; Fisher, J.O. Development of eating behaviors among children and adolescents. Pediatrics 1998, 101, 539–549. [Google Scholar] [PubMed]
- De Onis, M. WHO Child Growth Standards based on length/height, weight and age. Acta Paediatr. Int. J. Paediatr. 2006, 95, 76–85. [Google Scholar] [CrossRef]
- Hermsen, S.; Mars, M.; Higgs, S.; Frost, J.H.; Hermans, R.C.J. Effects of eating with an augmented fork with vibrotactile feedback on eating rate and body weight: A randomized controlled trial. Int. J. Behav. Nutr. Phys. Act. 2019, 16. [Google Scholar] [CrossRef] [Green Version]
- Salazar Vázquez, B.Y.; Salazar Vázquez, M.A.; López Gutiérrez, G.; Acosta Rosales, K.; Cabrales, P.; Vadillo-Ortega, F.; Intaglietta, M.; Pérez Tamayo, R.; Schmid-Schönbein, G.W. Control of overweight and obesity in childhood through education in meal time habits. The ‘good manners for a healthy future’ programme. Pediatr. Obes. 2016, 11, 484–490. [Google Scholar] [CrossRef] [PubMed] [Green Version]
- Galhardo, J.; Hunt, L.P.; Lightman, S.L.; Sabin, M.A.; Bergh, C.; Sodersten, P.; Shield, J.H. Normalizing eating behavior reduces body weight and improves gastrointestinal hormonal secretion in obese adolescents. J. Clin. Endocrinol. Metab. 2012, 97, 193–201. [Google Scholar] [CrossRef]
- Li, J.; Zhang, N.; Hu, L.; Li, Z.; Li, R.; Li, C.; Wang, S. Improvement in chewing activity reduces energy intake in one meal and modulates plasma gut hormone concentrations in obese and lean young Chinese men. Am. J. Clin. Nutr. 2011, 94, 709–716. [Google Scholar] [CrossRef] [PubMed]
- Krop, E.M.; Hetherington, M.M.; Nekitsing, C.; Miquel, S.; Postelnicu, L.; Sarkar, A. Influence of oral processing on appetite and food intake—A systematic review and meta-analysis. Appetite 2018, 125, 253–269. [Google Scholar] [CrossRef] [PubMed]
- Argyrakopoulou, G.; Simati, S.; Dimitriadis, G.; Kokkinos, A. How important is eating rate in the physiological response to food intake, control of body weight, and glycemia? Nutrients 2020, 12, 1734. [Google Scholar] [CrossRef] [PubMed]
- Szewczyk-Golec, K.; Woźniak, A.; Reiter, R.J. Inter-relationships of the chronobiotic, melatonin, with leptin and adiponectin: Implications for obesity. J. Pineal Res. 2015, 59, 277–291. [Google Scholar] [CrossRef]
- Shah, M.; Crisp, K.; Adams-Huet, B.; Dart, L.; Bouza, B.; Franklin, B.; Phillips, M. The effect of eating speed at breakfast on appetite hormone responses and daily food consumption. J. Investig. Med. 2015, 63, 22–28. [Google Scholar] [CrossRef]
- House, B.T.; Cook, L.T.; Gyllenhammer, L.E.; Schraw, J.M.; Goran, M.I.; Spruijt-Metz, D.; Weigensberg, M.J.; Davis, J.N. Meal skipping linked to increased visceral adipose tissue and triglycerides in overweight minority youth. Obesity 2014, 22, 77–84. [Google Scholar] [CrossRef] [Green Version]
- Campión, J.; Milagro, F.I.; Martínez, J.A. Individuality and epigenetics in obesity. Obes. Rev. 2009, 10, 383–392. [Google Scholar] [CrossRef]
- Yaghootkar, H.; Whitcher, B.; Bell, J.D.; Thomas, E.L. Ethnic differences in adiposity and diabetes risk—insights from genetic studies. J. Intern. Med. 2020, 288, 271–283. [Google Scholar] [CrossRef]
- Simmonds, M.; Llewellyn, A.; Owen, C.G.; Woolacott, N. Predicting adult obesity from childhood obesity: A systematic review and meta-analysis. Obes. Rev. 2016, 17, 95–107. [Google Scholar] [CrossRef] [PubMed] [Green Version]

| Cross-Sectional Studies | |||||
|---|---|---|---|---|---|
| Children | |||||
| Author and Year | Population | Exposure (s) | Outcome (s) | Adjusted Variables | Results |
| Eloranta 2012 [26]. | ▪ PANIC study. ▪ Finnish. ▪ n = 510 (247 girls and 263 boys). ▪ Age: 6–8 years. | Slowness in eating: finishing eating in more than 30 min (self-reported). | OW, OB, WC, and HC. | Sex, age, total daily time of PA, total daily screen time, and parental income level. | ▪ Slowness in eating: OW/OB (OR = 0.61 [95% CI: 0.41, 0.92]), WC (β = −0.16, p < 0.01) and HC (β = −0.17, p < 0.01). |
| Fogel 2017 [24]. | ▪ GUSTO cohort. ▪ Asian. ▪ n = 386 (184 girls and 202 boys). ▪ Age: 4.5 years. | Eating rate (video recorded—gr/min). | WC. | None. | ▪ Eating rate: WC (r = 0.17, p < 0.01). |
| Okubo2017 [28]. | ▪ Osaka Maternal and Child Health Study. ▪ Japanese. ▪ n = 492 mother-child pairs. ▪ Age: 30–42 m. ▪ 1 year follow-up. | Eating rate (self-reported). | BMI. | Child’s sex and age (at fourth survey), maternal age and BMI at enrollment, education level, family income, pregnancy smoking status, maternal working status at 30 months postpartum, birth order, birth weight, duration of breast-feeding, time spent watching TV at 30 months of age, protein intake, fat intake, and dietary fiber at 30 months of age. | Fast eating rate vs. slow eating rate at 30 m.: ▪ BMI at 30 m. (β = 0.70 [95% CI: 0.33, 1.08]). |
| Okubo 2018 [27]. | ▪ SHOKUIKU Study ▪ Japanese ▪ n = 4451 (2136 girls and 2315 boys). ▪ Age: 5–6 years. | Eating rate (self-reported). | OW and BMI z-score. | Sex, age, n° of siblings, PA and birthweight; residential block, parents’ educational attainment, parents weight status, protein (% of energy), fat (% of energy), and dietary fiber intake (g/1000 kcal). | ▪ Fast eating rate vs. medium eating: OW (OR = 2.71 [95% CI: 2.10, 3.48]). ▪ Fast eating rate: >BMI z-score (p < 0.01). |
| Adults | |||||
| Author and Year | Population | Exposure (s) | Outcome (s) | Adjusted Variables | Results |
| Lee 2013 [18]. | ▪ South Korean. ▪ n = 8775 (3956 women, 4819 men). ▪ Age: 20–80 years. | Eating rate (self-reported). | High FPG, high BP, low HDL-c, high TG, BMI (>25 kg/m2). | Age, alcohol, smoking, and exercise and BMI, total energy intake. | Fast eating rate vs. slow eating speed: ▪ Women: BMI (OR = 3.35 [95% CI: 2.23, 5.3]). Other variables: NA. |
| Nagahama 2014 [55]. | ▪ Japanese. ▪ n = 56,865 (15, 045 women and 41,820 men). ▪ Age: 17–99 years. | Self-reporting eating rate. | MetS, CO, high BP, high FPG, high TG, low HDL-c. | Age, smoking status, alcohol, regular physical activity and body mass index. | Fast eating rate vs. normal eating rate: ▪ Men: CO (OR = 1.97 [95% CI: 1.88, 2.07]), low HDL-c (OR = 1.10 [95% CI: 1.03, 1.18]), high TG (OR = 1.07 [95% CI: 1.02, 1.12]) and MetS (OR = 1.10 [95% CI: 1.03, 1.17]). ▪ Women: CO (OR = 1.44 [95% CI: 1.33, 1.56]). Other variables: NA. |
| Lee 2016 [20]. | ▪ Japanese. ▪ n = 4249 (2163 women and 2086 men). ▪ Age: 20–80 years. | Eating quickly (self-reported). | OW. | Gender, age, living with spouse, occupation, education, visiting hospitals, habitual exercise, smoking status, and alcohol drinking. | ▪ Eating quickly vs. no eating quickly: OW (OR = 1.92 [95% CI: 1.62, 2.28]). |
| Hamada 2017 [53]. | ▪ Japanese. ▪ n = 84 (women college students). ▪ Age: 19 years. | Eating speed: - Subjective (self-reported) - Objective (total number of chews, number of chews/bites, total meal duration, number of bites, chewing rate). | BW, BMI, WC, AC and HC. | None. | ▪ Total # chews and meal duration (p < 0.05): BW (r = 0.22, 0.24), BMI (r = 0.24, 0.27), WC (r = 0.26, 0.24), AC (r = 0.25, 0.27) and HC (r = 0.24, 0.22). ▪ Total # bites (p < 0.05): BW (r = 0.25) and AC (r = 0.25). ▪ Subjective fast eating speed vs. subjective slow eating speed (p < 0.05): > BW, BMI, WC, AC and HC. |
| van den Boer 2017 [13]. | ▪ Dutch. ▪ n = 1473 (732 women and 741 men). ▪ Age: 20–70 years. | Eating speed (self-reported). | OW. | Age, smoking, level of education, emotional eating, restrained eating, external eating, energy intake, moderate to vigorous activity, and sedentary activity. | Fast eating speed vs. average eating speed in total population: OW (β = 0.90 [95% CI: 0.48, 1.32]). ▪ Stratified analysis: OW in women (β = 1.13 [95% CI: 0.43, 1.84]). |
| Sonoda 2018 [52]. | ▪ Japanese. ▪ n = 863 men (From Japanese Maritime Self Defense Force). | Eating speed (self-reported). | BMI and WC. | Eating speed, n° of missing functional teeth, periodontal status, age, military ranks, alcohol, smoking, and exercise frequency. | ▪ Fast eating speed vs. slow/very slow eating speed: BMI≥ 25 kg/m2 (OR = 5.04 [95% CI: 1.95, 13.07]), BMI≥ 30 kg/m2 (OR = 4.80 [95% CI: 1.21, 19.09]), WC≥ 85 cm (OR = 6.59 [95% CI: 2.37, 18.48]) and WC≥ 90 cm (OR = 5.22 [95% CI: 1.81, 15.06]). |
| Tao 2018 [19]. | ▪ Chinese. ▪ n = 7972 (3508 women and 3436 men). ▪ 18–65 years. | Eating speed (self-reported). | MetS, CO, elevated BP, elevated FPG, elevated TG, reduced HDL-c. | Age, education level, work stress, PA intensity, PA frequency, sleep duration, smoking, drinking, high salt intake, high intake of sugar, fat and/or meat, a mainly vegetable diet, frequency of eating breakfast, grain consumption, antihypertensive, antidiabetic, and/or hypolipidemic medication. | Fast eating speed vs. slow eating speed: ▪ Total population: prevalence for MetS (OR = 2.27 [95% CI: 1.80, 2.86]), CO (OR = 1.68 [95% CI: 1.35, 2.09]), BP (OR = 1.82 [95% CI: 1.48, 2.24]), TG (OR = 1.51 [95% CI: 1.21, 1.88]) and HDL-c (OR = 1.33 [95% CI: 1.11, 1.60]). ▪ Men: prevalence for MetS (OR = 2.21 [95% CI: 1.69, 2.91]), CO (OR = 1.53 [95% CI: 1.16, 2.02]), BP (OR = 1.50 [95% CI: 1.17, 1.92]), TG (OR = 1.69 [95% CI: 1.29, 2.23]) and HDL-c (OR = 1.35 [95% CI: 1.02, 1.79]). ▪ Women: prevalence for MetS (OR = 2.27 [95% CI: 1.46, 3.53]), CO (OR = 1.98 [95% CI: 1.36, 2.88]), BP (OR = 3.02 [95% CI: 2.00, 4.56]) and FPG (OR = 1.56 [95% CI: 1.05, 2.33]). |
| Paz-Graniel 2019 [21]. | ▪ PREDIMED-Reus study. ▪ Spanish. ▪ n = 792 (451 women and 341 men). ▪ Age: 55–80 years. | Eating speed (self-reported). | OB, MetS, CO, hypertriglyceridemia, low HDL-c, high BP, high FPG. | Age, sex, educational level, smoking status, use of dental prosthesis, total energy intake (kcal/day), alcohol consumption (g/day), physical activity (MET/min/day), and adherence to Mediterranean diet. | ▪ Fast eating speed: HR+ 59% for hypertriglyceridemia (HR = 1.59 [95% CI: 1.08, 2.02]). ▪ MetS and other variables: NA. |
| Wuren 2019 [54]. | ▪ Japan Multi-Institutional Collaborative Cohort study. ▪ Japanese. ▪ n = 5888 (2495 women and 3393 men). ▪ Age: 70–79 years. | Eating rate (self-reported). | BMI (> 25 kg/m2) and WC (> 80 cm in females and > 90 cm in males). | Age, current smoker, alcohol, PA, total energy intake, medication for hypertension, diabetes and/or dyslipidemia, sleep duration, psychological stress, education level, family structure, fast food, restaurants or food service use, packed lunch, dinner, snacking, and breakfast time. | Fast eating rate vs. normal eating rate: ▪ BMI (men: (OR = 1.48 [95% CI: 1.25, 1.76]; women: OR = 1.78 [95% CI: 1.39, 2.26]). ▪ WC (men: OR = 1.45 [95% CI: 1.21, 1.74]; women: OR = 1.34 [95% CI: 1.11, 1.61]). |
| Cross-Sectional Studies | |||||
|---|---|---|---|---|---|
| Children | |||||
| Author and Year | Population | Exposure (s) | Outcome (s) | Adjusted Variables | Results |
| Eloranta 2012 [26]. | ▪ PANIC study. ▪ Finnish. ▪ n = 510 (247 girls and 263 boys). ▪ Age: 6–8 years. | Eating frequency: ▪ 3 main meals/day: breakfast, lunch and dinner. ▪ Snacks (all eating and drink occasions besides main meals). | OW/OB, WC, HC. | Sex, age, total daily time of physical activity, total daily screen time, and parental income level. | Eating 3 main meals vs. not eating 3 main meals: ▪ OW/OB (OR = 0.37 [95% CI: 0.18, 0.75]). ▪ WC (β = −0.16, p < 0.01) and HC (β = −0.1, p < 0.01). Other variables: NA. |
| Jennings 2012 [14]. | ▪ SPEEDY study. ▪ British. ▪ n = 1700 (952 girls and 748 boys). ▪ Age: 9–10 years. | Eating frequency: number of time periods of food or drinks consumption (6–9 h, 9–12 h, 12–14 h, 14–17 h, 17–20 h, 20–22 h, 22 h–6 h): ▪ Breakfast (6–9 h). ▪ Mid-day meal (12–14 h). ▪ Evening meal (17–20 h). ▪ Snack (any other time). | BMI, BMI z-score, BW and WC. | Gender, parental education, under-reporting, energy intake, and physical activity. | ▪ Healthy weight children (p ≤ 0.03): BW (β = −0.78), BMI (β = −0.17), BMI z-score (β = −0.10) and WC (β = −0.38). ▪ Centrally obesity children: BMI z-score (β = 0.09, p < 0.05). ▪ Other variables: NA. |
| Jääskeläinen 2013 [29]. | ▪ Northern Finland Birth Cohort 1986. ▪ Finnish. ▪ n = 6247 (3181 girls and 3066 boys). ▪ Age: 16 years. | Meal frequency: ▪ Regular meal pattern: 5 meals a day including breakfast. ▪ Semi-regular meal pattern: ≤4 meals a day including breakfast. ▪ Breakfast skippers: ≤ 4 meals a day, not including breakfast. | OW/OB, WC, hyperglycemia, hypertriglyceridemia, low HDL-c, HT. | Early life factors: birth weight for gestational age, maternal weight gain in the first 20 weeks of gestation, maternal pre-pregnancy BMI, pregnancy smoking, maternal glucose metabolism, and parity. Later childhood factors: tobacco, sleep duration, PA, sedentary time, Tanner stage, parental education level, and body mass index. | Regular meal pattern vs. semi-regular meal pattern: 1. Model adjusted for early life factors: ▪ Boys: hypertriglyceridemia (OR = 0.48 [95% CI: 0.26, 0.89]) and OW/OB (OR = 0.47 [95% CI: 0.34, 0.65]). ▪ Girls: OW/OB (OR = 0.57 [95% CI: 0.41, 0.79]). 2. Model adjusted for later childhood factors: ▪ Boys: OW/OB (OR = 0.41 [95% CI: 0.29, 0.58]). ▪ Girls: OW/OB (OR = 0.63 [95% CI: 0.45, 0.89]). Other variables: NA. |
| Murakami 2014 [10]. | ▪ British. ▪ n = 1636 (803 girls and 833 boys). ▪ Age: 4–18 years. | Eating frequency: all eating occasions for food/drinks, except for those providing < 210 kJ of energy. | BMI z-score, HDL- c, TG, SBP and DBP. | Age, sex, social class, physical activity levels, intakes of protein, fat, total sugar and dietary fiber and BMI z-score (in the analysis of blood lipid profile, and blood pressure). | ▪ Adolescents ≥ 11 years: BMI z-score (β = 0.11, p < 0.01). ▪ Other variables: NA. |
| Evans 2015 [51]. | ▪ Daily D study. ▪ American. ▪ n = 176 (89 girls and 87 boys). ▪ Age: 9–15 years. | Eating, meal and snack frequency. | DQ (HEI-2005). | School, maternal education, free or reduced-price school lunch eligibility, and physical activity. | In children (9–11 years.): ▪ EF (β = 2.60, p < 0.01) and SF (β = 2.31, p = 0.02). In adolescents (12–15 years.): ▪ MF (β = 5.40, p = 0.01) and SF (β = −2.73, p < 0.01). |
| House 2015 [25]. | ▪ SOLAR cohort. ▪ American (Hispanic). ▪ n = 191 (83 girls and 108 boys). ▪ Age: 11–15 years. | Eating frequency: ▪ Infrequent: <3 per day. ▪ Frequent: ≥3 meals/day. | BMI z-score, WC, BW, FPG, HDL-c, TG. | Tanner stage, sex, mean energy, total fat, total fat and height, total lean, and height and insulin sensibility. | ▪ Frequent eaters vs. Infrequent eaters (p ≤ 0.01): <BMI z-score, WC and TG. ▪ Other variables: NA. |
| Kelishadi 2016 [32]. | ▪ CASPIAN-IV study. ▪ Iranian. ▪ n = 13,486 (6635 girls and 6851 boys). ▪ Age: 6–18 years. | Eating frequency (≤3, 4, 5 or ≥6): ▪ Breakfast/lunch/dinner. ▪ Number of snacks. | Elevated BP, elevated DBP, elevated SBP, OW, OB, and AO. | Age, gender, and living area, Screen time, physical activity, socioeconomic status, and sleeping hours, and BMI (only in blood pressure). | ▪ ≥6 EF vs. ≤ 3 EF: OB (OR = 0.54 [95% CI: 0.44, 0.65]) and AO (OR = 0.73 [95% CI: 0.63, 0.85]). ▪ Other variables: NA. |
| Murakami 2016 [17]. | ▪ British. ▪ n = 1636 (803 girls and 833 boys). ▪ Age: 4–18 years. | 1. Eating frequency: times/day. 2. Meal and snack frequencies: ▪ Based on energy percentage contribution (meal with ≥15% and snack with <15% of total energy). ▪ Based on time (meals: 6–10 h, 12–15 h and 18–21 h; snack: any other time). | DQ (MDS) and BMI z-score. | Age, sex, social class, physical activity and plausible energy reporters (in adolescents). | In children (4–10 years.): ▪ DQ (p < 0.01): EF (β = −0.30), SF-energy% (β = −0.20) SF-time (β = −0.31), MF-time (β = −0.40). In adolescents: ▪ DQ (p ≤ 0.03): EF (β = −0.10), SF-energy-% (β = −0.09), SF-time (β = −0.18) ▪ BMI z-score: MF-clock time (β = 0.13, p = 0.02). |
| Murakami 2016 [15]. | ▪ American. ▪ n = 10,462 (5188 girls and 5274 boys). ▪ Age: 6–19 years | Eating frequency: times/day. Meal and snack frequencies: ▪ Self report (meals: breakfast, brunch, lunch, supper, and dinner; others: snacks) ▪ Based on time (meals: 6–9 h, 12–14 h and 17–20 h; snack: other). ▪ Based on energy percentage contribution (meal: ≥15%, snack: <15% of total energy). | DQ (HEI-2010). | Sex, age, race/ethnicity, family poverty income ratio, education of household head, household size, PA, watching television and computer use, weight status, dietary reporting status, and survey cycle. | Children of 6–11 years. (p < 0.03): ▪ EF (β = 1.21), MF-energy% (β = 1.45), MF-self report (β = 3.59) and MF-time (β = 1.72), SF-energy% (β = 0.70) and SF-self report (β = 0.60). Adolescents (p < 0.01): ▪ EF (β = 1.52), MF-energy% (β = 1.74), MF-self report (β = 3.56) and MF-time (β = 1.99) and SF-energy% (β = 1.00). |
| Adults | |||||
| Author and Year | Population | Exposure (s) | Outcome (s) | Adjusted Variables | Results |
| Fábry 1964 [75]. | ▪ Czech. ▪ n = 379 men. ▪ Age: 60–64 years. | Meal frequency: ≤ 3, 3–4 (±snacks) or ≥ 5 per day | OW. | None. | ▪ ≤3 MF vs. ≥5 MF: > OW (p < 0.05). |
| Drummond 1998 [61]. | ▪ Scottish. ▪ n = 79 (37 women and 42 men). ▪ Age: 20–55 years. | Eating frequency: ▪ Eating occasion (food and beverage). ▪ Meal (breakfast, lunch or dinner). ▪ Snack. | BW and BMI. | None. | ▪ EF in men: BW (r = −0.34, p = 0.03). ▪ Other variables: NA. |
| Zizza 2012 [66]. | ▪ American. ▪ n = 11,209 (5789 women and 5420 men. ▪ Age: ≥ 20 years. | Snack frequency: 0, 1, 2, 3 o ≥ 4. | DQ (HEI-2005). | Sex, race/ethnicity, education, smoking, PA, consumption of ≥ meals/day, chronic diseases, age, BMI, and meals energy contribution. | ▪ Higher SF: > DQ (p < 0.01). |
| Kim 2014 [22]. | ▪ South Korean. ▪ n = 4625 (2294 women and 2331 men). ▪ Age: ≥ 19 years. | ▪ Eating frequency: all eating occasions (<2, 3, 4 or ≥5). ▪ Meal frequency: 1, 2 or 3. ▪ Snack frequency: 0, 1, 2 or ≥ 3. | HT, AO (WC ≥85 cm in women and ≥90 cm in men) and DQ (MAR). | Age, sex, smoking, smoking amount, alcohol consumption frequency, PA frequency, IPAQS, total daily calorie/sodium/potassium/calcium intake, sleep sufficiency, stress level, MAR, BMI, WC, meal, and snack frequency. | ≥5 EF vs. 3 EF: ▪ HT in AO (OR = 0.5 [95% CI: 0.31, 0.82]). ≥3 SF vs. 0 EF: ▪ HT in DQ < 50% (OR = 0.5 [95% CI: 0.23, 0.89]). |
| Aljuraiban 2015 [62]. | ▪ INTERMAP study. ▪ American and British. ▪ n = 2385 (1153 women and 1232 men). ▪ Age: 40–59 years. | Eating frequency/day: < 4, 4 to < 5, 5 to < 6 and 6. | BMI. | Age, gender, educational level, hours of moderate and heavy physical activity, smoking, special diet, dietary supplement use, and population sample. | ▪ BMI (β = −1.1 [95% CI: −1.6, −0.7]). |
| O’Connor 2015 [64]. | ▪ Fenland study. ▪ British. ▪ n = 10,092 (5446 women and 4646 men). | Snack frequency (self-reported). | BMI and WC. | Age, alcohol, smoking, age at completing full-time education, test site, main meal, light meal, drink-only snack, plasma vitamin C, energy intake, screen time, and PA energy expenditure. | SF in women: BMI (β = 0.29 [95% CI: 0.13, 0.44]) and WC (β = 0.73 [95% CI: 0.4, 1.1]). Every additional unit in SF: ▪ Women with BMI ≥ 25 kg/m2: WC (β = 0.80 [95% CI: 0.34, 1.26]). ▪ Men with BMI < 25 kg/m2: WC (β = −0.52 [95% CI: −0.90, −0.14]). |
| Barnes 2015 [60]. | ▪ American. ▪ n = 233 (157 women and 76 men). ▪ Age: 18–60 years. | Snack frequency: Beverage and/or meal in any eating occasion that is not breakfast, lunch, or dinner. | BMI and DQ (HEI-2010). | Age, sex, race/ethnicity, education level, income, job type, marital/partner status, physical activity, and total daily energy intake. | ▪ No significant associations. |
| Holm 2015 [58]. | ▪ European. ▪ n = 7531 (3612 women and 3919 men). ▪ Age: 15–80 years. | Meal frequency: 0–3, 4, ≥5. | DQ (DQS). | Age, gender, household composition, educational level, occupational status and socioeconomic level. | ▪ EF ≥ 5 vs. EF 0–3 (p ≤ 0.02): Denmark (β = 0.71), Finland (β = 0.37), Norway (β = 0.48) and Sweden (β = 0.68). |
| Zhu 2016 [65]. | ▪ American. ▪ n = 7791 (3774 women and 4017 men). ▪ Age: ≥ 20 years. | Eating frequency (self-reported). | DQ (HEI-2010), BMI, WC. | Age, race/ethnicity, ratio of family income: poverty, PA level, smoking, and energy intake. | Both genders: ▪ DQ in women (β = 1.63, p < 0.01) and men (β = 1.7, p < 0.01). ▪ WC in women (β = −0.8, p = 0.01) and men (β = −0.6, p = 0.03). Women: ▪ BMI (β = −0.4, p < 0.01). |
| Murakami 2016 [16]. | ▪ British. ▪ n = 1487 (809 women and 678 men). ▪ Age: 19–64 years. | Meal and snack frequency: ▪Based on energy percentage contribution: meal: ≥15% of total energy intake; snack: < 15%. ▪ Based on time: meal: from 06.00–10.00 h, 12.00–15.00 h or 18.00–21.00 h; snack: other occasion. | DQ (MDS and HDI), BMI and WC. | Age, social class, EI: EER (energy intake misreporting), smoking status, PA, protein intake (% of energy), fat intake (% of energy), total sugar intake (% of energy), alcohol intake (% of energy), and dietary fiber intake (g/10 MJ, continuous). | MDS or HDI: Men ▪ Positive (p ≤ 0.02): MF-energy% (MDSβ = 0.27, HDIβ = 0.26). ▪ Negative (p < 0.01): SF-energy% (MDSβ = −0.12, HDIβ = −0.09), SF-time (MDSβ = −0.19, HDIβ = −0.17). Women ▪ Positive (p < 0.05): MF-time (MDSβ = 0.14, HDIβ = 0.12), MF-energy% (MDSβ = 0.27). ▪ Negative (p ≤ 0.02): SF-time (MDSβ = −0.36, HDIβ = −0.15), SF-energy% (MDSβ = −0.11). BMI or WC: Men ▪ Positive (p < 0.05): MF-time (BMIβ = 0.33, WCβ = 0.85), SF-time (BMIβ = 0.36, WCβ = 0.87) and SF-energy% (BMIβ = 0.32, WCβ = 0.77).Women ▪ Positive (p ≤ 0.02): SF-time (BMIβ = 0.88, WCβ = 2.09) and SF-energy% (BMIβ = 0.4, WCβ = 0.69). |
| Murakami 2016 [11]. | ▪ American. ▪ n = 19,427 (9826 women and 9601 men). ▪ ≥20 years. | Eating frequency: all eating occasions (kcal >50). Meal and snack frequencies: ▪ Self-reported (meals: breakfast, brunch, lunch, and dinner; others: snacks) ▪ Based on time (meals: 6–9 h, 12–14 h and 17–20 h; snack: other). ▪ Based on energy percentage contribution (meal: ≥ 15%, snack: < 15% of total energy). | DQ (HEI-2010). | Age group, race and ethnicity, years of education, family poverty income ratio, smoking, any recreational PA, weight status, dietary reporting status, and survey cycle. | Every additional eating occasions was positively associated to DQ in all measures (p < 0.01): Men: ▪ EF (β = 1.77). ▪ MF-%energy (β = 4.09), MF-self-report (β = 4.22) and MF-clock time (β = 2.14). ▪ SF-%energy (β = 1.52), SF-self-report (β = 1.25) and SF- clock time (β = 1.28). Women: ▪ EF (β = 2.22). ▪ MF-%energy (β = 3.62), MF-self-report (β = 5.35) and MF-clock time (β = 2.70). ▪ SF-%energy (β = 1.97), SF-self-report (β = 1.52) and SF- clock time (β = 1.57). |
| Leech 2016 [57]. | ▪ Australian. ▪ n = 4323 (2270 women and 2053 men). ▪ Age: ≥19 years. | Eating frequency: ▪ Eating occasion: food/beverages with ≥ 210 kJ (1–3, 4–5 or ≥6). ▪ Meals: breakfast, brunch, lunch, dinner, or supper (1–2 or ≥ 3). ▪ Snacks: 0–1, 2–3 or ≥ 4. | DQ (DGI-2013). | Age, education, income, country of birth, PA, total sedentary time, smoking, alcohol, currently dieting, eating more or less than usual, and ratio of reported total energy intake. | ▪ Eating occasion: men (β = 1.38 [95% CI: 0.71, 2.05]) and women (β = 1.12 [95% CI: 0.34, 1.90]). ▪ MF: men (β = 5.60 [95% CI: 3.89, 7.34]) and for women (β = 4.11 [95% CI: 2.23, 5.93]). |
| House 2018 [63]. | ▪ American (Hispanic). ▪ n = 92 (47 women and 45 men). ▪ Age: 18–19 years. | Eating frequency: infrequent (<3 meals/day) or frequent (>4 meals/day). | BMI, BMI z-score, BW, WC. | Age, sex and percent time spent in moderate to vigorous physical activity. | Infrequent eaters vs. frequent eaters: ▪ Total population: > BMI (p = 0.02) and BMI z-score (p = 0.03). In stratified analyses by sex: ▪ Women: > BMI (p = 0.04). Other variables: NA. |
| Kim 2018 [23]. | ▪ South Korean. ▪ n = 6951 (3487 women and 3464 men). ▪ Age: 19–93 years. | ▪ Eating frequency: all eating occasions (<3, 4 or ≥5). ▪ Meal frequency: 1, 2 or 3. ▪ Snack frequency: 0, 1, 2 or 3. | BMI, WC, DQ (MAR). | Age group, sex, smoking, alcohol drinking frequency, PA, resistance PA frequency, household income, education level, stress level, EI, depressed mood, meal frequency, and snack frequency. | In ≥ 5 EF vs. < 3 EF: ▪ <BMI (p < 0.01) and WC (p < 0.01). ▪ <BMI (p < 0.01) and WC (p < 0.01) in highest DQ. 3 MF vs. 2 MF:▪ <BMI (p < 0.04) and WC (p < 0.01). ▪ <WC (p < 0.01) in highest DQ. 0 SF vs. 2 SF: ▪ <BMI (p < 0.01) and WC (p < 0.01). ▪ <BMI (p < 0.01) in highest DQ. |
| Alamri 2020 [59]. | ▪ Saudi. ▪ n = 435 women. ▪ Age: 20–25 years. | Snack frequency: Other eating occasions besides breakfast, lunch, or dinner. | WC ≤ 88 cm, WC > 88 cm, BMI 18.5 to < 25 and BMI ≥ 25. | None. | ▪ > SF in the evening: > frequent in WC> 88 cm (p = 0.04) and BMI≥ 25 (p = 0.04). ▪ Other variables: NA. |
| Longitudinal Studies | |||||
|---|---|---|---|---|---|
| Children | |||||
| Author and Year | Population | Exposure (s) | Outcome (s) | Adjusted Variables | Results |
| Okubo 2017 [28]. | ▪ Osaka Maternal and Child Health Study. ▪ Japanese. ▪ n = 492 mother-child pairs. ▪ Age: 30–42 m. ▪ 1 year follow-up. | Eating rate (self-reported). | BMI. | Child’s sex and age (at fourth survey), maternal age and BMI at enrollment, education level, family income, pregnancy smoking status, maternal working status at 30 months postpartum, birth order, birth weight, duration of breast-feeding, time spent watching TV at 30 months of age, protein intake, fat intake, and dietary fiber at 30 months of age. | Fast eating rate vs. slow eating rate at 30 m.: ▪ BMI at 42 m. (β = 0.67 [95% CI: 0.24, 1.10]). |
| Adults | |||||
| Author and Year | Population | Exposure (s) | Outcome (s) | Adjusted Variables | Results |
| Tanihara 2011 [9]. | ▪ Japanese. ▪ n = 529 men. ▪ Age: 20–59 years. ▪ 8 year follow-up. | Eating speed (self-reported). | OW. | Age, drinking, smoking, regular exercise. | ▪ Fast vs. medium or slow eating speed: OW (OR = 1.80 [95% CI: 1.25, 2.59]). |
| Yamane 2014 [2]. | ▪ Japanese. ▪ n = 1314 (638 women and 676 men). ▪ Pre-universities. ▪ 3 year follow-up. | Eating quickly. | OW. | Gender, eating quickly, frequently consuming fatty foods. | ▪ Eating quickly vs. no eating quickly: OW (OR = 4.40 [95% CI: 2.22, 8.75]). |
| Zhu 2015 [5]. | ▪ Japanese ▪ n = 8941 (5517 women and 3424 men). ▪ Age: 40–75 years. ▪ 3 year follow-up. | Eating speed (self-reported). | MetS, WC, HDL-c, TG, BP and FPG. | Age and sex, drinking alcohol, dietary behavior, physical activity, sleeping, and Medication history. | ▪ Fast eating speed vs. not fast eating speed: HR for MetS (HR = 1.30 [95% CI: 1.05, 1.60]), WC (HR = 1.35 [95% CI: 1.10, 1.66]) and lower HDL-c (HR = 1.37 [95% CI: 1.12, 1.67]). ▪ Other variables: NA. |
| Leong 2016 [56]. | ▪ New Zealander. ▪ n = 1014 women. ▪ Age: 40–50 years. ▪ 3 year follow-up. | Eating speed (self-reported). | OW. | Baseline BMI, age, socioeconomic status, thyroid condition, ethnicity, change in physical activity, change in smoking status and change in menopause status. | ▪ No significant associations for OW. |
| Longitudinal Studies | |||||
|---|---|---|---|---|---|
| Children | |||||
| Author and Year | Population | Exposure (s) | Outcome (s) | Adjusted Variables | Results |
| Franko 2008 [31]. | ▪ American (black and white race). ▪ n = 2375 girls. ▪ Age: 9–10 years. ▪ 10 year follow-up. | Meal frequency: number of days consumed ≥ 3 meals (breakfast, snack, lunch or other). | BMI-for-age z-score and OW. | Visit, study site, parental education, socioeconomic status, race, energy intake and indicators of physical activity. | ▪ MF: BMI-for-age z score (β = −0.047, p < 0.01). |
| Ritchie 2012 [30]. | ▪ NGHS study. ▪ American (black and white race). ▪ n = 2372 girls. ▪ Age: 9–10 years. 10 year follow-up. | Eating frequency: ▪ Eating episode: 1–3, 3.1–4, 4.1–6 or >6 per day. ▪ Meal: 1–2.5 or > 2.5 meals per day. ▪ Snack: 0–1, 1.1–2, 2.1–3 or > 3 per day. | BMI and WC. | BMI or WC, race, parental education, physical activity, Television/video viewing, and total energy intake, dieting for weight loss. | ▪ >6 total eating episodes/day: <BMI (p = 0.01) and WC (p = 0.04). ▪ >2.5 MF: >BMI (p = 0.04). |
| Taylor 2017 [4]. | ▪ New Zealander. ▪ n = 371 (175 girls and 196 boys). ▪ Age: 1–3.5 years. ▪ 3.5 year follow-up | Eating frequency (all eating occasions). | BMI z-score. | POI intervention group, household factors, maternal parity/education, infant sex, birth weight, pre-pregnancy BMI, pregnancy smoking, and exclusive breastfeeding. | No significant associations. |
| Adults | |||||
| Author and Year | Population | Exposure (s) | Outcome (s) | Adjusted Variables | Results |
| Kahleova 2017 [67]. | ▪ AHS-2. ▪ North American. ▪ n = 50,660. ▪ Age: ≥ 30 years. ▪ 7 ± 1 year follow-up. | Meal frequency and timing: ▪ Breakfast: from 5–11 h. ▪ Lunch: from 12–16 h. ▪ Dinner: from 17–23 h. | BMI. | Age, sex, ethnicity, marital status, education, personal income, dietary pattern, exercise, sleep, television watching, energy intake, and high blood pressure medicine. | ▪ ≥6 MF vs. 3 MF: BMI (β = 0.04 [95% CI: 0.02, 0.06]). |
| Larsen 2019 [74]. | ▪ MONICA study. ▪ Danish. ▪ n = 2124 (1044 women and 1080 men). ▪ Middle-aged. ▪ 6 year follow-up. | Total eating, meal and snack frequency (self-reported). | BMI and WC. | Baseline measure of outcome, smoking, alcohol, PA, education, age, gender, menopausal status for women, and height (in WC analysis only). | Baseline MF: ▪ 6-y. change: BMI (β = −0.14 [95% CI: −0.27, 0.00]) and WC (β = −0.49 [95% CI: −0.99, 0.00]). |
| Interventional Trials | ||||||
|---|---|---|---|---|---|---|
| Children | ||||||
| Author and Year | Study Design | Population | Intervention Description | Comparing Group | Adjusted Variables | Results |
| Faith 2019 [12]. | Parallel: 8 weeks. | ▪ American. ▪ n = 24 girls and boys. ▪ Age: 4–8 years. | RePace: ▪ 5 interactive sessions of 1 h for parents and children, over 8 weeks. ▪ Small timers were given at the clinic, programmed to vibrate at 30-s intervals during the mealtimes and snacks. ▪ Chat Jar during mealtimes to encourage a slower eating. DUC (at the end of the 8 weeks): ▪ 30 min of informative educational sessions (healthy eating recommendations, importance of family meals, slowly eating speed). | RePace or DUC. | Child age, sex and baseline BMI and BMI z-score. | ▪ Intervention: BMI (β = −0.57, p = 0.02) and BMI z-score (β = −0.23, p = 0.03). |
| Interventional Trials | ||||||
|---|---|---|---|---|---|---|
| Adults | ||||||
| Author and Year | Study Design | Population | Intervention Description | Comparing Group | Adjusted Variables | Results |
| Carlson 2007 [70]. | Crossover: 18 weeks. | ▪ American. ▪ n = 15 (10 women and 5 men). ▪ Age: 40–50 years. | ▪ Controlled diet: 3 meals/day: breakfast, lunch and dinner or 1 meal/day: during 4 Hours in the early evening (16–20 h). ▪ 11-weeks off-diet. | 3 MF or 1 MF/day. | Period-specific baseline values. | ▪ 3 MF vs. 1 MF: < FPG (p < 0.01). |
| Stote 2007 [72]. | Crossover: two 8 weeks periods. | ▪ American. ▪ n = 15 (10 women and 5 men). ▪ Age: 40–50 years. | 1 meal/day: during a 4 h period in the early evening. | 3 MF/day (breakfast, lunch and dinner). | First observation within a period. | 3 MF vs. 1 MF: ▪ < SBP (p = 0.02) and DBP (p = 0.04). ▪ > BW (p = 0.01). 3 MF vs. 1 MF/day: ▪ < HLD-c (p = 0.01). ▪ FPG and TG: NA. |
| Kanaley 2014 [68]. | Crossover: 3 days with a 12 h period each one. | ▪ American. ▪ n = 14 (11 women and 3 men). ▪ Age: 20–59 years. | ▪ Low frequency (3MF), high frequency (6MF) or high frequency + high protein (6MFHP). ▪ Wash out: 1 month between each study day. | Low frequency, high frequency or high frequency + protein regimen. | None. | ▪ 6 MFHP vs. 3 MF or 6 MF: < FPG tAUC (p < 0.01). ▪ 3 MF vs. 6 MF: NA for FPG. |
| Alencar 2015 [69]. | Crossover: 6-weeks. | ▪ American. ▪ n = 11 women. ▪ Age: 35–60 years. | 2 MF pattern (every 5–6 h), 6 MF pattern: (every 2–3 h) or washout phase (4 MF). | 2 MF pattern, 6 MF pattern or washout phase. | None. | ▪ 2 MF vs. 6 MF: > HDL-c (p < 0.05). |
| Megson 2017 [71]. | Parallel: 3 months. | ▪ American. ▪ n = 211 (176 women and 35 men). ▪ Age: 18–70 years. | ▪ Group SURI program: website + a pedometer + periodic newsletters; community exercise programs + prizes and recognition. ▪ Group SURI + IBWL: SURI program + internet Behavioral weight loss program. ▪ Group SURI + IBWL + Group: included Weekly group meetings. | SURI program, SURI + IBWL and SURI + IBWL + Group. | Treatment arm. | ▪ EF: NA for BW loss. |
| Yildiran 2019 [73]. | Parallel: 3 months. | ▪ Turkish. ▪ n = 47 women. ▪ Age: 20–49 years. | 3 meals/day (3 main meals) or 6 meals/day (3 main meals + 3 snacks). | 3 MF or 6 MF/day. | None. | ▪ Not significant effects in BMI, WC, BW, FPG, TG, HDL-c between groups. |
Publisher’s Note: MDPI stays neutral with regard to jurisdictional claims in published maps and institutional affiliations. |
© 2021 by the authors. Licensee MDPI, Basel, Switzerland. This article is an open access article distributed under the terms and conditions of the Creative Commons Attribution (CC BY) license (https://creativecommons.org/licenses/by/4.0/).
Share and Cite
Garcidueñas-Fimbres, T.E.; Paz-Graniel, I.; Nishi, S.K.; Salas-Salvadó, J.; Babio, N. Eating Speed, Eating Frequency, and Their Relationships with Diet Quality, Adiposity, and Metabolic Syndrome, or Its Components. Nutrients 2021, 13, 1687. https://doi.org/10.3390/nu13051687
Garcidueñas-Fimbres TE, Paz-Graniel I, Nishi SK, Salas-Salvadó J, Babio N. Eating Speed, Eating Frequency, and Their Relationships with Diet Quality, Adiposity, and Metabolic Syndrome, or Its Components. Nutrients. 2021; 13(5):1687. https://doi.org/10.3390/nu13051687
Chicago/Turabian StyleGarcidueñas-Fimbres, Tany E., Indira Paz-Graniel, Stephanie K. Nishi, Jordi Salas-Salvadó, and Nancy Babio. 2021. "Eating Speed, Eating Frequency, and Their Relationships with Diet Quality, Adiposity, and Metabolic Syndrome, or Its Components" Nutrients 13, no. 5: 1687. https://doi.org/10.3390/nu13051687