Stunting and Anemia in Children from Urban Poor Environments in 28 Low and Middle-income Countries: A Meta-analysis of Demographic and Health Survey Data


The DHS Program, ICF, Rockville, MD 20850, USA
*
Author to whom correspondence should be addressed.
Nutrients 2020, 12(11), 3539; https://doi.org/10.3390/nu12113539
Submission received: 15 October 2020
/
Revised: 11 November 2020
/
Accepted: 14 November 2020
/
Published: 18 November 2020
(This article belongs to the Section Nutrition and Public Health)
Abstract
:Child malnutrition remains a global concern with implications not only for children’s health and cognitive function, but also for countries’ economic growth. Recent reports suggest that global nutrition targets will not be met by 2025. Large gaps are evident between and within countries. One of the largest disparities in child malnutrition within counties is between urban and rural children. Large disparities also exist in urban areas that have higher rates of child malnutrition in the urban poor areas or slums. This paper examines stunting and anemia related to an urban poverty measure in children under age 5 in 28 low and middle-income countries with Demographic and Health Survey data. We used the United Nations Human Settlements Programme (UN-HABITAT) definition to define urban poor areas as a proxy for slums. The results show that in several countries, children had a higher risk of stunting and anemia in urban poor areas compared to children in urban non-poor areas. In some countries, this risk was similar to the risk between the rural and urban non-poor. Tests of heterogeneity showed that these results were not homogeneous across countries. These results help to identify areas of greater disadvantage and the required interventions for stunting and anemia.
1. Introduction
Child stunting and malnutrition remain a global concern. Globally, among children under age five, at least one in three are not growing as they should because of malnutrition that includes stunting. At least one in two children under age five also suffer from deficiencies in vitamins and essential nutrients [1]. Despite declines in stunting among children globally, progress has been too slow to achieve the 2025 global nutrition target of reducing stunting by 40% to a target of 100 million; it is projected that 130 million children will be stunted by 2025 [2]. There are an estimated 149 million (or almost a quarter) of children under age five who are stunted [2]. There have also been global reductions in anemia prevalence over the last several decades; although, the total cases of anemia increased from 1.42 billion in 1990 to 1.74 billion in 2019 [3]. The greatest burden of anemia is found in western and Central Sub-Saharan Africa and South Asia [3,4], with the highest combined prevalence of anemia (39.7%) found in children under age five [3]. Malnutrition in children not only has a direct effect on their growth, but also on their cognitive, motor, and language development, mental health, susceptibility to diseases, and other long-term development such as lower levels of learning capacity that can continue into adulthood [2,5,6,7,8]. Malnutrition also influences the economic development and growth of countries and contributes to the intergenerational transmission of poverty [2].
Although there are disproportionately higher rates of child malnutrition in parts of Asia and Africa, within-country disparities can also be substantial in a growing population with rapid urbanization. As cities across the world continue to grow, the increase in urbanization can be coupled with an increase in urban poverty [9,10]. The pace at which the world’s population grows is notable especially in low and middle-income countries (LMICs). More than two-thirds (68%) of the world’s population is expected to live in urban areas by 2050 [11]. The process of urbanization, especially in LMICs, can lead to negative health outcomes overall and specifically for children. In particular, large disparities in child malnutrition exist between urban and rural areas, geographical regions, and levels of household wealth [1,2,12,13,14,15,16,17]. In one study that analyzed household survey data from 47 countries, rural/urban differences in stunting decreased but persisted and remained significant after controlling for household wealth [18]. The same study found that urban poor can be just as disadvantaged as the rural poor in terms of stunting and under-five mortality [18]. Other studies that examined urban poor areas or slums found higher rates of child malnutrition and mortality in these areas compared to the urban non-poor areas or non-slums [19,20,21].
In addition to the burden of undernutrition, countries increasingly face the double burden of undernutrition and overnutrition (i.e., overweight and obesity) [22,23]. This double burden of malnutrition can be found at the individual, household, and population levels [23]. A child can be overweight and also have poor nutrition. In addition, children who are stunted in childhood have a higher risk of becoming overweight in adulthood when they consume energy-dense diets and live a sedentary lifestyle [23,24]. The LMICs also face this double burden at the population level where there are high rates of undernutrition and overweight or obesity [23,25,26,27]. There are several causes to this phenomenon including the global nutrition transition caused by shifts in the agricultural system and the growth of nutrient-poor foods that are high in sugar, unhealthy fats, and/or are highly processed [26,28]. Such changes have especially affected urban areas and particularly the urban poor because healthier, more nutritious food is costly and difficult to access [26,28,29]. Physical activity has also declined, especially in urban areas, which further aggravates the problem. Countries need an integrated intervention approach that addresses undernutrition (wasting, stunting, and micronutrient deficiency) and the increasing burden of overweight, obesity, and diet-related non-communicable diseases [23,26,29].
It is important to study within-country disparities in child malnutrition to identify areas where interventions and programs should be targeted, and to go beyond the urban–rural dichotomy. In this paper, we focus on the urban poor areas as a proxy for slum areas and if children in these areas experience higher rates of stunting and anemia compared to children in the urban non-poor areas. We also explore if differences in child malnutrition between the urban poor and urban non-poor are similar to or different from differences between the rural and urban non-poor areas. Given the rapid increases in urbanization and urban poverty, it is important to continually quantify and examine disparities in health outcomes within urban areas.
2. Data and Methods
2.1. Data
Data from countries that had a Demographic and Health Survey (DHS) from 2014 to 2018 were included in the analysis. Countries with a population less than 10 million were excluded, which left 30 surveys that were considered for the analysis. These surveys use a randomized, multi-stage sample design that produces estimates that are representative of the country at the time of the survey. The descriptive analysis revealed that Jordan and Zimbabwe did not have any children in urban poor clusters according to the definition used in this paper. Therefore, these two countries appear in the results for the description of the urban poor cluster variable in Figure 1 only. Table 1 shows the countries in the analysis and their sample sizes.
2.2. Variables
The outcomes of interest are stunting, and moderate to severe anemia in children. Stunting is defined as the proportion of de facto children under age five who have a height-for-age z-score below the median of the WHO 2007 reference population by more than two standard deviations. Moderate to severe anemia in children is defined as the proportion of de facto children age 6–59 months with a hemoglobin level less than 10 g per deciliter. Hemoglobin levels are adjusted for altitude.
The main variable of interest is the urban poverty cluster variable. To construct this variable, we used the UN-HABITAT definition of a slum household, which is a household that lacks one or more of the following: durable housing of permanent nature, sufficient living space for not more than three persons per room, access to safe water, access to adequate sanitation, and security of tenure that prevents forced evictions [31,32]. The DHS data includes information on all items except the security of tenure. Therefore, we defined an urban poor household as households in an urban cluster that are lacking two or more of the following: durable material for the floor, wall, and roof; access to improved water; access to improved sanitation; and fewer than three persons per sleeping room. To define the variable at the cluster level, an urban poor cluster was classified as a cluster with more than half of the households classified as urban poor households, as recommended by United Nations Human Settlements Programme [9]. Clusters that contained fewer than half urban poor households were defined as urban non-poor areas. This aggregation to the cluster level was used to define areas that may be considered slum-like (the urban poor). Therefore, the urban poverty cluster variable has three categories: rural, urban poor, and urban non-poor.
The control variables used in the regressions include the child’s sex, age in months categorized in 6-month intervals, the mother’s education level, and the region at the administrative level 1 for the country. The wealth index could not be included as a control because it was highly correlated with the urban poverty cluster variable.
2.3. Methods
The analysis includes descriptive and logistic regression analysis. A crosstabulation of the urban poverty cluster variable and each outcome was performed along with Chi-square tests of association. In addition, adjusted logistic regressions were fit for each outcome and the variable of interest along with the controls. The results were summarized with forest plots for the main variable of interest that also produce a pooled odds ratio using meta-analysis and the "metan" command in Stata [33]. The metan command also performs a heterogeneity test that examines the variability between the surveys. This test produces an I-squared index and p-value. An I-squared value of 25–50% is considered a low level of heterogeneity, 50–75% is moderate, and greater than 75% is high [34]. A significant p-value would indicate that we reject the null hypothesis that the surveys are homogeneous for the result and that the surveys are heterogeneous. For the meta-analysis, the surveys were assigned equal weight so that large surveys such as India did not predominate the results.
All analyses accounted for the sampling design and sampling weights and were performed with Stata 16 software. The estimates are reported with 95% confidence intervals (CI).
3. Results
Figure 1 shows the percentage distribution of the population of urban non-poor, urban poor, and rural clusters for the countries in the analysis. Several countries had a highly rural population with more than three-quarters of the population in Burundi, Cambodia, Chad, Ethiopia, Malawi, Mali, Rwanda, and Uganda living in rural clusters. The highest proportion of people who live in urban poor clusters were found in Kenya and Benin (both 17%), followed by the Democratic Republic of the Congo (DRC) and Chad (both 16%). Jordan was highly urban with no urban poor clusters. In contrast, Zimbabwe was highly rural with no urban poor clusters. Therefore, the remaining analyses do not include Jordan and Zimbabwe. Nineteen of the 30 countries shown in Figure 1 have fewer than 5% of the population living in urban poor clusters.
Figure 1.
Distribution of the urban poverty cluster variables for the countries in the analysis.
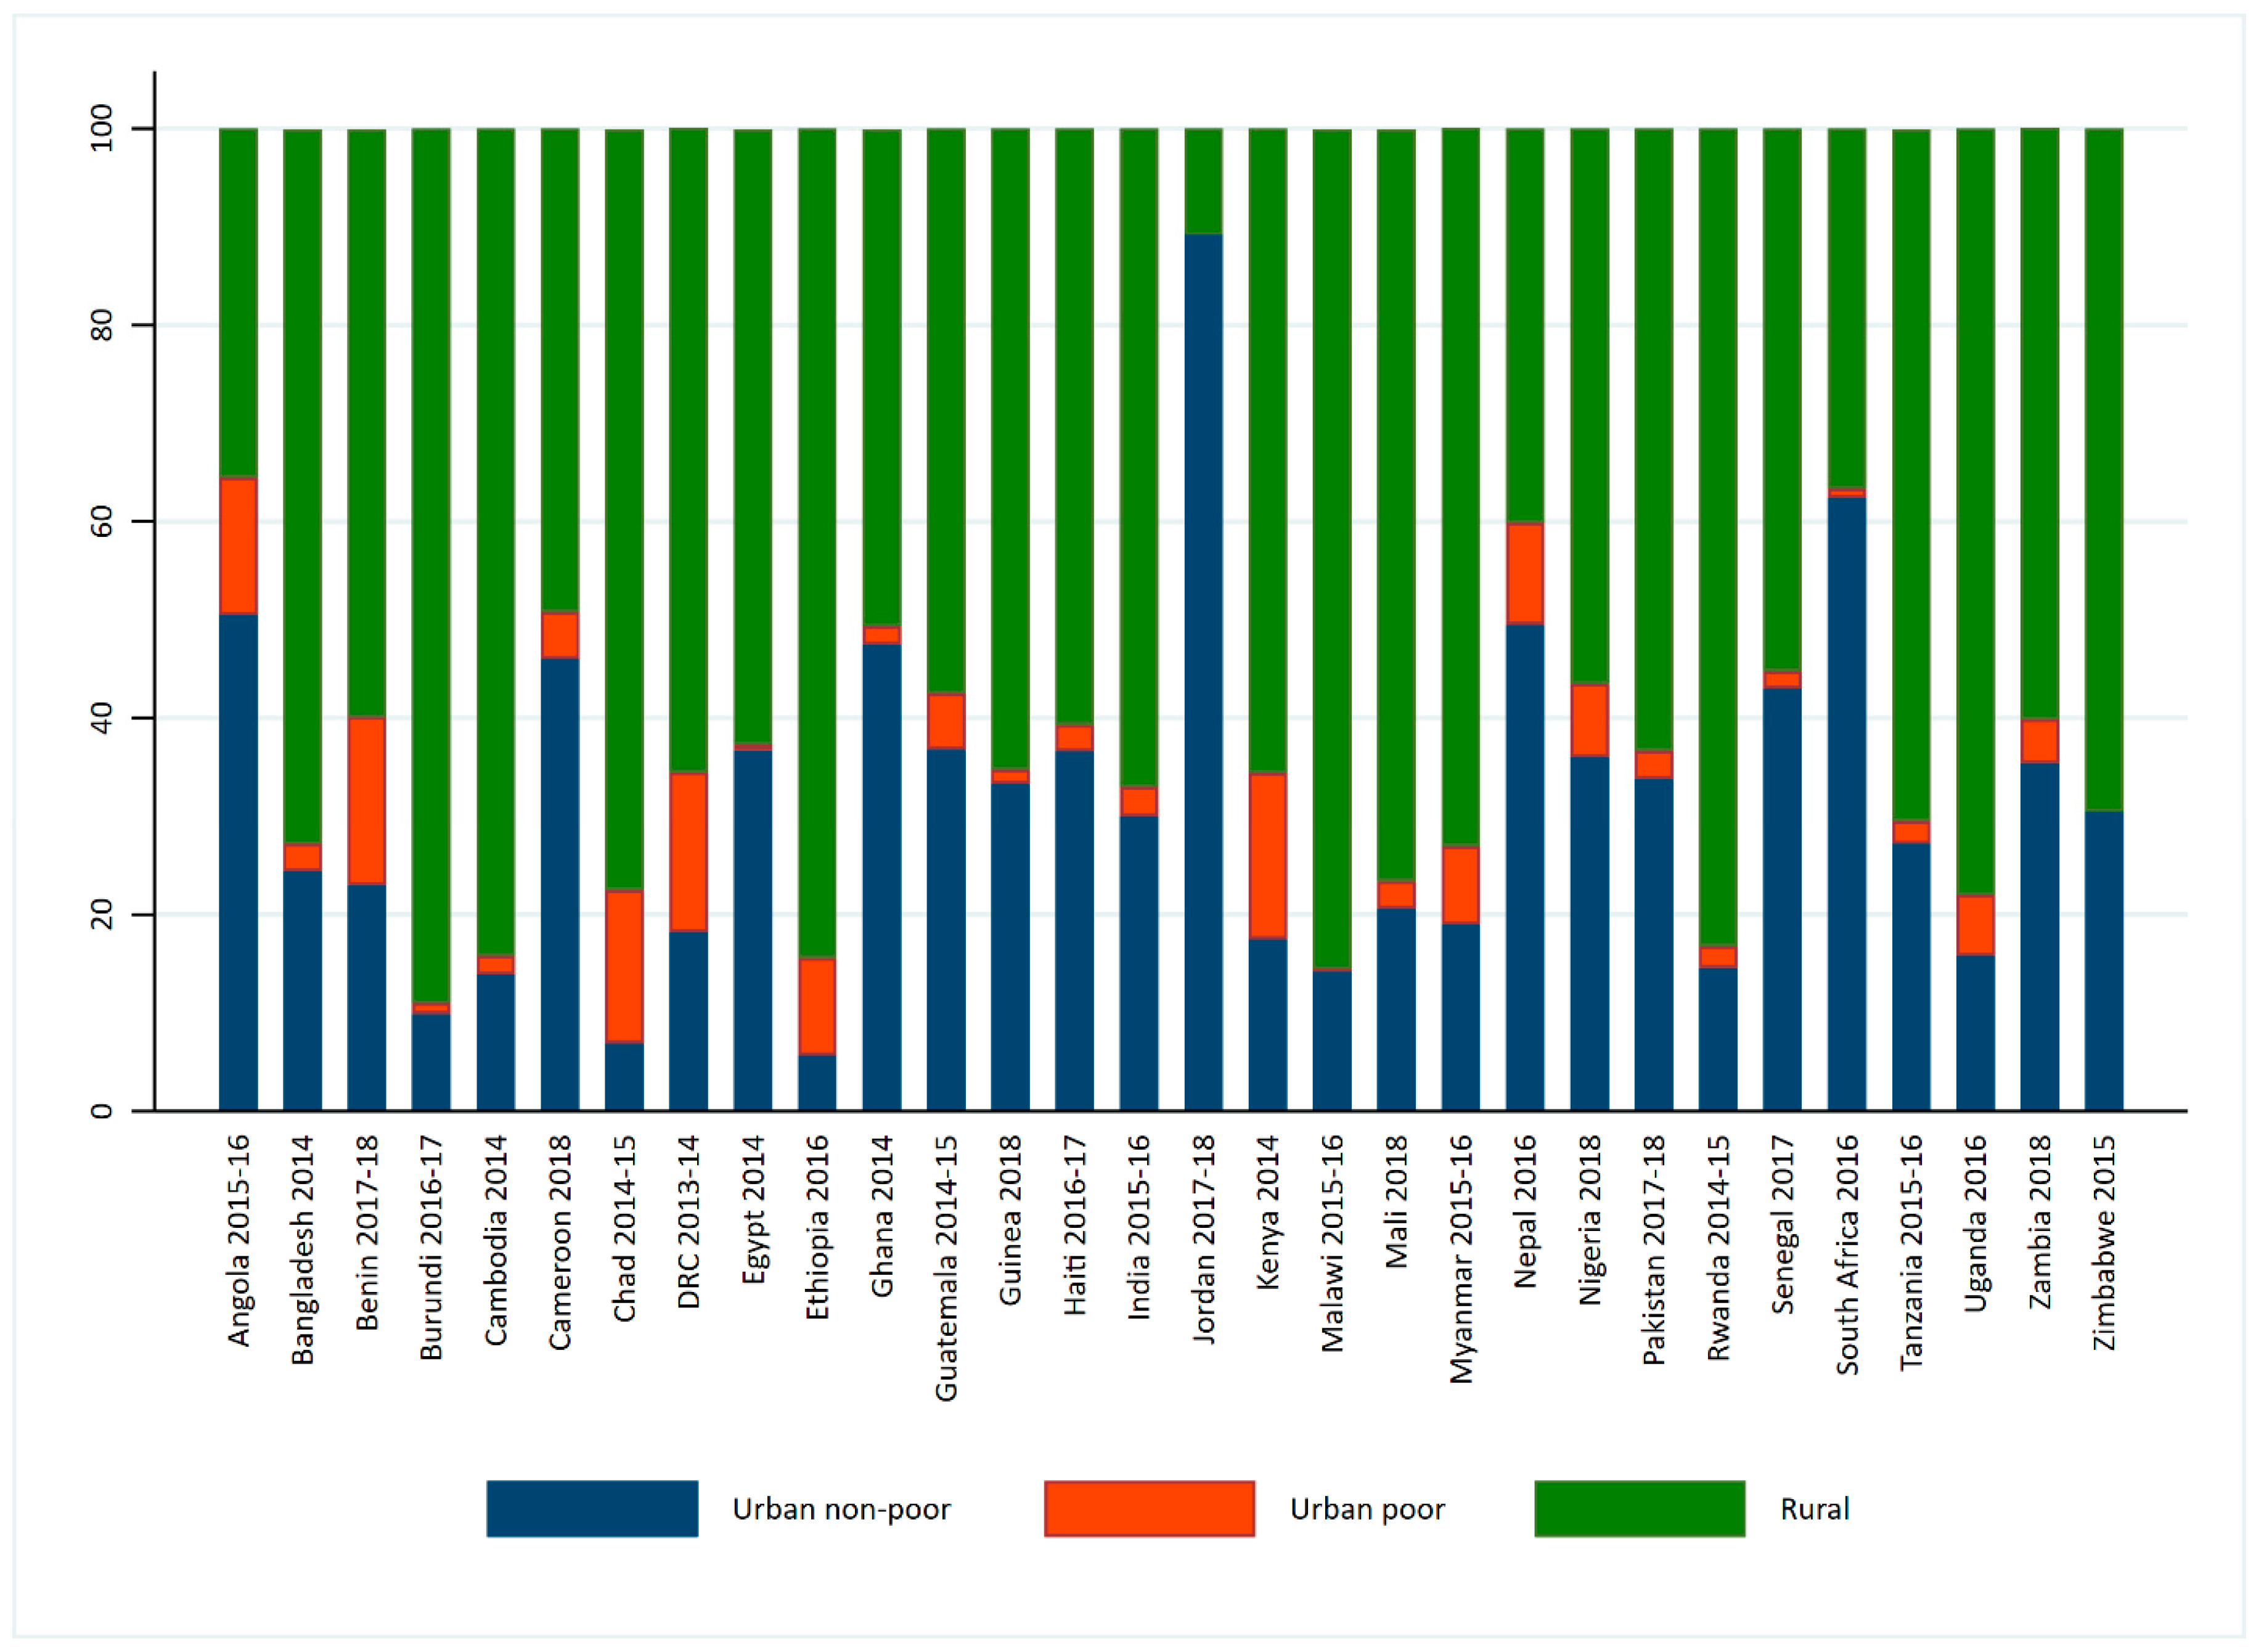
Table 2 shows the percentage of children under age five who are stunted. More than one-third of children under age five were stunted in 15 countries during the time of the survey: Angola, Bangladesh, Burundi, Chad, DRC, Ethiopia, Guatemala, India, Malawi, Nepal, Nigeria, Pakistan, Rwanda, Tanzania, and Zambia. Generally, the lowest percentage of stunting was found in urban non-poor clusters and the highest in rural clusters. However, in Bangladesh, Guatemala, Haiti, India, Nepal, Pakistan, Senegal, Tanzania, and Uganda, stunting was highest in urban poor clusters with the highest found in Pakistan (56%), Guatemala (55%), Bangladesh (48%), and Burundi (45%). Differences in stunting across the urban poverty cluster distribution was significant except for Egypt and South Africa.
Since four surveys in Table 3 did not perform anemia testing in children, the analysis with the anemia outcome was performed on 24 surveys. The highest level of moderate to severe anemia in children age 6–59 months was found in Mali (57%), followed by Guinea and Benin, both at 43%. Over one-third of children from 12 of the 24 countries had moderate to severe anemia. In general, anemia was lowest in children who live in urban non-poor clusters and higher in the rural areas. However, in several surveys, there was either no significant difference in anemia between the urban non-poor and rural clusters or anemia was the highest in the urban poor clusters. More than 40% of children age 6–59 months who live in urban poor clusters in Benin, Ghana, Haiti, Mali, Nigeria, and Senegal had moderate to severe anemia. In Angola, Myanmar, South Africa, Uganda, and Zambia, there were no significant differences in moderate to severe anemia across the urban poverty clusters.
Figure 2 and Figure 3 summarize the regression results for the stunting and anemia outcomes and the urban poverty cluster variable. These estimates can also be found in Appendix A and Appensix B. The figures show the adjusted odds ratios for the rural and urban poor categories compared to the urban non-poor reference category. In Figure 2, there are more significant findings for rural compared to urban non-poor than urban poor compared to urban non-poor. With Egypt as an exception, children in rural clusters are more likely to be stunted than children in the urban non-poor clusters. The pooled odds ratio from the meta-analysis was 1.5 (95% CI 1.5, 1.6). Overall, living in a rural area increases the risk of stunting in children by 50% compared to living in an urban non-poor cluster. However, the I-squared results indicate that the surveys were heterogeneous. Several countries (16 from the 28) exhibited significantly higher odds of stunting in children who live in urban poor clusters compared to urban non-poor with the adjusted odds ratios ranging from 1.3 to 2.0, except for Egypt and Ghana. In Ethiopia, Guatemala, Pakistan, and Tanzania, children living in urban poor clusters had almost twice the odds of being stunted compared to children in the urban non-poor clusters. For India, Mali, and Nigeria, the odds ratios for both the rural and urban poor cluster categories were very similar, which indicated that children living in these areas had a similar risk of stunting in comparison to children living in urban non-poor clusters. The pooled odds ratio from the meta-analysis was 1.3 (95% CI 1.2, 1.5), which indicated that children living in urban poor clusters have a 30% increased odds of stunting compared to children living in urban non-poor clusters. The I-squared results also indicate that the surveys were heterogeneous. In Egypt and Ghana, children in urban poor clusters had almost 50% lower odds of being stunting compared to children in the urban non-poor clusters. In Egypt, children in rural clusters also had a 50% lower odds of being stunting compared to children in urban non-poor clusters.
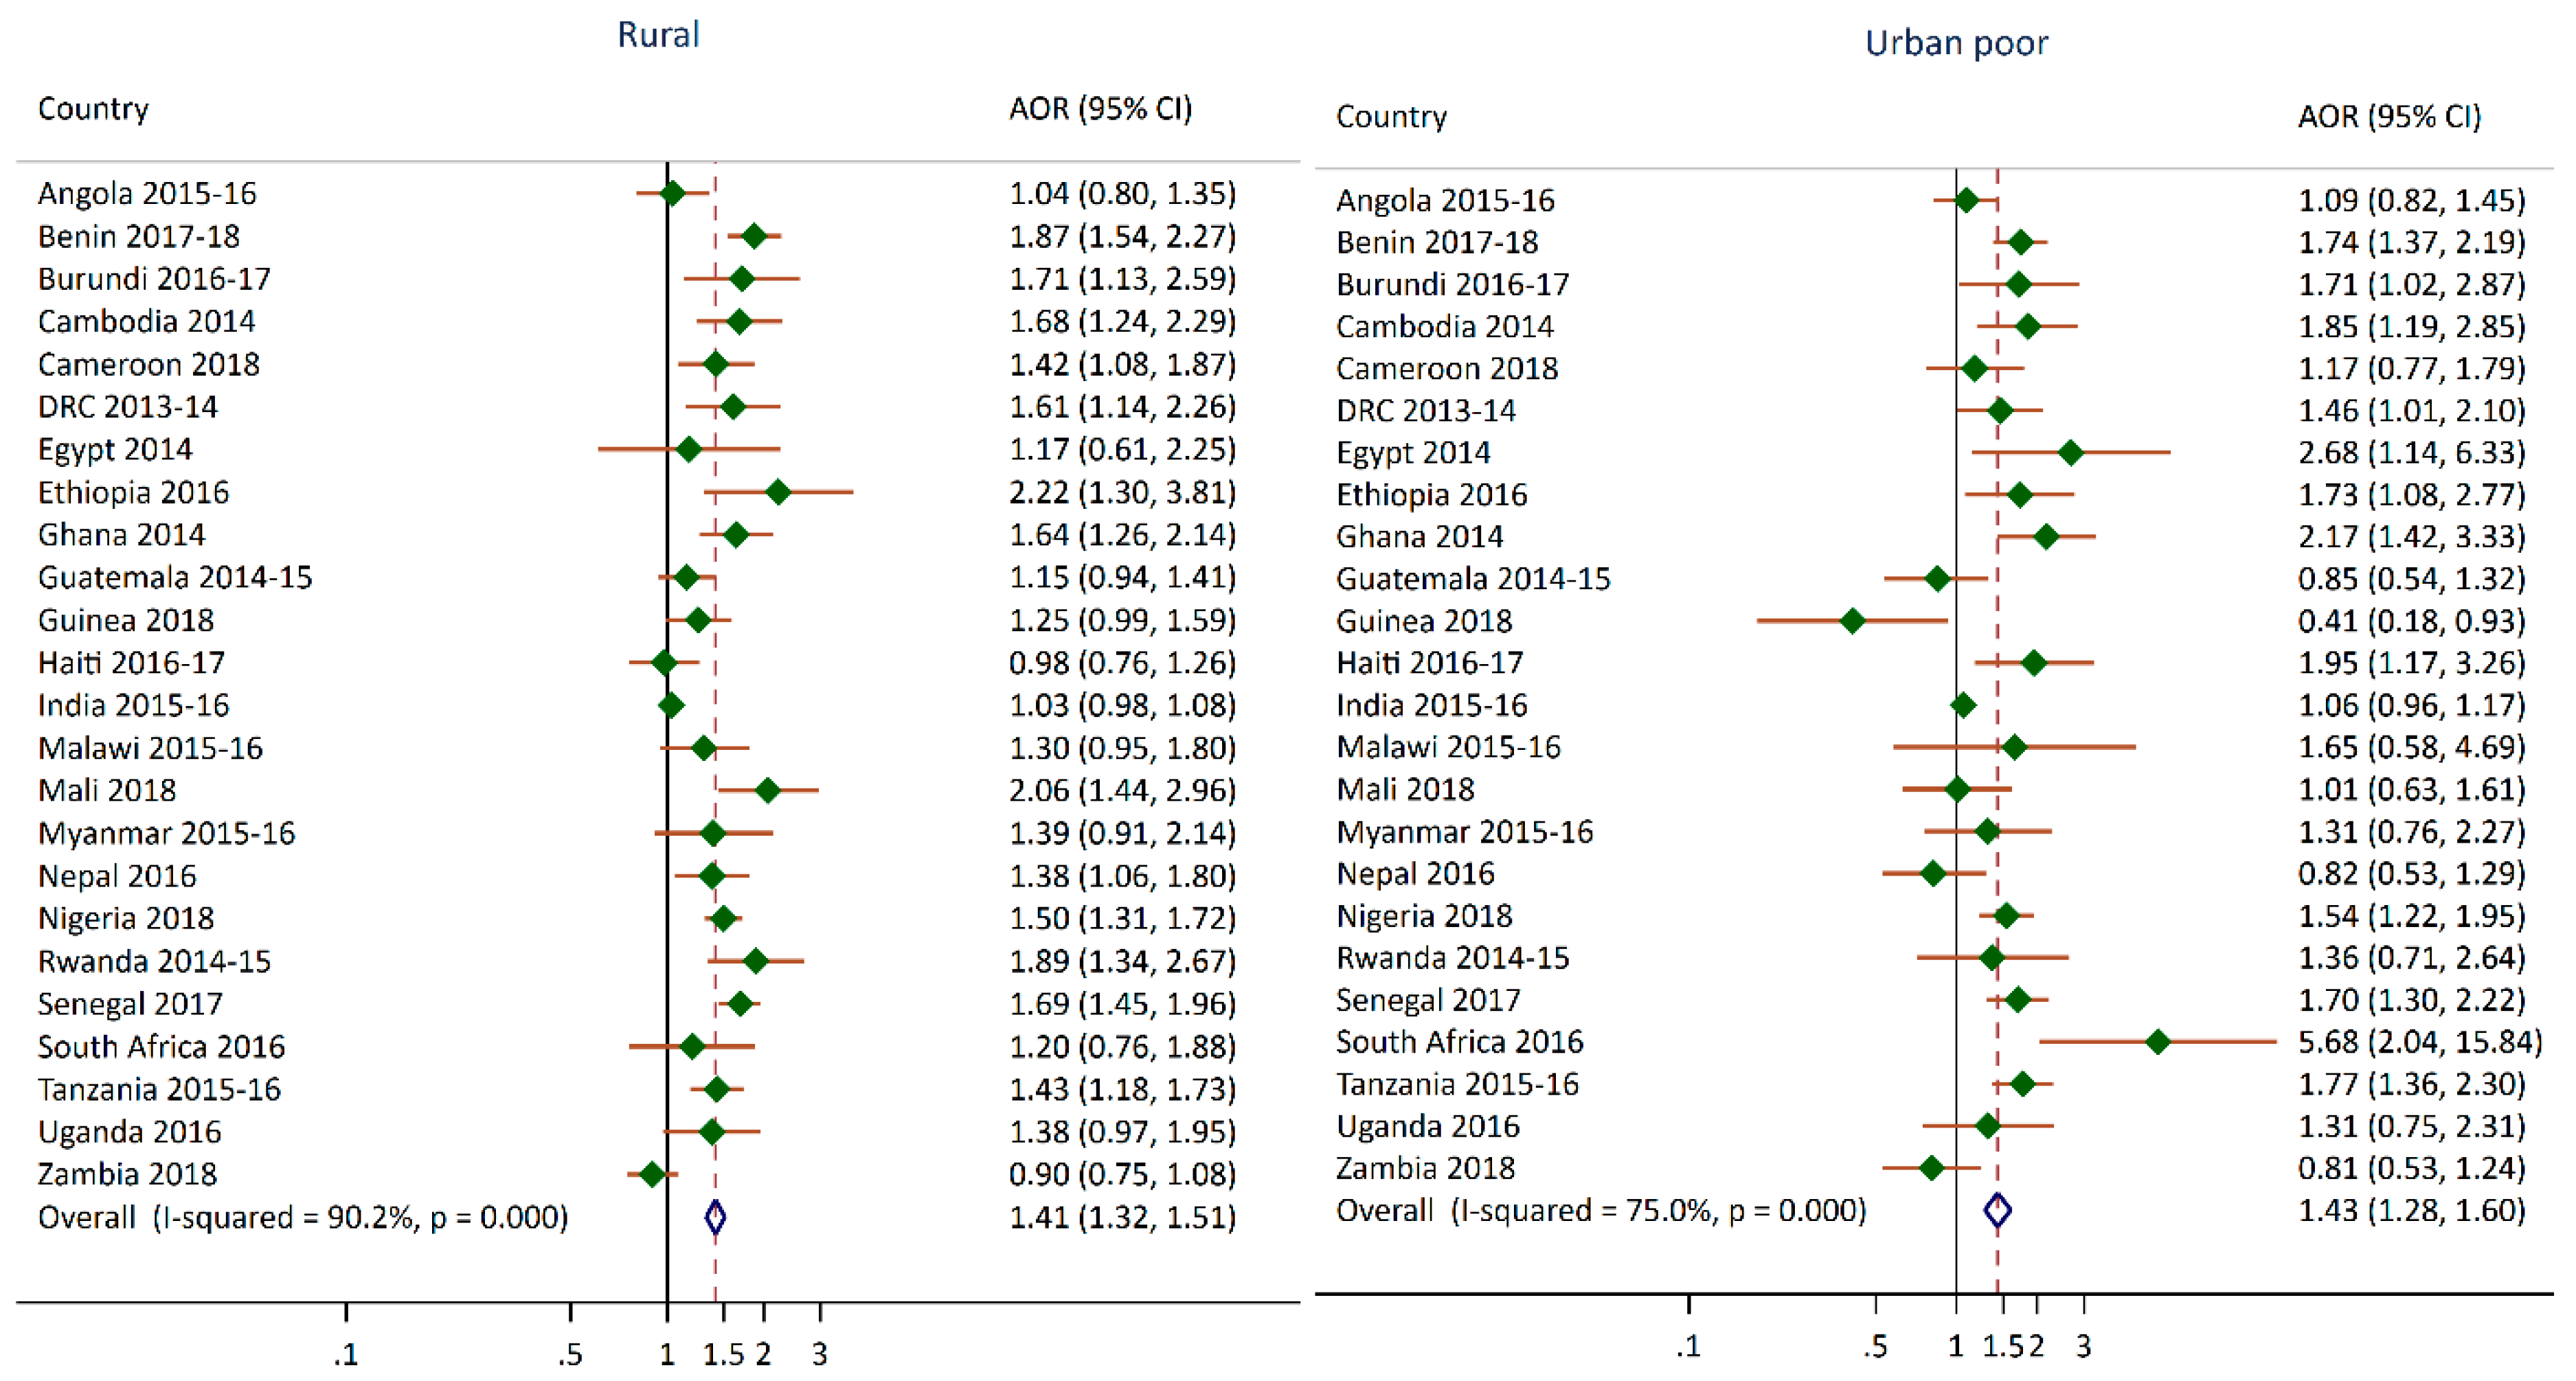
As shown in Figure 3, in 13 of 24 surveys, children living in rural clusters had a higher odds of having moderate to severe anemia compared to children living in urban non-poor clusters. In 12 of 24 surveys, children living in urban poor clusters had greater odds of having moderate to severe anemia compared to children living in urban non-poor clusters. For several countries, the odds of children living in urban poor clusters having anemia compared to children in urban non-poor clusters were almost twice as high. For Burundi, Nigeria, and Senegal, the odds ratios for the rural and urban poor categories were very similar, which indicated that children living in these clusters had a similar risk of anemia when compared to children living in urban non-poor clusters. The pooled odds ratio from the meta-analysis for children living in rural and urban poor clusters compared to urban non-poor clusters were both 1.4. This means that children in rural and urban poor clusters had 40% greater odds of being anemic compared to children who live in the urban non-poor clusters. However, the I-squared index and p-value indicate that this result has moderate to high level of heterogeneity. One unexpected finding was the 60% lower odds of moderate to severe anemia in children living in urban poor clusters compared to the urban non-poor children in Guinea.
4. Discussion
This paper examined the prevalence of stunting and moderate to severe levels of anemia among children under age five in 28 countries. Globally, the world’s population continues to grow, and urbanization continues to increase with 84% of the world’s population living in less developed regions [11]. It is important to examine disparities within countries that account for the nuanced needs of people based on where they live. This study examined stunting and anemia through an urbanicity measure [21,35], referred to here as the urban poverty cluster variable, which goes beyond the traditional urban–rural residence dichotomy used in other studies. With this multi-country DHS meta-analysis that used the urban poverty cluster measure, we were able to focus on areas of greater disadvantage based on these two malnutrition conditions in children that have long-term developmental consequences for the child, as well as consequences for the society as a whole [2,5,6,7,8,22].
In more than half the countries in our analysis, children in urban poor clusters had a greater odds of being stunted than those in urban non-poor clusters. Similarly, in half of the countries in our analysis with available data on anemia, children in urban poor clusters had a higher odds of having moderate to severe anemia than children in urban non-poor clusters. In an 11-country DHS analysis focused on intra-urban differentials, researchers found that child stunting was as much a problem in urban areas as in rural areas when socioeconomic status (SES) was considered within these areas [36]. In this same study, children in Guatemala were seven times more likely to be stunted in urban low SES areas, compared to the urban high SES areas. Similar relationships were found in Pakistan and Tanzania, but at lower magnitudes. These three countries were included in our study, and displayed greater odds of stunting among children in urban poor clusters compared to urban non-poor clusters. Previous work that used data from 73 countries with DHS data found that children in slums have worse health risks compared with children in other urban areas, but lower risks than their rural counterparts [20]. The authors concluded that a large share of these differences can be explained by differences in the mother’s education, wealth, and access to health services. In another study that examined health outcomes in Bangladesh, Kenya, Egypt, and India, children living in urban-slums fared worse in terms of health outcomes, including anemia and stunting, compared to their urban non-slum and rural counterparts [37].
In addition to expected findings, there were also some noteworthy, unexpected findings. We found that children in urban poor clusters had lower odds of being stunted in two countries—Egypt and Ghana—compared to children in urban non-poor clusters. Rural children in Egypt also displayed lower odds of being stunted compared to children in urban non-poor clusters. This aligns with the finding in another study in Egypt where stunting is decreasing among the poorest wealth quintiles but increasing in the richest wealth quintiles [38]. In addition, food programs in Egypt have focused on energy-dense foods, especially among poor and rural populations, given that rising food prices and food insecurity have led to an increase in consumption of calorie-dense foods [38,39]. Egypt and Ghana are also experiencing the double burden of malnutrition [39,40], and in Ghana, concurrent overweight and stunting was found to be significantly higher in children from the fourth wealth quintile compared to children from the poorest wealth quintile [40]. More research is needed to understand the changes in nutrition transition and dietary diversity in these countries that may shed more light on these findings. Another area for further exploration is the high provision of services in these countries’ urban poor areas, that may counter the negative effects of living in these slum-like conditions [21,37,41,42]. For example, one study found that living in a slum neighborhood was associated with poor child outcomes, except when mothers had access to and received health services (such as antenatal care) from trained providers [21]. Further research is required to explore these country-specific findings. The relationship between urbanization and child malnutrition is complex and may be modified by some advantages and disadvantages to living in an urban environment [14,29,43].
Our study has some limitations. The urban–rural variable was used when constructing the urban poverty cluster variable, our main variable of interest. Since the urban–rural dichotomous variable available in the DHS data uses each country’s specific definition of what is urban or rural, this definition is country-specific and not standardized [44]. Incorporating this DHS urban–rural residence variable has the potential to introduce misclassification and error into the urban poverty cluster variable used in our analysis. Another potential limitation of our study is that the UN-HABITAT’s definition of a slum household [31], which we used in the construction of the urban poverty cluster variable, may be more pertinent to lower-income countries than to the middle-income countries. There is potential for missed opportunities in capturing within-country inequalities because some domains in the UN-HABITAT’s definition may not be as relevant. Some countries’ circumstances require other domains to be incorporated for better comparability in the definition of a slum household. Finally, the displacement procedures employed by the DHS mask the real locations of urban clusters by a displacement of up to 2 km. Therefore, it is not possible to know if the urban poor cluster we identify is actually a slum area or another disadvantaged area. Thus, we exercised caution when identifying the urban poor clusters in our analysis as actual slums.
Based on this study, we recommend that researchers, policymakers, and program implementers go beyond the usual urban–rural measurement to examine poor child health outcomes, as recommended by previous researchers [20,36,45]. We suggest considering the inclusion and use of an urban poverty cluster variable based on available data per domain to provide a better understanding of urban and rural environments. Country-specific programming and policies focused on the rural and urban poor clusters are essential. Given the similarities in the odds of stunting and moderate to severe levels of anemia across these two cluster categories in some countries, programming might consider accounting for these findings in complementary ways.
5. Conclusions
This study further informs the relationship between more nuanced areas of urban and rural environments and children’s risk of being stunted and experiencing moderate and severe levels of anemia. In several countries, we found that children living in urban poor areas experienced worse child malnutrition outcomes compared to those in the urban non-poor areas. In some countries in our analysis, this disparity was similar to the disparity between the rural and urban non-poor. Future research with the urban poor cluster variable should consider contextual factors in urban poor clusters and slum areas, such as the availability and use of health services and accessibility to nutrient-rich foods. Intervention programs should consider urban areas that may be further disadvantaged if they are identified as slums or areas with poor access to water, sanitation, and other issues such as overcrowding, which can have direct consequences on children’s health outcomes including malnutrition.
Author Contributions
S.A. conceptualized the study, analyzed the data, and wrote the first draft. C.J. reviewed the draft, wrote the discussion section, and reviewed and contributed to the introduction section. S.A. reviewed and contributed to the discussion. S.A. and C.J. reviewed and edited the draft. All authors have read and agreed to the published version of the manuscript.
Funding
This research received funding from the United States Agency for International Development (USAID) through The DHS Program (#720-OAA-18C-00083). The views expressed are those of the authors and do not necessarily reflect the views of USAID or the United States Government.
Conflicts of Interest
The authors declare no conflict of interest.
Appendix A

Table A1.
Adjusted odds ratios of stunting of children living in urban poor and rural clusters compared to children living in urban non-poor clusters.
Table A1.
Adjusted odds ratios of stunting of children living in urban poor and rural clusters compared to children living in urban non-poor clusters.
| Survey | Rural | Urban Poor |
|---|---|---|
| Angola 2015–2016 | 1.63 *** (1.34,1.98) | 1.45 ** (1.15,1.83) |
| Bangladesh 2014 | 1.38 ** (1.12,1.69) | 1.70 ** (1.25,2.32) |
| Benin 2017–2018 | 1.73 *** (1.45,2.06) | 1.63 *** (1.32,2) |
| Burundi 2016–2017 | 2.59 *** (1.82,3.69) | 1.78 (0.83,3.81) |
| Cameroon 2018 | 1.5 ** (1.15,1.95) | 1.40 (0.89,2.21) |
| Cambodia 2014 | 1.16 (0.84,1.6) | 1.10 (0.7,1.74) |
| Chad 2014–2015 | 1.58 ** (1.2,2.08) | 1.31 (0.99,1.73) |
| Congo Democratic Republic 2013–2014 | 2.01 *** (1.46,2.76) | 1.52 * (1.07,2.16) |
| Egypt 2014 | 0.51 ** (0.33,0.78) | 0.44 *** (0.3,0.65) |
| Ethiopia 2016 | 2.36 *** (1.55,3.61) | 2.02 ** (1.26,3.23) |
| Ghana 2014 | 1.17 (0.86,1.59) | 0.55 * (0.32,0.96) |
| Guatemala 2014–2015 | 1.57 *** (1.35,1.83) | 1.96 *** (1.48,2.61) |
| Guinea 2018 | 1.79 *** (1.4,2.3) | 0.84 (0.36,1.96) |
| Haiti 2016–2017 | 1.39 * (1.08,1.79) | 1.74 ** (1.18,2.55) |
| India 2015–2016 | 1.37 *** (1.31,1.42) | 1.42 *** (1.29,1.56) |
| Kenya 2014 | 1.87 *** (1.49,2.35) | 1.57 ** (1.21,2.04) |
| Malawi 2015–2016 | 1.69 ** (1.25,2.29) | 1.00 (0.49,2.05) |
| Mali 2018 | 1.74 *** (1.28,2.37) | 1.74 ** (1.2,2.52) |
| Myanmar 2015–2016 | 1.7 *** (1.28,2.27) | 1.59 * (1.09,2.3) |
| Nepal 2016 | 1.48 ** (1.16,1.89) | 1.76 ** (1.27,2.42) |
| Nigeria 2018 | 1.43 *** (1.24,1.65) | 1.36 ** (1.1,1.67) |
| Pakistan 2017–2018 | 1.32 * (1.02,1.71) | 1.94 * (1.16,3.25) |
| Rwanda 2014–2015 | 1.61 ** (1.19,2.19) | 0.98 (0.57,1.67) |
| Senegal 2017 | 1.56 *** (1.33,1.82) | 1.32 * (1,1.74) |
| South Africa 2016 | 1.96 *** (1.37,2.81) | 0.92 (0.31,2.74) |
| Tanzania 2015–2016 | 1.7 *** (1.42,2.04) | 2.01 ** (1.26,3.22) |
| Uganda 2016 | 1.39 (0.99,1.95) | 1.26 (0.8,1.97) |
| Zambia 2018 | 1.06 (0.91,1.22) | 0.93 (0.74,1.16) |
* p 0.05. ** p 0.01, *** p 0.001.
Appendix B
Table A2.
Adjusted odds ratios of moderate or severe anemia for children living in urban poor and rural clusters compared to children living in urban non-poor clusters.
Table A2.
Adjusted odds ratios of moderate or severe anemia for children living in urban poor and rural clusters compared to children living in urban non-poor clusters.
| Survey | Rural | Urban Poor |
|---|---|---|
| Angola 2015–2016 | 1.04 (0.8,1.35) | 1.09 (0.82,1.45) |
| Bangladesh 2014 | NA | NA |
| Benin 2017–2018 | 1.87 *** (1.54,2.27) | 1.74 *** (1.37,2.19) |
| Burundi 2016–2017 | 1.71 * (1.13,2.59) | 1.71 * (1.02,2.87) |
| Cameroon 2018 | 1.42 * (1.08,1.87) | 1.17 (0.77,1.79) |
| Cambodia 2014 | 1.68 ** (1.24,2.29) | 1.85 ** (1.19,2.85) |
| Chad 2014–2015 | NA | NA |
| Congo Democratic Republic 2013–2014 | 1.61 ** (1.14,2.26) | 1.46 * (1.01,2.1) |
| Egypt 2014 | 1.17 (0.61,2.25) | 2.68 * (1.14,6.33) |
| Ethiopia 2016 | 2.22 ** (1.3,3.81) | 1.73 * (1.08,2.77) |
| Ghana 2014 | 1.64 *** (1.26,2.14) | 2.17 *** (1.42,3.33) |
| Guatemala 2014–2015 | 1.15 (0.94,1.41) | 0.85 (0.54,1.32) |
| Guinea 2018 | 1.25 (0.99,1.59) | 0.41 * (0.18,0.93) |
| Haiti 2016–2017 | 0.98 (0.76,1.26) | 1.95 * (1.17,3.26) |
| India 2015–2016 | 1.03 (0.98,1.08) | 1.06 (0.96,1.17) |
| Kenya 2014 | NA | NA |
| Malawi 2015–2016 | 1.3 (0.95,1.8) | 1.65 (0.58,4.69) |
| Mali 2018 | 2.06 *** (1.44,2.96) | 1.01 (0.63,1.61) |
| Myanmar 2015–2016 | 1.39 (0.91,2.14) | 1.31 (0.76,2.27) |
| Nepal 2016 | 1.38 * (1.06,1.8) | 0.82 (0.53,1.29) |
| Nigeria 2018 | 1.5 *** (1.31,1.72) | 1.54 *** (1.22,1.95) |
| Pakistan 2017–2018 | NA | NA |
| Rwanda 2014–2015 | 1.89 *** (1.34,2.67) | 1.36 (0.71,2.64) |
| Senegal 2017 | 1.69 *** (1.45,1.96) | 1.7 *** (1.3,2.22) |
| South Africa 2016 | 1.2 (0.76,1.88) | 5.68 ** (2.04,15.84) |
| Tanzania 2015–2016 | 1.43 *** (1.18,1.73) | 1.77 *** (1.36,2.3) |
| Uganda 2016 | 1.38 (0.97,1.95) | 1.31 (0.75,2.31) |
| Zambia 2018 | 0.9 (0.75,1.08) | 0.81 (0.53,1.24) |
NA- Data not available, * p 0.05. ** p 0.01, *** p 0.001.
References
- UNICEF. The State of the World’s Children 2019. Children, Food and Nutrition: Growing Well in a Changing World; UNICEF: New York, NY, USA, 2019. [Google Scholar]
- Global Nutrition Report. 2020 Global Nutrition Report: Action on Equity to End Malnutrition; Development Initiatives: Bristol, UK, 2020. [Google Scholar]
- Gardner, W.; Kassebaum, N. Global, Regional, and National Prevalence of Anemia and Its Causes in 204 Countries and Territories, 1990–2019. Curr. Dev. Nutr. 2020, 4, 830. [Google Scholar] [CrossRef]
- Stevens, G.A.; Finucane, M.M.; De-Regil, L.M.; Paciorek, C.J.; Flaxman, S.R.; Branca, F.; Peña-Rosas, J.P.; Bhutta, Z.A.; Ezzati, M.; Nutrition Impact Model Study Group. Global, regional, and national trends in haemoglobin concentration and prevalence of total and severe anaemia in children and pregnant and non-pregnant women for 1995–2011: A systematic analysis of population-representative data. Lancet Glob. Health 2013, 1, e16–e25. [Google Scholar] [CrossRef] [Green Version]
- Grantham-McGregor, S.; Cheung, Y.B.; Cueto, S.; Glewwe, P.; Richter, L.; Strupp, B.; International Child Development Steering Group. Developmental potential in the first 5 years for children in developing countries. Lancet 2007, 369, 60–70. [Google Scholar] [CrossRef] [Green Version]
- WHO. Stunted Growth and Development: Context, Causes and Consequences; World Health Organization: Geneva, Switzerland, 2017. [Google Scholar]
- Grantham-McGregor, S.; Smith, J. The Effect of Malnutrition and Micronutrient Deficiency on Children’s Mental Health. Ment. Health Illn. Child. Adolesc. 2020, 1–20. [Google Scholar] [CrossRef]
- Prado, E.L.; Dewey, K.G. Nutrition and brain development in early life. Nutr. Rev. 2014, 72, 267–284. [Google Scholar] [CrossRef] [PubMed] [Green Version]
- United Nations Human Settlements Programme. State of the World’s Cities 2008/2009: Harmonious Cities; UN-HABITAT: Sterling, VA, USA, 2008. [Google Scholar]
- Lucci, P.; Bhatkal, T.; Khan, A. Are we underestimating urban poverty? World Dev. 2018, 103, 297–310. [Google Scholar] [CrossRef]
- DESA. World Urbanization Prospects: The 2018 Revision; Department of Economic and Social Affairs, Population Division, United Nations: New York, NY, USA, 2018. [Google Scholar]
- Assaf, S.; Kothari, M.T.; Pullum, T. An Assessment of the Quality of DHS Anthropometric Data, 2005-2014; ICF International: Rockville, MA, USA, 2015. [Google Scholar]
- Assaf, S.; Pullum, T. Levels and Trends in Maternal and Child Health Disparities by Wealth and Region in Eleven Countries with DHS Surveys; ICF International: Rockville, MA, USA, 2016. [Google Scholar]
- Eckert, S.; Kohler, S. Urbanization and health in developing countries: A systematic review. World Health Popul. 2014, 15, 7–20. [Google Scholar] [CrossRef]
- Rutstein, S.O.; Staveteig, S.; Winter, R.; Yourkavitch, J. Urban Child Poverty, Health, and Survival in Low- and Middle-Income Countries; ICF International: Rockville, MA, USA, 2016. [Google Scholar]
- Van de Poel, E.; Hosseinpoor, A.R.; Speybroeck, N.; Van Ourti, T.; Vega, J. Socioeconomic inequality in malnutrition in developing countries. Bull. World Health Organ. 2008, 86, 282–291. [Google Scholar] [CrossRef] [Green Version]
- Baye, K.; Laillou, A.; Chitweke, S. Socio-Economic Inequalities in Child Stunting Reduction in Sub-Saharan Africa. Nutrients 2020, 12, 253. [Google Scholar] [CrossRef] [Green Version]
- Van de Poel, E.; O’Donnell, O.; Van Doorslaer, E. Are urban children really healthier? Evidence from 47 developing countries. Soc. Sci. Med. 2007, 65, 1986–2003. [Google Scholar] [CrossRef]
- Ezeh, A.; Oyebode, O.; Satterthwaite, D.; Chen, Y.-F.; Ndugwa, R.; Sartori, J.; Mberu, B.; Melendez-Torres, G.J.; Haregu, T.; Watson, S.I. The history, geography, and sociology of slums and the health problems of people who live in slums. Lancet 2017, 389, 547–558. [Google Scholar] [CrossRef]
- Fink, G.; Günther, I.; Hill, K. Slum residence and child health in developing countries. Demography 2014, 51, 1175–1197. [Google Scholar] [CrossRef] [PubMed]
- Kyu, H.H.; Shannon, H.S.; Georgiades, K.; Boyle, M.H. Association of urban slum residency with infant mortality and child stunting in low and middle income countries. Biomed Res. Int. 2013. [Google Scholar] [CrossRef] [PubMed] [Green Version]
- UNICEF; WHO; World Bank. Levels and Trends in Child Malnutrition: Key Findings of the 2018 Edition of the Joint Child Malnutrition Estimates; World Health Organization: Geneva, Switzerland, 2018. [Google Scholar]
- WHO. The Double Burden of Malnutrition: Policy Brief; World Health Organization: Geneva, Switzerland, 2017. [Google Scholar]
- WHO. Report of the Commission on Ending Childhood Obesity; World Health Organization: Geneva, Switzerland, 2016. [Google Scholar]
- Akombi, B.J.; Chitekwe, S.; Sahle, B.W.; Renzaho, A. Estimating the Double Burden of Malnutrition among 595,975 Children in 65 Low-and Middle-Income Countries: A Meta-Analysis of Demographic and Health Surveys. Int. J. Environ. Res. Public Health 2019, 16, 2886. [Google Scholar] [CrossRef] [Green Version]
- Popkin, B.M.; Corvalan, C.; Grummer-Strawn, L.M. Dynamics of the double burden of malnutrition and the changing nutrition reality. Lancet 2020, 395, 65–74. [Google Scholar] [CrossRef]
- Tzioumis, E.; Kay, M.C.; Bentley, M.E.; Adair, L.S. Prevalence and trends in the childhood dual burden of malnutrition in low-and middle-income countries, 1990–2012. Public Health Nutr. 2016, 19, 1375–1388. [Google Scholar] [CrossRef] [Green Version]
- Popkin, B.M. Nutrition transition and the global diabetes epidemic. Curr. Diabetes Rep. 2015, 15, 64. [Google Scholar] [CrossRef]
- Ruel, M.T.; Garrett, J.; Yosef, S.; Olivier, M. Urbanization, food security and nutrition. In Nutrition and Health in a Developing World; Springer: New York, NY, USA, 2017; pp. 705–735. [Google Scholar]
- United Nations, Department of Economic and Social Affairs Population Dynamics, Population Division. World Population Prospects 2019, Online Edition. Rev. 1. Available online: https://population.un.org/wpp/ (accessed on 11 September 2020).
- United Nations Human Settlements Programme. UN-HABITAT State of the World’s Cities 2006/7; UN-HABITAT: Nairobi, Kenya, 2007. [Google Scholar]
- UN-Habitat. Slum Almanac 2015/2016. Tracking Improvement in the Lives of Slum Dwellers; UN-Habitat: Nairobi, Kenya, 2016. [Google Scholar]
- Harris, R.J.; Deeks, J.J.; Altman, D.G.; Bradburn, M.J.; Harbord, R.M.; Sterne, J.A. Metan: Fixed-and random-effects meta-analysis. Stata J. 2008, 8, 3–28. [Google Scholar] [CrossRef] [Green Version]
- Higgins, J.P.; Thompson, S.G.; Deeks, J.J.; Altman, D.G. Measuring inconsistency in meta-analyses. BMJ 2003, 327, 557–560. [Google Scholar] [CrossRef] [Green Version]
- Assaf, S.; Juan, C. Variations in Health Outcomes with Alternative Measures of Urbanicity, Using Demographic and Health Surveys 2013-18; ICF: Rockville, MA, USA, 2020. [Google Scholar]
- Menon, P.; Ruel, M.T.; Morris, S.S. Socio-economic differentials in child stunting are consistently larger in urban than in rural areas. Food Nutr. Bull. 2000, 21, 282–289. [Google Scholar] [CrossRef] [Green Version]
- Mberu, B.U.; Haregu, T.N.; Kyobutungi, C.; Ezeh, A.C. Health and health-related indicators in slum, rural, and urban communities: A comparative analysis. Glob. Health Action 2016, 9, 33163. [Google Scholar] [CrossRef] [PubMed]
- World Bank Group. Scaling Up Nutrition in the Arab Republic of Egypt: Investing in a Healthy Future; Herbst, C.H., Elshalakani, A., Kakietek, J., Hafiz, A., Petrovic, O., Eds.; World Bank: Washington, DC, USA, 2020. [Google Scholar]
- Hassan, H.; Moussa, W.; Ismail, I. Assessment of dietary changes and their health implications in countries facing the double burden of malnutrition: Egypt, 1980 to 2005. Double Burd. Malnutrition 2006, 43, 22. [Google Scholar]
- Atsu, B.K.; Guure, C.; Laar, A.K. Determinants of overweight with concurrent stunting among Ghanaian children. BMC Pediatrics 2017, 17, 177. [Google Scholar] [CrossRef] [PubMed] [Green Version]
- Cyril, S.; Oldroyd, J.C.; Renzaho, A. Urbanisation, urbanicity, and health: A systematic review of the reliability and validity of urbanicity scales. BMC Public Health 2013, 13, 513. [Google Scholar] [CrossRef] [Green Version]
- Unger, A.; Riley, L.W. Slum health: From understanding to action. PLoS Med. 2007, 4, e295. [Google Scholar] [CrossRef] [Green Version]
- Tacoli, C. Food security in rapidly urbanising, low-income contexts. Int. J. Environ. Res. Public Health 2017, 14, 1554. [Google Scholar] [CrossRef] [Green Version]
- Fish, T.D.; Janocha, B.; Dontamsetti, T.; Mayala, B.K. Geospatial Covariates: Proxies for Mapping Urban-Related Indicators; ICF: Rockville, MA, USA, 2020. [Google Scholar]
- Jones, A.D.; Acharya, Y.; Galway, L.P. Urbanicity gradients are associated with the household-and individual-level double burden of malnutrition in sub-Saharan Africa. J. Nutr. 2016, 146, 1257–1267. [Google Scholar] [CrossRef] [Green Version]
Figure 2.
Adjusted odds ratios of stunting of children living in urban poor and rural clusters compared to children living in urban non-poor clusters.
Figure 2.
Adjusted odds ratios of stunting of children living in urban poor and rural clusters compared to children living in urban non-poor clusters.
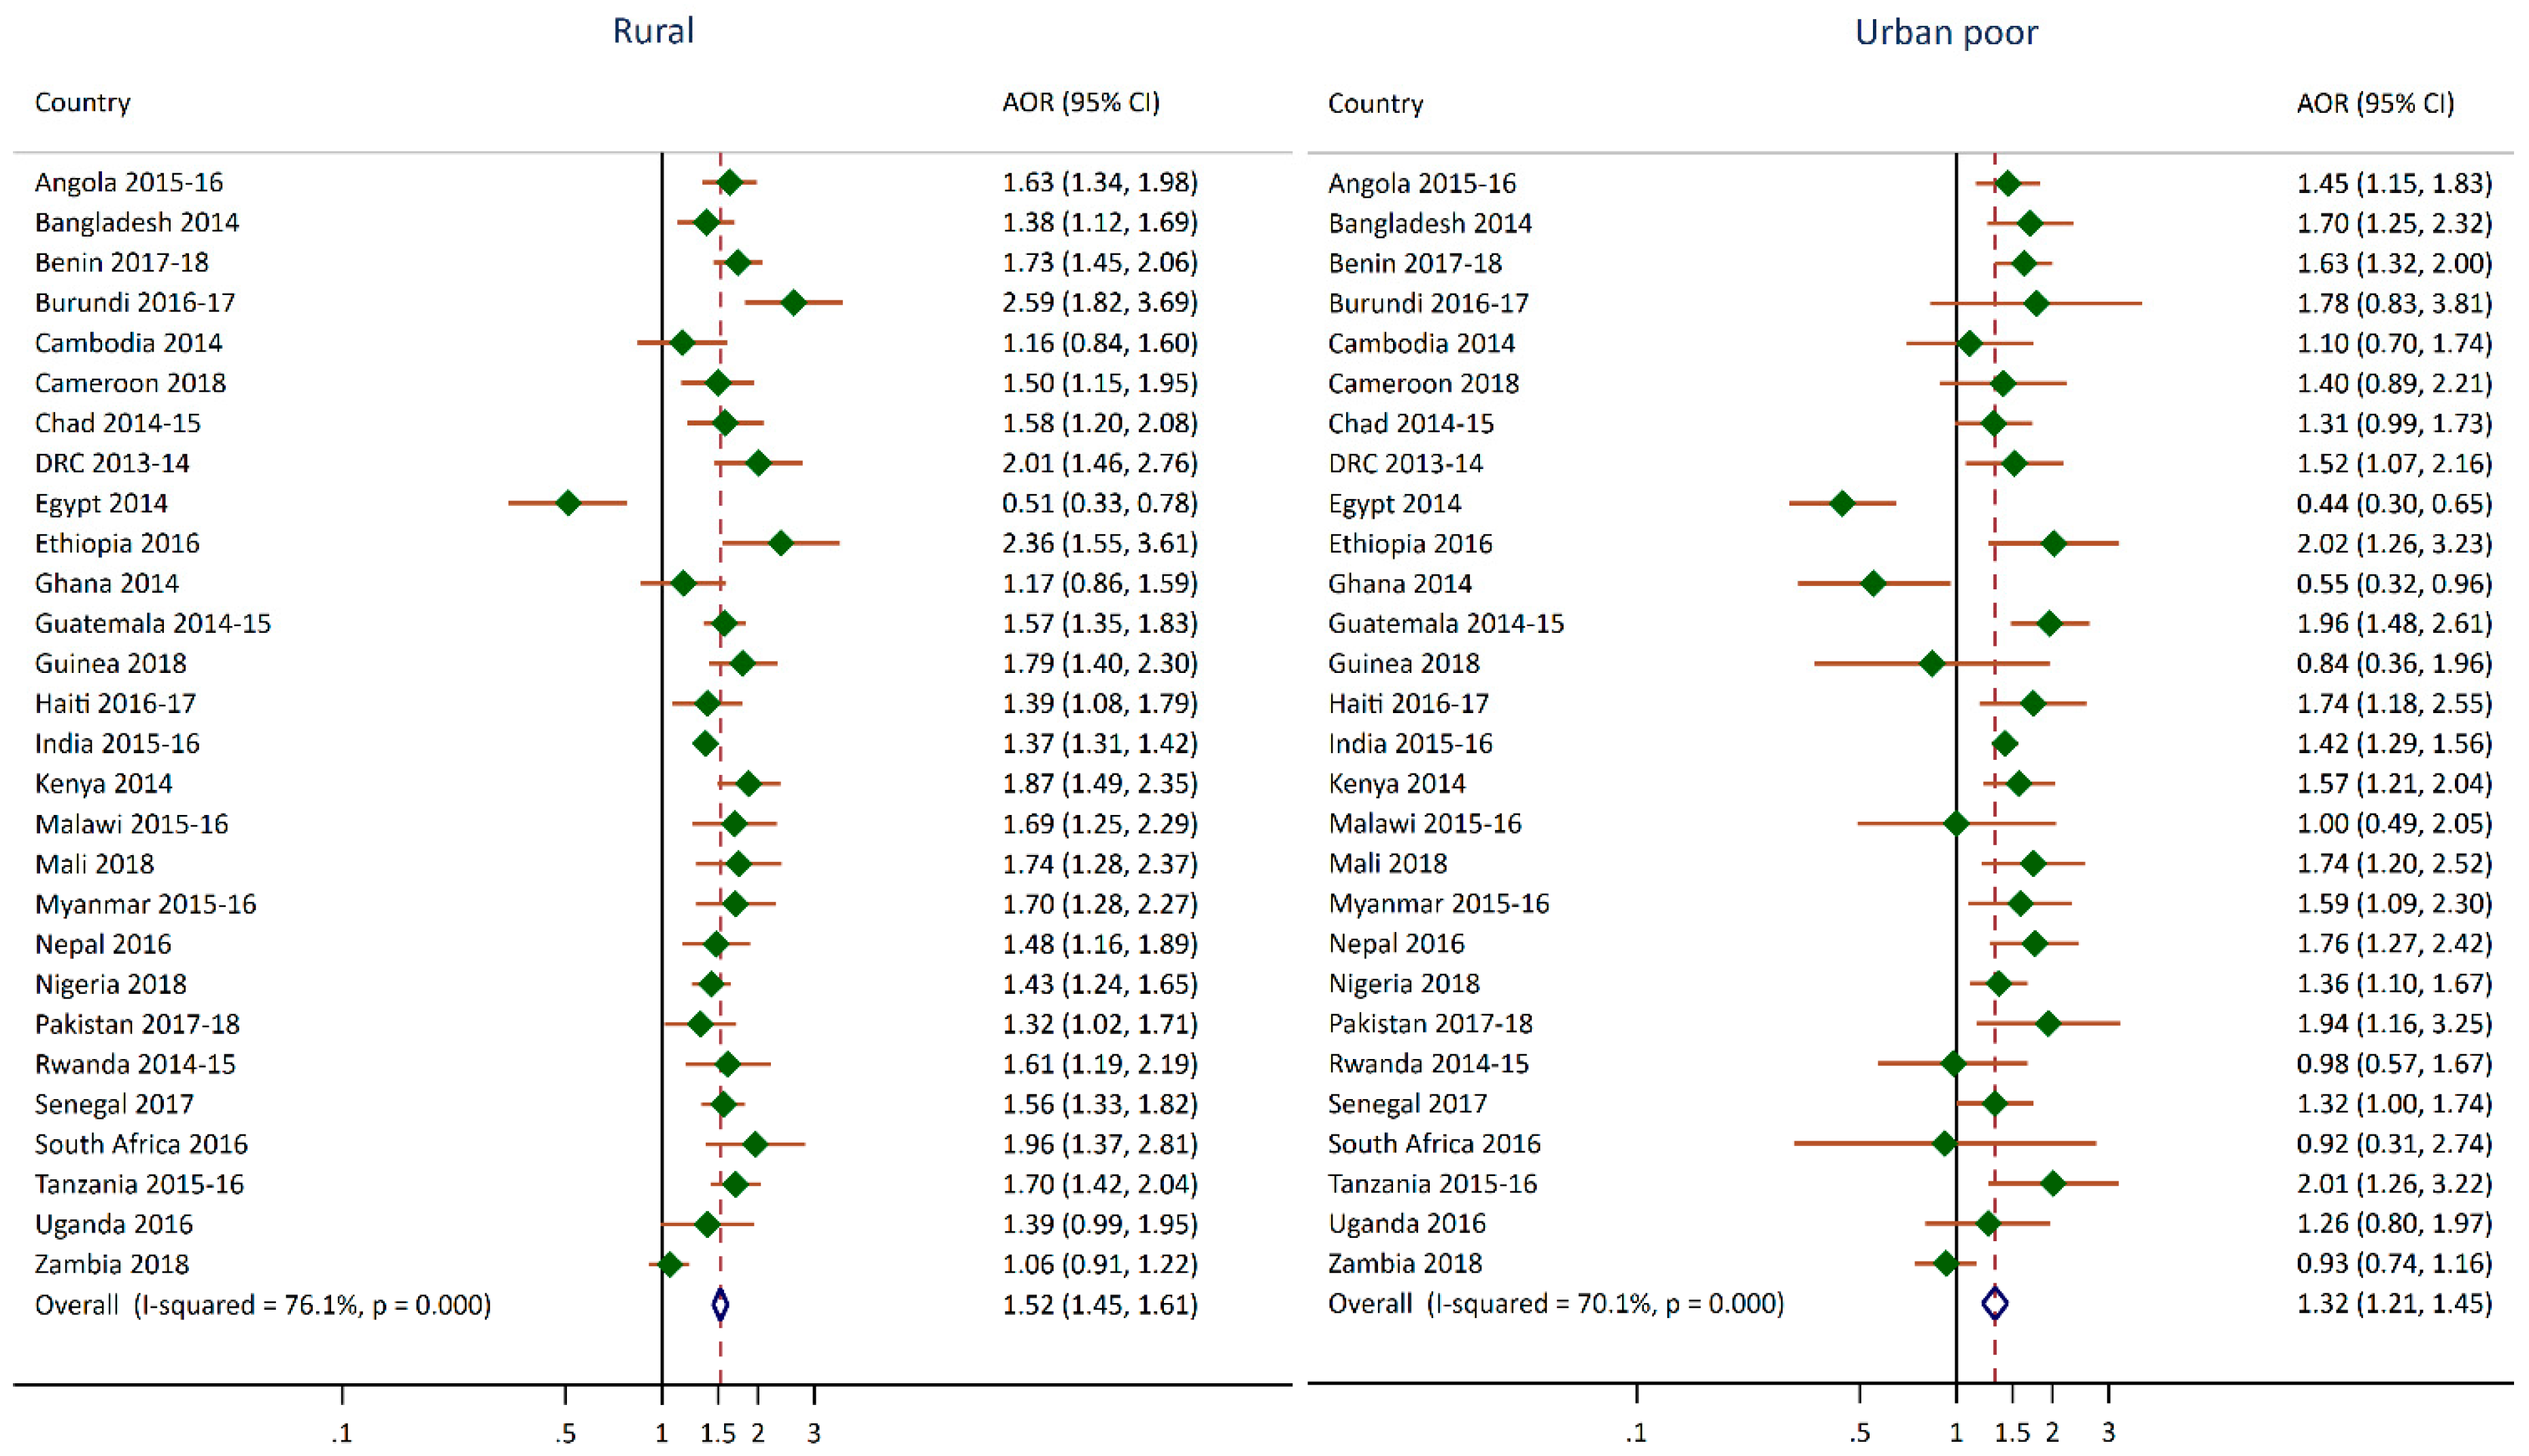
Figure 3.
Adjusted odds ratios of moderate or severe anemia for children living in urban poor and rural clusters compared to children living in urban non-poor clusters.
Figure 3.
Adjusted odds ratios of moderate or severe anemia for children living in urban poor and rural clusters compared to children living in urban non-poor clusters.

Table 1.
Surveys used in the analysis with sample sizes and population size.
| Country | DHS Survey | Number of Households Interviewed | Projected Population in 2020 (Thousands) * |
|---|---|---|---|
| Angola | 2015–2016 | 16,109 | 32,866 |
| Bangladesh | 2014 | 17,300 | 164,689 |
| Benin | 2017–2018 | 14,156 | 12,123 |
| Burundi | 2016–2017 | 15,977 | 11,891 |
| Cameroon | 2018 | 11,710 | 26,546 |
| Cambodia | 2014 | 15,825 | 16,719 |
| Chad | 2014–2015 | 17,233 | 16,426 |
| DRC | 2013–2014 | 18,171 | 89,561 |
| Egypt | 2014 | 28,175 | 102,334 |
| Ethiopia | 2016 | 16,650 | 114,964 |
| Ghana | 2014 | 11,835 | 31,073 |
| Guatemala | 2014–2015 | 21,383 | 17,916 |
| Guinea | 2018 | 7912 | 13,133 |
| Haiti | 2016–2017 | 13,405 | 11,403 |
| India | 2015–2016 | 601,509 | 1,380,004 |
| Jordan | 2017–2018 | 18,802 | 10,203 |
| Kenya | 2014 | 36,430 | 53,771 |
| Malawi | 2015–2016 | 26,361 | 19,130 |
| Mali | 2018 | 9510 | 20,251 |
| Myanmar | 2015–2016 | 12,500 | 54,410 |
| Nepal | 2016 | 11,040 | 29,137 |
| Nigeria | 2018 | 40,427 | 206,140 |
| Pakistan | 2017–2018 | 11,869 | 220,892 |
| Philippines | 2017 | 27,496 | 109,581 |
| Rwanda | 2014–2015 | 12,699 | 12,952 |
| Senegal | 2017 | 8380 | 16,744 |
| South Africa | 2016 | 11,083 | 59,309 |
| Tanzania | 2015–2016 | 12,563 | 59,734 |
| Uganda | 2016 | 19,588 | 45,741 |
| Zambia | 2018 | 12,831 | 18,384 |
| Zimbabwe | 2015 | 10,534 | 14,863 |
Note: * Figures extracted from [30]. DHS, Demographic and Health Surveys; DRC, Democratic Republic of the Congo.
Table 2.
Percentage and 95% CI of children under age 5 that are stunted with crosstabulation by urban poverty cluster variable.
Table 2.
Percentage and 95% CI of children under age 5 that are stunted with crosstabulation by urban poverty cluster variable.
| Survey | Total | Urban non-Poor | Urban Poor | Rural | p-Value |
|---|---|---|---|---|---|
| Angola 2015–2016 | 37.6 (35.7,39.5) | 28.2 (24.5,32.3) | 41.4 (37.8,45.0) | 45.7 (43.5,47.9) | 0.001 |
| Bangladesh 2014 | 36.1 (34.4,37.9) | 28.5 (25.0,32.2) | 47.6 (40.1,55.2) | 37.9 (35.9,39.9) | 0.001 |
| Benin 2017–2018 | 32.2 (30.9,33.4) | 21.7 (19.6,23.9) | 33.9 (31.2,36.8) | 35.2 (33.7,36.8) | 0.001 |
| Burundi 2016–2017 | 55.9 (54.2,57.7) | 25.7 (20.1,32.2) | 45.1 (24.8,67.1) | 58.8 (57.0,60.5) | 0.001 |
| Cameroon 2018 | 28.9 (27.1,30.8) | 18.1 (15.7,20.8) | 32.7 (23.0,44.2) | 36.2 (33.7,38.8) | 0.001 |
| Cambodia 2014 | 32.4 (30.6,34.3) | 22.5 (18.9,26.6) | 30.9 (24.2,38.5) | 33.8 (31.8,35.9) | 0.001 |
| Chad 2014–2015 | 39.9 (38.4,41.3) | 25.0 (21.3,29.1) | 35.0 (31.7,38.5) | 41.6 (39.9,43.4) | 0.001 |
| Democratic Republic of the Congo 2013–2014 | 42.7 (40.9,44.5) | 25.1 (20.5,30.3) | 39.0 (35.3,42.9) | 47.1 (44.9,49.4) | 0.001 |
| Egypt 2014 | 21.4 (20.1,22.9) | 23.1 (20.5,26.0) | 15.9 (12.3,20.4) | 20.7 (19.1,22.4) | 0.112 |
| Ethiopia 2016 | 38.4 (36.5,40.3) | 14.6 (11.5,18.4) | 29.8 (23.6,36.7) | 39.9 (37.9,42.0) | 0.001 |
| Ghana 2014 | 18.8 (17.0,20.6) | 14.8 (12.4,17.6) | 15.1 (11.4,19.8) | 22.1 (19.7,24.7) | 0.001 |
| Guatemala 2014–2015 | 46.5 (44.8,48.2) | 30.0 (27.8,32.3) | 55.1 (47.5,62.4) | 53.0 (50.8,55.1) | 0.001 |
| Guinea 2018 | 30.3 (28.6,32.1) | 21.7 (18.9,24.9) | 21.3 (10.5,38.5) | 33.8 (31.8,35.9) | 0.001 |
| Haiti 2016–2017 | 21.9 (20.5,23.5) | 16.8 (14.6,19.2) | 29.4 (22.0,38.1) | 23.9 (22.0,25.9) | 0.001 |
| India 2015–2016 | 38.4 (38.1,38.7) | 29.4 (28.6,30.2) | 42.6 (40.8,44.5) | 41.2 (40.8,41.5) | 0.001 |
| Kenya 2014 | 26.0 (25.1,27.0) | 16.3 (13.6,19.4) | 23.2 (21.1,25.4) | 29.1 (27.9,30.2) | 0.001 |
| Malawi 2015–2016 | 37.1 (35.6,38.7) | 25.0 (20.7,29.8) | (24.3) (16.0,35.2) | 38.9 (37.2,40.6) | 0.001 |
| Mali 2018 | 26.9 (25.6,28.2) | 15.4 (13.6,17.5) | 27.8 (21.2,35.5) | 29.4 (27.9,30.9) | 0.001 |
| Myanmar 2015–2016 | 29.2 (27.3,31.1) | 17.0 (13.9,20.6) | 25.1 (19.8,31.3) | 31.6 (29.5,33.9) | 0.001 |
| Nepal 2016 | 35.8 (33.5,38.3) | 28.3 (25.0,31.7) | 44.1 (37.6,50.8) | 40.2 (36.6,43.9) | 0.001 |
| Nigeria 2018 | 36.8 (35.6,38.1) | 24.2 (22.3,26.3) | 39.6 (35.7,43.6) | 44.8 (43.2,46.3) | 0.001 |
| Pakistan 2017–2018 | 37.6 (34.8,40.6) | 28.4 (24.9,32.2) | 55.7 (44.5,66.4) | 40.9 (37.1,44.9) | 0.001 |
| Rwanda 2014–2015 | 37.9 (36.1,39.6) | 22.7 (19.0,26.9) | 28.9 (15.8,47.0) | 40.6 (38.6,42.6) | 0.001 |
| Senegal 2017 | 16.5 (15.6,17.5) | 9.5 (8.3,10.8) | 23.3 (18.6,28.8) | 20.2 (19.0,21.4) | 0.001 |
| South Africa 2016 | 27.4 (24.3,30.7) | 26.0 (20.9,31.7) | ND | 29.2 (25.8,32.8) | 0.338 |
| Tanzania 2015–2016 | 34.4 (33.0,35.9) | 22.8 (20.5,25.3) | 39.5 (24.1,57.3) | 37.8 (36.1,39.4) | 0.001 |
| Uganda 2016 | 28.9 (27.3,30.5) | 20.0 (16.5,24.1) | 31.6 (25.6,38.2) | 30.2 (28.4,32.0) | 0.001 |
| Zambia 2018 | 34.6 (33.4,35.8) | 31.9 (29.6,34.4) | 33.8 (28.9,39.1) | 35.9 (34.4,37.3) | 0.016 |
Note: The p-value is produced from the Chi-square test of the association between the urban poverty cluster variable and stunting. ND is not displaced because the estimate is based on fewer than 25 observations. Estimates in parentheses are based on 25–50 observations.
Table 3.
Percentage and 95% CI of children age 6–59 months with moderate or severe anemia with crosstabulation by urban poverty cluster variable.
Table 3.
Percentage and 95% CI of children age 6–59 months with moderate or severe anemia with crosstabulation by urban poverty cluster variable.
| Survey | Total | Urban non-Poor | Urban Poor | Rural | p-Value |
|---|---|---|---|---|---|
| Angola 2015–2016 | 34.1 (32.2,36.1) | 32.6 (29.7,35.7) | 35.3 (31.1,39.7) | 35.1 (32.0,38.3) | 0.419 |
| Bangladesh 2014 | NA | NA | NA | NA | |
| Benin 2017–2018 | 43.9 (42.2,45.6) | 28.9 (26.1,31.9) | 47.5 (43.5,51.6) | 47.8 (45.6,50.0) | 0.001 |
| Burundi 2016–2017 | 36.3 (34.6,38.1) | 23.6 (17.8,30.7) | 31.7 (26.2,37.9) | 37.5 (35.6,39.3) | 0.001 |
| Cameroon 2018 | 31.0 (29.1,33.0) | 25.5 (22.8,28.5) | 30.7 (23.9,38.5) | 34.8 (32.0,37.8) | 0.001 |
| Cambodia 2014 | 25.7 (24.0,27.5) | 15.7 (12.6,19.3) | 29.2 (24.2,34.9) | 27.0 (25.0,29.0) | 0.001 |
| Chad 2014–2015 | NA | NA | NA | NA | |
| Democratic Republic of the Congo 2013–2014 | 34.8 (32.5,37.1) | 26.6 (23.3,30.1) | 35.5 (30.3,41.1) | 36.2 (33.1,39.3) | 0.005 |
| Egypt 2014 | 9.5 (8.3,10.7) | 6.2 (4.8,7.9) | (14.0) (4.0,38.7) | 11.0 (9.5,12.7) | 0.001 |
| Ethiopia 2016 | 32.0 (29.5,34.6) | 21.7 (16.1,28.5) | 26.2 (20.8,32.4) | 32.8 (30.0,35.6) | 0.011 |
| Ghana 2014 | 39.1 (36.3,41.9) | 29.6 (25.9,33.6) | 52.2 (37.5,66.5) | 46.2 (42.6,49.8) | 0.001 |
| Guatemala 2014–2015 | 12.1 (11.3,13.0) | 9.3 (8.1,10.6) | 9.1 (6.8,12.1) | 13.6 (12.5,14.8) | 0.001 |
| Guinea 2018 | 43.8 (41.6,46.0) | 40.4 (36.7,44.3) | 23.9 (14.3,37.2) | 45.7 (43.0,48.3) | 0.001 |
| Haiti 2016–2017 | 37.5 (35.7,39.3) | 36.4 (33.0,40.0) | 54.4 (42.1,66.2) | 37.2 (35.1,39.3) | 0.005 |
| India 2015–2016 | 30.7 (30.4,31.0) | 28.7 (27.9,29.5) | 32.8 (31.0,34.7) | 31.3 (30.9,31.7) | 0.001 |
| Kenya 2014 | NA | NA | NA | NA | |
| Malawi 2015–2016 | 36.1 (34.2,38.1) | 29.4 (23.9,35.6) | ND | 37.1 (35.0,39.2) | 0.020 |
| Mali 2018 | 56.7 (54.6,58.8) | 45.1 (41.2,49.2) | 43.1 (31.4,55.5) | 59.7 (57.2,62.1) | 0.001 |
| Myanmar 2015–2016 | 26.7 (24.7,28.9) | 20.3 (15.5,26.2) | 27.4 (19.9,36.4) | 27.6 (25.3,30.1) | 0.087 |
| Nepal 2016 | 26.4 (24.0,29.1) | 21.5 (18.4,24.9) | 24.0 (17.3,32.2) | 31.2 (27.5,35.2) | 0.001 |
| Nigeria 2018 | 41.1 (39.7,42.5) | 31.6 (29.5,33.9) | 48.6 (43.4,53.8) | 46.4 (44.5,48.2) | 0.001 |
| Pakistan 2017–2018 | NA | NA | NA | NA | |
| Rwanda 2014–2015 | 15.8 (14.4,17.2) | 9.0 (7.0,11.6) | 13.4 (5.8,27.8) | 16.9 (15.4,18.5) | 0.001 |
| Senegal 2017 | 41.8 (40.2,43.4) | 29.7 (27.3,32.2) | 48.9 (42.9,54.8) | 48.1 (46.2,50.0) | 0.001 |
| South Africa 2016 | 37.0 (32.9,41.3) | 41.2 (34.0,48.9) | ND | 32.9 (29.1,36.9) | 0.108 |
| Tanzania 2015–2016 | 31.3 (29.6,33.0) | 26.0 (23.8,28.3) | 38.8 (25.1,54.6) | 32.6 (30.6,34.7) | 0.001 |
| Uganda 2016 | 29.1 (27.3,31.1) | 24.2 (20.1,28.8) | 25.4 (17.9,34.6) | 30.2 (28.1,32.4) | 0.060 |
| Zambia 2018 | 29.5 (28.1,30.9) | 30.3 (27.8,32.9) | 29.9 (24.1,36.5) | 29.1 (27.4,30.8) | 0.694 |
Note: The p-value is produced from the Chi-square test of the association between the urban poverty cluster variable and moderate to severe anemia. NA means data not available and ND is not displaced because the estimate is based on fewer than 25 observations. Estimates in parentheses are based on 25–50 observations.
Publisher’s Note: MDPI stays neutral with regard to jurisdictional claims in published maps and institutional affiliations. |
© 2020 by the authors. Licensee MDPI, Basel, Switzerland. This article is an open access article distributed under the terms and conditions of the Creative Commons Attribution (CC BY) license (http://creativecommons.org/licenses/by/4.0/).
Share and Cite
MDPI and ACS Style
Assaf, S.; Juan, C. Stunting and Anemia in Children from Urban Poor Environments in 28 Low and Middle-income Countries: A Meta-analysis of Demographic and Health Survey Data. Nutrients 2020, 12, 3539. https://doi.org/10.3390/nu12113539
AMA Style
Assaf S, Juan C. Stunting and Anemia in Children from Urban Poor Environments in 28 Low and Middle-income Countries: A Meta-analysis of Demographic and Health Survey Data. Nutrients. 2020; 12(11):3539. https://doi.org/10.3390/nu12113539
Chicago/Turabian StyleAssaf, Shireen, and Christina Juan. 2020. "Stunting and Anemia in Children from Urban Poor Environments in 28 Low and Middle-income Countries: A Meta-analysis of Demographic and Health Survey Data" Nutrients 12, no. 11: 3539. https://doi.org/10.3390/nu12113539
Note that from the first issue of 2016, this journal uses article numbers instead of page numbers. See further details here.