The Effect of Three Mediterranean Diets on Remnant Cholesterol and Non-Alcoholic Fatty Liver Disease: A Secondary Analysis

 , , , , and
Abstract
1. Introduction
2. Materials and Methods
2.1. Study Design
2.2. Participants Selection
2.3. Randomization
2.4. Baseline Examination
2.5. Dietary Intervention
2.6. Outcomes
2.7. Implementation
2.8. Statistical Analysis
3. Results
Sample Description
4. Discussion
5. Conclusions
Author Contributions
Funding
Acknowledgments
Conflicts of Interest
Appendix A. Composition of the Diets
Appendix A.1. Foods to Be Eaten Regularly
Appendix A.2. Foods to Be Eaten in Moderation
Appendix A.3. Foods to Be Avoided Completely
Appendix B

| Diet | |||
|---|---|---|---|
| MD 1 | LGID 2 | LGIMD 3 | |
| Caloric intake (kcal/die) | 1532 | 1537 | 1521 |
| Proteins (%) | 15.9 | 18.2 | 16.7 |
| Fats (%) | 37.3 | 33.3 | 41.8 |
| Carbohydrates (%) | 45.4 | 46.5 | 39.7 |
| Starch (g/die) | 111 | 62 | 45 |
| Fibers (g/die) | 18.5 | 24.0 | 23.2 |
| Alcohol (g/die) | 9.9 | 6.9 | 9.2 |
| Monounsaturated fatty acids (g/die) | 33.3 | 32.0 | 37.1 |
| Polyunsaturated fatty acids (g/die) | 8.3 | 7.4 | 8.8 |
| Saturated fatty acids (g/die) | 21.9 | 17.5 | 24.6 |
References
- Mozaffarian, D.; Benjamin, E.J.; Go, A.S.; Arnett, D.K.; Blaha, M.J.; Cushman, M.; Das, S.R.; de Ferranti, S.; Despres, J.P.; Fullerton, H.J.; et al. Heart Disease and Stroke Statistics-2016 Update: A Report From the American Heart Association. Circulation 2016, 133, e38. [Google Scholar] [CrossRef] [PubMed]
- Lewington, S.; Whitlock, G.; Clarke, R.; Sherliker, P.; Emberson, J.; Halsey, J.; Qizilbash, N.; Peto, R.; Collins, R. Blood cholesterol and vascular mortality by age, sex, and blood pressure: A meta-analysis of individual data from 61 prospective studies with 55,000 vascular deaths. Lancet 2007, 370, 1829–1839. [Google Scholar] [CrossRef] [PubMed]
- Multiple Risk Factor Intervention Trial. Risk factor changes and mortality results. Multiple Risk Factor Intervention Trial Research Group. JAMA 1982, 248, 1465–1477. [Google Scholar] [CrossRef]
- Chen, G.; Levy, D. Contributions of the Framingham Heart Study to the Epidemiology of Coronary Heart Disease. JAMA Cardiol. 2016, 1, 825–830. [Google Scholar] [CrossRef] [PubMed]
- Jacobson, T.A.; Maki, K.C.; Orringer, C.E.; Jones, P.H.; Kris-Etherton, P.; Sikand, G.; La Forge, R.; Daniels, S.R.; Wilson, D.P.; Morris, P.B.; et al. National Lipid Association Recommendations for Patient-Centered Management of Dyslipidemia: Part 2. J. Clin. Lipidol. 2015, 9, S1–S122.e121. [Google Scholar] [CrossRef] [PubMed]
- Arnett, D.K.; Blumenthal, R.S.; Albert, M.A.; Buroker, A.B.; Goldberger, Z.D.; Hahn, E.J.; Himmelfarb, C.D.; Khera, A.; Lloyd-Jones, D.; McEvoy, J.W.; et al. 2019 ACC/AHA Guideline on the Primary Prevention of Cardiovascular Disease: A Report of the American College of Cardiology/American Heart Association Task Force on Clinical Practice Guidelines. Circulation 2019, 140, e596–e646. [Google Scholar] [CrossRef]
- Mach, F.; Baigent, C.; Catapano, A.L.; Koskinas, K.C.; Casula, M.; Badimon, L.; Chapman, M.J.; De Backer, G.G.; Delgado, V.; Ference, B.A.; et al. 2019 ESC/EAS Guidelines for the management of dyslipidaemias: Lipid modification to reduce cardiovascular risk. Eur. Heart J. 2019. [Google Scholar] [CrossRef]
- Sampson, U.K.; Fazio, S.; Linton, M.F. Residual cardiovascular risk despite optimal LDL cholesterol reduction with statins: The evidence, etiology, and therapeutic challenges. Curr. Atheroscler. Rep. 2012, 14, 1–10. [Google Scholar] [CrossRef]
- Varbo, A.; Benn, M.; Tybjaerg-Hansen, A.; Jorgensen, A.B.; Frikke-Schmidt, R.; Nordestgaard, B.G. Remnant cholesterol as a causal risk factor for ischemic heart disease. J. Am. Coll. Cardiol. 2013, 61, 427–436. [Google Scholar] [CrossRef]
- Nordestgaard, B.G.; Benn, M.; Schnohr, P.; Tybjaerg-Hansen, A. Nonfasting triglycerides and risk of myocardial infarction, ischemic heart disease, and death in men and women. JAMA 2007, 298, 299–308. [Google Scholar] [CrossRef]
- Chapman, M.J.; Ginsberg, H.N.; Amarenco, P.; Andreotti, F.; Boren, J.; Catapano, A.L.; Descamps, O.S.; Fisher, E.; Kovanen, P.T.; Kuivenhoven, J.A.; et al. Triglyceride-rich lipoproteins and high-density lipoprotein cholesterol in patients at high risk of cardiovascular disease: Evidence and guidance for management. Eur. Heart J. 2011, 32, 1345–1361. [Google Scholar] [CrossRef] [PubMed]
- Langsted, A.; Freiberg, J.J.; Tybjaerg-Hansen, A.; Schnohr, P.; Jensen, G.B.; Nordestgaard, B.G. Nonfasting cholesterol and triglycerides and association with risk of myocardial infarction and total mortality: The Copenhagen City Heart Study with 31 years of follow-up. J. Intern. Med. 2011, 270, 65–75. [Google Scholar] [CrossRef] [PubMed]
- Varbo, A.; Nordestgaard, B.G.; Tybjaerg-Hansen, A.; Schnohr, P.; Jensen, G.B.; Benn, M. Nonfasting triglycerides, cholesterol, and ischemic stroke in the general population. Ann. Neurol. 2011, 69, 628–634. [Google Scholar] [CrossRef] [PubMed]
- Bansal, S.; Buring, J.E.; Rifai, N.; Mora, S.; Sacks, F.M.; Ridker, P.M. Fasting compared with nonfasting triglycerides and risk of cardiovascular events in women. JAMA 2007, 298, 309–316. [Google Scholar] [CrossRef]
- Miller, M.; Stone, N.J.; Ballantyne, C.; Bittner, V.; Criqui, M.H.; Ginsberg, H.N.; Goldberg, A.C.; Howard, W.J.; Jacobson, M.S.; Kris-Etherton, P.M.; et al. Triglycerides and cardiovascular disease: A scientific statement from the American Heart Association. Circulation 2011, 123, 2292–2333. [Google Scholar] [CrossRef]
- Freiberg, J.J.; Tybjaerg-Hansen, A.; Jensen, J.S.; Nordestgaard, B.G. Nonfasting triglycerides and risk of ischemic stroke in the general population. JAMA 2008, 300, 2142–2152. [Google Scholar] [CrossRef]
- Irawati, D.; Mamo, J.C.; Dhaliwal, S.S.; Soares, M.J.; Slivkoff-Clark, K.M.; James, A.P. Plasma triglyceride and high density lipoprotein cholesterol are poor surrogate markers of pro-atherogenic chylomicron remnant homeostasis in subjects with the metabolic syndrome. Lipids Health Dis. 2016, 15, 169. [Google Scholar] [CrossRef]
- Satapati, S.; Kucejova, B.; Duarte, J.A.; Fletcher, J.A.; Reynolds, L.; Sunny, N.E.; He, T.; Nair, L.A.; Livingston, K.A.; Fu, X.; et al. Mitochondrial metabolism mediates oxidative stress and inflammation in fatty liver. J. Clin. Investig. 2015, 125, 4447–4462. [Google Scholar] [CrossRef]
- Satapati, S.; Kucejova, B.; Duarte, J.A.; Fletcher, J.A.; Reynolds, L.; Sunny, N.E.; He, T.; Nair, L.A.; Livingston, K.A.; Fu, X.; et al. Mitochondrial metabolism mediates oxidative stress and inflammation in fatty liver. J. Clin. Investig. 2016, 126, 1605. [Google Scholar] [CrossRef]
- Gaggini, M.; Morelli, M.; Buzzigoli, E.; DeFronzo, R.A.; Bugianesi, E.; Gastaldelli, A. Non-alcoholic fatty liver disease (NAFLD) and its connection with insulin resistance, dyslipidemia, atherosclerosis and coronary heart disease. Nutrients 2013, 5, 1544–1560. [Google Scholar] [CrossRef]
- Pastori, D.; Baratta, F.; Novo, M.; Cocomello, N.; Violi, F.; Angelico, F.; Del Ben, M. Remnant Lipoprotein Cholesterol and Cardiovascular and Cerebrovascular Events in Patients with Non-Alcoholic Fatty Liver Disease. J. Clin. Med. 2018, 7, 378. [Google Scholar] [CrossRef] [PubMed]
- Watts, G.F.; Ooi, E.M.; Chan, D.C. Demystifying the management of hypertriglyceridaemia. Nat. Rev. Cardiol. 2013, 10, 648–661. [Google Scholar] [CrossRef] [PubMed]
- Dattilo, A.M.; Kris-Etherton, P.M. Effects of weight reduction on blood lipids and lipoproteins: A meta-analysis. Am. J. Clin. Nutr. 1992, 56, 320–328. [Google Scholar] [CrossRef] [PubMed]
- Appel, L.J.; Sacks, F.M.; Carey, V.J.; Obarzanek, E.; Swain, J.F.; Miller, E.R., 3rd; Conlin, P.R.; Erlinger, T.P.; Rosner, B.A.; Laranjo, N.M.; et al. Effects of protein, monounsaturated fat, and carbohydrate intake on blood pressure and serum lipids: Results of the OmniHeart randomized trial. JAMA 2005, 294, 2455–2464. [Google Scholar] [CrossRef]
- Zelber-Sagi, S.; Salomone, F.; Mlynarsky, L. The Mediterranean dietary pattern as the diet of choice for non-alcoholic fatty liver disease: Evidence and plausible mechanisms. Liver Int. Off. J. Int. Assoc. Study Liver 2017, 37, 936–949. [Google Scholar] [CrossRef]
- Sofi, F.; Abbate, R.; Gensini, G.F.; Casini, A. Accruing evidence on benefits of adherence to the Mediterranean diet on health: An updated systematic review and meta-analysis. Am. J. Clin. Nutr. 2010, 92, 1189–1196. [Google Scholar] [CrossRef]
- Kastorini, C.M.; Milionis, H.J.; Esposito, K.; Giugliano, D.; Goudevenos, J.A.; Panagiotakos, D.B. The effect of Mediterranean diet on metabolic syndrome and its components: A meta-analysis of 50 studies and 534,906 individuals. J. Am. Coll. Cardiol. 2011, 57, 1299–1313. [Google Scholar] [CrossRef]
- Osella, A.R.; Colaianni, G.; Correale, M.; Pesole, P.L.; Bruno, I.; Buongiorno, C.; Deflorio, V.; Leone, C.M.; Colucci, S.C.; Grano, M.; et al. Irisin serum levels in metabolic syndrome patients treated with three different diets: A post-hoc analysis from a randomized controlled clinical trial. Nutrients 2018, 10, 844. [Google Scholar] [CrossRef]
- Franco, I.; Bianco, A.; Dìaz, M.D.P.; Bonfiglio, C.; Chiloiro, M.; Pou, S.A.; Becaria Coquet, J.; Mirizzi, A.; Nitti, A.; Campanella, A.; et al. Effectiveness of two physical activity programs on non-alcoholic fatty liver disease. a randomized controlled clinical trial. Rev. Fac. Cienc. Médicas Córdoba 2019, 76, 26. [Google Scholar] [CrossRef]
- ClinicalTrials.gov is a Database of Privately and Publicly Funded Clinical Studies Conducted around the World. Available online: https://www.clinicaltrials.gov/ (accessed on 24 February 2020).
- Misciagna, G.; Leoci, C.; Guerra, V.; Chiloiro, M.; Elba, S.; Petruzzi, J.; Mossa, A.; Noviello, M.R.; Coviello, A.; Minutolo, M.C.; et al. Epidemiology of cholelithiasis in southern Italy. Part II: Risk factors. Eur. J. Gastroenterol. Hepatol. 1996, 8, 585–593. [Google Scholar] [CrossRef]
- Osella, A.R.; Misciagna, G.; Leone, A.; Di Leo, A.; Fiore, G. Epidemiology of hepatitis C virus infection in an area of Southern Italy. J. Hepatol. 1997, 27, 30–35. [Google Scholar] [CrossRef]
- Leoci, C.C.S.; Guerra, V.; Cisternino, A.M.; Misciagna, G. Validazione e riproducibilità di un questionario di frequenza alimentare semi-quantitativo autosomministrato (Reliability and validity of a self administered semi-quantitative food frequency questionnaire.). Giorn. Ital. Nutr. Clin. Prev. 1993, 71, 1269–1324. [Google Scholar]
- Kim, S.K.; Kim, H.J.; Hur, K.Y.; Choi, S.H.; Ahn, C.W.; Lim, S.K.; Kim, K.R.; Lee, H.C.; Huh, K.B.; Cha, B.S. Visceral fat thickness measured by ultrasonography can estimate not only visceral obesity but also risks of cardiovascular and metabolic diseases. Am. J. Clin. Nutr. 2004, 79, 593–599. [Google Scholar] [CrossRef] [PubMed]
- Trichopoulou, A.; Martinez-Gonzalez, M.A.; Tong, T.Y.; Forouhi, N.G.; Khandelwal, S.; Prabhakaran, D.; Mozaffarian, D.; de Lorgeril, M. Definitions and potential health benefits of the Mediterranean diet: Views from experts around the world. BMC Med. 2014, 12, 112. [Google Scholar] [CrossRef] [PubMed]
- Elia, A. La Rivoluzione Degli Integrali Buoni (Senza L’Aggiunta di Crusca o Fibre) (The Revolution of Good WholeGrains: Without Bran and Fibers Addition); Di Marsico Libri: Parepare, Italy, 2010; ISBN 8889979135. [Google Scholar]
- Friedewald, W.T.; Levy, R.I.; Fredrickson, D.S. Estimation of the concentration of low-density lipoprotein cholesterol in plasma, without use of the preparative ultracentrifuge. Clin. Chem. 1972, 18, 499–502. [Google Scholar] [CrossRef] [PubMed]
- Matthews, D.R.; Hosker, J.P.; Rudenski, A.S.; Naylor, B.A.; Treacher, D.F.; Turner, R.C. Homeostasis model assessment: Insulin resistance and beta-cell function from fasting plasma glucose and insulin concentrations in man. Diabetologia 1985, 28, 412–419. [Google Scholar] [CrossRef]
- Jorgensen, A.B.; Frikke-Schmidt, R.; West, A.S.; Grande, P.; Nordestgaard, B.G.; Tybjaerg-Hansen, A. Genetically elevated non-fasting triglycerides and calculated remnant cholesterol as causal risk factors for myocardial infarction. Eur. Heart J. 2013, 34, 1826–1833. [Google Scholar] [CrossRef]
- Alberti-Fidanza, A.; Fidanza, F. Mediterranean Adequacy Index of Italian diets. Public Health Nutr. 2004, 7, 937–941. [Google Scholar] [CrossRef]
- Alberti, A.; Fruttini, D.; Fidanza, F. The Mediterranean Adequacy Index: Further confirming results of validity. Nutr. Metab. Cardiovasc. Dis. NMCD 2009, 19, 61–66. [Google Scholar] [CrossRef]
- Third Report of the National Cholesterol Education Program (NCEP) Expert Panel on Detection, Evaluation, and Treatment of High Blood Cholesterol in Adults (Adult Treatment Panel III) final report. Circulation 2002, 106, 3143–3421. [CrossRef]
- Romero-Gómez, M.; Zelber-Sagi, S.; Trenell, M. Treatment of NAFLD with diet, physical activity and exercise. J. Hepatol. 2017, 67, 829–846. [Google Scholar] [CrossRef] [PubMed]
- Healthy Diet- World Health Organization. Available online: https://www.who.int/news-room/fact-sheets/detail/healthy-diet (accessed on 12 May 2020).
- Gomez-Marin, B.; Gomez-Delgado, F.; Lopez-Moreno, J.; Alcala-Diaz, J.F.; Jimenez-Lucena, R.; Torres-Pena, J.D.; Garcia-Rios, A.; Ortiz-Morales, A.M.; Yubero-Serrano, E.M.; Del Mar Malagon, M.; et al. Long-term consumption of a Mediterranean diet improves postprandial lipemia in patients with type 2 diabetes: The Cordioprev randomized trial. Am. J. Clin. Nutr. 2018, 108, 963–970. [Google Scholar] [CrossRef] [PubMed]
- Roche, H.M. Fatty acids and the metabolic syndrome. Proc. Nutr. Soc. 2005, 64, 23–29. [Google Scholar] [CrossRef]
- Rosenson, R.S.; Davidson, M.H.; Hirsh, B.J.; Kathiresan, S.; Gaudet, D. Genetics and causality of triglyceride-rich lipoproteins in atherosclerotic cardiovascular disease. J. Am. Coll. Cardiol. 2014, 64, 2525–2540. [Google Scholar] [CrossRef] [PubMed]
- Catapano, A.L.; Graham, I.; De Backer, G.; Wiklund, O.; Chapman, M.J.; Drexel, H.; Hoes, A.W.; Jennings, C.S.; Landmesser, U.; Pedersen, T.R.; et al. 2016 ESC/EAS Guidelines for the Management of Dyslipidaemias. Eur. Heart J. 2016, 37, 2999–3058. [Google Scholar] [CrossRef]
- Eckel, R.H.; Jakicic, J.M.; Ard, J.D.; de Jesus, J.M.; Houston Miller, N.; Hubbard, V.S.; Lee, I.M.; Lichtenstein, A.H.; Loria, C.M.; Millen, B.E.; et al. 2013 AHA/ACC guideline on lifestyle management to reduce cardiovascular risk: A report of the American College of Cardiology/American Heart Association Task Force on Practice Guidelines. Circulation 2014, 129, S76–S99. [Google Scholar] [CrossRef]
- Mente, A.; de Koning, L.; Shannon, H.S.; Anand, S.S. A systematic review of the evidence supporting a causal link between dietary factors and coronary heart disease. Arch. Intern. Med. 2009, 169, 659–669. [Google Scholar] [CrossRef]
- Mensink, R.P.; Zock, P.L.; Kester, A.D.; Katan, M.B. Effects of dietary fatty acids and carbohydrates on the ratio of serum total to HDL cholesterol and on serum lipids and apolipoproteins: A meta-analysis of 60 controlled trials. Am. J. Clin. Nutr. 2003, 77, 1146–1155. [Google Scholar] [CrossRef]
- Klop, B.; do Rego, A.T.; Cabezas, M.C. Alcohol and plasma triglycerides. Curr. Opin. Lipidol. 2013, 24, 321–326. [Google Scholar] [CrossRef]
- Ko, G.J.; Kalantar-Zadeh, K.; Goldstein-Fuchs, J.; Rhee, C.M. Dietary Approaches in the Management of Diabetic Patients with Kidney Disease. Nutrients 2017, 9, 824. [Google Scholar] [CrossRef]
- Shapiro, H.; Theilla, M.; Attal-Singer, J.; Singer, P. Effects of polyunsaturated fatty acid consumption in diabetic nephropathy. Nat. Rev. Nephrol. 2011, 7, 110–121. [Google Scholar] [CrossRef] [PubMed]
- Ross, A.B.; Godin, J.P.; Minehira, K.; Kirwan, J.P. Increasing whole grain intake as part of prevention and treatment of nonalcoholic Fatty liver disease. Int. J. Endocrinol. 2013, 2013, 585876. [Google Scholar] [CrossRef] [PubMed]
- Calinoiu, L.F.; Vodnar, D.C. Whole Grains and Phenolic Acids: A Review on Bioactivity, Functionality, Health Benefits and Bioavailability. Nutrients 2018, 10, 1615. [Google Scholar] [CrossRef] [PubMed]
- Rose, D.J. Impact of whole grains on the gut microbiota: The next frontier for oats? Br. J. Nutr. 2014, 112, S44–S49. [Google Scholar] [CrossRef]
- Federico, A.; Dallio, M.; Godos, J.; Loguercio, C.; Salomone, F. Targeting gut-liver axis for the treatment of nonalcoholic steatohepatitis: Translational and clinical evidence. Transl. Res. J. Lab. Clin. Med. 2016, 167, 116–124. [Google Scholar] [CrossRef]
- Sandesara, P.B.; Virani, S.S.; Fazio, S.; Shapiro, M.D. The Forgotten Lipids: Triglycerides, Remnant Cholesterol, and Atherosclerotic Cardiovascular Disease Risk. Endocr. Rev. 2019, 40, 537–557. [Google Scholar] [CrossRef]
- Maedler, K.; Oberholzer, J.; Bucher, P.; Spinas, G.A.; Donath, M.Y. Monounsaturated fatty acids prevent the deleterious effects of palmitate and high glucose on human pancreatic beta-cell turnover and function. Diabetes 2003, 52, 726–733. [Google Scholar] [CrossRef] [PubMed]
- Varbo, A.; Freiberg, J.J.; Nordestgaard, B.G. Extreme nonfasting remnant cholesterol vs extreme LDL cholesterol as contributors to cardiovascular disease and all-cause mortality in 90000 individuals from the general population. Clin Chem 2015, 61, 533–543. [Google Scholar] [CrossRef]
- Field, P.A.; Vasan, R.S. LDL-Cholesterol Is Not the Only Clinically Relevant Biomarker for Coronary Artery Disease or Acute Coronary Syndrome. Clin. Pharmacol. Ther. 2018, 104, 232–234. [Google Scholar] [CrossRef]
- Leon-Acuna, A.; Alcala-Diaz, J.F.; Delgado-Lista, J.; Torres-Pena, J.D.; Lopez-Moreno, J.; Camargo, A.; Garcia-Rios, A.; Marin, C.; Gomez-Delgado, F.; Caballero, J.; et al. Hepatic insulin resistance both in prediabetic and diabetic patients determines postprandial lipoprotein metabolism: From the CORDIOPREV study. Cardiovasc. Diabetol. 2016, 15, 68. [Google Scholar] [CrossRef]


| Variables * | Time | Diet | |||
|---|---|---|---|---|---|
| 1 C | 2 LGID | 3 MD | 4 LGIMD | ||
| Mean (SD) | Mean (SD) | Mean (SD) | Mean (SD) | ||
| N | 61 | 62 | 57 | 57 | |
| Age (years) | 59.15 (12.76) | 57.50 (10.44) | 59.07 (10.83) | 57.81 (9.77) | |
| Gender | |||||
| Female | 23 (38%) | 25 (40%) | 20 (35%) | 25 (44%) | |
| Male | 38 (62%) | 37 (60%) | 37 (65%) | 32 (56%) | |
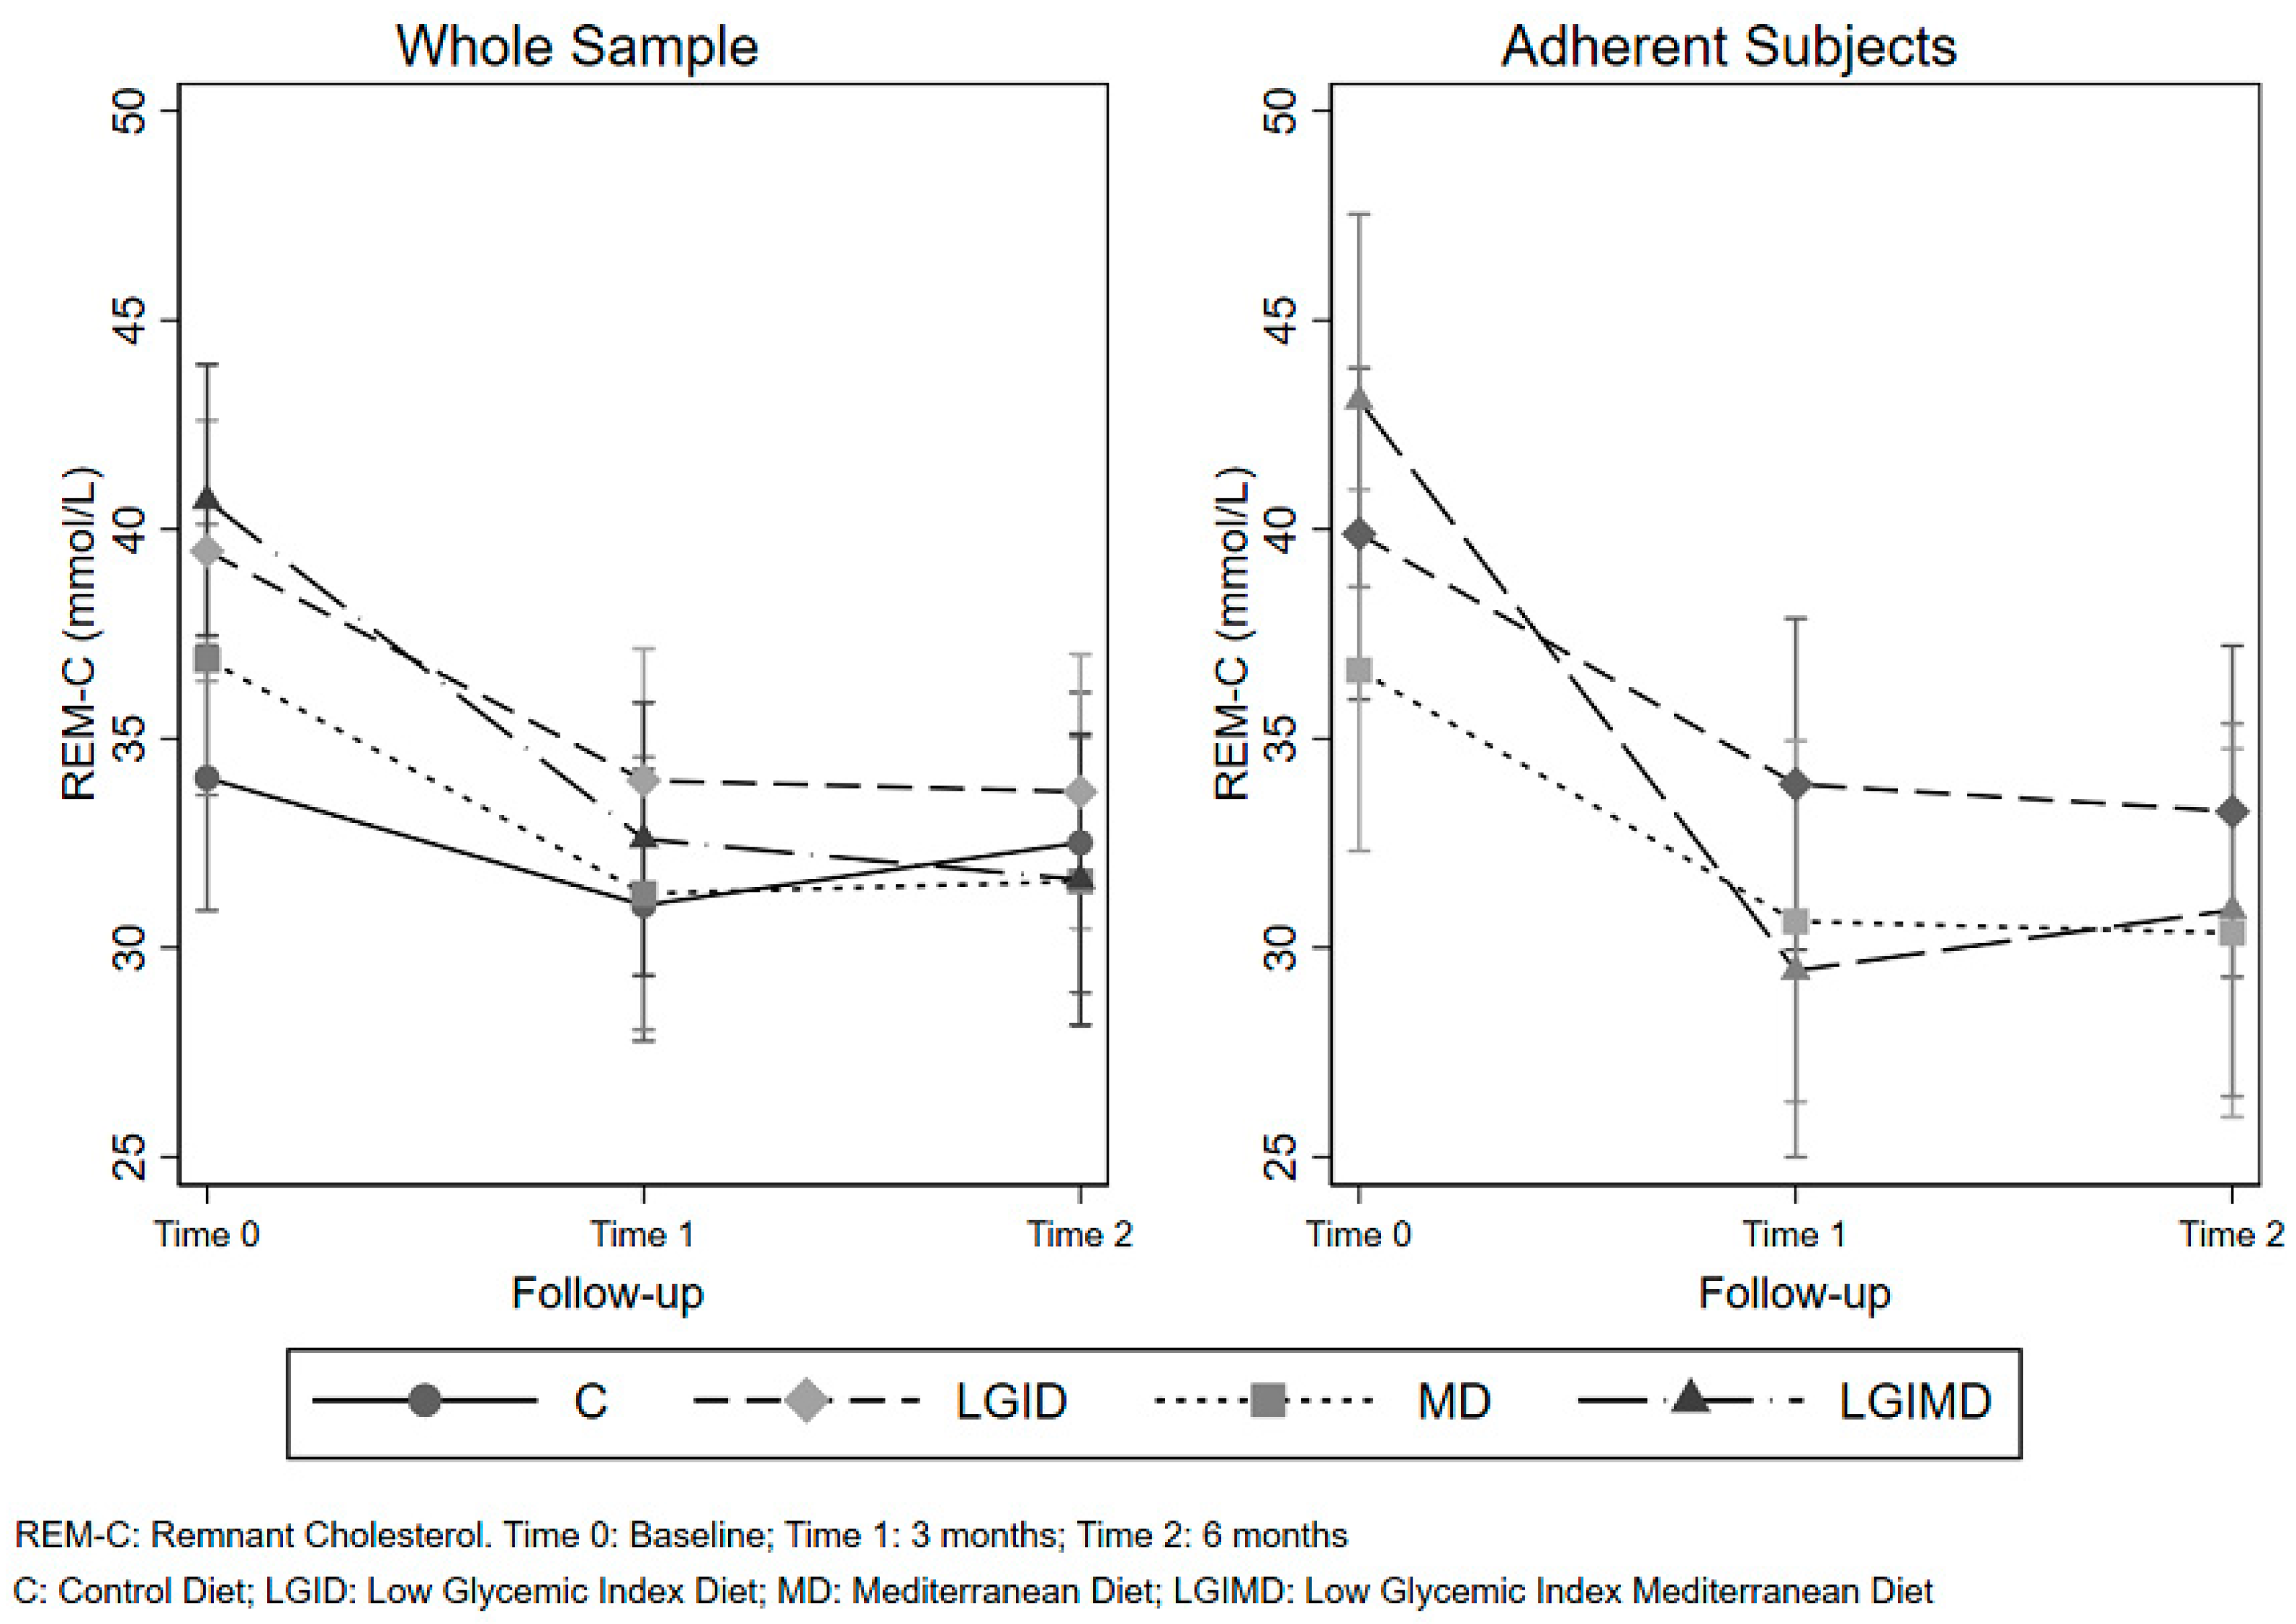
| 5 REM-C (mmol/L) | Baseline | 0.91 (0.56) | 1.04 (0.49) | 0.94 (0.57) | 1.05 (0.60) |
| 3 months | 0.81 (0.38) | 0.87 (0.58) | 0.80 (0.32) | 0.84 (0.46) | |
| 6 months | 0.79 (0.40) | 0.86 (0.47) | 0.84 (0.39) | 0.83 (0.45) | |
| 6 SBP (Hg mm) | Baseline | 135.90 (16.75) | 139.35 (17.33) | 134.74 (13.38) | 138.51 (17.58) |
| 3 months | 129.91 (14.31) | 128.00 (15.82) | 127.32 (15.07) | 127.50 (15.98) | |
| 6 months | 127.50 (11.35) | 125.88 (15.92) | 123.82 (15.02) | 128.00 (17.14) | |
| 7 DBP (Hg mm) | Baseline | 84.18 (9.97) | 86.29 (6.83) | 86.14 (7.50) | 87.37 (7.97) |
| 3 months | 76.49 (9.30) | 76.58 (7.89) | 77.32 (7.20) | 79.02 (8.17) | |
| 6 months | 76.46 (8.05) | 77.32 (9.39) | 75.88 (7.73) | 76.50 (9.11) | |
| 8 BMI | Baseline | 33.19 (4.33) | 33.42 (6.68) | 33.05 (3.83) | 34.92 (5.75) |
| 3 months | 31.93 (4.20) | 31.65 (6.12) | 31.31 (3.61) | 32.72 (5.40) | |
| 6 months | 31.15 (3.79) | 31.41 (6.09) | 31.01 (3.66) | 31.98 (4.93) | |
| 9 WC (cm) | Baseline | 106.70 (10.65) | 105.94 (11.40) | 104.78 (9.58) | 109.28 (12.89) |
| 3 months | 104.56 (10.02) | 102.35 (10.89) | 101.55 (9.34) | 105.68 (12.78) | |
| 6 months | 104.85 (9.21) | 102.04 (10.82) | 101.36 (9.26) | 104.51 (11.48) | |
| 10 TGL (mmol/L) | Baseline | 1.99 (1.22) | 2.26 (1.07) | 2.06 (1.25) | 2.29 (1.32) |
| 3 months | 1.77 (0.83) | 1.90 (1.27) | 1.75 (0.70) | 1.84 (1.00) | |
| 6 months | 1.73 (0.87) | 1.88 (1.03) | 1.83 (0.85) | 1.80 (0.98) | |
| 11 TC (mmol/L) | Baseline | 5.17 (1.13) | 5.44 (1.07) | 5.31 (1.08) | 5.12 (1.06) |
| 3 months | 4.98 (1.03) | 5.04 (1.13) | 5.01 (0.81) | 5.00 (0.90) | |
| 6 months | 4.83 (0.91) | 5.11 (1.14) | 5.15 (0.78) | 5.00 (0.94) | |
| 12 HDL-C (mmol/L) | Baseline | 1.27 (0.33) | 1.22 (0.25) | 1.23 (0.24) | 1.20 (0.33) |
| 3 months | 1.34 (0.50) | 1.24 (0.30) | 1.28 (0.27) | 1.22 (0.27) | |
| 6 months | 1.17 (0.31) | 1.26 (0.23) | 1.27 (0.26) | 1.24 (0.30) | |
| 13 LDL-C (mmol/L) | Baseline | 2.98 (0.86) | 3.18 (0.89) | 3.14 (0.82) | 2.90 (0.95) |
| 3 months | 2.82 (0.83) | 2.93 (0.97) | 2.92 (0.77) | 2.94 (0.78) | |
| 6 months | 2.86 (0.72) | 2.98 (0.94) | 3.03 (0.82) | 2.93 (0.87) | |
| 14 HOMA-IR | Baseline | 3.94 (3.15) | 4.53 (2.07) | 4.31 (3.72) | 4.99 (3.44) |
| 3 months | 3.44 (2.61) | 3.26 (1.67) | 2.97 (1.53) | 3.55 (2.54) | |
| 6 months | 3.07 (3.01) | 3.49 (3.49) | 3.10 (2.10) | 3.64 (3.34) | |
| 15 VAT | Baseline | 64.53 (17.86) | 59.04 (21.02) | 62.10 (17.98) | 63.26 (16.96) |
| 3 months | 56.58 (16.21) | 53.97 (14.74) | 54.70 (15.30) | 57.03 (13.89) | |
| 6 months | 56.89 (17.20) | 54.34 (13.71) | 55.07 (14.85) | 59.94 (18.42) | |
| Glucose (mmol/L) | Baseline | 6.27 (1.36) | 6.89 (1.86) | 6.39 (1.51) | 7.11 (2.24) |
| 3 months | 5.83 (1.18) | 5.98 (0.89) | 5.78 (1.25) | 6.37 (1.67) | |
| 6 months | 5.75 (1.58) | 5.90 (0.91) | 5.75 (1.15) | 6.36 (1.66) | |
| 16 APO B (g/L) | Baseline | 1.02 (0.25) | 1.12 (0.28) | 1.09 (0.27) | 1.06 (0.29) |
| 3 months | 0.91 (0.27) | 0.94 (0.31) | 0.95 (0.26) | 0.98 (0.29) | |
| 6 months | 0.94 (0.24) | 0.94 (0.26) | 0.94 (0.26) | 0.94 (0.25) | |
| 17 HbA1c (mmol/mol) | Baseline | 5.66 (0.56) | 6.16 (1.09) | 5.92 (0.90)) | 6.42 (1.42) |
| 3 months | 5.67 (0.64) | 5.85 (0.89) | 5.69 (0.34) | 5.98 (0.91) | |
| 6 months | 5.54 (0.56) | 5.76 (0.59) | 5.67 (0.56) | 5.97 (0.84) | |
| 18 NCEP-ATP III criteria | |||||
| 0–2 | Baseline | 19 (31%) | 7 (11%) | 12 (21%) | 14 (25%) |
| 3 months | 29 (48%) | 25 (40%) | 34 (60%) | 23 (40%) | |
| 6 months | 28 (46%) | 30 (48%) | 30 (53%) | 24 (42%) | |
| 3 | Baseline | 26 (43%) | 22 (35%) | 26 (46%) | 13 (23%) |
| 3 months | 21 (34%) | 24 (39%) | 13 (23%) | 15 (26%) | |
| 6 months | 10 (16%) | 16 (26%) | 15 (26%) | 14 (25%) | |
| 4 | Baseline | 12 (20%) | 26 (42%) | 18 (32%) | 21 (37%) |
| 3 months | 8 (13%) | 12 (19%) | 9 (16%) | 13 (23%) | |
| 6 months | 22 (36%) | 15 (24%) | 12 (21%) | 12 (21%) | |
| 5 | Baseline | 4 (7%) | 7 (11%) | 1 (2%) | 9 (16%) |
| 3 months | 3 (5%) | 1 (2%) | 1 (2%) | 6 (11%) | |
| 6 months | 1 (2%) | 1 (2%) | 0 (0%) | 7 (12%) | |
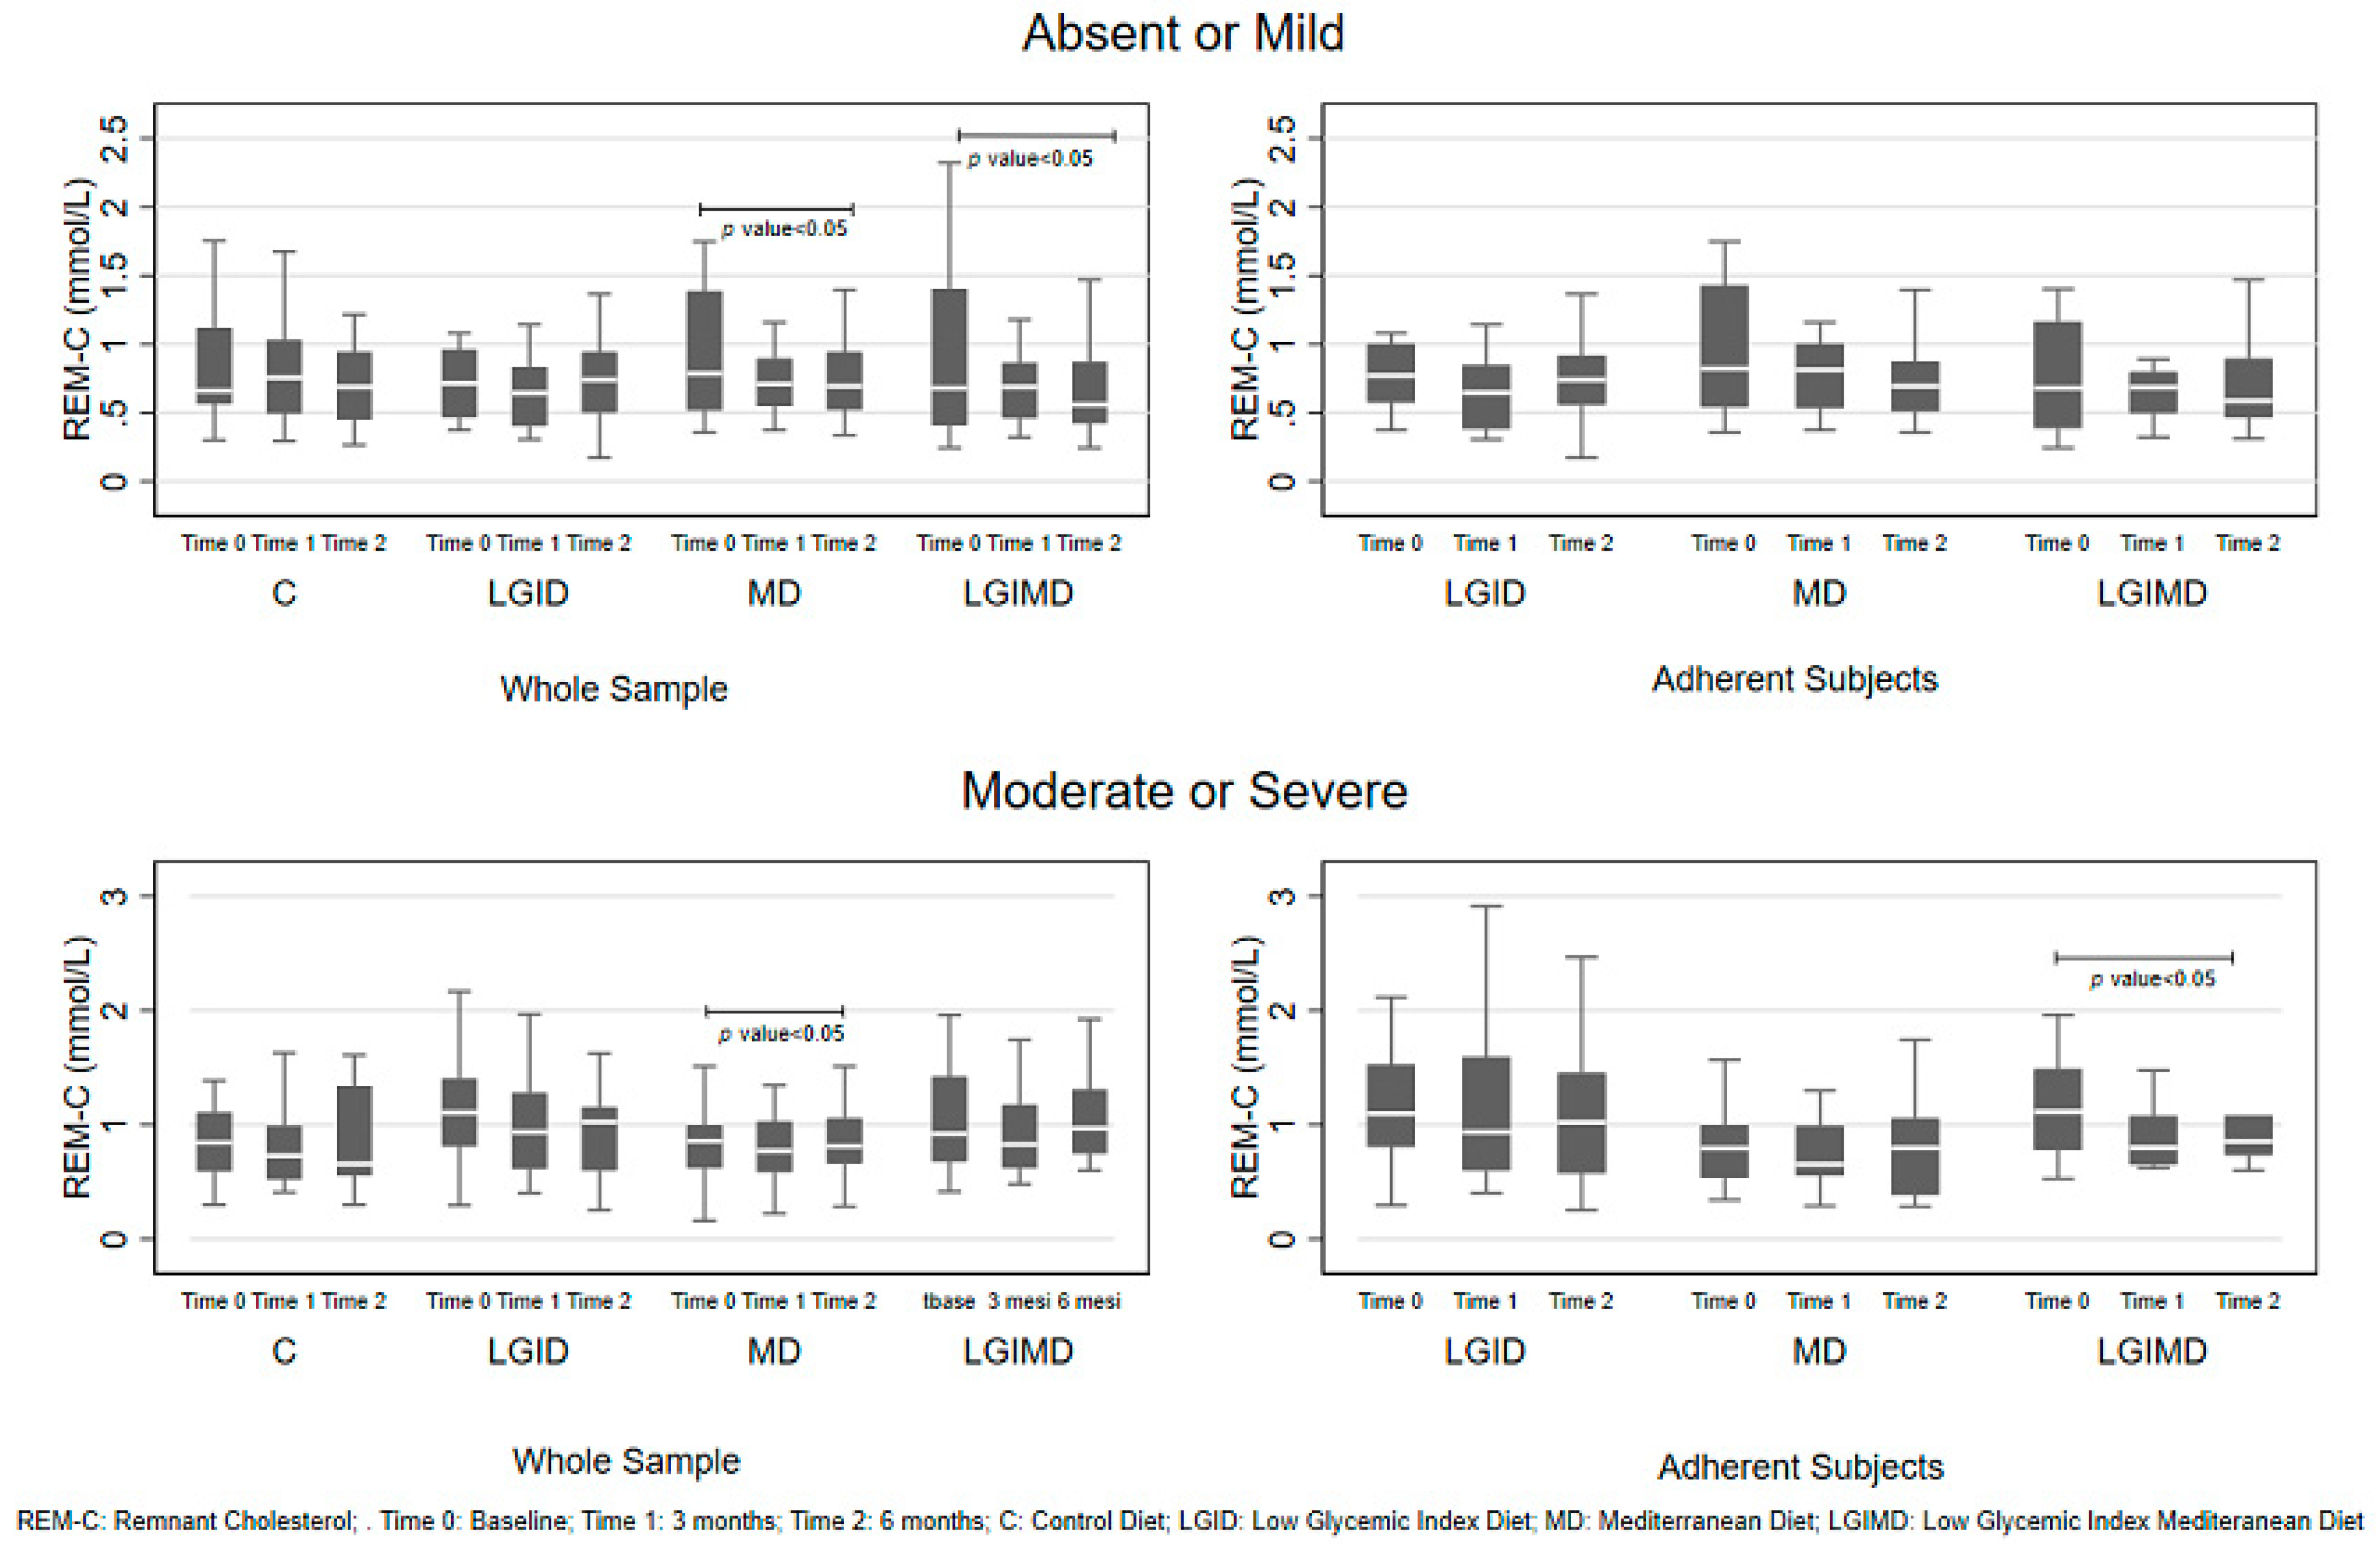
| NAFLD 1 | Time | Control Diet | Intervention Subjects | Adherent Subjects | |||
|---|---|---|---|---|---|---|---|
| N (%) | Mean (SD) | N (%) | Mean (SD) | N (%) | Mean (SD) | ||
| Absent | Baseline | 12 (23.53) | 0.67 (0.39) | 30 (21.28) | 0.87 (0.54) | 18 (20.93) | 0.80 (0.52) |
| 3 months | 22 (43.14) | 0.80 (0.39) | 54 (38.30) | 0.75 (0.44) | 30 (34.88) | 0.71 (0.31) | |
| 6 months | 17 (33.33) | 0.61 (0.23) | 57 (40.43) | 0.71 (0.31) | 38 (44.19) | 0.73 (0.29) | |
| Mild | Baseline | 14 (37.84) | 0.94 (0.38) | 30 (27.78) | 0.95 (0.57) | 20 (25.32) | 0.93 (0.38) |
| 3 months | 12 (32.43) | 0.79 (0.32) | 44 (40.74) | 0.77 (0.46) | 33 (41.77) | 0.72 (0.30) | |
| 6 months | 11 (29.73) | 0.92 (0.45) | 34 (31.48) | 0.76 (0.43) | 26 (32.91) | 0.71 (0.34) * | |
| Moderate | Baseline | 24 (45.28) | 0.96 (0.71) | 75 (44.91) | 1.05 (0.50) | 45 (45.45) | 1.08 (0.56) |
| 3 months | 15 (28.30 | 0.79 (0.44) | 53 (31.74) | 0.88 (0.44) | 30 (30.30) | 0.89 (0.53) | |
| 6 months | 14 (26.42) | 0.82 (0.39) | 39 (23.35) | 0.98 (0.47) | 24 (24.24) | 0.90 (0.50) | |
| Severe | Baseline | 11 (44.0) | 1.02 (0.52) | 41 (46.07) | 1.09 (0.63) | 17 (48.57) | 1.25 (0.81) |
| 3 months | 8 (32.0) | 0.90 (0.39) | 21 (23.60) | 1.10 (0.53) | 7 (20.00) | 1.37 (0.67) | |
| 6 months | 6 (24.0) | 1.03 (0.54) | 27 (30.34) | 1.03 (0.51) | 11 (31.43) | 1.23 (0.65) | |
| Remnant Cholesterol | Whole Sample | Adherent Subjects | ||||||
|---|---|---|---|---|---|---|---|---|
| β | SE | p-Value | (CI 95%) | β | SE | p-Value | (CI 95%) | |
| Diet | ||||||||
| 1 C | Referent | |||||||
| 2 LGID | −13.91 | 10.27 | 0.176 | (−34.11; 6.28) | Referent | |||
| 3 MD | −23.76 | 10.28 | 0.021 | (−43.97; −3.56) | 37.02 | 10.39 | 0.000 | (16.52; 57.51) |
| 4 LGIMD | −36.40 | 10.28 | 0.000 | (−56.61; −16.20) | 38.66 | 10.40 | 0.000 | (18.15; 59.18) |
| Time | ||||||||
| Baseline | Referent | Referent | ||||||
| 3 months | −3.04 | 2.32 | 0.190 | (−7.56; 1.51) | −5.98 | 2.84 | 0.036 | (−11.58; −0.38) |
| 6 months | −1.55 | 2.47 | 0.532 | (−6.41; 3.32) | −6.64 | 2.84 | 0.020 | (−12.24; −1.04) |
| Time #Diet: | ||||||||
| (3 Months vs. Baseline) # C | −3.04 | 2.32 | 0.190 | (−7.59; 1.51) | ||||
| (6 Months vs. Baseline) # C | −1.55 | 2.47 | 0.532 | (−6.41; 3.32) | ||||
| (3 Months vs. Baseline) # LGID | −5.49 | 2.26 | 0.016 | (−9.92; −1.05) | −5.98 | 2.84 | 0.036 | (−11.58; −0.38) |
| (6 Months vs. Baseline) # LGID | −5.75 | 2.32 | 0.013 | (−10.31; −1.20) | −6.64 | 2.84 | 0.020 | (−12.24; −1.04) |
| (3 Months vs. Baseline) # MD | −5.58 | 2.34 | 0.017 | (−10.18; −0.99) | −6.00 | 3.09 | 0.054 | (−12.10; 0.10) |
| (6 Months vs. Baseline) # MD | −5.30 | 2.42 | 0.029 | (−10.06; −0.54) | −6.28 | 3.13 | 0.046 | (−12.45; −0.10) |
| (3 Months vs. Baseline) # LGIMD | −8.10 | 2.34 | 0.001 | (−12.69; −3.51) | −13.63 | 3.19 | 0.000 | (−19.93; −7.32) |
| (6 Months vs. Baseline) # LGIMD | −9.07 | 2.44 | 0.000 | (−13.87; −4.28) | −12.18 | 3.19 | 0.000 | (−18.48; −5.88) |
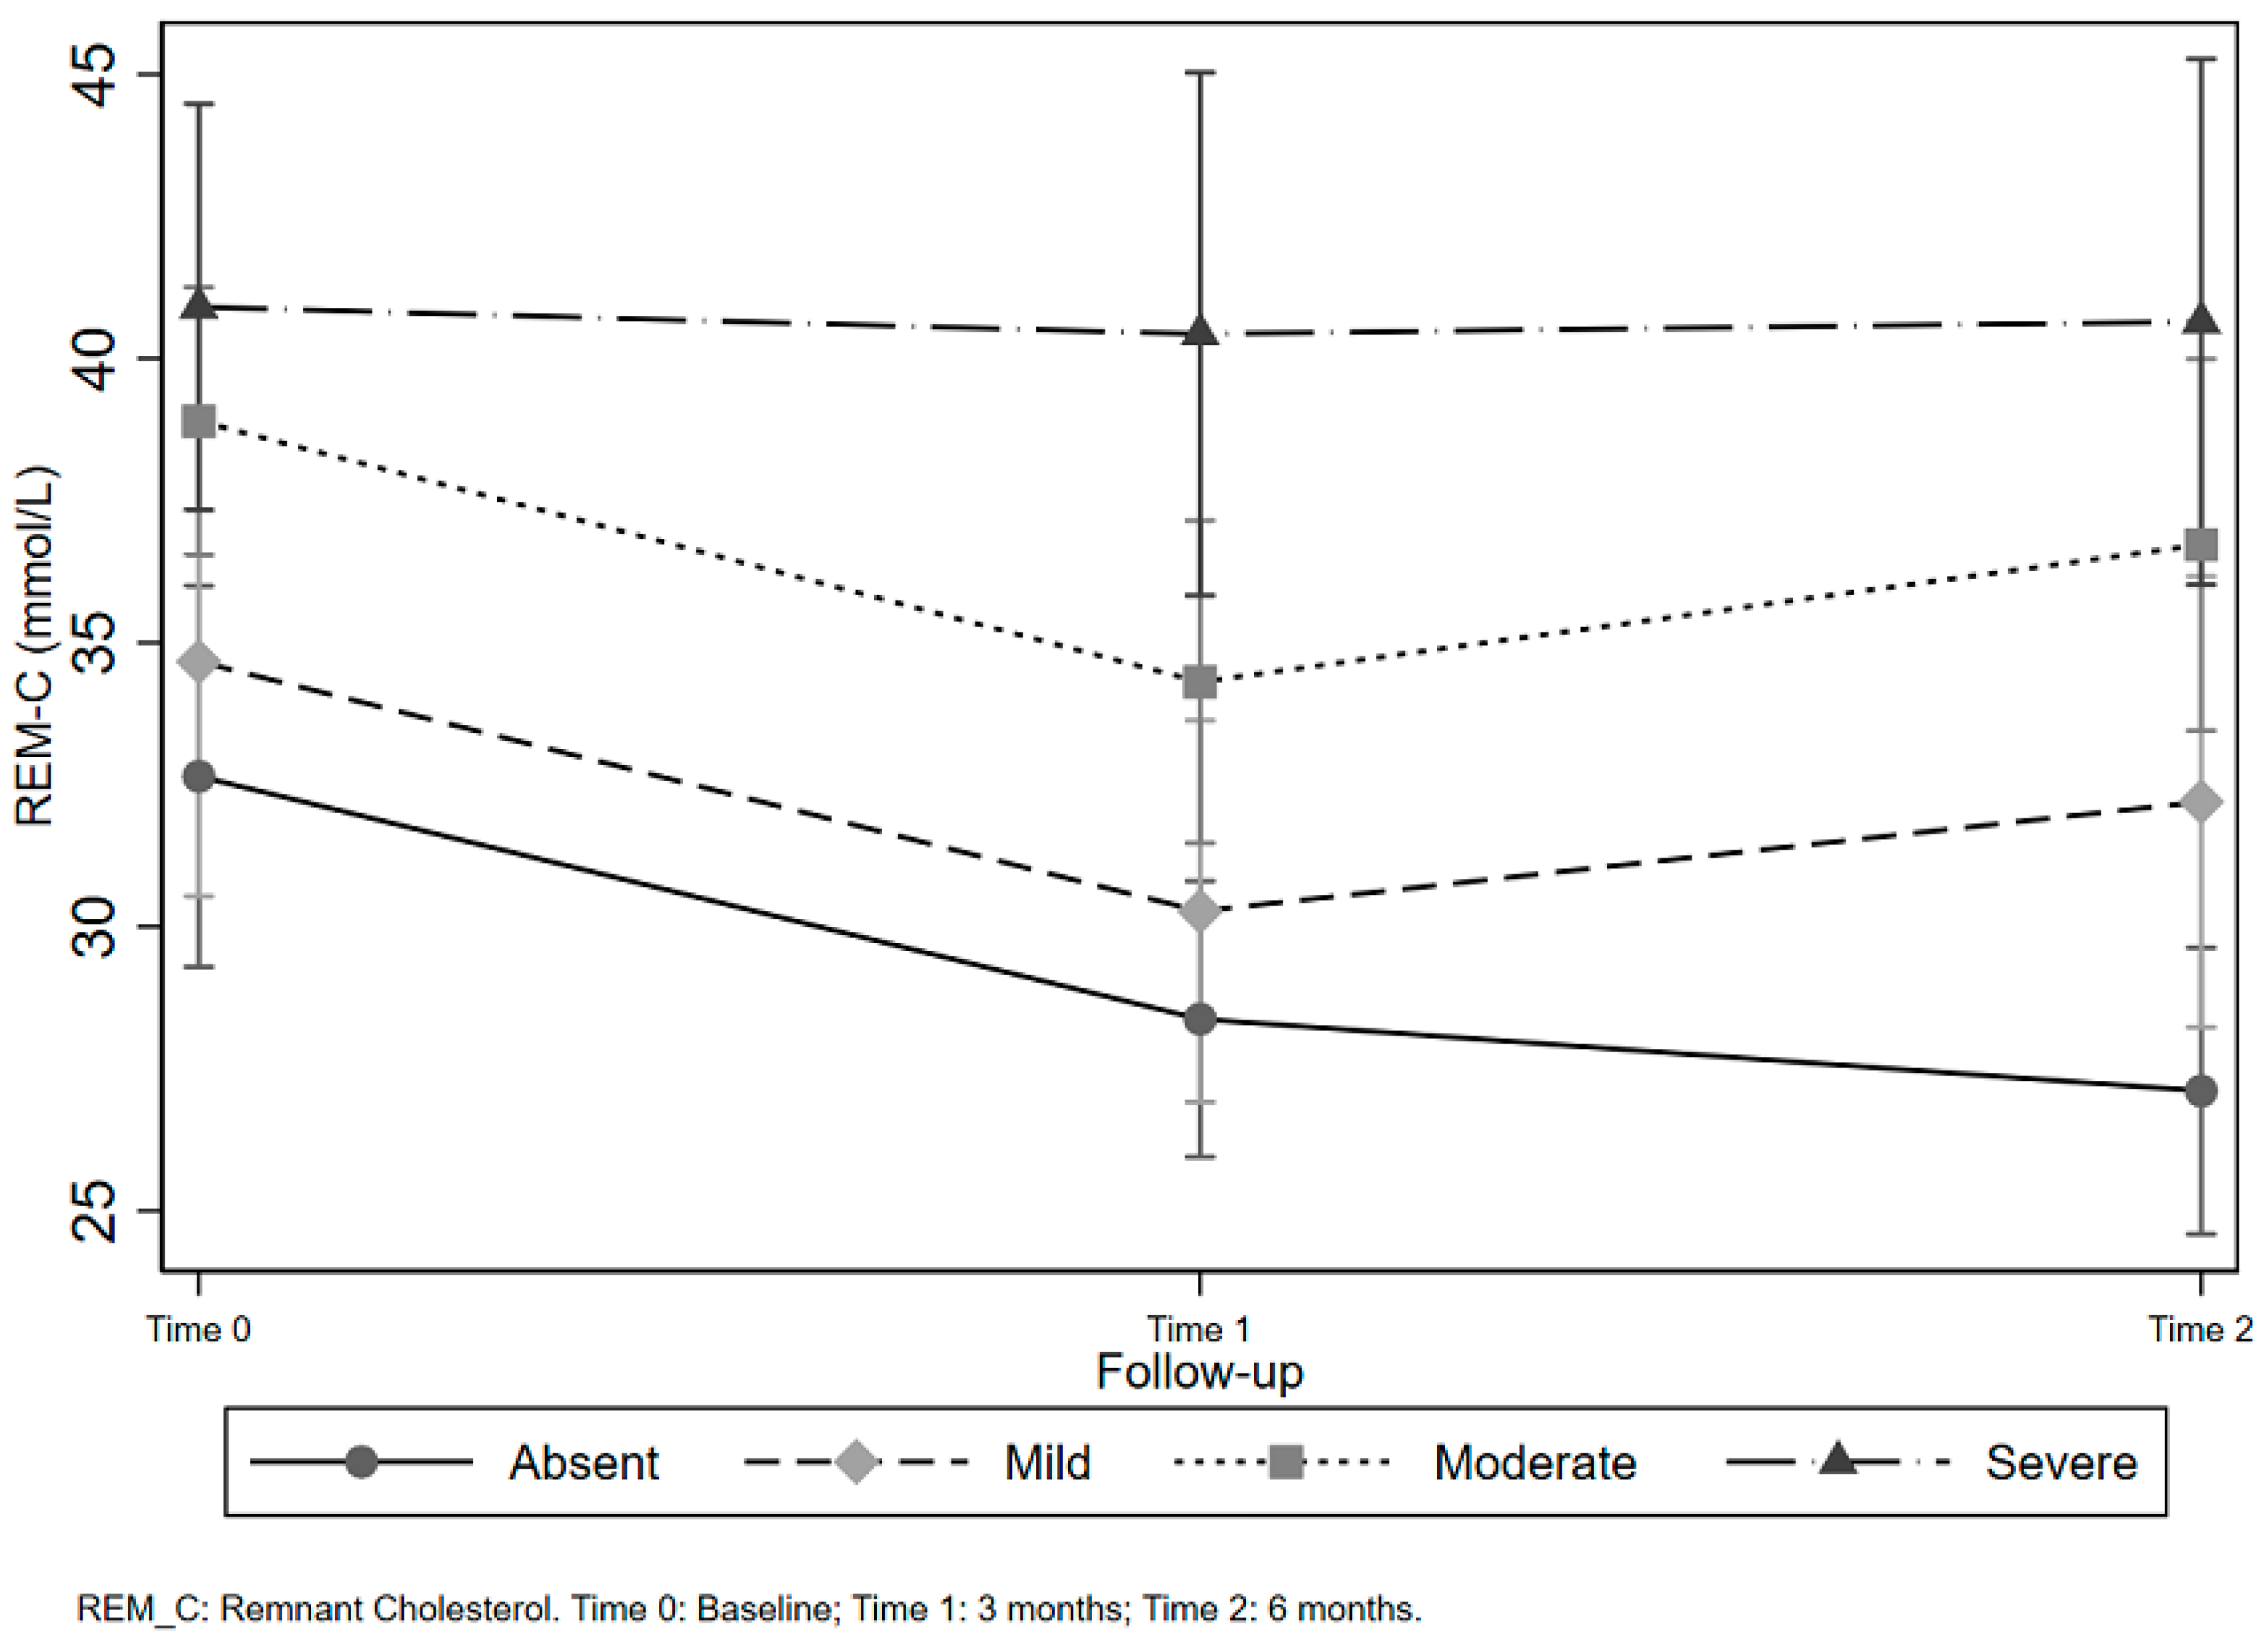
| Remnant Cholesterol | Whole Sample | Adherent Subjects | ||||||
|---|---|---|---|---|---|---|---|---|
| β | SE | p-Value | (CI 95%) | β | SE | p-Value | (CI 95%) | |
| 1 NAFLD | ||||||||
| Absent | Referent | Referent | ||||||
| Mild | −15.47 | 12.15 | 0.204 | (−39.41; 8.46) | 35.97 | 11.93 | 0.003 | (12.27; 59.67) |
| Moderate | −5.89 | 14.04 | 0.675 | (−33.56; 21.77) | 41.27 | 13.04 | 0.002 | (15.38; 67.15) |
| Severe | 2.93 | 13.86 | 0.833 | (−24.39; 30.24) | 23.00 | 11.80 | 0.054 | (−0.41; 46.42) |
| Time | ||||||||
| Baseline | Referent | Referent | ||||||
| 3 months | −4.27 | 2.16 | 0.049 | (−8.52; −0.019) | −4.56 | 3.26 | 0.165 | (−11.03; 1.91) |
| 6 months | −5.53 | 2.24 | 0.014 | (−9.95; −1.11) | −5.13 | 3.32 | 0.126 | (−11.73; 1.46) |
| Time # NAFLD: | ||||||||
| (3 months vs. Baseline) Absent | −4.27 | 2.16 | 0.049 | (−8.52; −0.019) | −4.56 | 3.26 | 0.165 | (−11.03; 1.91) |
| (6 months vs. Baseline) Absent | −5.53 | 2.24 | 0.014 | (−9.95; −1.11) | −5.13 | 3.32 | 0.126 | (−11.73; 1.46) |
| (3 months vs. Baseline) Mild | −4.39 | 3.00 | 0.145 | (−10.31; 1.52) | −5.46 | 3.80 | 0.154 | (−13.01; 2.09) |
| (6 months vs. Baseline) Mild | −2.47 | 3.28 | 0.452 | (−8.92; 3.99) | −3.15 | 3.90 | 0.421 | (−10.91; 4.60) |
| (3 months vs. Baseline) Moderate | −4.59 | 2.06 | 0.027 | (−8.66; −0.52) | −6.17 | 2.99 | 0.042 | (−12.11; −0.23) |
| (6 months vs. Baseline) Moderate | −2.18 | 2.23 | 0.331 | (−6.58; 2.23) | −6.80 | 3.14 | 0.033 | (−13.02; −0.57) |
| (3 months vs. Baseline) Severe | −0.47 | 3.27 | 0.885 | (−6.92; 5.97) | 12.33 | 5.94 | 0.041 | (0.53; 24.13) |
| (6 months vs. Baseline) Severe | −0.26 | 3.43 | 0.940 | (−7.01; 6.49) | 5.97 | 5.52 | 0.282 | (−4.99; 16.94) |
© 2020 by the authors. Licensee MDPI, Basel, Switzerland. This article is an open access article distributed under the terms and conditions of the Creative Commons Attribution (CC BY) license (http://creativecommons.org/licenses/by/4.0/).
Share and Cite
Campanella, A.; Iacovazzi, P.A.; Misciagna, G.; Bonfiglio, C.; Mirizzi, A.; Franco, I.; Bianco, A.; Sorino, P.; Caruso, M.G.; Cisternino, A.M.; et al. The Effect of Three Mediterranean Diets on Remnant Cholesterol and Non-Alcoholic Fatty Liver Disease: A Secondary Analysis. Nutrients 2020, 12, 1674. https://doi.org/10.3390/nu12061674
Campanella A, Iacovazzi PA, Misciagna G, Bonfiglio C, Mirizzi A, Franco I, Bianco A, Sorino P, Caruso MG, Cisternino AM, et al. The Effect of Three Mediterranean Diets on Remnant Cholesterol and Non-Alcoholic Fatty Liver Disease: A Secondary Analysis. Nutrients. 2020; 12(6):1674. https://doi.org/10.3390/nu12061674
Chicago/Turabian StyleCampanella, Angelo, Palma A. Iacovazzi, Giovanni Misciagna, Caterina Bonfiglio, Antonella Mirizzi, Isabella Franco, Antonella Bianco, Paolo Sorino, Maria G. Caruso, Anna M. Cisternino, and et al. 2020. "The Effect of Three Mediterranean Diets on Remnant Cholesterol and Non-Alcoholic Fatty Liver Disease: A Secondary Analysis" Nutrients 12, no. 6: 1674. https://doi.org/10.3390/nu12061674
APA StyleCampanella, A., Iacovazzi, P. A., Misciagna, G., Bonfiglio, C., Mirizzi, A., Franco, I., Bianco, A., Sorino, P., Caruso, M. G., Cisternino, A. M., Buongiorno, C., Liuzzi, R., & Osella, A. R. (2020). The Effect of Three Mediterranean Diets on Remnant Cholesterol and Non-Alcoholic Fatty Liver Disease: A Secondary Analysis. Nutrients, 12(6), 1674. https://doi.org/10.3390/nu12061674