Association between Self-Reported Eating Rate, Energy Intake, and Cardiovascular Risk Factors in a Multi-Ethnic Asian Population


 , and
, and
Abstract
1. Introduction
2. Materials and Methods
2.1. Study Population
2.2. Assessment of Self-Reported Eating Rate, Diet and Covariates
2.3. Assessment of Body Composition, Blood Pressure, and Lipid Profiles
2.4. Statistical Analyses
3. Results
4. Discussion
5. Conclusions
Author Contributions
Funding
Acknowledgments
Conflicts of Interest
References
- World Health Organization. Obesity and Overweight. Key facts. Available online: https://www.who.int/en/news-room/fact-sheets/detail/obesity-and-overweight (accessed on 3 March 2020).
- Hruby, A.; Manson, J.E.; Qi, L.; Malik, V.S.; Rimm, E.B.; Sun, Q.; Willett, W.C.; Hu, F.B. Determinants and Consequences of Obesity. Am. J. Public Health 2016, 106, 1656–1662. [Google Scholar] [CrossRef] [PubMed]
- Romieu, I.; Dossus, L.; Barquera, S.; Blottière, H.M.; Franks, P.W.; Gunter, M.; Hwalla, N.; Hursting, S.D.; Leitzmann, M.; Margetts, B.; et al. Energy balance and obesity: What are the main drivers? Cancer Causes Control 2017, 28, 247–258. [Google Scholar] [CrossRef] [PubMed]
- Swinburn, B.; Caterson, I.; Seidell, J.; James, W. Diet, nutrition and the prevention of excess weight gain and obesity. Public Health Nutr. 2004, 7, 123–146. [Google Scholar] [PubMed]
- Public Health England. Sugar Reduction: The Evidence for Action; Public Health England, Wellington House: London, UK, 2015.
- Brownell, K.D. LEARN Program for Weight Management 2000; American Health: Dallas, TX, USA, 2000. [Google Scholar]
- Spiegel, T.A.; Wadden, T.A.; Foster, G.D. Objective measurement of eating rate during behavioral treatment of obesity. Behav. Ther. 1991, 22, 61–67. [Google Scholar] [CrossRef]
- Llewellyn, C.H.; van Jaarsveld, C.H.; Boniface, D.; Carnell, S.; Wardle, J. Eating rate is a heritable phenotype related to weight in children. Am. J. Clin. Nutr. 2008, 88, 1560–1566. [Google Scholar] [CrossRef]
- Forde, C.G.; Fogel, A.; McCrickerd, K. Children’s Eating Behaivors and Energy Intake: Overlapping Influences and Opportunities for Intervention. In Nestle Nutr. Inst. Workshop Ser.; Karger Press: Basel, Switzerland, 2019; Volume 91, pp. 55–67. [Google Scholar]
- Ioakimidis, I.; Zandian, M.; Eriksson-Marklund, L.; Bergh, C.; Grigoriadis, A.; Sodersten, P. Description of chewing and food intake over the course of a meal. Physiol. Behav. 2011, 104, 761–769. [Google Scholar] [CrossRef]
- Guy-Grand, B.; Lehnert, V.; Doassans, M.; Bellisle, F. Type of Test-meal Affects Palatability and Eating Style in Humans. Appetite 1994, 22, 125–134. [Google Scholar] [CrossRef]
- McCrickerd, K.; Forde, C.G. Consistency of Eating Rate, Oral Processing Behaviours and Energy Intake across Meals. Nutrients 2017, 9, 891. [Google Scholar] [CrossRef]
- Ketel, E.C.; Aguayo-Mendoza, M.G.; de Wijk, R.A.; de Graaf, C.; Piqueras-Fiszman, B.; Stieger, M. Age, gender, ethnicity and eating capability influence oral processing behaviour of liquid, semi-solid and solid foods differently. Food Res. Int. 2019, 119, 143–151. [Google Scholar] [CrossRef]
- Otsuka, R.; Tamakoshi, K.; Yatsuya, H.; Murata, C.; Sekiya, A.; Wada, K.; Zhang, H.M.; Matsushita, K.; Sugiura, K.; Takefuji, S.; et al. Eating Fast Leads to Obesity: Findings Based on Self-administered Questionnaires among Middle-aged Japanese Men and Women. J. Epidemiol. 2006, 16, 117–124. [Google Scholar] [CrossRef]
- van den Boer, J.H.W.; Kranendonk, J.; van de Wiel, A.; Feskens, E.J.M.; Geelen, A.; Mars, M. Self-reported eating rate is associated with weight status in a Dutch population: A validation study and a cross-sectional study. Int. J. Behav. Nutr. Phys. Act. 2017, 14, 121. [Google Scholar] [CrossRef] [PubMed]
- Maruyama, K.; Sato, S.; Ohira, T.; Maeda, K.; Noda, H.; Kubota, Y.; Nishimura, S.; Kitamura, A.; Kiyama, M.; Okada, T.; et al. The joint impact on being overweight of self-reported behaviours of eating quickly and eating until full: Cross sectional survey. BMJ 2008, 337, a2002. [Google Scholar] [CrossRef] [PubMed]
- Sasaki, S.; Katagiri, A.; Tsuji, T.; Shimoda, T.; Amano, K. Self-reported rate of eating correlates with body mass index in 18-y-old Japanese women. Int. J. Obes. 2003, 27, 1405–1410. [Google Scholar] [CrossRef] [PubMed]
- Gerace, T.A.; George, V.A. Predictors of Weight Increases over 7 Years in Fire Fighters and Paramedics. J. Prev. Med. 1996, 25, 593–600. [Google Scholar] [CrossRef]
- Tanihara, S.; Imatoh, T.; Miyazaki, M.; Babazono, A.; Momose, Y.; Baba, M.; Uryu, Y.; Une, H. Retrospective longitudinal study on the relationship between 8-year weight change and current eating speed. Appetite 2011, 57, 179–183. [Google Scholar] [CrossRef]
- Mochizuki, K.; Misaki, Y.; Miyauchi, R.; Takabe, S.; Shimada, M.; Kuriki, K.; Ichikawa, Y.; Goda, T. A higher rate of eating is associated with higher circulating interluekin-1β concentrations in Japanese men not being treated for metabolic diseases. Nutrition 2012, 28, 978–983. [Google Scholar] [CrossRef]
- Zhu, B.; Haruyama, Y.; Muto, T.; Yamazaki, T. Association between eating speed and metabolic syndrome in a three-year population-based cohort study. J. Epidemiol. 2015, 25, 332–336. [Google Scholar] [CrossRef]
- Lee, S.; Ko, B.-J.; Gong, Y.; Han, K.; Lee, A.; Han, B.-D.; Yoon, Y.J.; Park, S.; Kim, J.-H.; Mantzoros, C.S. Self-reported eating speed in relation to non-alcoholic fatty liver disease in adults. Eur. J. Nutr. 2016, 55, 327–333. [Google Scholar] [CrossRef]
- Tan, K.H.X.; Tan, L.W.L.; Sim, X.; Tai, E.S.; Lee, J.J.-M.; Chia, K.S.; van Dam, R.M. Cohort Profile: The Singapore Multi-Ethnic Cohort (MEC) study. Int. J. Epidemiol. 2018, 47, 699–699j. [Google Scholar] [CrossRef]
- Whitton, C.; Ho, J.C.Y.; Tay, Z.; Rebello, S.A.; Lu, Y.; Ong, C.N.; van Dam, R.M. Relative Validity and Reproducibility of a Food Frequency Questionnaire for Assessing Dietary Intakes in a Multi-Ethnic Asian Population Using 24-h Dietary Recalls and Biomarkers. Nutrients 2017, 9, 1059. [Google Scholar] [CrossRef]
- Nang, E.E.; Gitau Ngunjiri, S.A.; Wu, Y.; Salim, A.; Tai, E.S.; Lee, J.; Van Dam, R.M. Validity of the International Physical Activity Questionnaire and the Singapore Prospective Study Program physical activity questionnaire in a multiethnic urban Asian population. BMC Med. Res. Methodol. 2011, 11, 141. [Google Scholar] [CrossRef] [PubMed]
- Ainsworth, B.E.; Haskell, W.L.; Whitt, M.C.; Irwin, M.L.; Swartz, A.M.; Strath, S.J.; O’Brien, W.L.; Bassett, D.R., Jr.; Schmitz, K.H.; Emplaincourt, P.O.; et al. Compendium of physical activities: An update of activity codes and MET intensities. Med. Sci.Sports Exerc. 2000, 32, S498–S504. [Google Scholar] [CrossRef] [PubMed]
- Whitton, C.; Rebello, S.A.; Lee, J.; Tai, E.S.; van Dam, R.M. A Healthy Asian A Posteriori Dietary Pattern Correlates with A Priori Dietary Patterns and Is Associated with Cardiovascular Disease Risk Factors in a Multiethnic Asian Population. J. Nutr. 2018, 148, 616–623. [Google Scholar] [CrossRef] [PubMed]
- World Health Organization. Appropriate body-mass index for Asian populations and its implications for policy and intervention strategies. Lancet (Lond. Engl.) 2004, 363, 157–163. [Google Scholar] [CrossRef]
- World Health Organization. Waist Circumference and Waist–hip Ratio: Report of a WHO Expert Consultation; Geneva, Switzerland, 8–11 December 2008; World Health Organization: Geneva, Switzerland, 2011. [Google Scholar]
- Leong, S.L.; Madden, C.; Gray, A.; Waters, D.; Horwath, C. Faster Self-Reported Speed of Eating Is Related to Higher Body Mass Index in a Nationwide Survey of Middle-Aged Women. J. Am. Diet. Assoc. 2011, 111, 1192–1197. [Google Scholar] [CrossRef] [PubMed]
- Nagahama, S.; Kurotani, K.; Pham, N.M.; Nanri, A.; Kuwahara, K.; Dan, M.; Nishiwaki, Y.; Mizoue, T. Self-reported eating rate and metabolic syndrome in Japanese people: Cross-sectional study. BMJ Open 2014, 4, e005241. [Google Scholar] [CrossRef]
- Ohkuma, T.; Hirakawa, Y.; Nakamura, U.; Kiyohara, Y.; Kitazono, T.; Ninomiya, T. Association between eating rate and obesity: A systematic review and meta-analysis. Int. J. Obes. 2015, 39, 1589. [Google Scholar] [CrossRef]
- Robinson, E.; Almiron-Roig, E.; Rutters, F.; de Graaf, C.; Forde, C.G.; Tudur Smith, C.; Nolan, S.J.; Jebb, S.A. A systematic review and meta-analysis examining the effect of eating rate on energy intake and hunger. Am. J. Clin. Nutr. 2014, 100, 123–151. [Google Scholar] [CrossRef]
- Bolhuis, D.P.; Forde, C.G.; Cheng, Y.; Xu, H.; Martin, N.; de Graaf, C. Slow Food: Sustained Impact of Harder Foods on the Reduction in Energy Intake over the Course of the Day. PLoS ONE 2014, 9, e93370. [Google Scholar] [CrossRef]
- Forde, C.G.; van Kuijk, N.; Thaler, T.; de Graaf, C.; Martin, N. Texture and savoury taste influences on food intake in a realistic hot lunch time meal. Appetite 2013, 60, 180–186. [Google Scholar] [CrossRef]
- McCrickerd, K.; Lim, C.M.; Leong, C.; Chia, E.M.; Forde, C.G. Texture-Based Differences in Eating Rate Reduce the Impact of Increased Energy Density and Large Portions on Meal Size in Adults. J. Nutr. 2017, 147, 1208–1217. [Google Scholar] [CrossRef] [PubMed]
- de Graaf, C. Texture and satiation: The role of oro-sensory exposure time. Physiol. Behav. 2012, 107, 496–501. [Google Scholar] [CrossRef] [PubMed]
- Morton, G.J.; Cummings, D.E.; Baskin, D.G.; Barsh, G.S.; Schwartz, M.W. Central nervous system control of food intake and body weight. Nature 2006, 443, 289–295. [Google Scholar] [CrossRef] [PubMed]
- Rolls, E.T. Sensory processing in the brain related to the control of food intake. Proc. Nutr. Soc. 2007, 66, 96–112. [Google Scholar] [CrossRef]
- Kokkinos, A.; le Roux, C.W.; Alexiadou, K.; Tentolouris, N.; Vincent, R.P.; Kyriaki, D.; Perrea, D.; Ghatei, M.A.; Bloom, S.R.; Katsilambros, N. Eating slowly increases the postprandial response of the anorexigenic gut hormones, peptide YY and glucagon-like peptide-1. J. Clin. Endocr. Metab. 2010, 95, 333–337. [Google Scholar] [CrossRef]
- Li, J.; Zhang, N.; Hu, L.; Li, Z.; Li, R.; Li, C.; Wang, S. Improvement in chewing activity reduces energy intake in one meal and modulates plasma gut hormone concentrations in obese and lean young Chinese men1–3. Am. J. Clin. Nutr. 2011, 94, 709–716. [Google Scholar] [CrossRef]
- Zhu, Y.; Hsu, W.H.; Hollis, J.H. Increasing the number of masticatory cycles is associated with reduced appetite and altered postprandial plasma concentrations of gut hormones, insulin and glucose. Br. J. Nutr. 2013, 110, 384–390. [Google Scholar] [CrossRef]
- Lee, K.S.; Kim, D.H.; Jang, J.S.; Nam, G.E.; Shin, Y.N.; Bok, A.R.; Kim, M.J.; Cho, K.H. Eating rate is associated with cardiometabolic risk factors in Korean adults. Nutr. Metab. Cardiovasc. Dis. 2013, 23, 635–641. [Google Scholar] [CrossRef]
- Song, L.L.; Venkataraman, K.; Gluckman, P.; Chong, Y.S.; Chee, M.W.; Khoo, C.M.; Leow, M.K.; Lee, Y.S.; Tai, E.S.; Khoo, E.Y. Smaller size of high metabolic rate organs explains lower resting energy expenditure in Asian-Indian Than Chinese men. Int. J. Obes. (Lond) 2016, 40, 633–638. [Google Scholar] [CrossRef]
- Sun, L.; Ranawana, D.V.; Tan, W.J.K.; Quek, Y.C.R.; Henry, C.J. The impact of eating methods on eating rate and glycemic response in healthy adults. Physiol. Behav. 2015, 139, 505–510. [Google Scholar] [CrossRef]
- Ng, R.Y.-X.; Wong, Y.-S.; Yeo, J.-Y.; Koh, C.L.-Z.; Wilson, C.; Ken-En Gan, S. The associations between dietary practices and dietary quality, biological health indicators, perceived stress, religiosity, culture, and gender in multicultural Singapore. J. Ethn. Foods 2018, 5, 220–227. [Google Scholar] [CrossRef]
- Wee, M.S.M.; Goh, A.T.; Stieger, M.; Forde, C.G. Correlation of instrumental texture properties from textural profile analysis (TPA) with eating behaviours and macronutrient composition for a wide range of solid foods. Food Funct. 2018, 9, 5301–5312. [Google Scholar] [CrossRef] [PubMed]
- Forde, C.G.; Mars, M.; DeGraaf, K. Ultra-processing or Oral Processing? A role for Energy Density and Eating Rate in Moderating Energy Intake from Processed Foods. Nutr. Res. Rev. 2020, 4, nzaa019. [Google Scholar] [CrossRef] [PubMed]
- van den Boer, J.; Werts, M.; Siebelink, E.; de Graaf, C.; Mars, M. The Availability of Slow and Fast Calories in the Dutch Diet: The Current Situation and Opportunities for Interventions. Foods 2017, 6, 87. [Google Scholar] [CrossRef]
- Mechanick, J.I.; Kushner, R.F.; Sugerman, H.J.; Gonzalez-Campoy, J.M.; Collazo-Clavell, M.L.; Spitz, A.F.; Apovian, C.M.; Livingston, E.H.; Brolin, R.; Sarwer, D.B.; et al. American Association of Clinical Endocrinologists, The Obesity Society, and American Society for Metabolic & Bariatric Surgery medical guidelines for clinical practice for the perioperative nutritional, metabolic, and nonsurgical support of the bariatric surgery patient. Obes. (Silver Spring) 2009, 17 (Suppl. 1), S1–S70. [Google Scholar]
- Ford, A.L.; Bergh, C.; Södersten, P.; Sabin, M.A.; Hollinghurst, S.; Hunt, L.P.; Shield, J.P.H. Treatment of childhood obesity by retraining eating behaviour: Randomised controlled trial. BMJ 2010, 340, b5388. [Google Scholar] [CrossRef]
- Galhardo, J.; Hunt, L.P.; Lightman, S.L.; Sabin, M.A.; Bergh, C.; Sodersten, P.; Shield, J.P. Normalizing eating behavior reduces body weight and improves gastrointestinal hormonal secretion in obese adolescents. J. Clin. Endoc. Metab. 2012, 97, E193–E201. [Google Scholar] [CrossRef]
- Hamilton-Shield, J.; Goodred, J.; Powell, L.; Thorn, J.; Banks, J.; Hollinghurst, S.; Montgomery, A.; Turner, K.; Sharp, D. Changing eating behaviours to treat childhood obesity in the community using Mandolean: The Community Mandolean randomised controlled trial (ComMando)—A pilot study. Health Technol. Assess. 2014, 18, 1–75. [Google Scholar] [CrossRef]
- Teo, P.S.; Forde, C.G. The Impact of Eating Rate on Energy Intake, Body Composition and Health. In Handbook of Eating and Drinking: Interdisciplinary Perspectives; Meiselman, H.L., Ed.; Springer International Publishing: Cham, Switzerland, 2019; pp. 1–27. [Google Scholar] [CrossRef]


| Self-Reported Eating Rate | p Value | |||
|---|---|---|---|---|
| Slow (n = 711) | Medium (n = 4147) | Fast (n = 2153) | ||
| Mean ± SD | ||||
| Age, years | 51.63 ± 14.38 a,*** | 50.74 ± 12.72 a,*** | 47.44 ± 12.62 | <0.001 |
| Sex, % | <0.001 | |||
| Men | 9.5 | 53.2 | 37.3 | |
| Women | 10.7 | 64.0 | 25.4 | |
| Ethnic group, % | <0.001 | |||
| Chinese | 9.8 | 57.4 | 32.8 | |
| Malay | 11.7 | 71.0 | 17.3 | |
| Indian | 10.4 | 59.3 | 30.3 | |
| Others | 11.6 | 62.3 | 26.2 | |
| Highest education attainment, % | <0.001 | |||
| Primary or below | 10.7 | 64.8 | 24.5 | |
| Secondary | 10.1 | 66.1 | 23.8 | |
| Higher education inc. vocational | 10.5 | 58.1 | 31.4 | |
| University | 9.3 | 49.5 | 41.2 | |
| Smokers, % | 9.4 | 56.2 | 34.4 | 0.004 |
| Alcohol drinkers, % | 9.8 | 47.3 | 42.8 | <0.001 |
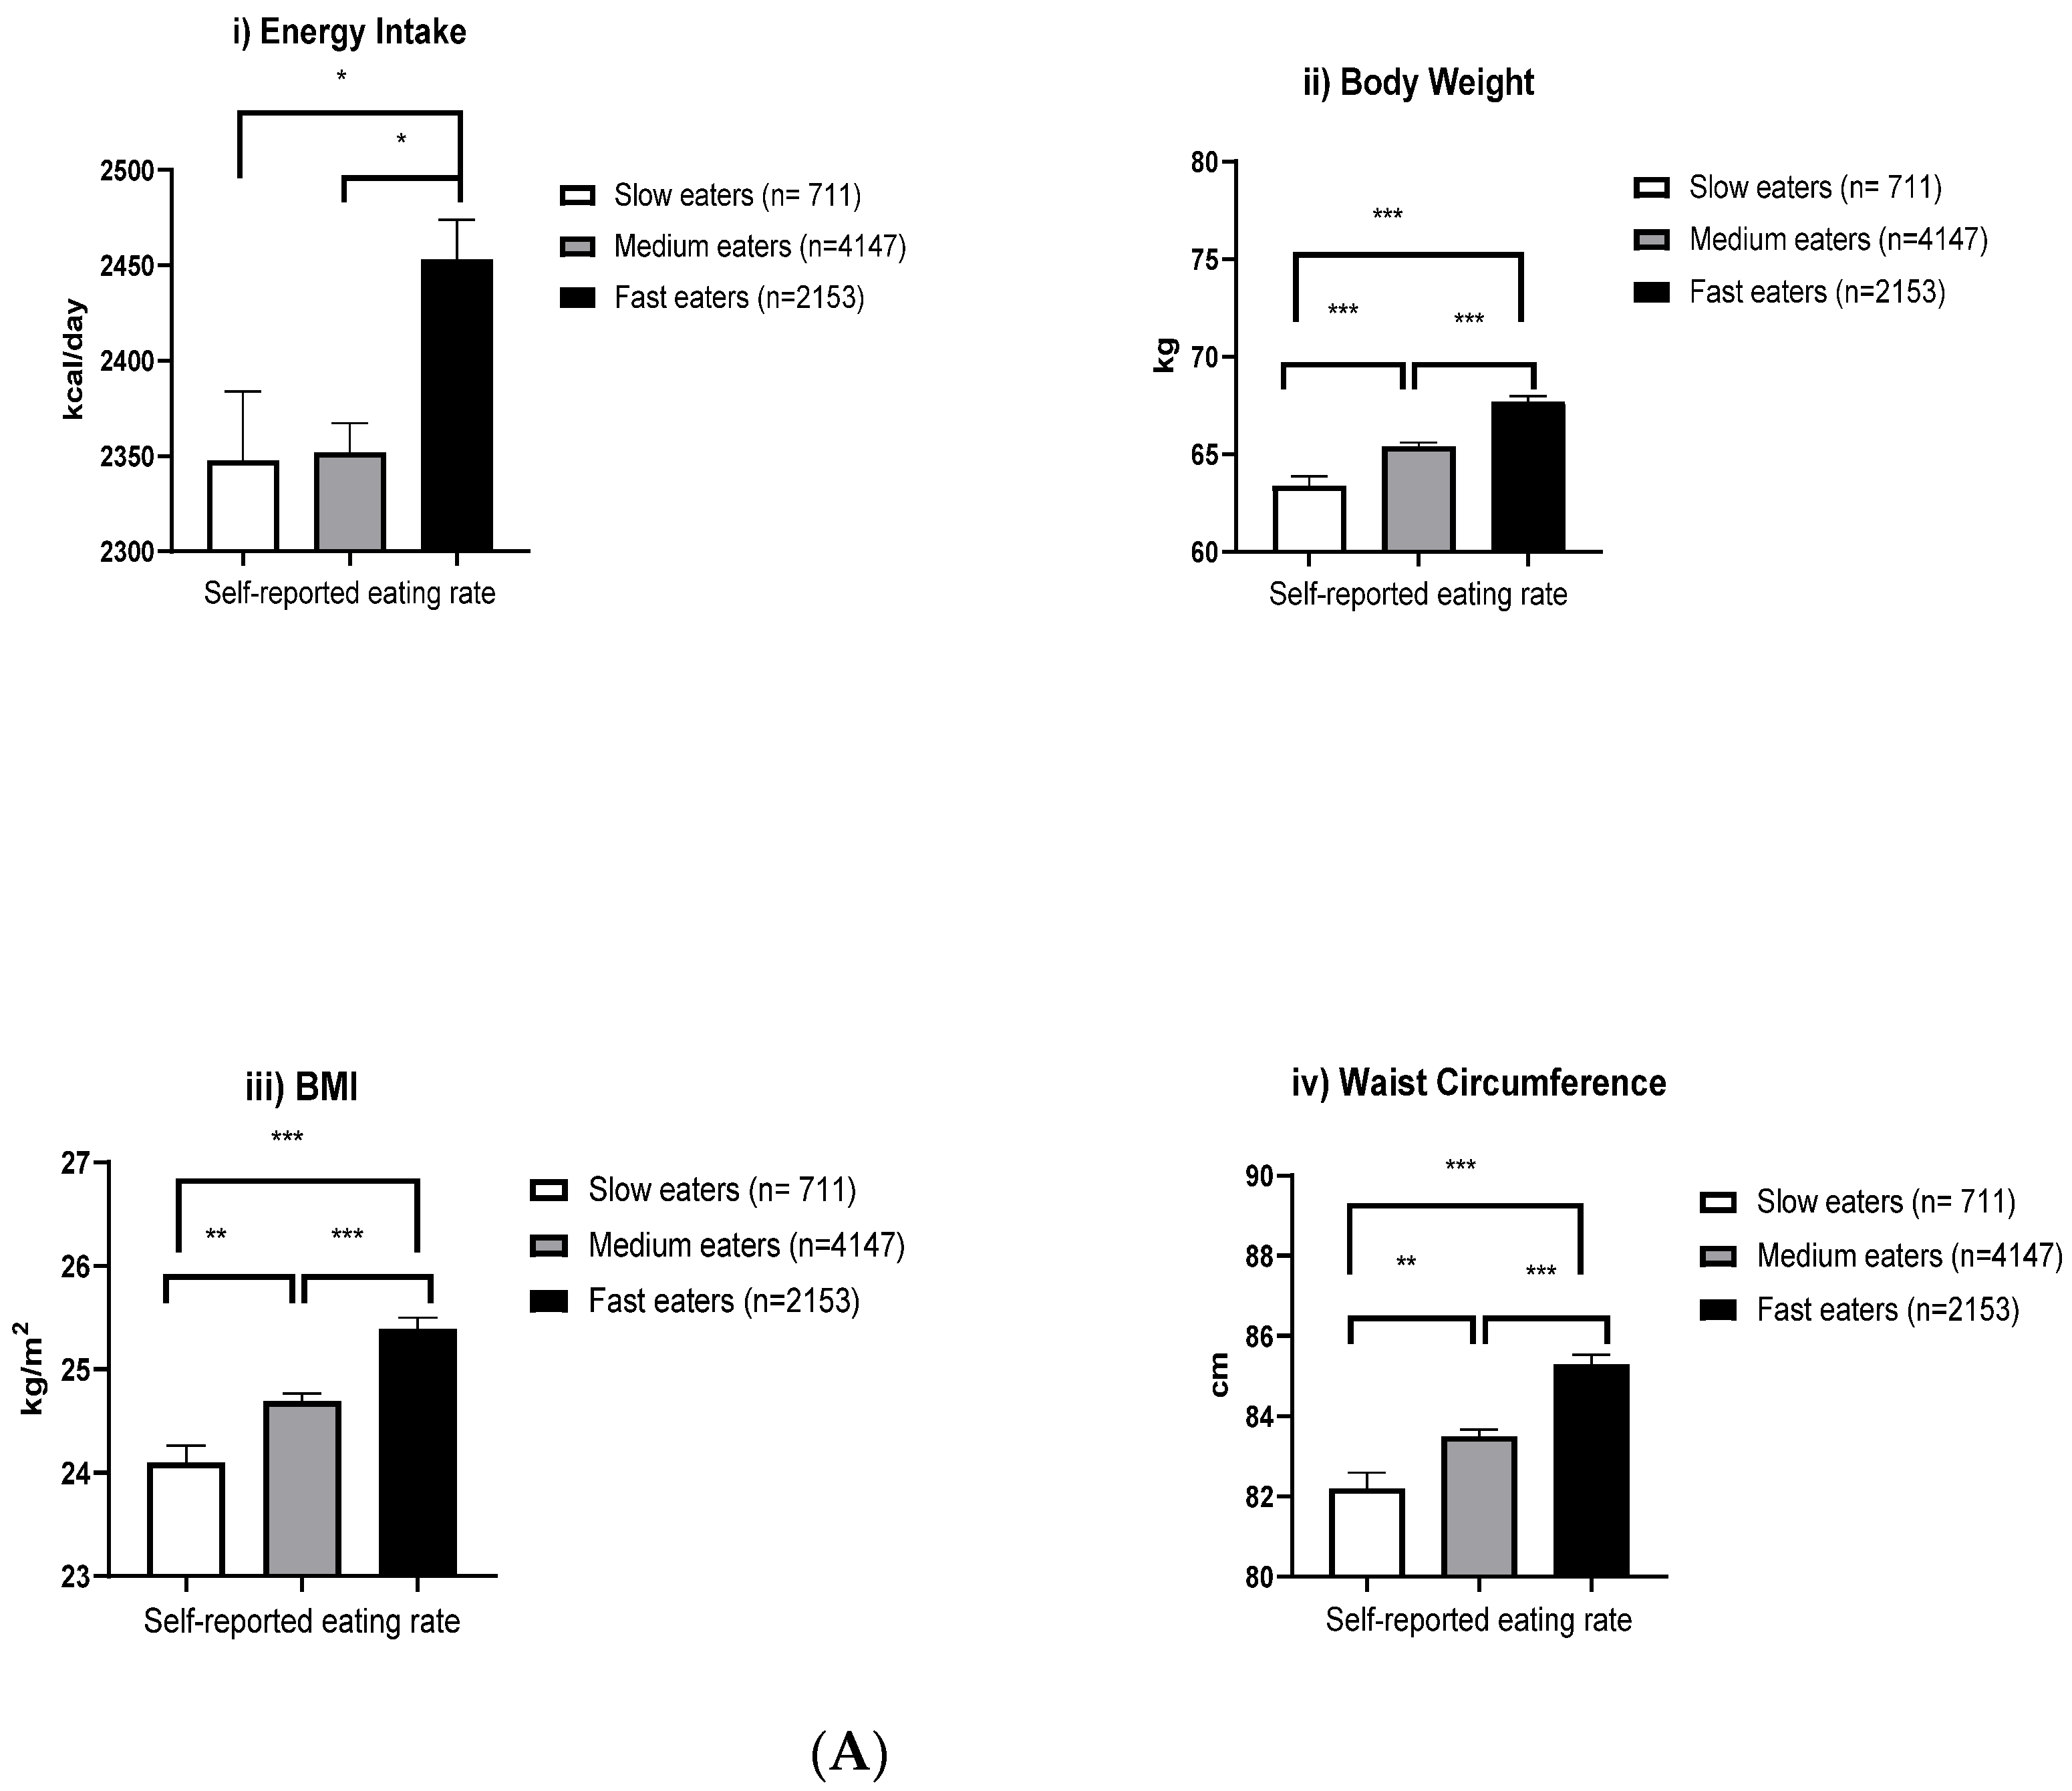
| Dietary energy intake, kcal/day | 2307.82 ± 995.69 a,*** | 2308.39 ± 986.12 a,*** | 2550.98 ± 1054.83 | <0.001 |
| Total physical activity, MET-min/week | 1113.57 ± 1054.94 a,* | 1166.66 ± 1027.84 | 1219.70 ± 1048.57 | 0.035 |
| Total (n = 7011) | Self-Reported Eating Rate | p–Trend | |||
|---|---|---|---|---|---|
| Slow (n = 711) | Medium (n = 4147) | Fast (n = 2153) | |||
| Mean ± SD | |||||
| Body weight, kg | 65.90 ± 14.14 | 62.96 ± 14.06 a,***,b,** | 64.88 ± 13.66 a,*** | 68.85 ± 14.61 | <0.001 |
| Height, m | 1.63 ± 0.09 | 1.61 ± 0.09 a,*** | 1.62 ± 0.09 a,*** | 1.65 ± 0.09 | <0.001 |
| BMI, kg/m2 | 24.88 ± 4.64 | 24.14 ± 4.88 a,***,b,** | 24.78 ± 4.64 a,*** | 25.30 ± 4.54 | <0.001 |
| WC, cm | 83.93 ± 11.78 | 82.29 ± 12.63 a,*** | 83.43 ± 11.59 a,*** | 85.42 ± 11.69 | <0.001 |
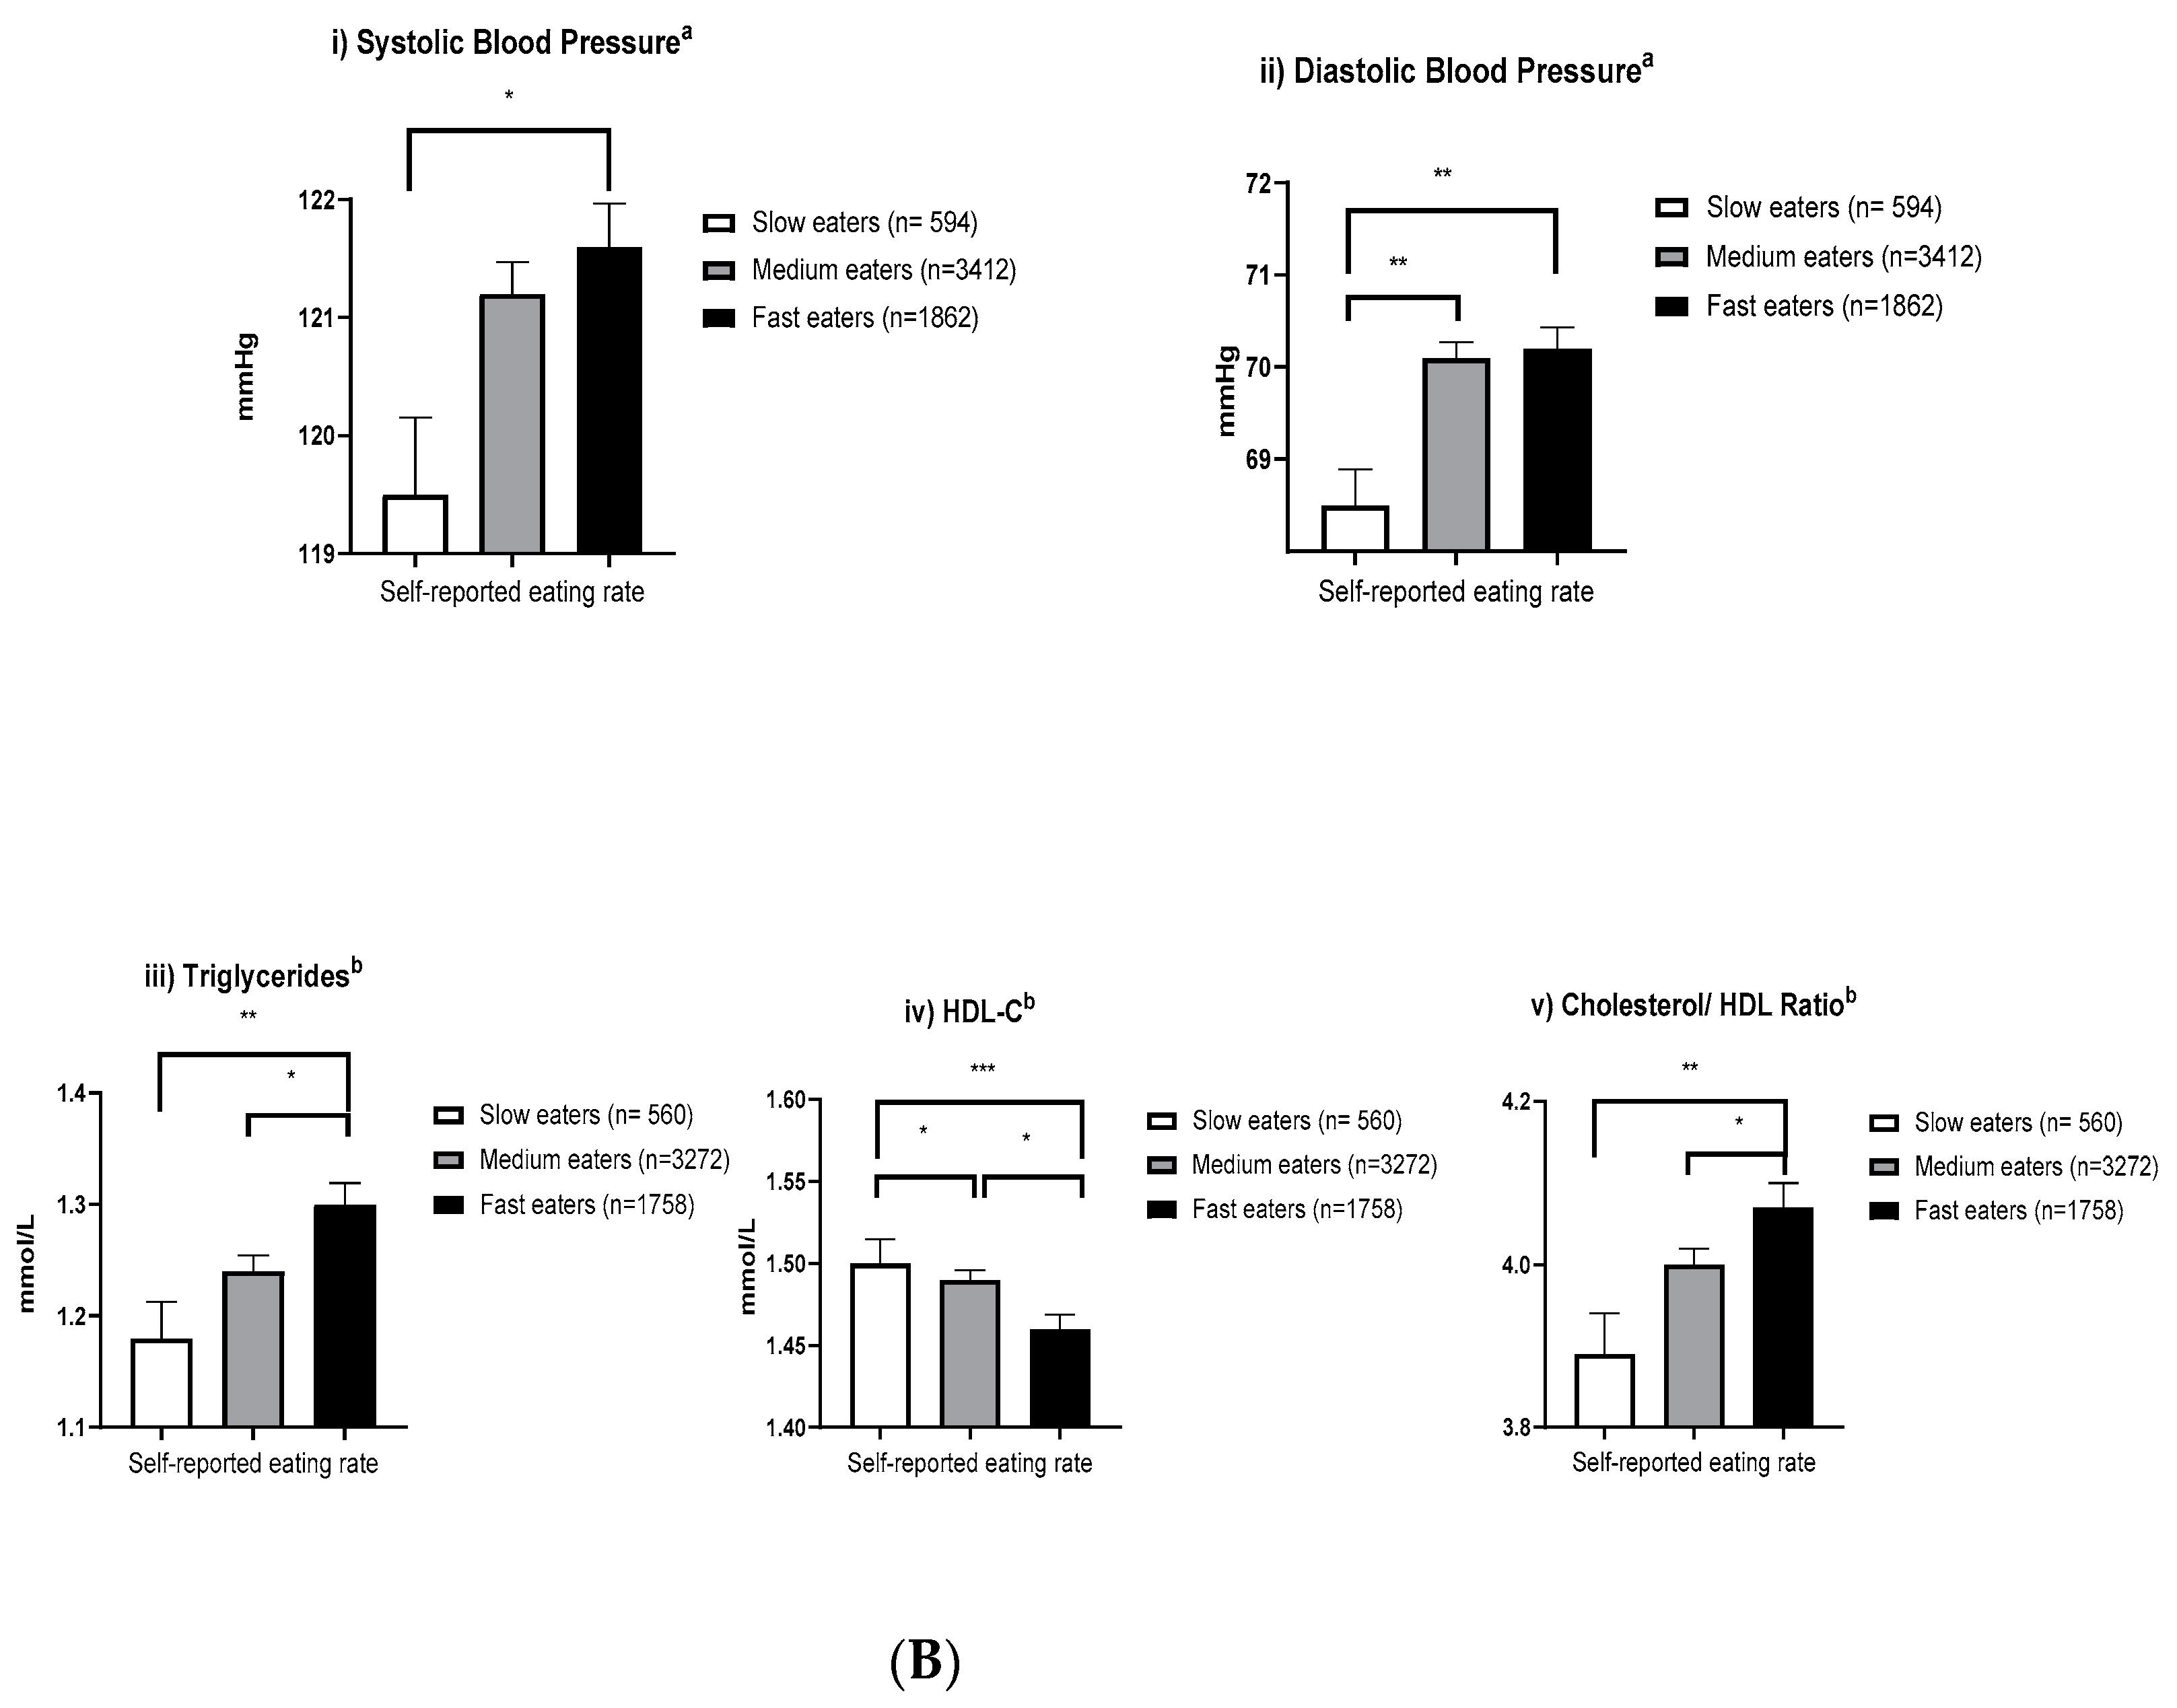
| Systolic blood pressure, mmHg | 124.32 ± 19.28 | 123.38 ± 19.64 b,* | 125.11 ± 19.78 a,*** | 123.11 ± 18.09 | <0.001 |
| Diastolic blood pressure, mmHg | 71.00 ± 10.70 | 69.32 ± 10.27 a,b,*** | 70.99 ± 10.73 a,* | 71.58 ± 10.73 | <0.001 |
| Total cholesterol, mmol/L | 5.54 ± 1.07 | 5.53 ± 1.08 | 5.56 ± 1.07 | 5.52 ± 1.06 | 0.425 |
| LDL-C, mmol/L | 3.54 ± 0.96 | 3.50 ± 1.00 | 3.55 ± 0.97 | 3.54 ± 0.93 | 0.418 |
| HDL-C, mmol/L | 1.48 ± 0.40 | 1.52 ± 0.41 b,*,a,*** | 1.49 ± 0.40 a,*** | 1.43 ± 0.39 | <0.001 |
| TG, mmol/L | 1.31 ± 0.86 | 1.24 ± 0.80 a,** | 1.30 ± 0.84 a,* | 1.35 ± 0.92 | 0.005 |
| Total-to-HDL-cholesterol ratio | 3.99 ± 1.22 | 3.85 ± 1.13 b,*,a,*** | 3.95 ± 1.19 a,*** | 4.10 ± 1.28 | <0.001 |
| Variables | Overweight BMI > 23 kg/m2 | Abdominal Overweight WC > 90 cm (Men); >80 cm (Women) | ||
|---|---|---|---|---|
| Odd Ratio a (95% CI) | Prevalence (%) | Odd Ratio a (95% CI) | Prevalence (%) | |
| Overall | ||||
| Slow | 1.00 (reference) | 51.7 | 1.00 (reference) | 35.8 |
| Medium | 1.54 (1.30, 1.83) *** | 61.3 | 1.40 (1.18, 1.67) *** | 43.0 |
| Fast | 2.17 (1.80, 2.60) *** | 67.2 | 1.84 (1.52, 2.21) *** | 44.1 |
| Subgroups | ||||
| Sex-Men | ||||
| Slow | 1.00 (reference) | 58.4 | 1.00 (reference) | 33.2 |
| Medium | 1.43 (1.10, 1.85) ** | 66.4 | 1.32 (1.01, 1.73) * | 37.9 |
| Fast | 2.12 (1.61, 2.80) *** | 73.4 | 1.85 (1.39, 2.45) *** | 42.0 |
| Sex-Women | ||||
| Slow | 1.00 (reference) | 47.0 | 1.00 (reference) | 37.8 |
| Medium | 1.56 (1.24, 1.94) *** | 57.8 | 1.43 (1.13, 1.78) ** | 46.3 |
| Fast | 2.02 (1.57, 2.59) *** | 59.9 | 1.71 (1.33, 2.20) *** | 46.4 |
| Ethnicity-Chinese | ||||
| Slow | 1.00 (reference) | 43.0 | 1.00 (reference) | 28.7 |
| Medium | 1.46 (1.20, 1.77) *** | 52.1 | 1.27 (1.02, 1.57) * | 33.7 |
| Fast | 2.09 (1.69, 2.58) *** | 62.1 | 1.77 (1.41, 2.22) *** | 38.1 |
| Ethnicity-Malay | ||||
| Slow | 1.00 (reference) | 73.0 | 1.00 (reference) | 48.7 |
| Medium | 1.69 (0.92, 2.93) | 81.7 | 1.58 (0.94, 2.63) | 61.0 |
| Fast | 3.08 (1.40, 6.79) ** | 88.1 | 2.11 (1.13, 3.95) * | 62.4 |
| Ethnicity-Indian | ||||
| Slow | 1.00 (reference) | 72.9 | 1.00 (reference) | 54.2 |
| Medium | 1.65 (1.03, 2.67) * | 81.2 | 2.0 (1.29, 3.07) ** | 66.5 |
| Fast | 1.77 (1.05, 2.99) * | 82.1 | 2.0 (1.23, 3.13) ** | 64.5 |
| Age-20–34 years | ||||
| Slow | 1.00 (reference) | 41.7 | 1.00 (reference) | 21.7 |
| Medium | 1.54 (1.00, 2.37) * | 53.7 | 1.46 (0.89, 2.40) | 29.4 |
| Fast | 2.20 (1.40, 3.47) ** | 61.2 | 1.96 (1.17, 3.29) * | 31.0 |
| Age-35–54 years | ||||
| Slow | 1.00 (reference) | 51.5 | 1.00 (reference) | 33.7 |
| Medium | 1.79 (1.36, 2.37) *** | 65.7 | 1.54 (1.16, 2.06) ** | 44.4 |
| Fast | 2.41 (1.79, 3.23) *** | 70.0 | 1.98 (1.45, 2.68) *** | 45.5 |
| Age->55 years | ||||
| Slow | 1.00 (reference) | 55.7 | 1.00 (reference) | 42.9 |
| Medium | 1.23 (0.96, 1.58) | 58.2 | 1.16 (0.91, 1.50) | 45.3 |
| Fast | 1.77 (1.34, 2.35) *** | 65.8 | 1.50 (1.13, 1.98) ** | 48.9 |
© 2020 by the authors. Licensee MDPI, Basel, Switzerland. This article is an open access article distributed under the terms and conditions of the Creative Commons Attribution (CC BY) license (http://creativecommons.org/licenses/by/4.0/).
Share and Cite
Teo, P.S.; van Dam, R.M.; Whitton, C.; Tan, L.W.L.; Forde, C.G. Association between Self-Reported Eating Rate, Energy Intake, and Cardiovascular Risk Factors in a Multi-Ethnic Asian Population. Nutrients 2020, 12, 1080. https://doi.org/10.3390/nu12041080
Teo PS, van Dam RM, Whitton C, Tan LWL, Forde CG. Association between Self-Reported Eating Rate, Energy Intake, and Cardiovascular Risk Factors in a Multi-Ethnic Asian Population. Nutrients. 2020; 12(4):1080. https://doi.org/10.3390/nu12041080
Chicago/Turabian StyleTeo, Pey Sze, Rob M. van Dam, Clare Whitton, Linda Wei Lin Tan, and Ciarán G. Forde. 2020. "Association between Self-Reported Eating Rate, Energy Intake, and Cardiovascular Risk Factors in a Multi-Ethnic Asian Population" Nutrients 12, no. 4: 1080. https://doi.org/10.3390/nu12041080
APA StyleTeo, P. S., van Dam, R. M., Whitton, C., Tan, L. W. L., & Forde, C. G. (2020). Association between Self-Reported Eating Rate, Energy Intake, and Cardiovascular Risk Factors in a Multi-Ethnic Asian Population. Nutrients, 12(4), 1080. https://doi.org/10.3390/nu12041080