Oral Microbiota Profile Associates with Sugar Intake and Taste Preference Genes

 , , and
Abstract
1. Introduction
2. Materials and Methods
2.1. Study Subjects
2.2. Saliva Sampling, Bacteria Culturing and DNA Extraction
2.3. 16S rRNA Gene Amplicon Generation and Sequencing
2.4. Diet Recording
2.5. Recording of Medical and Other Lifestyle Conditions
2.6. Genotyping of Single Nucleotide Polymorphism in Taste Associated Genes
2.7. Prediction of Functional Potential from the 16S rRNA Gene Information
2.8. Data Handling and Statistical Analyses
3. Results
3.1. Study Group
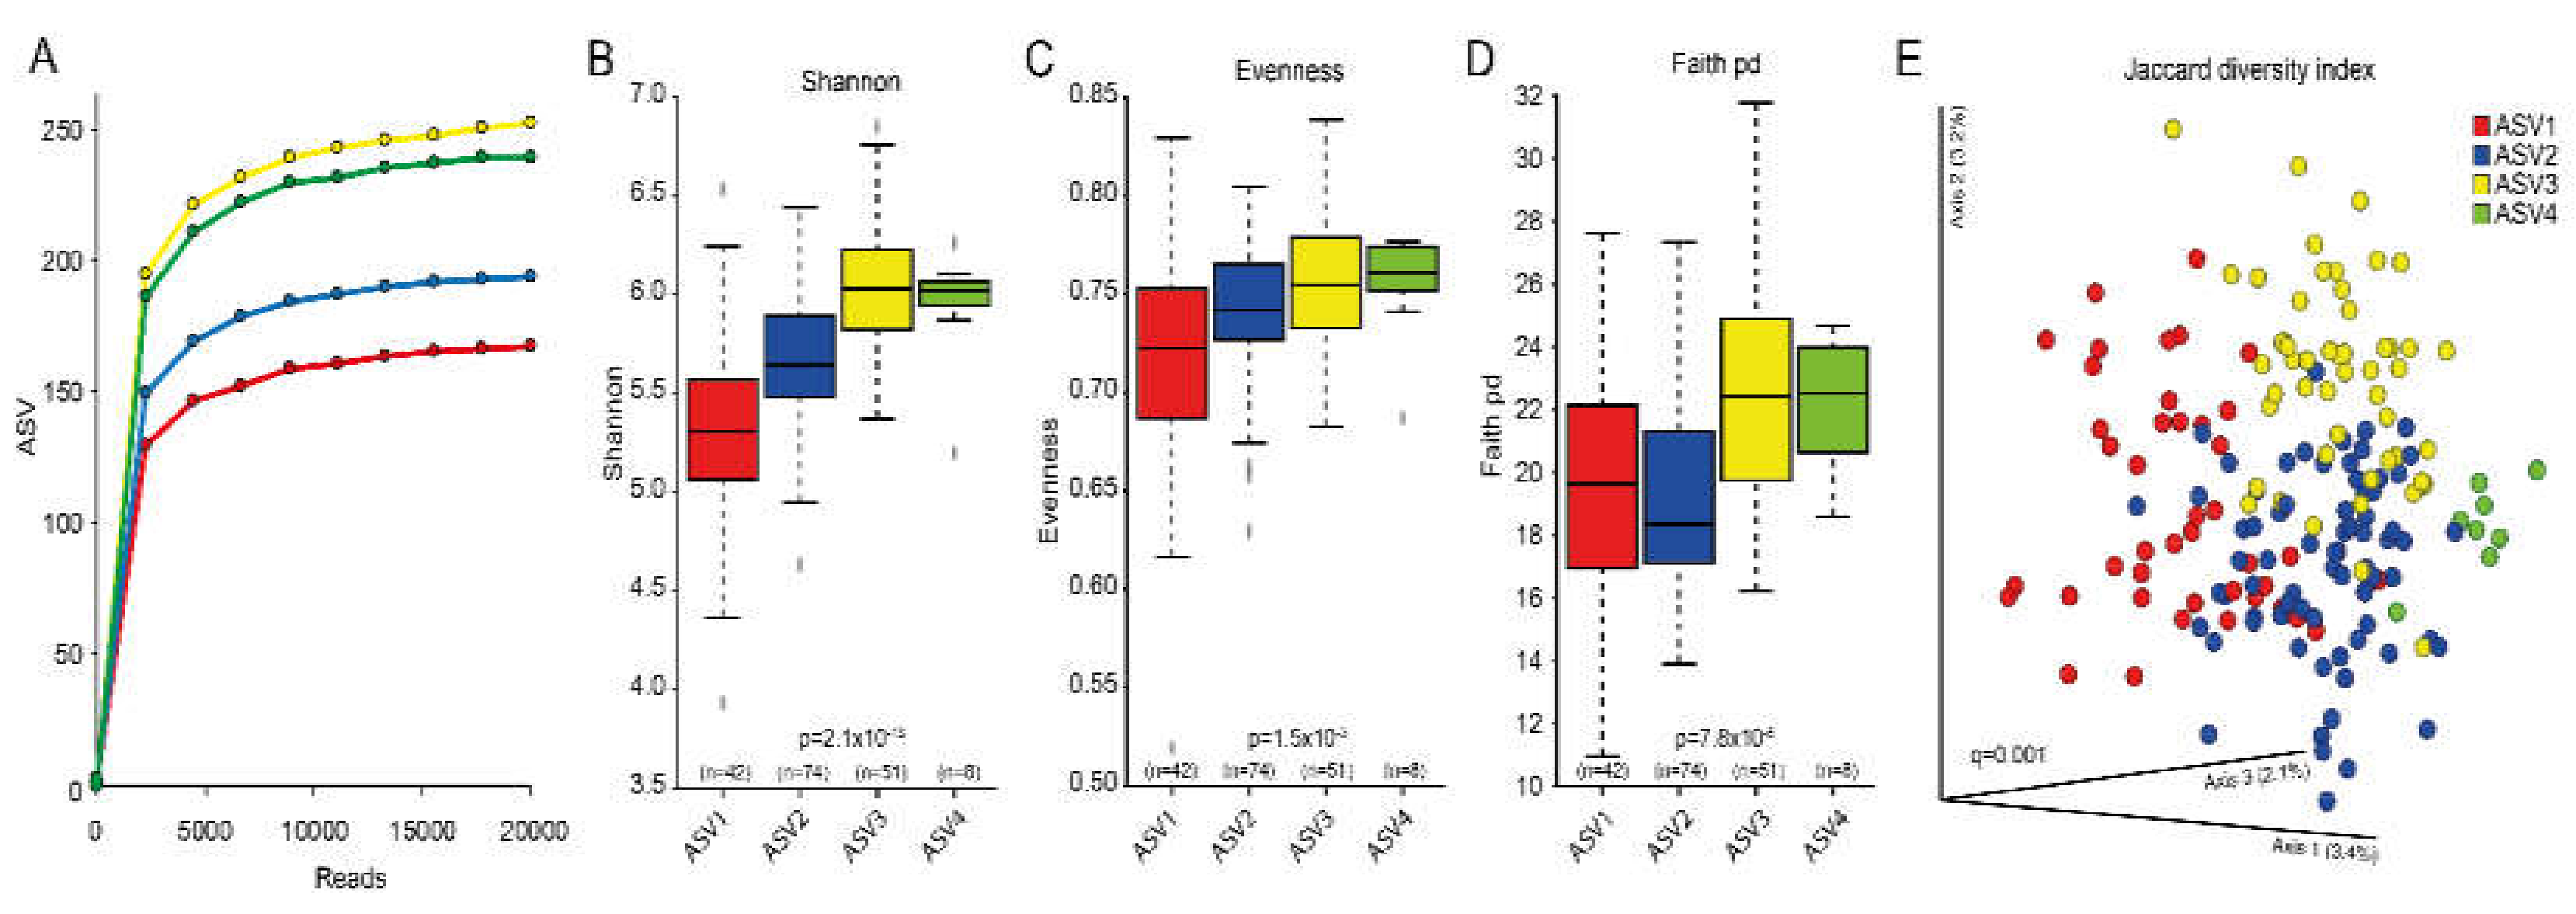
3.2. Overall Microbiota Assessment
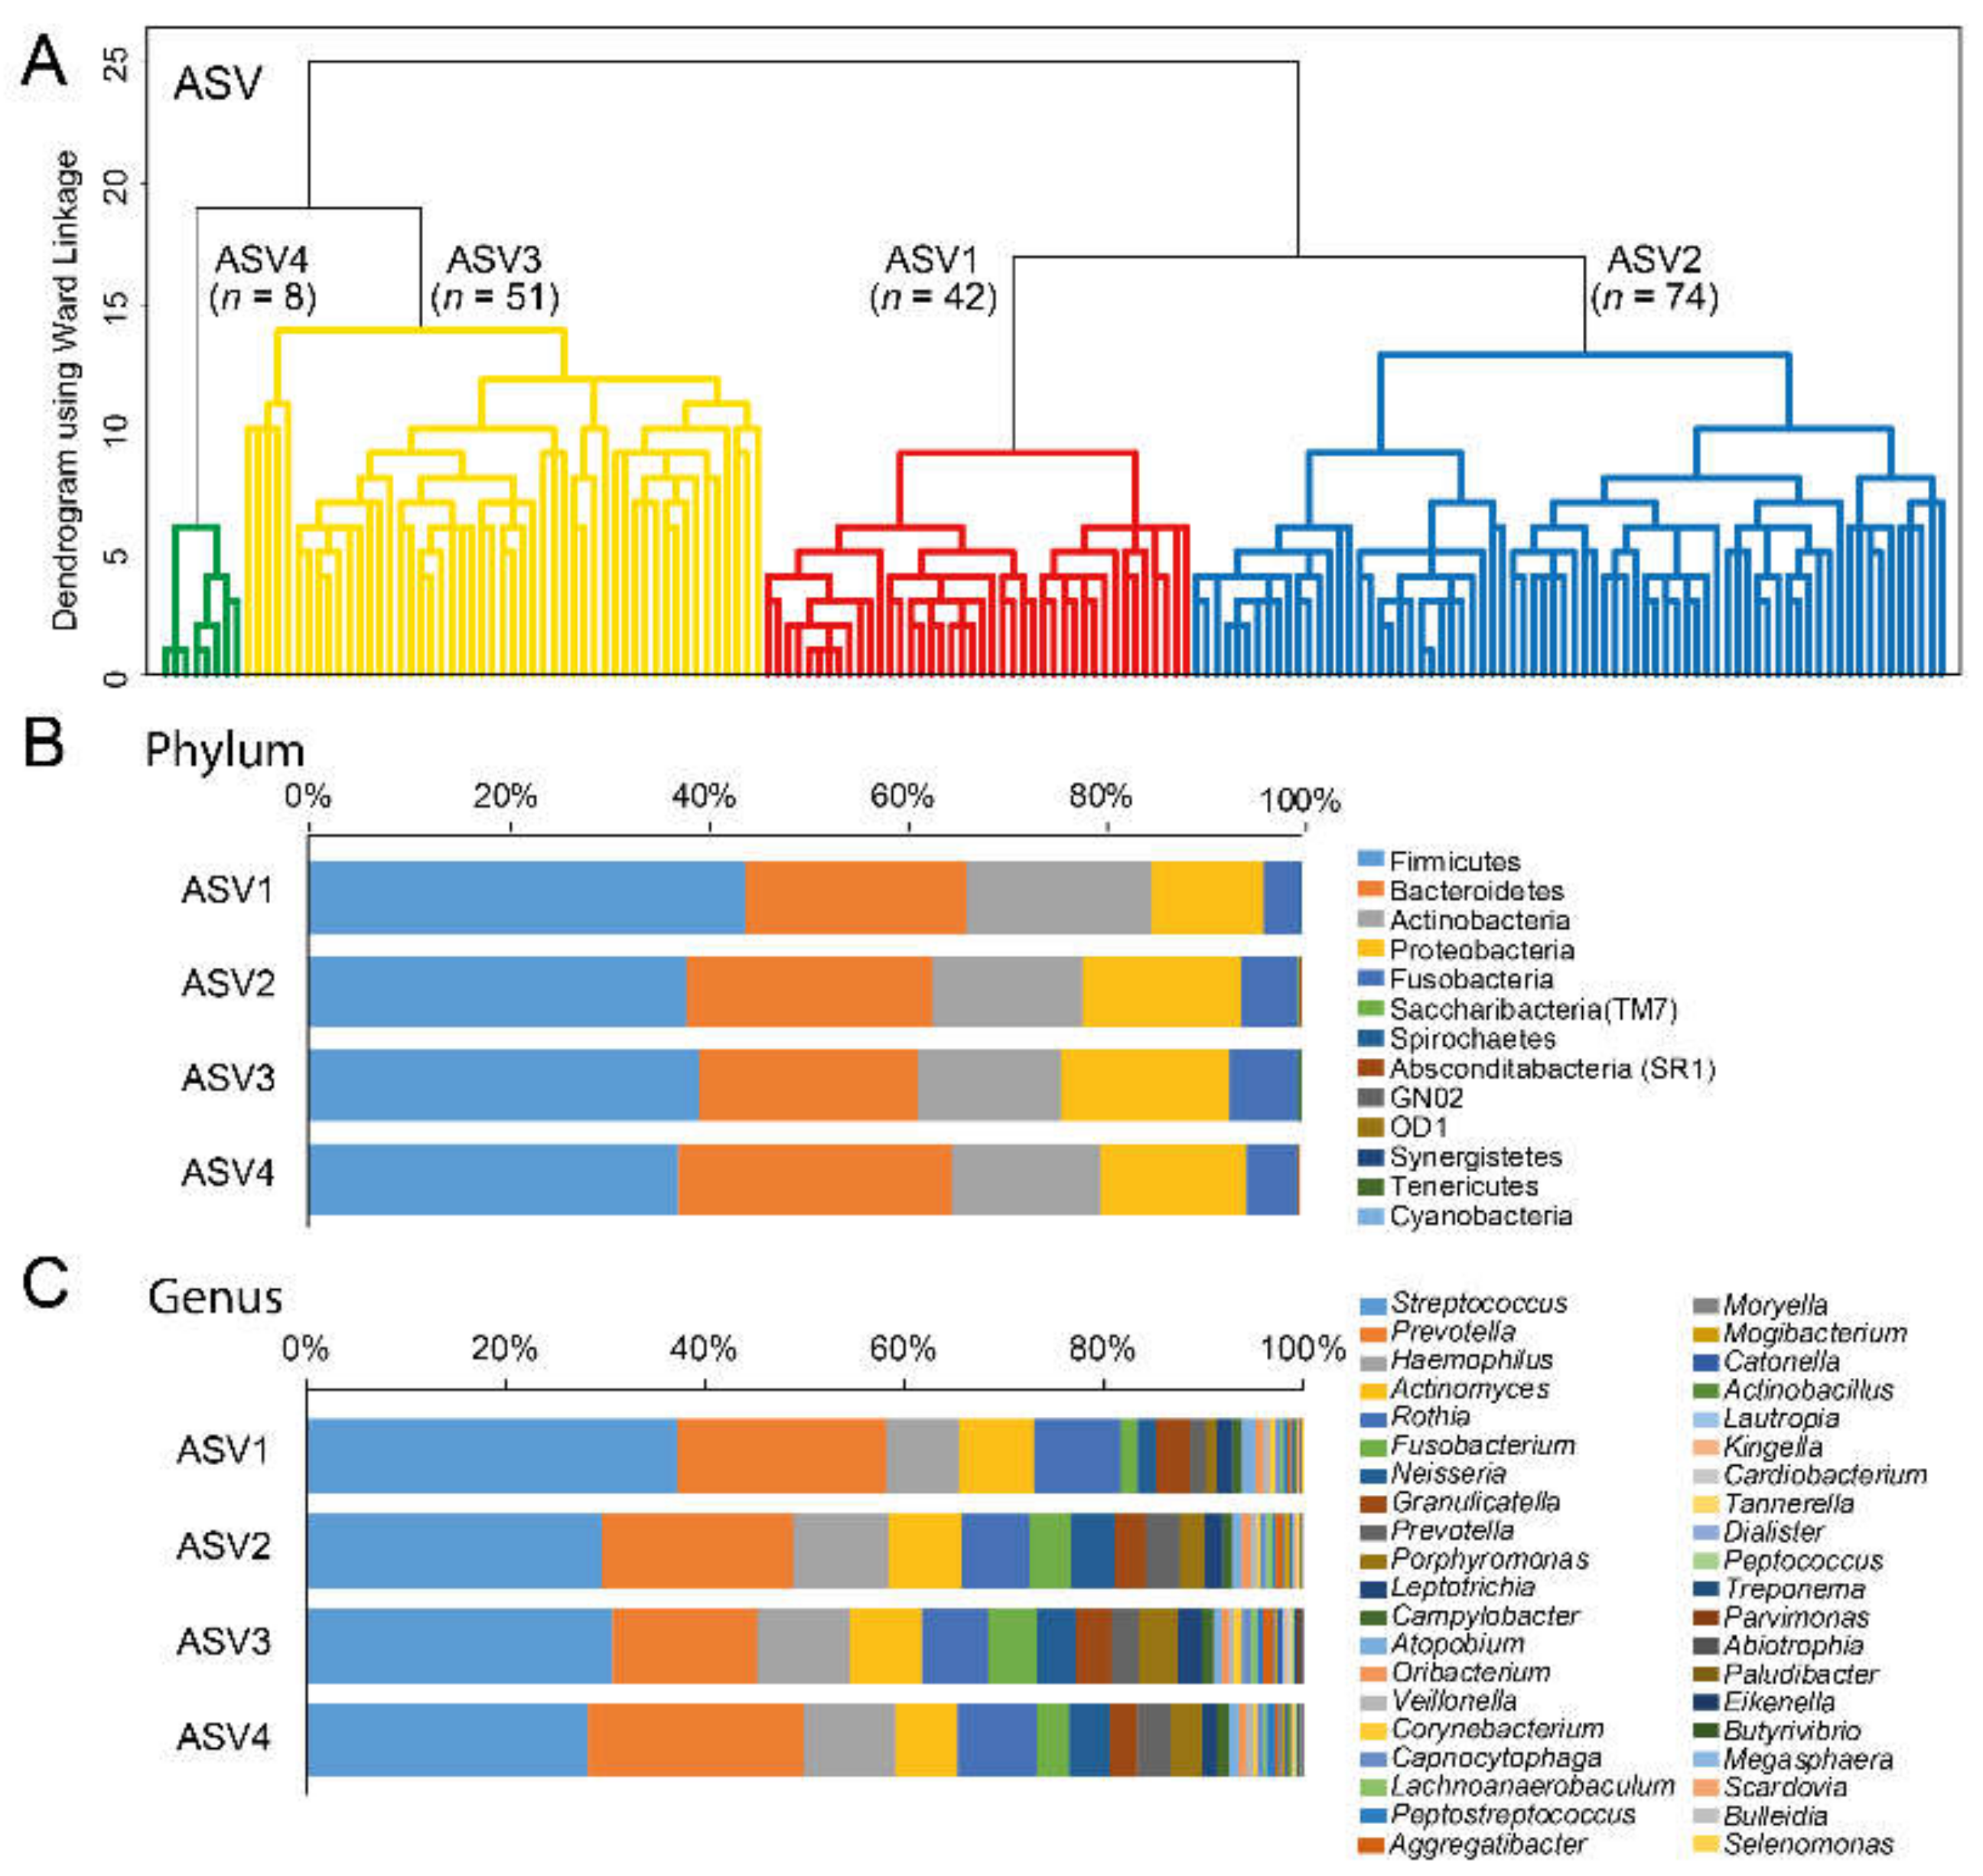
3.3. Cluster Classifications Based on ASV Pattern
3.4. Predicted Functions in ASV Cluster Groups
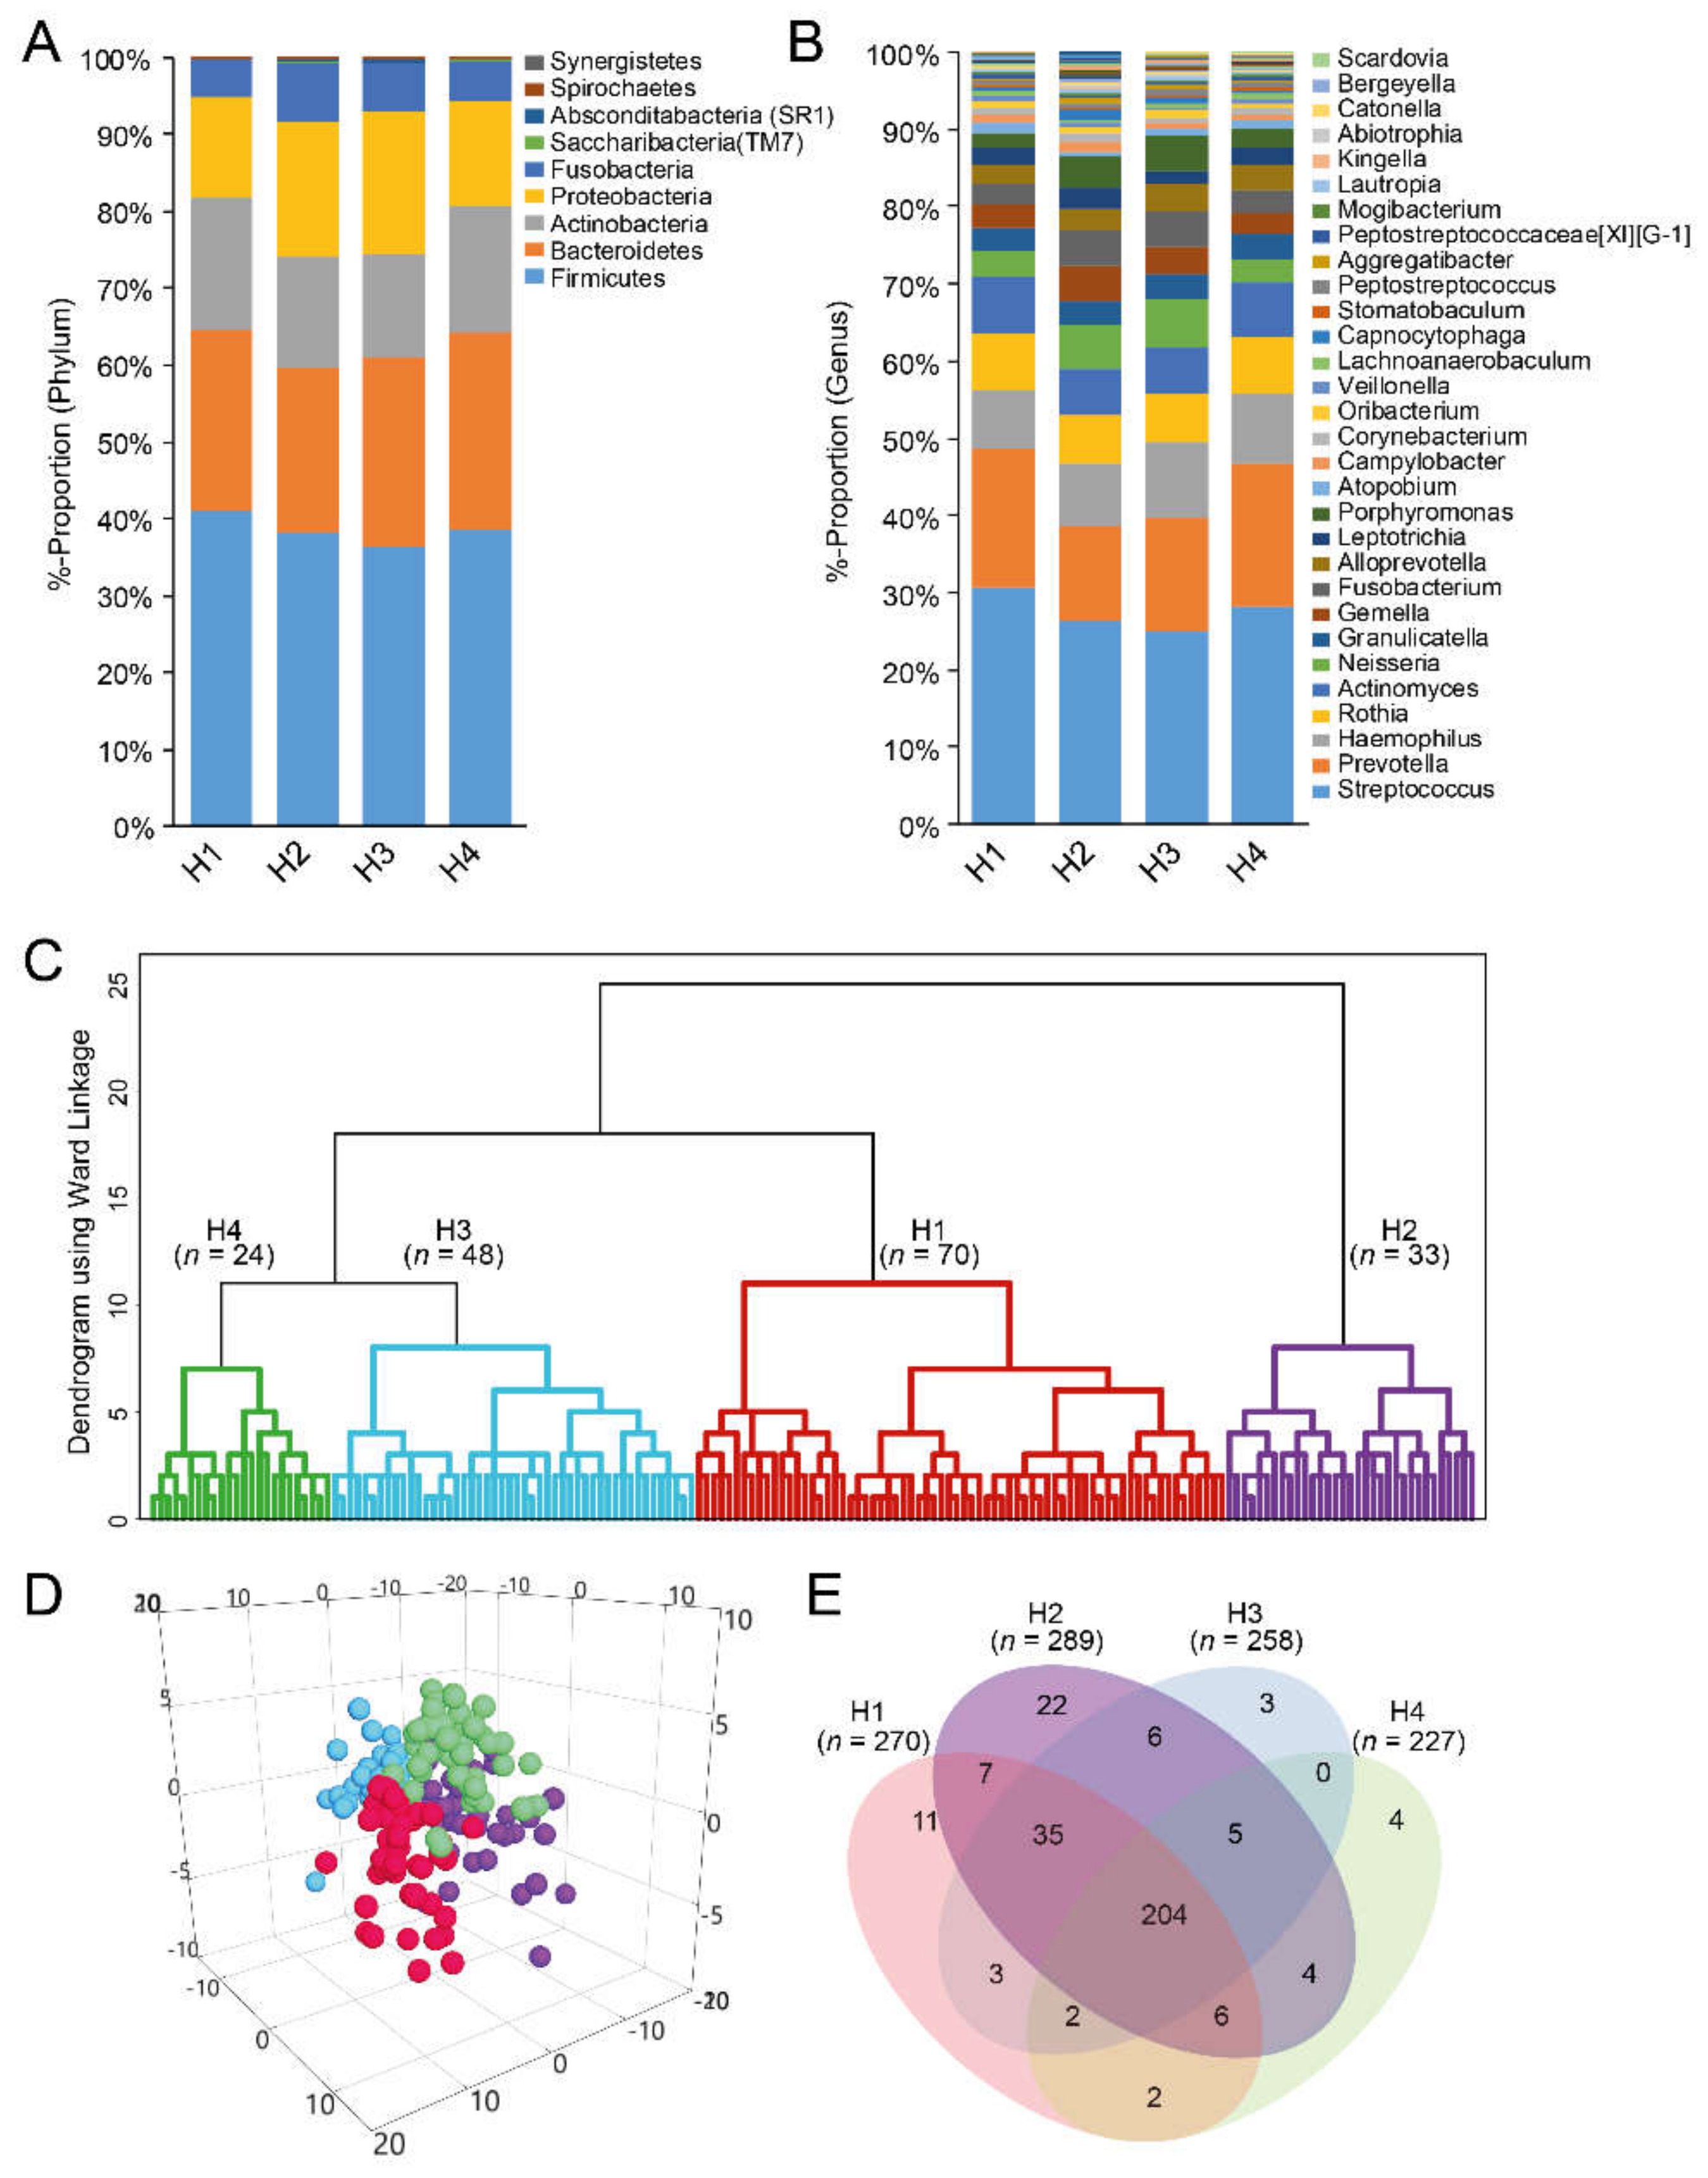
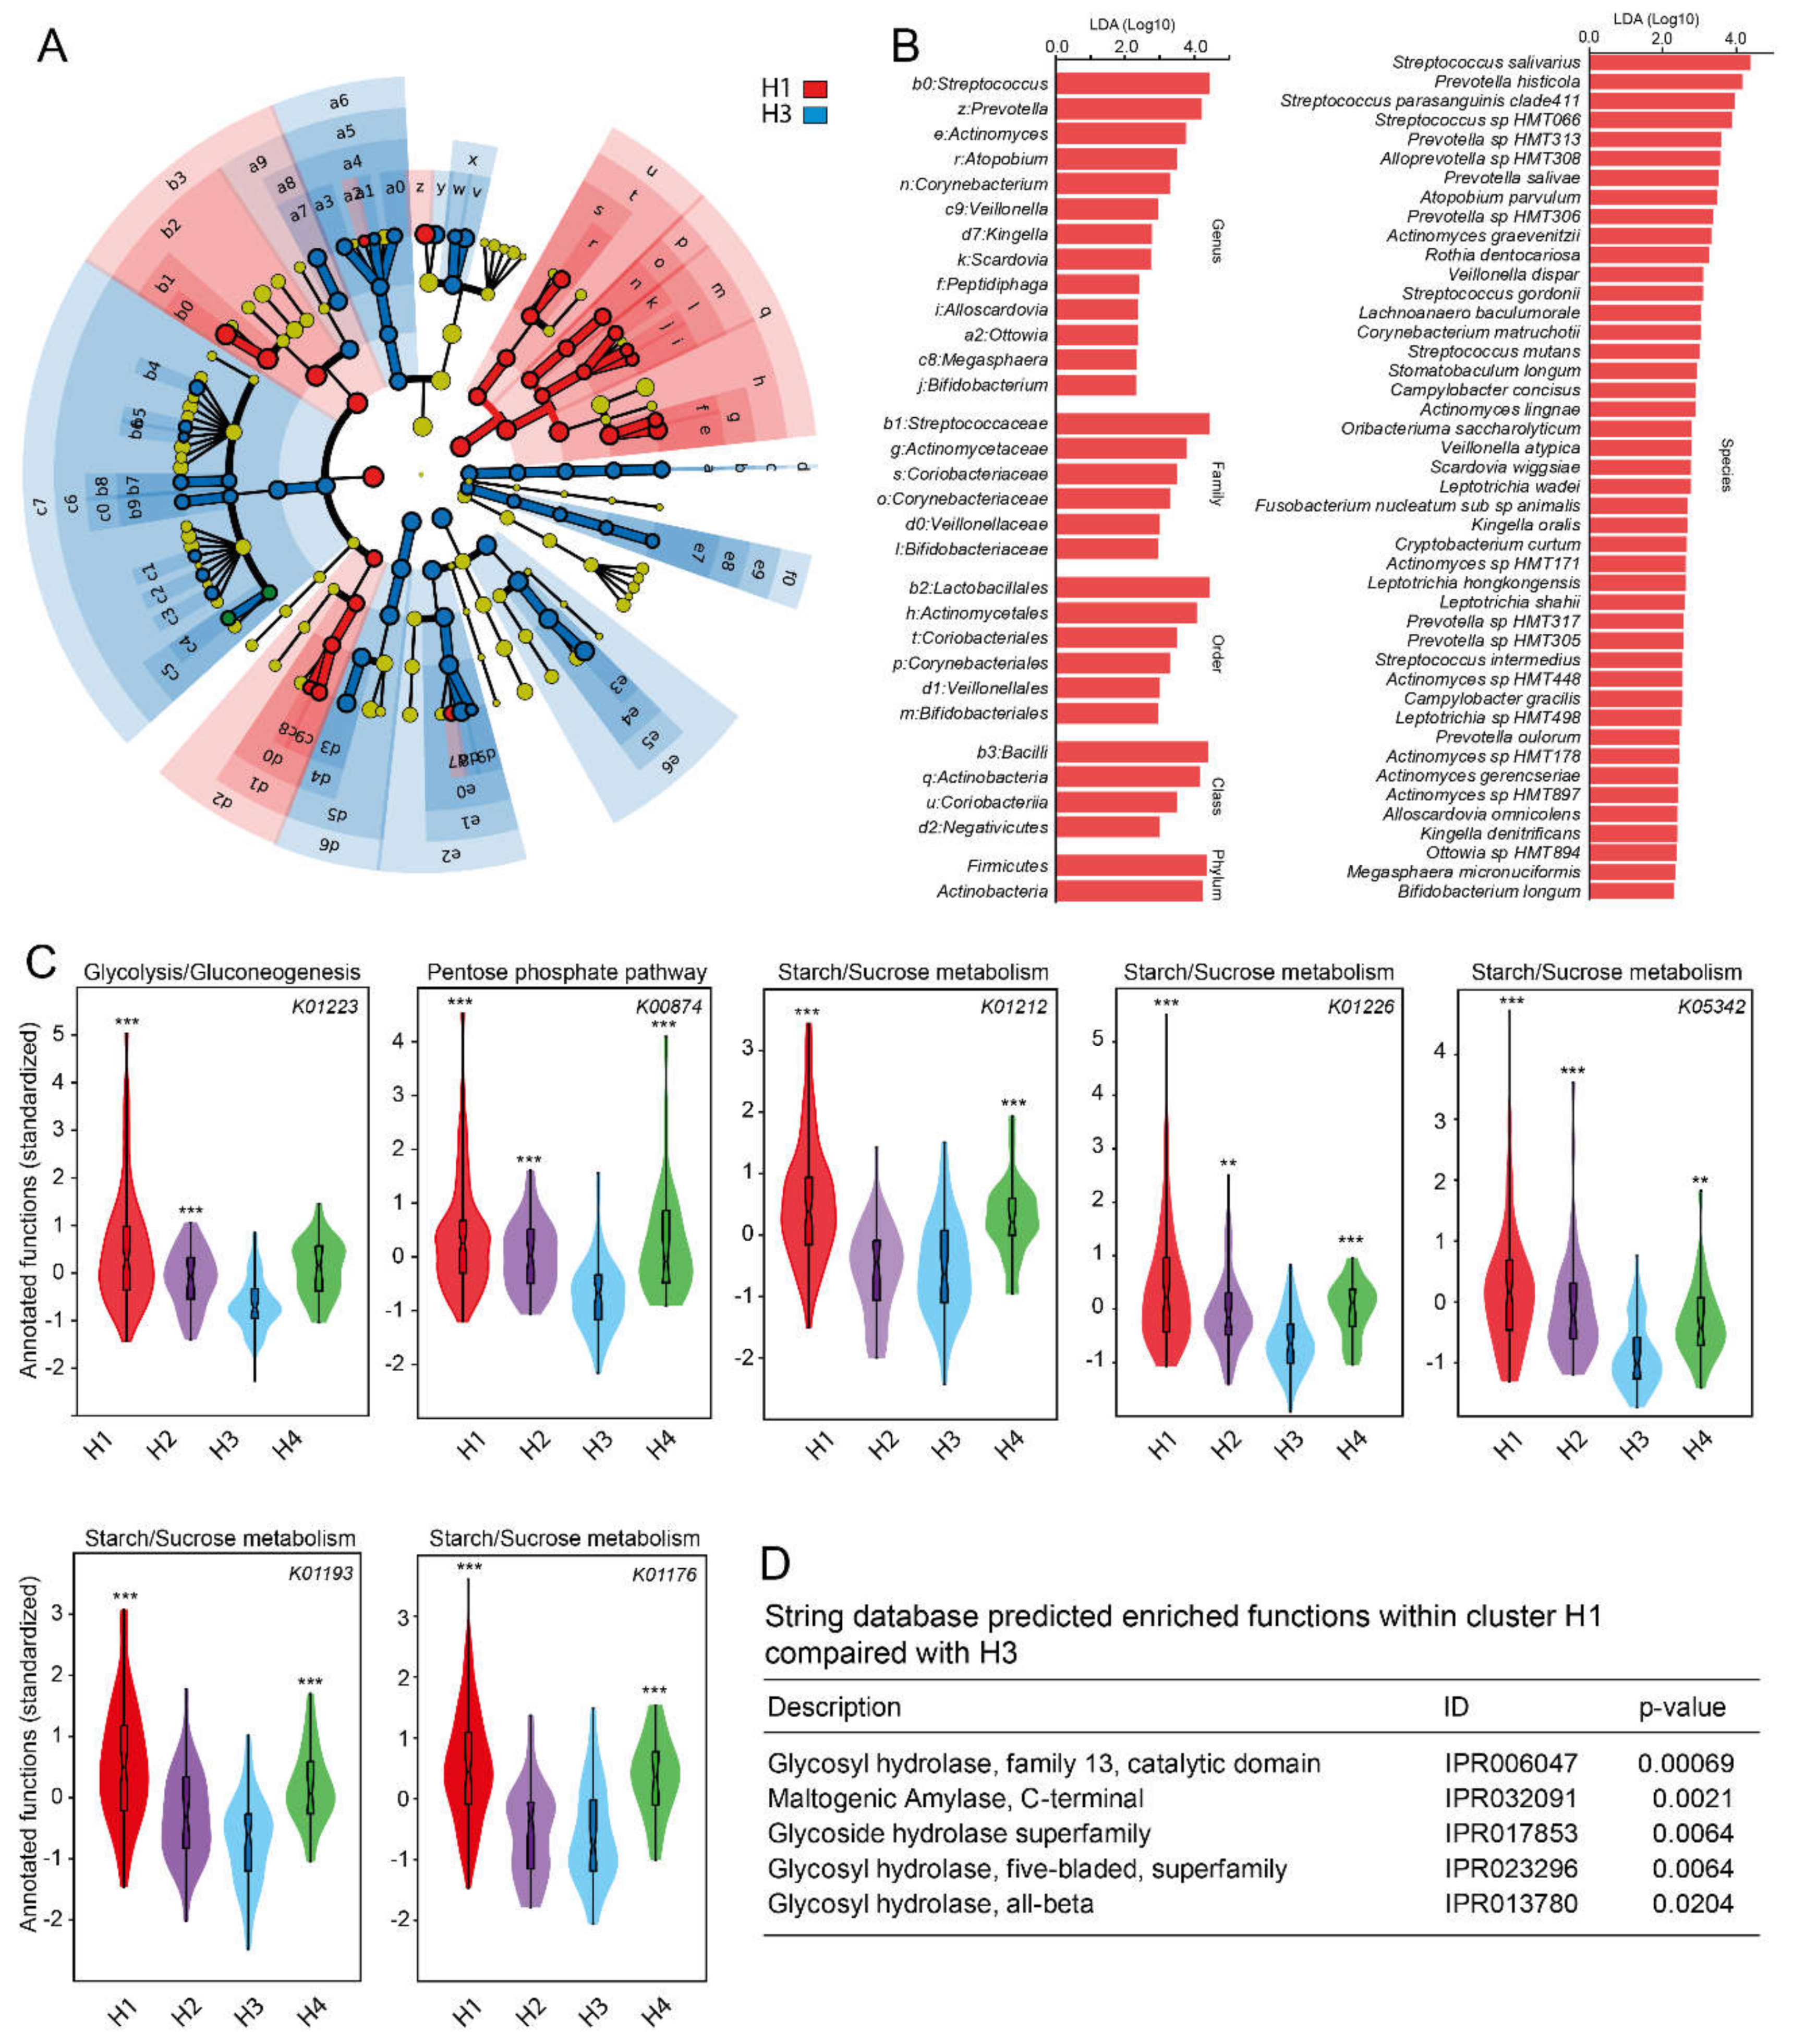
3.5. Taxa Determination from eHOMD and Their Cluster Classification
3.6. Factors Associated with Belonging to the Species Level (eHOMD) Cluster Groups
3.7. Predicted Functions in Species Level (eHOMD) Cluster Groups
4. Discussion
5. Conclusions
Supplementary Materials
Author Contributions
Funding
Acknowledgments
Conflicts of Interest
References
- Dewhirst, F.E.; Chen, T.; Izard, J.; Paster, B.J.; Tanner, A.C.; Yu, W.H.; Lakshmanan, A.; Wade, W.G. The human oral microbiome. J. Bacteriol. 2010, 192, 5002–5017. [Google Scholar] [CrossRef] [PubMed]
- Caufield, P.W.; Schon, C.N.; Saraithong, P.; Li, Y.; Argimon, S. Oral lactobacilli and dental caries: A model for niche adaptation in humans. J. Dent. Res. 2015, 94, 110S–118S. [Google Scholar] [CrossRef] [PubMed]
- Jakubovics, N.S. Talk of the town: Interspecies communication in oral biofilms. Mol. Oral. Microbiol. 2010, 25, 4–14. [Google Scholar] [CrossRef] [PubMed]
- Anderson, A.C.; Rothballer, M.; Altenburger, M.J.; Woelber, J.P.; Karygianni, L.; Lagkouvardos, I.; Hellwig, E.; Al-Ahmad, A. In-vivo shift of the microbiota in oral biofilm in response to frequent sucrose consumption. Sci. Rep. 2018, 8, 14202. [Google Scholar] [CrossRef]
- Bibbo, S.; Ianiro, G.; Giorgio, V.; Scaldaferri, F.; Masucci, L.; Gasbarrini, A.; Cammarota, G. The role of diet on gut microbiota composition. Eur. Rev. Med. Pharmacol. Sci. 2016, 20, 4742–4749. [Google Scholar]
- Romani Vestman, N.; Chen, T.; Lif Holgerson, P.; Ohman, C.; Johansson, I. Oral microbiota shift after 12-week supplementation with lactobacillus reuteri DSM 17938 and PTA 5289; A randomized control trial. PLoS ONE 2015, 10, e0125812. [Google Scholar] [CrossRef]
- Lamont, R.J.; Koo, H.; Hajishengallis, G. The oral microbiota: Dynamic communities and host interactions. Nat. Rev. Microbiol. 2018, 16, 745–759. [Google Scholar] [CrossRef]
- Belstrom, D.; Jersie-Christensen, R.R.; Lyon, D.; Damgaard, C.; Jensen, L.J.; Holmstrup, P.; Olsen, J.V. Metaproteomics of saliva identifies human protein markers specific for individuals with periodontitis and dental caries compared to orally healthy controls. PeerJ 2016, 4, e2433. [Google Scholar] [CrossRef]
- Esberg, A.; Haworth, S.; Brunius, C.; Lif Holgerson, P.; Johansson, I. Carbonic anhydrase 6 gene variation influences oral microbiota composition and caries risk in Swedish adolescents. Sci. Rep. 2019, 24, 452. [Google Scholar] [CrossRef]
- Blekhman, R.; Goodrich, J.K.; Huang, K.; Sun, Q.; Bukowski, R.; Bell, J.T.; Spector, T.D.; Keinan, A.; Ley, R.E.; Gevers, D.; et al. Host genetic variation impacts microbiome composition across human body sites. Genome Biol. 2015, 16, 191. [Google Scholar] [CrossRef]
- Aleti, G.; Baker, J.L.; Tang, X.; Alvarez, R.; Dinis, M.; Tran, N.C.; Melnik, A.V.; Zhong, C.; Ernst, M.; Dorrestein, P.C.; et al. Identification of the bacterial biosynthetic gene clusters of the oral microbiome illuminates the unexplored social language of bacteria during health and disease. MBio 2019, 10. [Google Scholar] [CrossRef] [PubMed]
- Divaris, K. Searching deep and wide: Advances in the molecular understanding of dental caries and periodontal disease. Adv. Dent. Res. 2019, 30, 40–44. [Google Scholar] [CrossRef] [PubMed]
- Bradshaw, D.J.; McKee, A.S.; Marsh, P.D. Effects of carbohydrate pulses and pH on population shifts within oral microbial communities in vitro. J. Dent. Res. 1989, 68, 1298–1302. [Google Scholar] [CrossRef] [PubMed]
- Tanner, A.C.R.; Kressirer, C.A.; Rothmiller, S.; Johansson, I.; Chalmers, N.I. The caries microbiome: Implications for reversing dysbiosis. Adv. Dent. Res. 2018, 29, 78–85. [Google Scholar] [CrossRef]
- Keller, M.K.; Kressirer, C.A.; Belstrom, D.; Twetman, S.; Tanner, A.C.R. Oral microbial profiles of individuals with different levels of sugar intake. J. Oral. Microbiol. 2017, 9, 1355207. [Google Scholar] [CrossRef]
- Tsutsumi, K.; Maruyama, M.; Uchiyama, A.; Shibasaki, K. Characterisation of a sucrose-independent in vitro biofilm model of supragingival plaque. Oral. Dis. 2018, 24, 465–475. [Google Scholar] [CrossRef]
- Wennerholm, K.; Birkhed, D.; Emilson, C.G. Effects of sugar restriction on Streptococcus mutans and Streptococcus sobrinus in saliva and dental plaque. Caries Res. 1995, 29, 54–61. [Google Scholar] [CrossRef]
- Hwang, L.D.; Lin, C.; Gharahkhani, P.; Cuellar-Partida, G.; Ong, J.S.; An, J.; Gordon, S.D.; Zhu, G.; MacGregor, S.; Lawlor, D.A.; et al. New insight into human sweet taste: A genome-wide association study of the perception and intake of sweet substances. Am. J. Clin. Nutr. 2019, 1, 1724–1737. [Google Scholar] [CrossRef]
- Robino, A.; Concas, M.P.; Catamo, E.; Gasparini, P. A brief review of genetic approaches to the study of food preferences: Current knowledge and future directions. Nutrients 2019, 26, 1735. [Google Scholar] [CrossRef]
- Cattaneo, C.; Gargari, G.; Koirala, R.; Laureati, M.; Riso, P.; Guglielmetti, S.; Pagliarini, E. New insights into the relationship between taste perception and oral microbiota composition. Sci. Rep. 2019, 5, 3549. [Google Scholar] [CrossRef]
- Cattaneo, C.; Riso, P.; Laureati, M.; Gargari, G.; Pagliarini, E. Exploring associations between interindividual differences in taste perception, oral microbiota composition, and reported food intake. Nutrients 2019, 24, 1167. [Google Scholar] [CrossRef] [PubMed]
- Besnard, P.; Christensen, J.E.; Brignot, H.; Bernard, A.; Passilly-Degrace, P.; Nicklaus, S.; Pais de Barros, J.P.; Collet, X.; Lelouvier, B.; Servant, F.; et al. Obese subjects with specific gustatory papillae microbiota and salivary cues display an impairment to sense lipids. Sci. Rep. 2018, 30, 6742. [Google Scholar] [CrossRef] [PubMed]
- Alcock, J.; Maley, C.C.; Aktipis, C.A. Is eating behavior manipulated by the gastrointestinal microbiota? Evolutionary pressures and potential mechanisms. Bioessays 2014, 36, 940–949. [Google Scholar] [CrossRef] [PubMed]
- Eriksson, L.; Esberg, A.; Haworth, S.; Holgerson, P.L.; Johansson, I. Allelic variation in taste genes is associated with taste and diet preferences and dental caries. Nutrients 2019, 29, 1491. [Google Scholar] [CrossRef] [PubMed]
- Fushan, A.A.; Simons, C.T.; Slack, J.P.; Drayna, D. Association between common variation in genes encoding sweet taste signaling components and human sucrose perception. Chem. Senses 2010, 35, 579–592. [Google Scholar] [CrossRef]
- Bolyen, E.; Rideout, J.R.; Dillon, M.R.; Bokulich, N.A.; Abnet, C.C.; Al-Ghalith, G.A.; Alexander, H.; Alm, E.J.; Arumugam, M.; Asnicar, F.; et al. Reproducible, interactive, scalable and extensible microbiome data science using QIIME 2. Nat. Biotechnol. 2019, 37, 852–857. [Google Scholar] [CrossRef]
- Callahan, B.J.; McMurdie, P.J.; Rosen, M.J.; Han, A.W.; Johnson, A.J.; Holmes, S.P. DADA2: High-resolution sample inference from Illumina amplicon data. Nat. Methods 2016, 13, 581–583. [Google Scholar] [CrossRef]
- Callahan, B.J.; McMurdie, P.J.; Holmes, S.P. Exact sequence variants should replace operational taxonomic units in marker-gene data analysis. ISME J. 2017, 11, 2639–2643. [Google Scholar] [CrossRef]
- Chen, T.; Yu, W.H.; Izard, J.; Baranova, O.V.; Lakshmanan, A.; Dewhirst, F.E. The human oral microbiome database: A web accessible resource for investigating oral microbe taxonomic and genomic information. Database (Oxford) 2010, 2010, 1–10. [Google Scholar] [CrossRef]
- Nettleton, J.A.; Hivert, M.F.; Lemaitre, R.N.; McKeown, N.M.; Mozaffarian, D.; Tanaka, T.; Wojczynski, M.K.; Hruby, A.; Djousse, L.; Ngwa, J.S.; et al. Meta-analysis investigating associations between healthy diet and fasting glucose and insulin levels and modification by loci associated with glucose homeostasis in data from 15 cohorts. Am. J. Epidemiol. 2013, 177, 103–115. [Google Scholar] [CrossRef]
- Johansson, I.; Hallmans, G.; Wikman, A.; Biessy, C.; Riboli, E.; Kaaks, R. Validation and calibration of food-frequency questionnaire measurements in the Northern Sweden Health and Disease cohort. Public Health Nutr. 2002, 5, 487–496. [Google Scholar] [CrossRef] [PubMed]
- Wennberg, M.; Vessby, B.; Johansson, I. Evaluation of relative intake of fatty acids according to the Northern Sweden FFQ with fatty acid levels in erythrocyte membranes as biomarkers. Public Health Nutr 2009, 12, 1477–1484. [Google Scholar] [CrossRef] [PubMed]
- Klingberg, S.; Ellegard, L.; Johansson, I.; Jansson, J.H.; Hallmans, G.; Winkvist, A. Dietary intake of naturally occurring plant sterols is related to a lower risk of a first myocardial infarction in men but not in women in northern Sweden. J. Nutr. 2013, 143, 1630–1635. [Google Scholar] [CrossRef] [PubMed]
- Johansson, I.; Holgerson, P.L.; Kressin, N.R.; Nunn, M.E.; Tanner, A.C. Snacking habits and caries in young children. Caries Res. 2010, 44, 421–430. [Google Scholar] [CrossRef]
- Black, A.E. Critical evaluation of energy intake using the Goldberg cut-off for energy intake: Basal metabolic rate. A practical guide to its calculation, use and limitations. Int. J. Obes. Relat. Metab. Disord. 2000, 24, 1119–1130. [Google Scholar] [CrossRef]
- Pitts, N.B.; Ekstrand, K.R.; Foundation, I. International Caries Detection and Assessment System (ICDAS) and its International Caries Classification and Management System (ICCMS) - methods for staging of the caries process and enabling dentists to manage caries. Community Dent. Oral. Epidemiol. 2013, 41, e41–e52. [Google Scholar] [CrossRef]
- Douglas, G.M.; Beiko, R.G.; Langille, M.G.I. Predicting the functional potential of the microbiome from marker genes using PICRUSt. Methods Mol. Biol. 2018, 1849, 169–177. [Google Scholar] [CrossRef]
- Moriya, Y.; Itoh, M.; Okuda, S.; Yoshizawa, A.C.; Kanehisa, M. KAAS: An automatic genome annotation and pathway reconstruction server. Nucleic Acids Res. 2007, 35, W182–W185. [Google Scholar] [CrossRef]
- Langille, M.G.; Zaneveld, J.; Caporaso, J.G.; McDonald, D.; Knights, D.; Reyes, J.A.; Clemente, J.C.; Burkepile, D.E.; Vega Thurber, R.L.; Knight, R.; et al. Predictive functional profiling of microbial communities using 16S rRNA marker gene sequences. Nat. Biotechnol. 2013, 31, 814–821. [Google Scholar] [CrossRef]
- DeSantis, T.Z.; Hugenholtz, P.; Larsen, N.; Rojas, M.; Brodie, E.L.; Keller, K.; Huber, T.; Dalevi, D.; Hu, P.; Andersen, G.L. Greengenes, a chimera-checked 16S rRNA gene database and workbench compatible with ARB. Appl. Environ. Microbiol. 2006, 72, 5069–5072. [Google Scholar] [CrossRef]
- Szklarczyk, D.; Morris, J.H.; Cook, H.; Kuhn, M.; Wyder, S.; Simonovic, M.; Santos, A.; Doncheva, N.T.; Roth, A.; Bork, P.; et al. The STRING database in 2017: Quality-controlled protein-protein association networks, made broadly accessible. Nucleic Acids Res. 2017, 45, D362–D368. [Google Scholar] [CrossRef] [PubMed]
- Segata, N.; Izard, J.; Waldron, L.; Gevers, D.; Miropolsky, L.; Garrett, W.S.; Huttenhower, C. Metagenomic biomarker discovery and explanation. Genome Biol. 2011, 12, R60. [Google Scholar] [CrossRef] [PubMed]
- Oliveros, J.C.; VENNY. An Interactive Tool for Comparing Lists with Venn Diagrams. Available online: http://bioinfogpcnbcsices/tools/venny/indexhtml (accessed on 12 December 2019).
- Marsh, P.D.; Zaura, E. Dental biofilm: Ecological interactions in health and disease. J. Clin. Periodontol. 2017, 44, S12–S22. [Google Scholar] [CrossRef] [PubMed]
- Takahashi, N.; Nyvad, B. The role of bacteria in the caries process: Ecological perspectives. J. Dent. Res. 2011, 90, 294–303. [Google Scholar] [CrossRef]
- Marsh, P.D. In sickness and in health-what does the oral microbiome mean to us? An ecological perspective. Adv. Dent. Res. 2018, 29, 60–65. [Google Scholar] [CrossRef]
- Verma, D.; Garg, P.K.; Dubey, A.K. Insights into the human oral microbiome. Arch. Microbiol. 2018, 200, 525–540. [Google Scholar] [CrossRef]
- Eriksson, L.; Lif Holgerson, P.; Johansson, I. Saliva and tooth biofilm bacterial microbiota in adolescents in a low caries community. Sci. Rep. 2017, 7, 5861. [Google Scholar] [CrossRef]
- Borkent, D.; Reardon, R.J.M.; Mc, L.G.; Glendinning, L.; Dixon, P.M. A microbiome analysis of equine peripheral dental caries using next generation sequencing. Equine Vet. J. 2020, 52, 67–75. [Google Scholar] [CrossRef]
- Poslusna, K.; Ruprich, J.; de Vries, J.H.; Jakubikova, M.; van’t Veer, P. Misreporting of energy and micronutrient intake estimated by food records and 24 h recalls, control and adjustment methods in practice. Br. J. Nutr. 2009, 101, S73–S85. [Google Scholar] [CrossRef]
- Moraeus, L.; Lemming, E.W.; Hursti, U.K.; Arnemo, M.; Sipinen, J.P.; Lindroos, A.K. Riksmaten Adolescents 2016–2017: A national dietary survey in Sweden—Design, methods, and participation. Food Nutr. Res. 2018, 62. [Google Scholar] [CrossRef]
- Bowen, W.H.; Burne, R.A.; Wu, H.; Koo, H. Oral biofilms: Pathogens, matrix, and polymicrobial interactions in microenvironments. Trends Microbiol. 2018, 26, 229–242. [Google Scholar] [CrossRef] [PubMed]
- Rawal, S.; Hayes, J.E.; Wallace, M.R.; Bartoshuk, L.M.; Duffy, V.B. Do polymorphisms in the TAS1R1 gene contribute to broader differences in human taste intensity? Chem. Senses 2013, 38, 719–728. [Google Scholar] [CrossRef] [PubMed]
- Xu, H.; Staszewski, L.; Tang, H.; Adler, E.; Zoller, M.; Li, X. Different functional roles of T1R subunits in the heteromeric taste receptors. Proc. Natl. Acad. Sci. USA 2004, 101, 14258–14263. [Google Scholar] [CrossRef] [PubMed]
- Laffitte, A.; Neiers, F.; Briand, L. Functional roles of the sweet taste receptor in oral and extraoral tissues. Curr. Opin. Clin. Nutr. Metab. Care 2014, 17, 379–385. [Google Scholar] [CrossRef] [PubMed]
- Garcia-Bailo, B.; Toguri, C.; Eny, K.M.; El-Sohemy, A. Genetic variation in taste and its influence on food selection. OMICS 2009, 13, 69–80. [Google Scholar] [CrossRef] [PubMed]
- Castelino, M.; Eyre, S.; Moat, J.; Fox, G.; Martin, P.; Ho, P.; Upton, M.; Barton, A. Optimisation of methods for bacterial skin microbiome investigation: Primer selection and comparison of the 454 versus MiSeq platform. BMC Microbiol. 2017, 21, 23. [Google Scholar] [CrossRef]
- Teng, F.; Nair, S.S.D.; Zhu, P.; Li, S.; Huang, S.; Li, X.; Xu, J.; Yang, F. Impact of DNA extraction method and targeted 16S-rRNA hypervariable region on oral microbiota profiling. Sci. Rep. 2018, 5, 16321. [Google Scholar] [CrossRef]


| Mean (95% CI limits) or % | |
|---|---|
| Women, % | 51.4 |
| Age, years | 18.1 (18.0, 18.3) |
| BMI, kg/m2 | 22.7 (22.2, 23.2) |
| Overweight/obese (BMI >25), % | 20.6 |
| Smoking, % | |
| Present | 4.4 |
| Past | 3.4 |
| Swedish snus, % | |
| Present | 2.9 |
| Past | 8.6 |
| Dieta | |
| total energy, kcal/day | 1 855 (1 754, 1 956) |
| carbohydrates, E% | 40.3 (39.3, 41.4) |
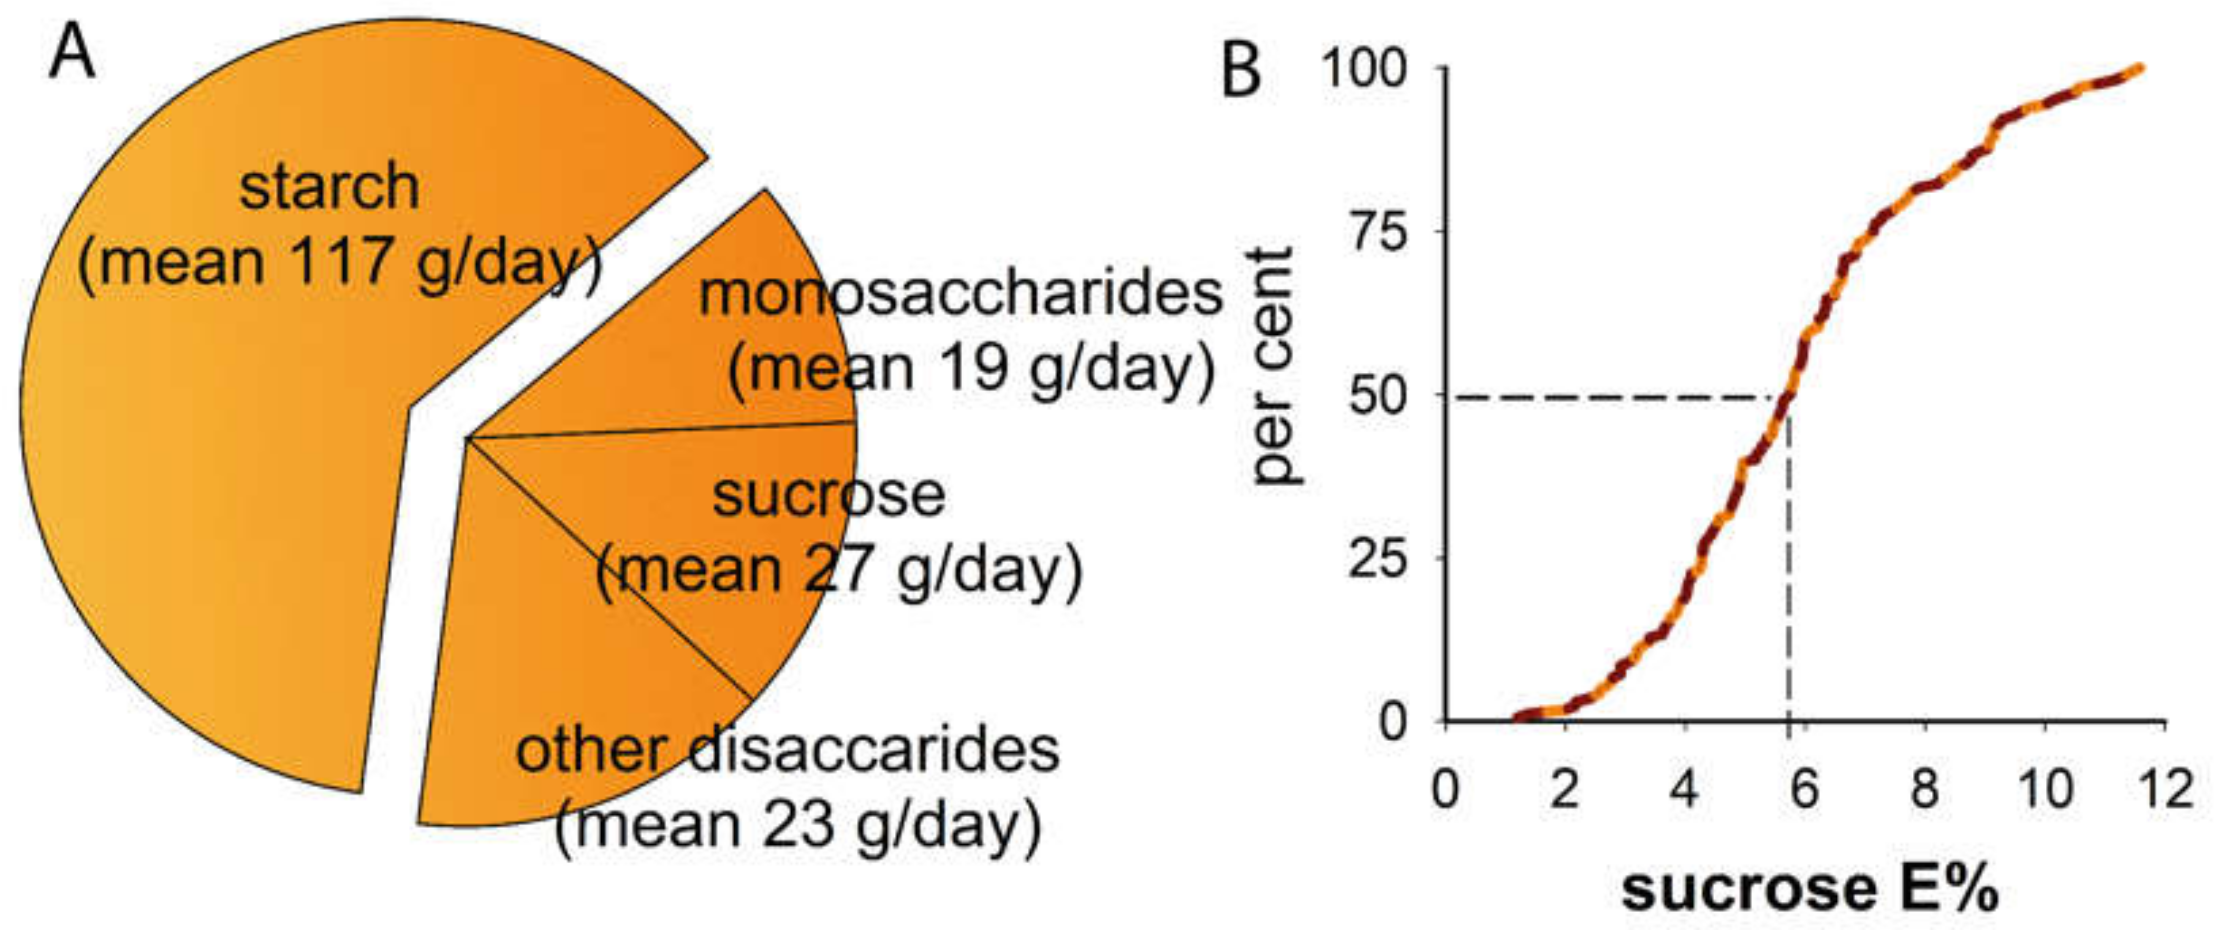
| sugar, E% | 15.0 (14.4, 15.7) |
| sucrose, E% | 5.9 (5.6, 6.3) |
| protein, E% | 14.1 (13.7, 14.6) |
| fat, E% | 44.6 (43.4, 45.7) |
| sweet sugar snacks, daily frequency | 1.1 (1.0, 1.2) |
| sweet non-sugar products, daily frequency | 0.12 (0.08, 0.15) |
| milk, grams/day | 209 (173, 245) |
| healthy diet score | 12.1 (11.5, 12.7) |
| probiotic product latest month, % | 8.3 |
| Oral parametersb | |
| saliva flow rate, ml/minc | 1.5 (1.4, 1.6) |
| proportion caries affected (DeFS>0), % | 69.7 |
| bleeding gums, % | 31.1 |
| tooth brushing ≥once a day, % | 78.1 |
| flossing or other proximal cleaning, % | 25.9 |
| any type of extra fluoride,% | 6.0 |
| mutans streptococci, median (5, 95 percentiles) for colony-forming units (CFU)/mL saliva | 398 (0, 26) |
| lactobacilli, median (5, 95 percentiles) for CFU/mL saliva | 50 (0, 53) |
| SNP variants | |
| TAS1R1 rs731024 (AA), % | 12.0 |
| GNAT3 rs2074673 (GG+GA), % | 62.3 |
| GNAT3 rs11760281 (AA+AG), % | 50.3 |
| Cluster by dichotomized sequence variants with ≥2 reads per ASV | |||||
|---|---|---|---|---|---|
| Cluster ASV1 | Cluster ASV2 | Cluster ASV3 | Cluster ASV4 | p-valuea | |
| n = 42 | n = 74 | n = 51 | n = 8 | ||
| Women, % | 45.2 | 51.4 | 58.8 | 37.5 | 0.497 |
| Age | 18.0 (17.7, 18.3) | 18.1 (17.8, 18.3) | 18.2 (17.9, 18.5) | 18.8 (18.0, 19.5) | 0.281 |
| BMIb | 23.0 (22.0, 24.0) | 22.5 (21.7, 23.3) | 22.6 (21.7, 23.6) | 23.6 (21.3, 25.9) | 0.730 |
| Smoking, % | 0.244 | ||||
| Present | 4.8 | 8.2 | 0.0 | 0.0 | |
| Past | 7.1 | 1.4 | 3.9 | 0.0 | |
| Swedish snus, % | 0.576 | ||||
| Present | 2.4 | 1.4 | 3.9 | 12.5 | |
| Past | 11.9 | 8.2 | 5.9 | 12.5 | |
| Dietc | |||||
| total energy, kcal/day | 1914 (1702, 2125) | 1875 (1721, 2030) | 1793 (1600, 1985) | 1754 (1291, 2218) | 0.591 |
| carbohydrates, E% | 42.4 (40.4, 44.6) | 38.9 (37.3, 40.5) | 40.5 (38.6, 42.5) | 42.4 (37.5, 46.9) | 0.136 |
| sugar, E% | 16.6 (15.3, 17.9) | 13.6 (12.7, 14.6) | 15.7 (14.6, 16.9) | 16.4 (13.6, 19.2) | 0.001 |
| sucrose, E% | 6.8 (6.1, 7.4) | 5.3 (4.8, 5.7) | 6.2 (5.6, 6.9) | 6.2 (4.7, 7.7) | 0.008 |
| protein, E% | 13.4 (12.5, 14.4) | 14.6 (13.9, 15.3) | 14.2 (13.4, 15.1) | 12.3 (10.2, 14.3) | 0.173 |
| fat, E% | 43.3 (40.9, 45.8) | 45.3 (43.5, 47.1) | 44.4 (42.2, 46.6) | 44.5 (39.2, 49.8) | 0.865 |
| sweet sugar snacks, daily frequency | 1.3 (1.1, 1.5) | 1.0 (0.8, 1.1) | 1.1 (0.9, 1.3) | 1.2 (0.7, 1.7) | 0.155 |
| sweet non-sugar products, daily frequency | 0.12 (0.04, 0.19) | 0.12 (0.06, 0.17) | 0.11 (0.04, 0.18) | 0.11 (0.0, 0.27) | 0.999 |
| milk, gram/day | 210 (126, 293) | 208 (161, 256) | 82 (0, 224) | 258 (181, 334) | 0.152 |
| healthy diet score | 11.8 (10.6, 13.0) | 12.0 (11.1, 12.9) | 12.1 (11.0, 13.1) | 11.8 (11.1, 16.5) | 0.629 |
| Gene polymorphism | |||||
| TAS1R1 (rs731024), % AA | 23.8 | 6.8 | 5.9 | 37.5 | 0.003 |
| GNAT3 (rs2074673) % GG+GA | 54.8 | 65.8 | 72.5 | 12.5 | 0.007 |
| GNAT3 (rs11760281) % AA+AG | 38.1 | 52.1 | 64.7 | 12.5 | 0.010 |
| Oral parametersd | |||||
| saliva flow rate, ml/mine | 1.3 (1.0. 1.5) | 1.6 (1.5, 1.8) | 1.5 (1.3, 1.7) | 1.0 (0.5, 1.5) | 0.031 |
| DeFSe | 6.3 (4.1, 3.2) | 4.2 (2.6, 5.8) | 4.4 (2.4, 6.3) | 3.8 (1.0, 8.7) | 0.429 |
| bleeding gums, % | 24.3 | 29.0 | 40.9 | 25.0 | 0.387 |
| daily tooth brushing, % | 68.3 | 87.5 | 79.6 | 75.0 | 0.103 |
| extra fluoride, % | 7.7 | 7.1 | 2.0 | 12.5 | 0.497 |
| Cluster by dichotomous eHOMD-aggregated species with >25 reads | |||||
| Cluster H1 | Cluster H2 | Cluster H3 | Cluster H4 | p-valuea | |
| n = 70 | n = 33 | n = 48 | n = 24 | ||
| Women, % | 50.0 | 63.6 | 41.7 | 58.3 | 0.229 |
| Sugarc, E% | 15.8 (14.8, 16.8) | 15.9 (14.3, 17.4) | 13.2 (12.1, 14.4) | 15.6 (13.9, 17.2) | 0.006 |
| Sucrosec, E% | 6.5 (6.0, 7.0) | 6.4 (5.7, 7.2) | 4.9 (4.3, 5.5) | 6.0 (5.2, 6.9) | <0.001 |
| SNP variants | |||||
| GNAT3 (rs2074673) % GG+GA | 56.5 | 84.8 | 66.7 | 41.7 | 0.005 |
| GNAT3 (rs11760281) % AA+AG | 47.8 | 72.2 | 54.2 | 20.8 | 0.001 |
| Cluster H1 (n = 70) | Cluster H2 (n = 33) | Cluster H4 (n = 24) |
|---|---|---|
| model R2 = 50%, Q2 = 50% | model R2 = 84%, Q2 = 63% | model R2 = 80, Q2 = 53 |
| sucrose intake = 6.5 E% | sucrose intake 6.4 E% | sucrose intake 6.0 E% |
| DeFS = 5.8 | DeFS = 4.5 | DeFS = 5.1 |
| sucrose, E% | sucrose, E% | sucrose, E% |
| sugar, E% | sugar, E% | sugar, Eproc |
| milk 3% | milk, 1,5% | |
| monosaccharides, E% | ||
| Actinomyces sp. HMT171 | Actinomyces israelii | Actinomyces odontolyticus |
| Actinomyces sp. HMT178 | Actinomyces massiliensis | Actinomyces sp. HMT171 |
| Alloprevotella sp. HMT308 | Actinomyces sp. HMT171 | Actinomyces sp. HMT448 |
| Alloscardovia omnicolens | Actinomyces sp. HMT178 | Aggregatibacter sp. HMT458 |
| Bifidobacterium longum | Actinomyces sp. HMT897 | Alloprevotella sp. HMT308 |
| Capnocytophaga sp. HMT326 | Aggregatibacter sp. HMT458 | Bacteroidales [G-2] bacterium HMT274 |
| Capnocytophaga sp. HMT902 | Aggregatibacter sp. HMT949 | Bacteroidetes [G-5] bacterium HMT505 |
| Dietzia cinnamea | Alloprevotella sp. HMT912 | Bacteroidetes [G-5] bacterium HMT511 |
| Lachnoanaerobaculum orale | Alloprevotella sp. HMT913 | Capnocytophaga sp. HMT326 |
| lactobacilli, culture | Atopobium rimae | Capnocytophaga sp. HMT338 |
| Leptotrichia wadei | Bacteroidales [G-2] bacterium HMT274 | Corynebacterium singulare |
| Megasphaera micronuciformis | Bacteroidetes [G-3] bacterium HMT281 | Dialister invisus |
| mutans streptococci, culture | Bacteroidetes [G-5] bacterium HMT511 | Dialister pneumosintes |
| Olsenella sp. HMT807 | Bergeyella sp. HMT206 | Fusobacterium nucleatum ssp. animalis |
| Peptostreptococcaceae [XI][G-7] yurii | Bergeyella sp. HMT907 | Granulicatella elegans |
| Prevotella histicola | Bifidobacterium dentium | Haemophilus parahaemolyticus |
| Prevotella sp. HMT305 | Butyrivibrio sp. HMT080 | Kingella oralis |
| Prevotella sp. HMT306 | Campylobacter gracilis | Lachnoanaerobaculum orale |
| Prevotella sp. HMT313 | Capnocytophaga granulosa | Lactobacillus crispatus |
| Prevotella sp. HMT317 | Capnocytophaga haemolytica | Leptotrichia sp. HMT221 |
| Scardovia wiggsiae | Capnocytophaga ochracea | Leptotrichia wadei |
| Stomatobaculum longum | Capnocytophaga sp. HMT326 | Megasphaera micronuciformis |
| Streptococcus intermedius | Capnocytophaga sp. HMT332 | Mycoplasma faucium |
| Streptococcus mutans | Capnocytophaga sp. HMT338 | Neisseria bacilliformis |
| Streptococcus parasanguinis clade411 | Capnocytophaga sp. HMT903 | Olsenella sp. HMT807 |
| Veillonella atypica | Cardiobacterium valvarum | Peptococcus sp. HMT167 |
| Veillonella dispar | Catonella sp. HMT164 | Peptostreptococcaceae [XI][G-5] saphenum |
| Dialister pneumosintes | Peptostreptococcaceae [XI][G-9] brachy | |
| Eikenella corrodens | Porphyromonas endodontalis | |
| Fusobacterium hwasookii | Prevotella denticola | |
| Fusobacterium naviforme | Prevotella histicola | |
| Fusobacterium nucleatum subsp. animalis | Prevotella intermedia | |
| Fusobacterium nucleatum subsp. polymorphum | Prevotella sp. HMT305 | |
| Fusobacterium sp. HMT204 | Prevotella sp. HMT306 | |
| Gemella morbillorum | Prevotella sp. HMT317 | |
| Haemophilus haemolyticus | Saccharibacteria (TM7) [G-5] bacterium HMT356 | |
| Johnsonella sp. HMT166 | Scardovia wiggsiae | |
| Kingella denitrificans | Streptococcus mutans | |
| Kingella oralis | Streptococcus parasanguinis clade 411 | |
| Kingella sp. HMT012 | Streptococcus sobrinus | |
| Lachnoanaerobaculum saburreum | Streptococcus sp. HMT057 | |
| Leptotrichia buccalis | Tannerella forsythia | |
| Leptotrichia shahii | Treponema denticola | |
| Leptotrichia sp. HMT219 | Treponema lecithinolyticum | |
| Leptotrichia sp. HMT223 | Treponema socranskii | |
| Leptotrichia sp. HMT392 | Treponema sp. HMT237 | |
| Leptotrichia sp. HMT498 | Veillonella atypica | |
| Leptotrichia wadei | Veillonella dispar | |
| Mycoplasma salivarium | GNAT3 (rs11760281 | |
| Olsenella sp. HMT807 | ||
| Oribacterium sp. HMT078 | ||
| Ottowia sp. HMT894 | ||
| Parvimonas micra | ||
| Peptococcus sp. HMT167 | ||
| Peptostreptococcaceae [XI][G-5] saphenum | ||
| Peptostreptococcaceae [XI][G-7] bacterium HMT081 | ||
| Peptostreptococcaceae [XI][G-7] yurii | ||
| Porphyromonas catoniae | ||
| Porphyromonas sp. HMT275 | ||
| Porphyromonas sp. HMT278 | ||
| Prevotella fusca | ||
| Prevotella intermedia | ||
| Prevotella maculosa | ||
| Prevotella micans | ||
| Prevotella nigrescens | ||
| Prevotella oulorum | ||
| Prevotella pleuritidis | ||
| Prevotella saccharolytica | ||
| Prevotella sp. HMT300 | ||
| Prevotella sp. HMT301 | ||
| Prevotella sp. HMT317 | ||
| Prevotella sp. HMT472 | ||
| Prevotella sp. HMT475 | ||
| Rothia aeria | ||
| Saccharibacteria (TM7) [G-1]bacterium HMT348 | ||
| Saccharibacteria (TM7) [G-5] bacterium HMT356 | ||
| Selenomonas noxia | ||
| Stomatobaculum longum | ||
| Streptococcus constellatus | ||
| Streptococcus gordonii | ||
| Streptococcus intermedius | ||
| Streptococcus parasanguinis clade 411 | ||
| Tannerella forsythia | ||
| Treponema socranskii | ||
| Treponema sp. HMT237 | ||
| Treponema sp. HMT246 | ||
| Treponema sp. HMT262 |
© 2020 by the authors. Licensee MDPI, Basel, Switzerland. This article is an open access article distributed under the terms and conditions of the Creative Commons Attribution (CC BY) license (http://creativecommons.org/licenses/by/4.0/).
Share and Cite
Esberg, A.; Haworth, S.; Hasslöf, P.; Lif Holgerson, P.; Johansson, I. Oral Microbiota Profile Associates with Sugar Intake and Taste Preference Genes. Nutrients 2020, 12, 681. https://doi.org/10.3390/nu12030681
Esberg A, Haworth S, Hasslöf P, Lif Holgerson P, Johansson I. Oral Microbiota Profile Associates with Sugar Intake and Taste Preference Genes. Nutrients. 2020; 12(3):681. https://doi.org/10.3390/nu12030681
Chicago/Turabian StyleEsberg, Anders, Simon Haworth, Pamela Hasslöf, Pernilla Lif Holgerson, and Ingegerd Johansson. 2020. "Oral Microbiota Profile Associates with Sugar Intake and Taste Preference Genes" Nutrients 12, no. 3: 681. https://doi.org/10.3390/nu12030681
APA StyleEsberg, A., Haworth, S., Hasslöf, P., Lif Holgerson, P., & Johansson, I. (2020). Oral Microbiota Profile Associates with Sugar Intake and Taste Preference Genes. Nutrients, 12(3), 681. https://doi.org/10.3390/nu12030681