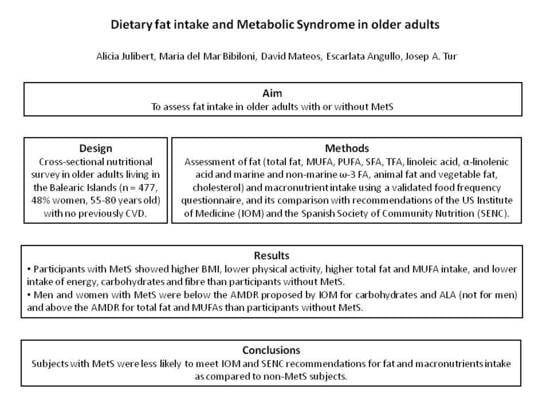
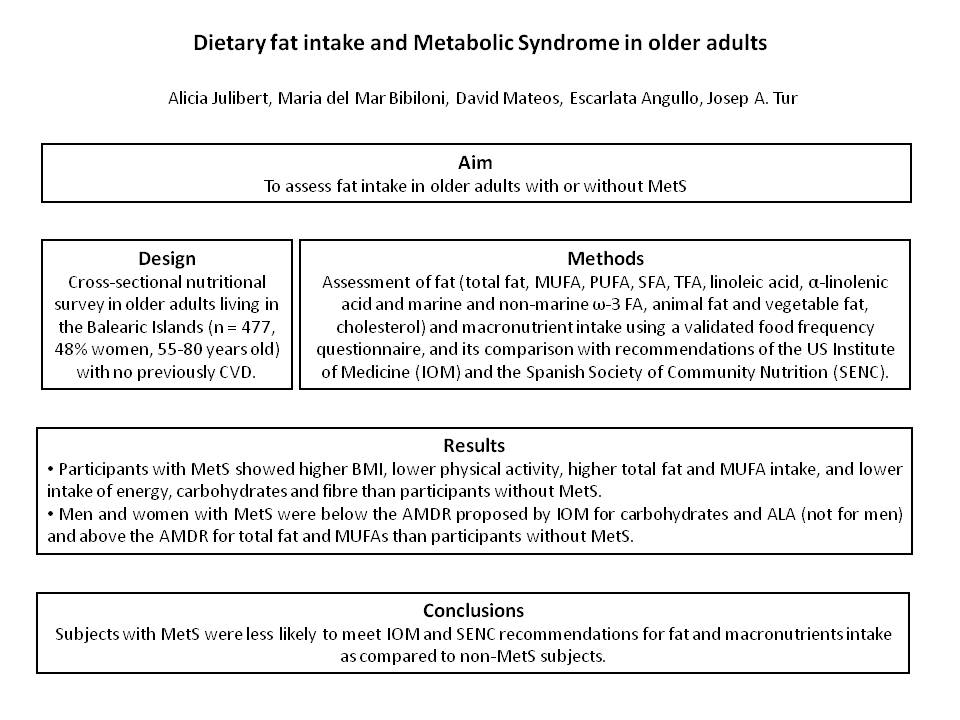
Dietary Fat Intake and Metabolic Syndrome in Older Adults


Abstract
1. Introduction
2. Materials and Methods
2.1. Design and Participants
2.2. Anthropometric Measurements
2.3. Blood Collection and Analysis
2.4. Dietary Intake Assessment
2.5. Socioeconomic and Lifestyle Determinants
2.6. Statistical Analyses
3. Results
4. Discussion
Strengths and Limitations of the Study
5. Conclusions
Author Contributions
Acknowledgments
Conflicts of Interest
References
- Grundy, S.M.; Hansen, B.; Smith, S.C., Jr.; Cleeman, J.I.; Kahn, R.A.; American Heart Association; National Heart, Lung, and Blood Institute; American Diabetes Association. Clinical management of metabolic syndrome: Report of the American Heart Association/National Heart, Lung, and Blood Institute/American Diabetes Association conference on scientific issues related to management. Circulation 2004, 109, 551–556. [Google Scholar] [CrossRef] [PubMed]
- Alberti, K.G.; Eckel, R.H.; Grundy, S.M.; Zimmet, P.Z.; Cleeman, J.I.; Donato, K.A.; Fruchart, J.C.; James, W.P.; Loria, C.M.; Smith, S.C., Jr.; et al. Harmonizing the metabolic syndrome: A joint interim statement of the International Diabetes Federation Task Force on Epidemiology and Prevention. Circulation 2009, 120, 1640–1645. [Google Scholar] [CrossRef] [PubMed]
- O’Neill, S.; O’Driscoll, L. Metabolic syndrome: A closer look at the growing epidemic and its associated pathologies. Obes Rev. 2015, 16, 1–12. [Google Scholar] [CrossRef] [PubMed]
- Beltran-Sanchez, H.; Harhay, M.O.; Harhay, M.M.; McElligott, S. Prevalence and trends of metabolic syndrome in the adult U.S. population, 1999–2010. J. Am. Coll. E703Cardiol. 2013, 62, 697–703. [Google Scholar] [CrossRef] [PubMed]
- Pérez-Martínez, P.; Mikhailidis, D.P.; Athyros, V.G.; Bullo, M.; Couture, P.; Covas, M.I.; de Koning, L.; Delgado-Lista, J.; Díaz-López, A.; Drevon, C.A.; et al. Lifestyle recommendations for the prevention and management of metabolic syndrome: An international panel recommendation. Nutr. Rev. 2017, 75, 307–326. [Google Scholar] [CrossRef] [PubMed]
- De Carvalho-Vidigal, F.; Bressan, J.; Babio, N.; Salas-Salvadó, J. Prevalence of metabolic syndrome in Brazilian adults: A systematic review. BMC Public Health 2013, 13, 1198. [Google Scholar] [CrossRef] [PubMed]
- Godos, J.; Zappalà, G.; Bernardini, S.; Giambini, I.; Bes-Rastrollo, M.; Martinez-Gonzalez, M. Adherence to the Mediterranean diet is inversely associated with metabolic syndrome occurrence: A meta-analysis of observational studies. Int. J. Food Sci. Nutr. 2017, 68, 138–148. [Google Scholar] [CrossRef]
- Ruiz, E.; Ávila, J.M.; Valero, T.; Del Pozo, S.; Rodriguez, P.; Aranceta-Bartrina, J.; Gil, Á.; González-Gross, M.; Ortega, R.M.; Serra-Majem, L.; et al. Macronutrient Distribution and Dietary Sources in the Spanish Population: Findings from the ANIBES Study. Nutrients 2016, 8, 177. [Google Scholar] [CrossRef]
- Cano-Ibáñez, N.; Gea, A.; Martínez-González, M.A.; Salas-Salvadó, J.; Corella, D.; Zomeño, M.D.; Romaguera, D.; Vioque, J.; Aros, F.; Wärnberg, J.; et al. Dietary Diversity and Nutritional Adequacy among an Older Spanish Population with Metabolic Syndrome in the PREDIMED-PlusStudy: A Cross-Sectional Analysis. Nutrients 2019, 11, 958. [Google Scholar] [CrossRef]
- U.S. Department of Health and Human Services; U.S. Department of Agriculture. 2015–2020 Dietary Guidelines for Americans, 8th ed.; Government Printing Office: Washington, DC, USA, 2015.
- McKeown, N.M.; Meigs, J.B.; Liu, S.; Saltzman, E.; Wilson, P.W.; Jacques, P.F. Carbohydrate Nutrition, Insulin Resistance, and the Prevalence of the Metabolic Syndrome in the Framingham Offspring Cohort. Diabetes Care 2004, 27, 538–546. [Google Scholar] [CrossRef]
- Freire, R.D.; Cardoso, M.A.; Gimeno, S.G.; Ferreira, S.R. for the Japanese-Brazilian Diabetes Study Group Dietary Fat Is Associated With Metabolic Syndrome in Japanese Brazilians. Diabetes Care 2005, 28, 1779–1785. [Google Scholar] [CrossRef] [PubMed]
- Bruscato, N.M.; Vieira, J.L.D.C.; Nascimento, N.M.R.D.; Canto, M.E.P.; Stobbe, J.C.; Gottlieb, M.G.; Wagner, M.B.; Dalacorte, R.R. Dietary intake is not associated to the metabolic syndrome in elderly women. North. Am. J. Med. Sci. 2010, 2, 182–188. [Google Scholar]
- Guo, X.F.; Li, X.; Shi, M.; Li, D. n-3 Polyunsaturated Fatty Acids and Metabolic Syndrome Risk: A Meta-Analysis. Nutr. 2017, 9, 703. [Google Scholar] [CrossRef] [PubMed]
- da Cunha, A.T.; Pereira, H.T.; de Aquino, S.L.; Sales, C.H.; Sena-Evangelista, K.C.; Lima, J.G.; Lima, S.C.; Pedrosa, L.F. Inadequacies in the habitual nutrient intakes of patients with metabolic syndrome: A cross-sectional study. Diabetol. Metab. Syndr. 2016, 8, 32. [Google Scholar] [CrossRef] [PubMed]
- Al-Daghri, N.M.; Khan, N.; Alkharfy, K.M.; Al-Attas, O.S.; Alokail, M.S.; Alfawaz, H.A.; Alothman, A.; Vanhoutte, P.M. Selected Dietary Nutrients and the Prevalence of Metabolic Syndrome in Adult Males and Females in Saudi Arabia: A Pilot Study. Nutrients 2013, 5, 4587–4604. [Google Scholar] [CrossRef] [PubMed]
- de Oliveira, E.P.; McLellan, K.C.; Vaz de Arruda Silveira, L.; Burini, R.C. Dietary factors associated with metabolic syndrome in Brazilian adults. Nutr. J. 2012, 11, 3. [Google Scholar] [CrossRef] [PubMed]
- Zhao, M.; Chiriboga, D.; Olendzki, B.; Xie, B.; Li, Y.; McGonigal, L.J.; Maldonado-Contreras, A.; Ma, Y. Substantial Increase in Compliance with Saturated Fatty Acid Intake Recommendations after One Year Following the American Heart Association Diet. Nutrients 2018, 10, 1486. [Google Scholar] [CrossRef] [PubMed]
- Zhang, L.; Pagoto, S.; May, C.; Olendzki, B.; Tucker, L.K.; Ruiz, C.; Cao, Y.; Ma, Y. Effect of AHA dietary counselling on added sugar intake among participants with metabolic syndrome. Eur. J. Nutr. 2018, 57, 1073–1082. [Google Scholar] [CrossRef] [PubMed]
- Rodríguez-Monforte, M.; Sánchez, E.; Barrio, F.; Costa, B.; Flores-Mateo, G. Metabolic syndrome and dietary patterns: A systematic review and meta-analysis of observational studies. Eur. J. Nutr. 2017, 56, 925–947. [Google Scholar] [CrossRef]
- Amor, A.J.; Masana, L.; Soriguer, F.; Goday, A.; Calle-Pascual, A.; Gaztambide, S.; Rojo-Martínez, G.; Valdés, S.; Gomis, R.; Ortega, E.; et al. Estimating Cardiovascular Risk in Spain by the European Guidelines on Cardiovascular Disease Prevention in Clinical Practice. Rev. Esp. Cardiol. (Engl. Ed). 2015, 68, 417–425. [Google Scholar] [CrossRef]
- Fernandez-Ballart, J.D.; Piñol, J.L.; Zazpe, I.; Corella, D.; Carrasco, P.; Toledo, E.; Perez-Bauer, M.; Martínez-González, M.Á.; Salas-Salvadó, J.; Martín-Moreno, J.M. Relative validity of a semi-quantitative food-frequency questionnaire in an elderly Mediterranean population of Spain. Br. J. Nutr. 2010, 103, 1808–1816. [Google Scholar] [CrossRef]
- Moreiras, O.; Carbajal, A.; Cabrera, L.; Cuadrado, C. Tablas de Composición de Alimentos, 17th ed.; Food Composition Tables; Piramide: Madrid, Spain, 2015. [Google Scholar]
- BEDCA: Base de Datos Española de Composición de Alimentos. Available online: http://www.bedca.net/ (accessed on 10 February 2019).
- Sánchez-Tainta, A.; Zazpe, I.; Bes-Rastrollo, M.; Salas-Salvadó, J.; Bullo, M.; Sorlí, J.V.; Corella, D.; Covas, M.I.; Arós, F.; Gutierrez-Bedmar, M. Nutritional adequacy according to carbohydrates and fat quality. Eur. J. Nutr. 2016, 55, 93–106. [Google Scholar] [CrossRef] [PubMed]
- The National Academies of Sciences Engineering Medicine; Institute of Medicine; Food and Nutrition Board. Dietary Reference Intakes (DRIs): Acceptable Macronutrient Distribution Ranges. Available online: http://nationalacademies.org/HMD/Activities/Nutrition/SummaryDRIs/DRI-Tables.aspx (accessed on 11 April 2019).
- SENC. Objetivosnutricionales para la población española. Consenso de la Sociedad Española de NutriciónComunitaria 2011. Rev. Esp. Nutr. Com. 2011, 17, 178–199. [Google Scholar]
- Elosua, R.; García, M.; Aguilar, A.; Molina, L.; Covas, M.I.; Marrugat, J. Validation of the Minnesota Leisure Time Physical Activity Questionnaire in Spanish Women. Med. Sci. Sports Exerc. 2000, 32, 1431–1437. [Google Scholar] [CrossRef]
- Elosua, R.; Marrugat, J.; Molina, L.; Pons, S.; Pujol, E. Validation of the Minnesota Leisure Time Physical Activity Questionnaire in Spanish Men. Am. J. Epidemiol. 1994, 139, 1197–1209. [Google Scholar] [CrossRef] [PubMed]
- Conway, J.M.; Seale, J.L.; Jacobs, D.R.; Irwin, M.L.; Ainsworth, B.E. Comparison of energy expenditure estimates from doubly labeled water, a physical activity questionnaire, and physical activity records1–3. Am. J. Clin. Nutr. 2002, 75, 519–525. [Google Scholar] [CrossRef]
- Ainsworth, B.E.; Haskell, W.L.; Whitt, M.C.; Irwin, M.L.; Swartz, A.M.; Strath, S.J.; O’brien, W.L.; Bassett, D.R.; Schmitz, K.H.; Emplaincourt, P.O.; et al. Compendium of Physical Activities: An update of activity codes and MET intensities. Med. Sci. Sports Exerc. 2000, 32, S498–S516. [Google Scholar] [CrossRef] [PubMed]
- Cano-Ibáñez, N.; Bueno-Cavanillas, A.; Martínez-González, M.A.; Corella, D.; Salas-Salvadó, J.; Zomeño, M.D.; García-de-la-Hera, M.; Romaguera, D.; Martínez, J.A.; Barón-López, F.J.; et al. Dietary Intake in Population with Metabolic Syndrome: Is the Prevalence of Inadequate Intake Influenced by Geographical Area? Cross-Sectional Analysis from PREDIMED-Plus Study. Nutrients 2018, 10, 1661. [Google Scholar] [CrossRef]
- Cabello-Saavedra, E.; Bes-Rastrollo, M.; Martínez, J.A.; Díez-Espino, J.; Buil-Cosiales, P.; Serrano-Martínez, M.; Martinez-Gonzalez, M.A. Macronutrient Intake and Metabolic Syndrome in Subjects at High Cardiovascular Risk. Ann. Nutr. Metab. 2010, 56, 152–159. [Google Scholar] [CrossRef]
- WHO. Sugars Intake for Adults and Children-Guideline. 2015. Available online: http://www.who.int/nutrition/publications/guidelines/sugars_intake/en/ (accessed on 31 May 2019).
- Tedstone, A.; Targett, V.; Allen, R. Public Health England-Sugar Reduction. The Evidence for Action. Available online: https://www.gov.uk/government/publications/sugar-reduction-from-evidence-into-action (accessed on 31 May 2019).
- Barrio-Lopez, M.T.; Martinez-Gonzalez, M.A.; Fernández-Montero, A.; Beunza, J.J.; Zazpe, I.; Bes-Rastrollo, M. Prospective study of changes in sugar-sweetened beverage consumption and the incidence of the metabolic syndrome and its components: The SUN cohort. Br. J. Nutr. 2013, 110, 1722–1731. [Google Scholar] [CrossRef]
- Chan, T.F.; Lin, W.T.; Huang, H.L.; Lee, C.Y.; Wu, P.W.; Chiu, Y.W.; Huang, C.C.; Tsai, S.; Lin, C.L.; Lee, C.H. Consumption of sugar-sweetened beverages is associated with components of the metabolic syndrome in adolescents. Nutrients 2014, 6, 2088–2103. [Google Scholar] [CrossRef] [PubMed]
- Abdelmagid, S.A.; Clarke, S.E.; Roke, K.; Nielsen, D.E.; Badawi, A.; El-Sohemy, A.; Mutch, D.M.; Ma, D.W. Ethnicity, sex, FADS genetic variation, and hormonal contraceptive use influencedelta-5- and delta-6-desaturaseindices and plasma docosahexaenoic acid concentration in young Canadian adults: A cross-sectional study. Nutr. Metab. (Lond). 2015, 12, 14. [Google Scholar] [CrossRef] [PubMed]
- Burt, A.B.; Pai, S. Sugar consumption and caries risk: A systematic review. J. Dent. Educ. 2001, 65, 1017–1023. [Google Scholar] [PubMed]
- Bibiloni, M.D.M.; Julibert, A.; Bouzas, C.; Martínez-González, M.A.; Corella, D.; Salas-Salvadó, J.; Zomeño, M.D.; Vioque, J.; Romaguera, D.; Martínez, J.A.; et al. Nut Consumptions as a Marker of Higher Diet Quality in a Mediterranean Population at High Cardiovascular Risk. Nutrients 2019, 11, 754. [Google Scholar] [CrossRef] [PubMed]
- Sioen, I.; van Lieshout, L.; Eilander, A.; Fleith, M.; Lohner, S.; Szommer, A.; Petisca, C.; Eussen, S.; Forsyth, S.; Calder, P.C.; et al. Systematic Review on N-3 and N-6 Polyunsaturated Fatty Acid Intake in European Countries in Light of the Current Recommendations - Focus on Specific Population Groups. Ann. Nutr. Metab. 2017, 70, 39–50. [Google Scholar] [CrossRef] [PubMed]
- Harika, R.K.; Eilander, A.; Alssema, M.; Osendarp, S.J.; Zock, P.L. Intake of Fatty Acids in General Populations Worldwide Does Not Meet Dietary Recommendations to Prevent Coronary Heart Disease: A Systematic Review of Data from 40 Countries. Ann. Nutr. Metab. 2013, 63, 229–238. [Google Scholar] [CrossRef] [PubMed]
- Micha, R.; Khatibzadeh, S.; Shi, P.; Fahimi, S.; Lim, S.; Andrews, K.G.; Engell, R.E.; Powles, J.; Ezzati, M.; Mozaffarian, D.; et al. Global, regional, and national consumption levels of dietary fats and oils in 1990 and 2010: A systematic analysis including 266 country-specific nutrition surveys. BMJ. 2014, 348, g2272. [Google Scholar] [CrossRef] [PubMed]
- Eilander, A.; Harika, R.K.; Zock, P.L. Intake and sources of dietary fatty acids in Europe: Are current population intakes of fats aligned with dietary recommendations? Eur. J. Lipid Sci. Technol. 2015, 117, 1370–1377. [Google Scholar] [CrossRef]
- Park, S.; Ahn, J.; Kim, N.S.; Lee, B.K. High carbohydrate diets are positively associated with the risk of metabolic syndrome irrespective to fatty acid composition in women: The NHANES 2007–2014. Int. J. Food Sci. Nutr. 2017, 68, 479–487. [Google Scholar] [CrossRef] [PubMed]
- Shab-Bidar, S.; Hosseini-Esfahani, F.; Mirmiran, P.; Hosseinpour-Niazi, S.; Azizi, F. Metabolic syndrome profiles, obesity measures and intake of dietary fatty acids in adults: Tehran Lipid and Glucose Study. J. Hum. Nutr. Diet 2014, 27, 98–108. [Google Scholar] [CrossRef]
- Baik, I.; Abbott, R.D.; Curb, J.D.; Shin, C. Intake of Fish and n-3 Fatty Acids and Future Risk of Metabolic Syndrome. J. Am. Diet. Assoc. 2010, 110, 1018–1026. [Google Scholar] [CrossRef]
- Babio, N.; Toledo, E.; Estruch, R.; Ros, E.; Martínez-González, M.A.; Castañer, O.; Bulló, M.; Corella, D.; Arós, F.; Gómez-Gracia, E.; et al. Mediterranean diets and metabolic syndrome status in the PREDIMED randomized trial. CMAJ 2014, 186, E649–E657. [Google Scholar] [CrossRef] [PubMed]
- Ahola, A.J.; Harjutsalo, V.; Thorn, L.M.; Freese, R.; Forsblom, C.; Mäkimattila, S.; Groop, P.-H. The association between macronutrient intake and the metabolic syndrome and its components in type 1 diabetes. Br. J. Nutr. 2017, 117, 450–456. [Google Scholar] [CrossRef]
- Ebbesson, S.O.E.; Tejero, M.E.; Nobmann, E.D.; Lopez-Alvarenga, J.C.; Ebbesson, L.; Romenesko, T.; Carter, E.A.; Resnick, H.E.; Devereux, R.B.; Maccluer, J.W.; et al. Fatty acid consumption and metabolic syndrome components: The GOCADAN study. J. Cardio. Metab. Syndr. 2007, 2, 244–249. [Google Scholar] [CrossRef]
- Lana, L.Y.; Petrone, A.B.; Pankow, J.S.; Arnett, D.K.; North, K.E.; Ellison, R.C.; Hunt, S.C.; Djoussé, L. Association of dietary omega-3 fatty acids with prevalence of metabolic syndrome: The National Heart, Lung, and Blood Institute Family Heart Study. Clin. Nutr. 2013, 32, 966–969. [Google Scholar]
- PREDIMED Study Investigators; Guasch-Ferré, M.; Babio, N.; Martínez-González, A.M.; Corella, D.; Ros, E.; Martín-Peláez, S.; Estruch, R.; Arós, F.; Gómez-Gracia, E.; et al. Dietary fat intake and risk of cardiovascular disease and all-cause mortality in a population at high risk of cardiovascular disease. Am. J. Clin. Nutr. 2015, 102, 1563–1573. [Google Scholar]
- Hekmatdoost, A.; Mirmiran, P.; Hosseini-Esfahani, F.; Azizi, F. Dietary fatty acid composition and metabolic syndrome in Tehranian adults. Nutrition 2011, 27, 1002–1007. [Google Scholar] [CrossRef] [PubMed]
- Hosseinpour-Niazi, S.; Mirmiran, P.; Fallah-Ghohroudi, A.; Azizi, F. Combined effect of unsaturated fatty acids and saturated fatty acids on the metabolic syndrome: Tehran lipid and glucose study. J. Health Popul. Nutr. 2015, 33. [Google Scholar] [CrossRef]
- Noel, S.E.; Newby, P.K.; Ordovas, J.M.; Tucker, K.L. Adherence to an (n-3) fatty acid/fish intake pattern is inversely associated with metabolic syndrome among Puerto Rican adults in the Greater Boston area. J. Nutr. 2010, 14, 1846–1854. [Google Scholar] [CrossRef]
- Yubero-Serrano, E.M.; Delgado-Lista, J.; Tierney, A.C.; Perez-Martinez, P.; Garcia-Rios, A.; Alcala-Diaz, J.F.; Castaño, J.P.; Tinahones, F.J.; Drevon, C.A.; Defoort, C.; et al. Insulin resistance determines a differential response to changes in dietary fat modification on metabolic syndrome risk factors: The LIPGENE study. Am. J. Clin. Nutr. 2015, 102, 1509–1517. [Google Scholar] [CrossRef]
- Siri-Tarino, P.W.; Sun, Q.; Hu, F.B.; Krauss, R.M. Meta-analysis of prospective cohort studies evaluating the association of saturated fat with cardiovascular disease12345. Am. J. Clin. Nutr. 2010, 91, 535–546. [Google Scholar] [CrossRef] [PubMed]
- Eckel, R.H.; Jakicic, J.M.; Ard, J.D.; de Jesus, J.M.; Houston, M.N.; Hubbard, V.S.; Lee, I.M.; Lichtenstein, A.H.; Loria, C.M.; Millen, B.E.; et al. American College of Cardiology/American Heart Association Task Force on Practice Guidelines.2013 AHA/ACC guideline on lifestyle management to reduce cardiovascular risk: A report of the American College of Cardiology/American Heart Association Task Force on Practice Guidelines. J. Am. Coll. Cardiol. 2014, 63, 2960–2984. [Google Scholar]
- Beulen, Y.; Martínez-González, M.A.; van de Rest, O.; Salas-Salvadó, J.; Sorlí, J.V.; Gómez-Gracia, E.; Fiol, M.; Estruch, R.; Santos-Lozano, J.M.; Schröder, H.; et al. Quality of Dietary Fat Intake and Body Weight and Obesity in a Mediterranean Population: Secondary Analyses within the PREDIMED Trial. Nutrients 2018, 10, 2011. [Google Scholar] [CrossRef] [PubMed]
- Zhang, Z.; Gillespie, C.; Yang, Q. Plasma trans-fatty acid concentrations continue to be associated with metabolic syndrome among US adults after reductions in trans-fatty acid intake. Nutr. Res. 2017, 43, 51–59. [Google Scholar] [CrossRef]
- Garshick, M.; Mochari-Greenberger, H.; Mosca, L. Reduction in dietary trans fat intake is associated with decreased LDL particle number in a primary prevention population. Nutr. Metab. Cardiovasc. Dis. 2014, 24, 100–106. [Google Scholar] [CrossRef] [PubMed]
- Institute of Medicine (U.S.). Panel on Macronutrients. Dietary Reference Intakes for Energy, Carbohydrate, Fiber, Fat, Fatty Acids, Cholesterol, Protein, and Amino Acids; National Academies Press: Washington, DC, USA, 2005. [Google Scholar]
- Chen, J.P.; Chen, G.C.; Wang, X.P.; Qin, L.; Bai, Y. Dietary Fiber and Metabolic Syndrome: A Meta-Analysis and Review of Related Mechanisms. Nutrients 2017, 10, 24. [Google Scholar] [CrossRef]
- Steemburgo, T.; Dall’Alba, V.; Almeida, J.C.; Zelmanovitz, T.; Gross, J.L.; de Azevedo, M.J. Intake of soluble fibers has a protective role for the presence of metabolic syndrome in patients with type 2 diabetes. Eur. J. Clin. Nutr. 2009, 63, 127–133. [Google Scholar] [CrossRef] [PubMed]
- Esmaillzadeh, A.; Kimiagar, M.; Mehrabi, Y.; Azadbakht, L.; Hu, F.B.; Willett, W.C. Fruit and vegetable intakes, C-reactive protein, and the metabolic syndrome. Am. J. Clin. Nutr. 2006, 84, 1489–1497. [Google Scholar] [CrossRef]
- Shin, A.; Lim, S.Y.; Sung, J.; Shin, H.R.; Kim, J. Dietary Intake, Eating Habits, and Metabolic Syndrome in Korean Men. J. Am. Diet. Assoc. 2009, 109, 633–640. [Google Scholar] [CrossRef]
- Zhu, Y.; Bo, Y.; Liu, Y. Dietary total fat, fatty acids intake, and risk of cardiovascular disease: A dose-response meta-analysis of cohort studies. Lipids Health Dis. 2019, 18, 91. [Google Scholar] [CrossRef]
- Koolhaas, C.M.; Dhana, K.; Schoufour, J.D.; Ikram, M.A.; Kavousi, M.; Franco, O.H. Impact of physical activity on the association of overweight and obesity with cardiovascular disease: The Rotterdam Study. Eur. J. Prev. Cardiol. 2017, 24, 934–941. [Google Scholar] [CrossRef] [PubMed]
- Esposito, K.; Marfella, R.; Ciotola, M. Effect of a Mediterranean-style diet on endothelial dysfunction and markers of vascular inflammation in the metabolic syndrome. A randomized trial. ACC Curr. J. Rev. 2004, 13, 16–17. [Google Scholar] [CrossRef]
- Warburton, D.E.; Nicol, C.W.; Bredin, S.S. Health benefits of physical activity: The evidence. Can. Med. Assoc. J. 2006, 174, 801–809. [Google Scholar] [CrossRef]
- Aizawa, K.; Shoemaker, J.K.; Overend, T.J.; Petrella, R.J. Effects of lifestyle modification on central artery stiffness in metabolic syndrome subjects with pre-hypertension and/or pre-diabetes. Diabetes Res. Clin. Pr. 2009, 83, 249–256. [Google Scholar] [CrossRef]
- Fernández, J.M.; Rosado-Álvarez, D.; Da Silva Grigoletto, M.E.; Rangel-Zúñiga, O.A.; Landaeta-Díaz, L.L.; Caballero-Villarraso, J.; López-Miranda, J.; Pérez-Jiménez, F.; Fuentes-Jiménez, F. Moderate-to-high-intensity training and a hypocaloric Mediterranean diet enhance endothelial progenitor cells and fitness in subjects with the metabolic syndrome. Clin. Sci. (Lond). 2012, 123, 361–373. [Google Scholar] [CrossRef]
- Gremeaux, V.; Drigny, J.; Nigam, A.; Juneau, M.; Guilbeault, V.; Latour, E.; Gayda, M. Long-term Lifestyle Intervention with Optimized High-Intensity Interval Training Improves Body Composition, Cardiometabolic Risk, and Exercise Parameters in Patients with Abdominal Obesity. Am. J. Phys. Med. Rehabil. 2012, 91, 941–950. [Google Scholar] [CrossRef] [PubMed]
- Gomez-Huelgas, R.; Jansen-Chaparro, S.; Baca-Osorio, A.; Mancera-Romero, J.; Tinahones, F.; Bernal-Lopez, M. Effects of a long-term lifestyle intervention program with Mediterranean diet and exercise for the management of patients with metabolic syndrome in a primary care setting. Eur. J. Intern. Med. 2015, 26, 317–323. [Google Scholar] [CrossRef]
- Lee, G.; Choi, H.Y.; Yang, S.J. Effects of Dietary and Physical Activity Interventions on Metabolic Syndrome: A Meta-analysis. J. Korean Acad. Nurs. 2015, 45, 483. [Google Scholar] [CrossRef] [PubMed]
- FESNAD. Dietary Reference Intakes (DRI) for the Spanish Population—2010. Act. Diet. 2010, 14, 196–197. [Google Scholar]

| Men | Women | |||||||||
|---|---|---|---|---|---|---|---|---|---|---|
| Without MetS (n = 63) | With MetS (n = 183) | p-Value * | Without MetS (n = 81) | With MetS (n = 150) | p-Value * | |||||
| Mean ± SD | Median (IQR) | Mean ± SD | Median (IQR) | Mean ± SD | Median (IQR) | Mean ± SD | Median (IQR) | |||
| Age (y) | 63.8 ± 5.9 | 64.0 (59.0, 67.0) | 64.1 ± 5.9 | 64.0 (59.0, 69.0) | 0.544 | 66.8 ± 5.0 | 66.0 (63.0, 70.0) | 65.9 ± 4.5 | 66.0(62.0, 69.0) | 0.340 |
| BMI (kg/m2) | 27.0 ± 3.2 | 27.5 (24.9, 28.7) | 32.0 ± 3.6 | 31.9 (29.0, 34.5) | <0.001 | 25.3 ± 3.3 | 25.6 (22.9, 27.4) | 32.8 ± 4.2 | 32.7 (30.1, 36.1) | <0.001 |
| Current smoking habit (%) | ||||||||||
| Yes | 6.3 | 14.8 | 0.081 | 6.2 | 12.8 | 0.119 | ||||
| No | 93.7 | 85.2 | 93.8 | 87.2 | ||||||
| Education (%) | ||||||||||
| Primary | 39.7 | 37.1 | 0.660 | 53.1 | 60.0 | 0.595 | ||||
| Secondary | 39.7 | 36.5 | 30.9 | 26.9 | ||||||
| University or graduate | 20.6 | 26.4 | 16.0 | 13.1 | ||||||
| Total physica lactivity(n) † | 63 | 158 | 81 | 131 | ||||||
| Total physical activity (MET·hour/week) † | 123 ± 208 | 84 (60, 117) | 61 ± 50 | 46 (24, 85) | <0.001 | 88 ± 34 | 84 (63, 107) | 60 ± 46 | 46 (26, 89) | <0.001 |
| MetScomponents | ||||||||||
| High blood pressure | ||||||||||
| Systolic blood pressure (mmHg) | 137.0 ± 19.0 | 134.5 (124, 143) | 141.0 ± 16.9 | 141 (129.7, 148.5) | 0.038 | 135.9 ± 15.8 | 136 (125.8, 146.3) | 138.4 ± 17.3 | 137.6 (126.7, 148.6) | 0.280 |
| Diastolic blood pressure (mmHg) | 81.5 ± 9.4 | 81.5 (74.5, 88.5) | 82.8 ± 9.5 | 83 (75.7, 89.5) | 0.362 | 79.9 ± 9.0 | 80.5 (74.3, 86.3) | 79.6 ± 9.8 | 79.7 (74.6, 85.3) | 0.828 |
| (%) ‡ | 76.2 | 95.6 | <0.001 § | 69.1 | 88.0 | <0.001 § | ||||
| Hyperglycaemia (mg/dL) | 98.3 ± 32.2 | 97 (71, 119) | 119.9 ± 39.0 | 110 (100, 127) | <0.001 | 89.0 ± 8.0 | 89 (83, 94) | 110.5 ± 23.4 | 104 (95, 120) | <0.001 |
| (%) ‡ | 27.0 | 81.4 | <0.001 § | 3.7 | 48.0 | <0.001 § | ||||
| Hypertriglyceridemia (mg/dL) | 96.2 ± 9.2 | 95 (93, 100) | 155.6 ± 77.1 | 133 (96, 198) | <0.001 | 84.5 ± 27.2 | 80 (64, 100) | 135.3 ± 55.5 | 125 (91, 169.8) | <0.001 |
| (%) ‡ | 9.5 | 53.6 | <0.001 § | 11.0 | 51.6 | <0.001 § | ||||
| Low HDL-cholesterol (mg/dL) | 51.5 ± 9.9 | 50 (45, 55) | 41.2 ± 10.0 | 40 (35, 46) | <0.001 | 63.3 ± 11.9 | 63 (55.5, 71) | 49.1 ± 10.7 | 48 (42, 54.5) | <0.001 |
| (%) ‡ | 11.1 | 53.0 | <0.001 § | 22.2 | 58.0 | <0.001 § | ||||
| Abdominal obesity (cm) | 92.9 ± 10.1 | 94 (87.7, 99.2) | 112.1 ± 10.3 | 111.1 (103.9, 120.5) | <0.001 | 79.9 ± 7.7 | 80 (75.4, 85.4) | 104.6 ± 11.1 | 105.5 (97.0, 112.3) | <0.001 |
| (%) ‡ | 12.7 | 86.3 | <0.001 § | 11.1 | 960 | <0.001 § | ||||
| Men | Women | |||||||||
|---|---|---|---|---|---|---|---|---|---|---|
| Without MetS (n = 63) | With MetS (n = 183) | p-Value * | Without MetS (n = 81) | With MetS (n = 150) | p-Value * | |||||
| Mean ±SD | Median (IQR) | Mean ±SD | Median (IQR) | Mean ±SD | Median (IQR) | Mean ±SD | Median (IQR) | |||
| Energy intake (kcal/day) | 2872 ± 738 | 2858 (2315, 3282) | 2641 ± 689 | 2561 (2153, 3071) | 0.019 | 2366 ± 698 | 2323 (1881, 2697) | 2071 ± 543 | 1952 (1713, 2448) | <0.001 |
| Carbohydrate intake (% total E) | 44.7 ± 6.2 | 44.7 (41.3, 48.3) | 40.0 ± 6.8 | 40.7 (34.9, 45.2) | <0.001 | 44.6 ± 5.2 | 44.3 (40.7, 47.1) | 41.0 ± 6.9 | 40.9 (36.4, 45.5) | <0.001 |
| Protein intake (% total E) | 15.9 ± 2.4 | 15.6 (14.3, 17.6) | 16.3 ± 3.1 | 15.9 (14.3, 17.7) | 0.599 | 16.9 ± 3.0 | 16.4 (14.9, 18.5) | 18.0± 3.2 | 18.0 (15.7, 20.4) | 0.010 |
| Fat intake (% total E) | 36.2 ± 6.1 | 35.6 (31.6, 40.2) | 38.9 ± 7.0 | 38.6 (34.0, 44.0) | 0.008 | 37.6 ± 5.7 | 37.8 (32.8, 41.3) | 40.9 ± 7.6 | 40.7 (35.5, 46.1) | <0.001 |
| PUFA (% total E) | 7.6 ± 3.4 | 6.3 (5.3, 9.1) | 7.5 ± 3.0 | 6.7 (5.5, 8.8) | 0.673 | 8.0 ± 3.6 | 6.6 (5.8, 8.9) | 8.1 ± 4.1 | 6.7 (5.6, 9.2) | 0.941 |
| MUFA (% total E) | 17.5 ± 4.3 | 16.8 (14.5, 19.7) | 19.3 ± 5.0 | 18.8 (15.9, 22.2) | 0.007 | 18.9 ± 4.4 | 18.3 (15.5, 21.1) | 21.1 ± 5.9 | 20.3 (17.1, 24.6) | 0.003 |
| SFA (% total E) | 11.7 ± 3.5 | 10.9 (9.6, 12.9) | 12.0 ± 3.3 | 11.4 (9.6, 13.3) | 0.517 | 12.5 ± 3.6 | 11.6 (9.9, 14.4) | 12.5 ± 4.0 | 11.6 (10.1, 13.8) | 0.975 |
| Trans FA (g/d) | 8.1 ± 8.9 | 4.7 (2.9, 7.2) | 6.8 ± 7.5 | 3.8 (2.3, 6.5) | 0.123 | 7.8 ± 8.5 | 4.9 (2.8, 10.3) | 6.4 ± 8.5 | 3.0 (1.5, 5.4) | 0.005 |
| Linoleic acid (g/d) | 16.2 ± 10.5 | 12.5 (8.8, 21.2) | 14.5 ± 8.9 | 11.2 (8.5, 18.8) | 0.298 | 14.7 ± 9.8 | 11.7 (8.7, 16.8) | 12.9 ± 9.6 | 10.0 (6.5, 16.3) | 0.034 |
| ω-3 FA (g/d) | 26.0 ± 36.0 | 9.2 (8.9, 18.9) | 21.2 ± 29.8 | 9.2 (1.2, 18.2) | 0.135 | 26.5 ± 34.5 | 9.4 (8.7, 35.2) | 21.8 ± 34.0 | 8.9 (1.0, 17.9) | 0.003 |
| Linolenic acid (g/d) | 7.0 ± 9.0 | 2.8 (2.5, 5.5) | 5.8 ± 7.5 | 2.8 (0.8, 5.1) | 0.168 | 7.1 ± 8.6 | 3.1 (2.4, 9.2) | 5.8 ± 8.5 | 2.6 (0.6, 4.9) | 0.003 |
| Marine ω-3 FA (g/d) | 12.7 ± 18.0 | 4.4 (4.2, 9.1) | 10.3 ± 14.9 | 4.3 (0.3, 8.9) | 0.111 | 13.0 ± 17.3 | 4.5 (4.1, 17.4) | 10.7 ± 17.0 | 4.2 (0.3, 8.8) | 0.009 |
| Non-marine ω-3 FA (g/d) | 13.2 ± 18.0 | 4.9 (4.5, 10) | 10.9 ± 14.9 | 4.9 (0.9, 9.4) | 0.161 | 13.5 ± 17.3 | 5.1 (4.5, 17.9) | 11.1 ± 17.0 | 4.6 (0.7, 9.2) | 0.002 |
| Animal fat (g/d) | 49.8 ± 18.2 | 46.1 (38.5, 59.7) | 48.3 ± 19.6 | 43.7 (34.8, 59.2) | 0.307 | 41.5 ± 23.1 | 38.6 (27.3, 50.0) | 36.0 ± 13.2 | 35.0 (26.2, 44.1) | 0.091 |
| Vegetable fat (g/d) | 65.7 ± 23.4 | 62.3 (45.2, 85.4) | 64.9 ± 22.8 | 62.8 (48.1, 79.9) | 0.799 | 57.7 ± 19.9 | 56.1 (41.8, 69.2) | 58.3 ± 23.9 | 56.6 (41.9, 70.4) | 0.987 |
| FQI, score | 1.9 ± 0.5 | 1.7 (1.6, 2.1) | 2.0 ± 0.4 | 1.9 (1.7, 2.3) | 0.048 | 1.8 ± 0.4 | 1.8 (1.6, 2.0) | 2.1 ± 0.5 | 2.0 (1.7, 2.4) | <0.001 |
| Cholesterol (mg/d) | 362 ± 105 | 358 (289, 423) | 348 ± 115 | 334 (274, 399) | 0.146 | 303 ± 122 | 286 (243, 349) | 288 ± 79 | 283 (250, 355) | 0.819 |
| Fiber intake (g/d) | 42.2 ± 17.0 | 38.2 (28.2, 52.0) | 32.9 ± 13.1 | 31.2 (22.6, 39.5) | <0.001 | 38.6 ± 16.7 | 34.0 (28.9, 45.3) | 31.2 ± 14.9 | 27.3 (20.9, 36.2) | <0.001 |
| Men | Women | |||||||||
|---|---|---|---|---|---|---|---|---|---|---|
| Without MetS (n = 63) | With MetS (n = 183) | p-Value | Without MetS (n = 81) | With MetS (n = 150) | p-Value * | |||||
| Mean ±SD | Median (IQR) | Mean ±SD | Median (IQR) | Mean ±SD | Median (IQR) | Mean ±SD | Median (IQR) | |||
| Fruits (g/day) | 487 ± 205 | 495 (344, 627) | 402 ± 229 | 364 (220, 546) | 0.002 | 576 ± 218 | 553 (419, 697) | 394 ± 214 | 352 (242, 499) | <0.001 |
| Vegetables (g/day) | 346 ± 147 | 341 (232, 426) | 311 ± 157 | 284 (192, 415) | 0.075 | 357 ± 151 | 334 (258, 431) | 343 ± 159 | 327 (242, 420) | 0.407 |
| Potatoes (g/day) | 96.7 ± 45.8 | 95.7 (57.1, 149.8) | 70.2 ± 45.2 | 56.0 (31.4, 97.4) | <0.001 | 77.6 ± 45.0 | 85.7 (38.6, 107.1) | 67.3 ± 57.9 | 49.5 (28.0, 94.1) | 0.013 |
| Legumes (g/day) | 20.5 ± 14.7 | 16.6 (12.0, 25.1) | 18.9 ± 12.9 | 16.1 (12.1, 24.8) | 0.901 | 18.0 ± 12.2 | 16.0 (12.0, 21.1) | 17.8 ± 12.3 | 16.1 (12.0, 21.6) | 0.582 |
| Olives and EVOO (g/day) | 34.7 ± 34.0 | 28.3 (10.0, 46.4) | 39.3 ± 28.2 | 32.0 (21.0, 50.0) | 0.070 | 24.7 ± 16.5 | 25.0 (12.4, 32.1) | 29.8 ± 24.0 | 28.3 (10.9, 46.0) | 0.289 |
| Other olives oils | 14.3 ± 16.7 | 10.0 (0.0, 25.0) | 13.0 ± 16.4 | 4.2 (0.0, 25.0) | 0.563 | 15.9 ± 15.4 | 10.0 (0.0, 25.0) | 15.1 ± 14.8 | 10.0 (0.0, 25.0) | 0.724 |
| Other oils and fats | 4.4 ±9.2 | 1.3 (0.0, 4.3) | 4.9± 8.9 | 0.8 (0.0, 5.0) | 0.856 | 4.7± 6.8 | 2.1 (0.7, 5.8) | 3.9 ± 6.6 | 0.8 (0.0, 5.0) | 0.112 |
| Nuts (g/day) | 15.8 ± 17.3 | 8.6 (4.0, 25.7) | 13.3 ± 13.3 | 8.4 (4.0, 21.0) | 0.594 | 14.7 ± 13.6 | 8.6 (4.3, 25.7) | 11.7 ± 13.5 | 7.2 (2.0, 16.7) | 0.023 |
| Totalfish (g/day) | 96.3 ± 36.2 | 88.1 (68.1, 120.5) | 87.7 ± 45.2 | 80.3 (56.6, 111.3) | 0.049 | 87.4 ± 37.5 | 80.7 (60.3, 107.4) | 88.1 ± 42.2 | 80.7 (56.6, 115.1) | 0.925 |
| White fish | 25.4 ± 19.7 | 21 (10, 21) | 26.3 ± 22.4 | 21.0 (10.1, 21.4) | 0.620 | 28.0 ± 21.6 | 21.4 (10.0, 42.9) | 28.3 ± 22.9 | 21.0 (10.1, 63.0) | 0.362 |
| Bluefish | 21.9 ± 19.9 | 18.6 (8.7, 18.6) | 17.2 ± 16.8 | 8.7 (8.7, 18.2) | 0.121 | 18.1 ± 17.0 | 18.6 (8.7, 18.6) | 20.2 ± 18.7 | 18.2 (8.7, 18.6) | 0.769 |
| Seafood | 35.6 ± 14.6 | 30.7 (26.7, 45.9) | 31.1 ± 23.7 | 30.8 (17.4, 35.2) | 0.096 | 31.6 ± 17.8 | 30.7 (26.7, 33.0) | 28.9 ± 22.3 | 30.7 (13.4, 31.9) | 0.985 |
| Canned fish/seafood | 11.7 ± 10.5 | 7.1 (3.3, 21.4) | 11.0 ± 9.6 | 7.0 (3.4, 21.0) | 0.215 | 8.3 ± 7.4 | 6.7 (3.3, 12.4) | 9.4 ± 8.5 | 7.0 (3.4, 13.0) | 0.115 |
| Total cereal (g/day) | 229.3 ± 131.7 | 222.8 (131.4, 251.6) | 159 ± 89 | 135.9 (91.8, 217.7) | <0.001 | 149 ± 82 | 126 (95, 222) | 122.8± 69.8 | 102.4 (79.7, 164.3) | 0.004 |
| Whole grain bread | 105.2 ± 122.3 | 75.0 (5.0, 187.5) | 61.4 ± 73.8 | 31.5 (5.0, 75.0) | 0.012 | 66.7 ± 60.0 | 75.0 (32.1, 75.0) | 57.1 ± 63.5 | 31.5 (5.0, 75.0) | 0.019 |
| Refined grain bread | 85.3 ± 108.0 | 32.1 (5.0, 187.5) | 66.6 ± 83.1 | 31.5 (5.0, 75.0) | 0.329 | 47.2 ± 71.1 | 10.7 (0.0, 75.0) | 39.3 ± 53.6 | 31.5 (0.0, 75.0) | 0.895 |
| Rice and pasta | 34.5 ± 14.7 | 34.3 (17.1, 51.4) | 27.6 ± 18.2 | 25.2 (12.4, 34.3) | <0.001 | 28.7 ± 17.5 | 17.1 (17.1, 34.3) | 23.1 ± 15.1 | 17.0 (12.4, 33.6) | 0.001 |
| Total dairy products (g/day) | 295 ± 168 | 289 (215, 342) | 303 ± 216 | 269 (181, 363) | 0.612 | 312 ± 214 | 282 (150, 394) | 264 ± 164 | 246 (148, 342) | 0.131 |
| Dairy esserts | 31.9 ± 34.6 | 15.3 (6.7, 51.2) | 33.6 ± 47.2 | 15.3 (6.7, 43.0) | 0.930 | 19.9 ± 27.9 | 8.7 (6.7, 24.1) | 18.4± 27.9 | 6.7 (0.0, 23.4) | 0.814 |
| Cheese | 32.9 ± 26.9 | 24.8 (21.4, 44.5) | 32.1 ± 31.2 | 24.4 (14.0, 42.9) | 0.395 | 33.1 ± 23.2 | 28.1 (19.6, 48.0) | 29.3 ± 22.3 | 24.4 (10.4, 42.0) | 0.179 |
| Skimmed dairy | 84.8 ± 137.6 | 8.3 (0.0, 125.0) | 115 ± 202 | 52.5 (0.0, 156.0) | 0.215 | 141.6 ± 194.8 | 53.6 (0.0, 209.5) | 114.4± 136.5 | 52.5 (0.0, 200.0) | 0.529 |
| Whole-fat dairy | 144.1 ± 141.3 | 125.0 (8.3, 208.3) | 120 ± 141 | 84.0 (0.0, 200.0) | 0.090 | 112.5 ± 158.6 | 17.9 (0.0, 200.0) | 100 ± 140 | 17.5 (0.0, 200.0) | 0.765 |
| Total meat (g/day) | 152.0 ± 61.1 | 137 (112, 202) | 166.2 ± 71.7 | 154 (117, 204) | 0.247 | 130 ± 61.7 | 118 (93, 165) | 140 ± 56.6 | 139 (104, 172) | 0.076 |
| Processed meat | 40.7 ± 27.0 | 34.0 (27.0, 52.0) | 46.9 ± 34.7 | 39.1 (21.0, 62.0) | 0.433 | 31.4 ± 21.4 | 30.0 (18.2, 39.5) | 34.0 ± 28.3 | 28.7 (16.7, 42.7) | 0.869 |
| Other meats, | 108.4 ± 48.8 | 104.3 (71.4, 135.7) | 116 ± 57 | 107 (76, 149) | 0.500 | 97.2 ± 51.6 | 87.6 (64.8, 122.9) | 103.8± 46.3 | 103.7 (74.9, 135.8) | 0.172 |
| Bakery godos (g/day) | 60.4 ± 44.5 | 51.2 (26.7, 72.4) | 52.1 ± 45.0 | 44.5 (20.6, 66.7) | 0.101 | 51.0 ± 30.2 | 46.5 (26.5, 74.2) | 37.2 ± 30.6 | 31.0 (10.4, 53.7) | <0.001 |
| Ready-to-eat-meals | 35.0 ±34.2 | 26.2 (13.6, 37.6) | 27.8 ± 40.3 | 15.4 (9.4, 30.0) | 0.003 | 19.9 ± 18.7 | 15.3 (4.3, 26.2) | 20.5 ± 23.3 | 15.4 (2.0, 26.4) | 0.357 |
| Alcohol (g/day) | 230 ± 183 | 198 (82, 337) | 291 ± 322 | 200 (76, 367) | 0.753 | 109 ± 128 | 47.1 (0.0, 170) | 70 ± 101 | 28.8 (0.0, 100.0) | 0.032 |
| Variable | AMDR | Group | % below | % inside | % above | p * |
|---|---|---|---|---|---|---|
| All | ||||||
| Carbohydrate | 45–65% | Without MetS | 55.6 | 44.4 | 0.0 | <0.001 |
| With MetS | 72.7 | 27.3 | 0.0 | |||
| Protein | 10–35% | Without MetS | 0.0 | 100.0 | 0.0 | 0.510 |
| With MetS | 0.3 | 99.7 | 0.0 | |||
| Total fat | 20–35% | Without MetS | 0.0 | 39.6 | 60.4 | 0.001 |
| With MetS | 0.0 | 24.9 | 75.1 | |||
| MUFAs | >20% | Without MetS | 72.2 | - | 27.8 | 0.001 |
| With MetS | 55.6 | - | 44.4 | |||
| LA | 5–10% | Without MetS | 66.7 | 20.1 | 13.2 | 0.159 |
| With MetS | 64.9 | 26.4 | 8.7 | |||
| ALA | 0.6–1.2% | Without MetS | 21.5 | 29.2 | 49.3 | 0.005 |
| With MetS | 36.3 | 21.0 | 42.6 | |||
| Men | ||||||
| Carbohydrate | 45–65% | Without MetS | 52.4 | 47.6 | 0.0 | 0.003 |
| With MetS | 72.7 | 27.3 | 0.0 | |||
| Protein | 10–35% | Without MetS | 0.0 | 100.0 | 0.0 | 0.557 |
| With MetS | 0.5 | 99.5 | 0.0 | |||
| Total fat | 20–35% | Without MetS | 0.0 | 46.0 | 54.0 | 0.008 |
| With MetS | 0.0 | 27.9 | 72.1 | |||
| MUFAs | >20% | Without MetS | 77.8 | - | 22.2 | 0.025 |
| With MetS | 62.3 | - | 37.7 | |||
| LA | 5–10% | Without MetS | 65.1 | 22.2 | 12.7 | 0.276 |
| With MetS | 66.7 | 26.8 | 6.6 | |||
| ALA | 0.6–1.2% | Without MetS | 22.2 | 38.1 | 39.7 | 0.119 |
| With MetS | 35.0 | 27.3 | 37.7 | |||
| Women | ||||||
| Carbohydrate | 45–65% | Without MetS | 58.0 | 42.0 | 0.0 | 0.023 |
| With MetS | 72.7 | 27.3 | 0.0 | |||
| Protein | 10–35% | Without MetS | 0.0 | 100.0 | 0.0 | 1.000 |
| With MetS | 0.0 | 100.0 | 0.0 | |||
| Total fat | 20–35% | Without MetS | 0.0 | 34.6 | 65.4 | 0.029 |
| With MetS | 0.0 | 21.3 | 78.7 | |||
| MUFAs | >20% | Without MetS | 67.9 | - | 32.1 | 0.003 |
| With MetS | 47.3 | - | 52.7 | |||
| LA | 5–10% | Without MetS | 67.9 | 18.5 | 13.6 | 0.427 |
| With MetS | 62.7 | 26.0 | 11.3 | |||
| ALA | 0.6–1.2% | Without MetS | 21.0 | 22.2 | 56.8 | 0.019 |
| With Met | 38.0 | 13.3 | 48.7 |
| Variable | Nutritional Objectives | Group | % Below | % Inside | % Above | p * |
|---|---|---|---|---|---|---|
| Carbohydrate | 50–55% | Without MetS | 83.3 | 12.5 | 4.2 | 0.004 |
| With MetS | 93.1 | 5.7 | 1.2 | |||
| Protein | 10–20% | Without MetS | 0.0 | 100.0 | 0.0 | 1.000 |
| With MetS | 0.0 | 100.0 | 0.0 | |||
| Total fat | 30–35% | Without MetS | 9.7 | 29.9 | 60.4 | 0.001 |
| With MetS | 9.3 | 15.6 | 75.1 | |||
| MUFAs | 20% | Without MetS | 72.2 | - | 27.8 | 0.001 |
| With MetS | 55.6 | - | 44.4 | |||
| PUFAs | 5% | Without MetS | 14.6 | - | 85.4 | 0.774 |
| With MetS | 15.6 | - | 84.4 | |||
| LA | 3% | Without MetS | 18.1 | - | 81.9 | 0.217 |
| With MetS | 23.1 | - | 76.9 | |||
| ALA | 1–2% | Without MetS | 42.4 | 30.6 | 27.1 | 0.417 |
| With MetS | 48.6 | 28.5 | 22.8 | |||
| SFA | 7–8% | Without MetS | 2.8 | 3.5 | 93.8 | 0.952 |
| With MetS | 3.3 | 3.6 | 93.1 | |||
| Trans FA | <1% | Without MetS | 21.5 | - | 78.5 | 0.001 |
| With MetS | 36.6 | - | 63.4 | |||
| DHA | 300 mg | Without MetS | 100.0 | - | 0.0 | 1.000 |
| With MetS | 100.0 | - | 0.0 | |||
| Total fiber | M: 35 g/d | Without MetS | 27.8 | - | 72.2 | <0.001 |
| F: 25 g/d | With MetS | 52.0 | - | 48.0 | ||
| Cholesterol | <300 mg/d | Without MetS | 41.0 | - | 59.0 | 0.123 |
| With MetS | 48.6 | - | 51.4 | |||
| Fruits | >300 g/d | Without MetS | 11.1 | - | 88.9 | <0.001 |
| With MetS | 35.4 | - | 64.6 | |||
| Vegetables | >250g/d | Without MetS | 24.3 | - | 75.7 | 0.032 |
| With MetS | 34.2 | - | 65.8 | |||
| Sugar foods | <6% | Without MetS | 0.7 | - | 99.3 | 0.905 |
| With MetS | 0.6 | - | 99.4 |
© 2019 by the authors. Licensee MDPI, Basel, Switzerland. This article is an open access article distributed under the terms and conditions of the Creative Commons Attribution (CC BY) license (http://creativecommons.org/licenses/by/4.0/).
Share and Cite
Julibert, A.; Bibiloni, M.d.M.; Mateos, D.; Angullo, E.; Tur, J.A. Dietary Fat Intake and Metabolic Syndrome in Older Adults. Nutrients 2019, 11, 1901. https://doi.org/10.3390/nu11081901
Julibert A, Bibiloni MdM, Mateos D, Angullo E, Tur JA. Dietary Fat Intake and Metabolic Syndrome in Older Adults. Nutrients. 2019; 11(8):1901. https://doi.org/10.3390/nu11081901
Chicago/Turabian StyleJulibert, Alicia, Maria del Mar Bibiloni, David Mateos, Escarlata Angullo, and Josep A. Tur. 2019. "Dietary Fat Intake and Metabolic Syndrome in Older Adults" Nutrients 11, no. 8: 1901. https://doi.org/10.3390/nu11081901
APA StyleJulibert, A., Bibiloni, M. d. M., Mateos, D., Angullo, E., & Tur, J. A. (2019). Dietary Fat Intake and Metabolic Syndrome in Older Adults. Nutrients, 11(8), 1901. https://doi.org/10.3390/nu11081901