

The Optimal Protective 25-Hydroxyvitamin D Level for Different Health Outcomes in Adults: A Brief Summary of Dose–Response Meta-Analyses


Abstract
1. Introduction
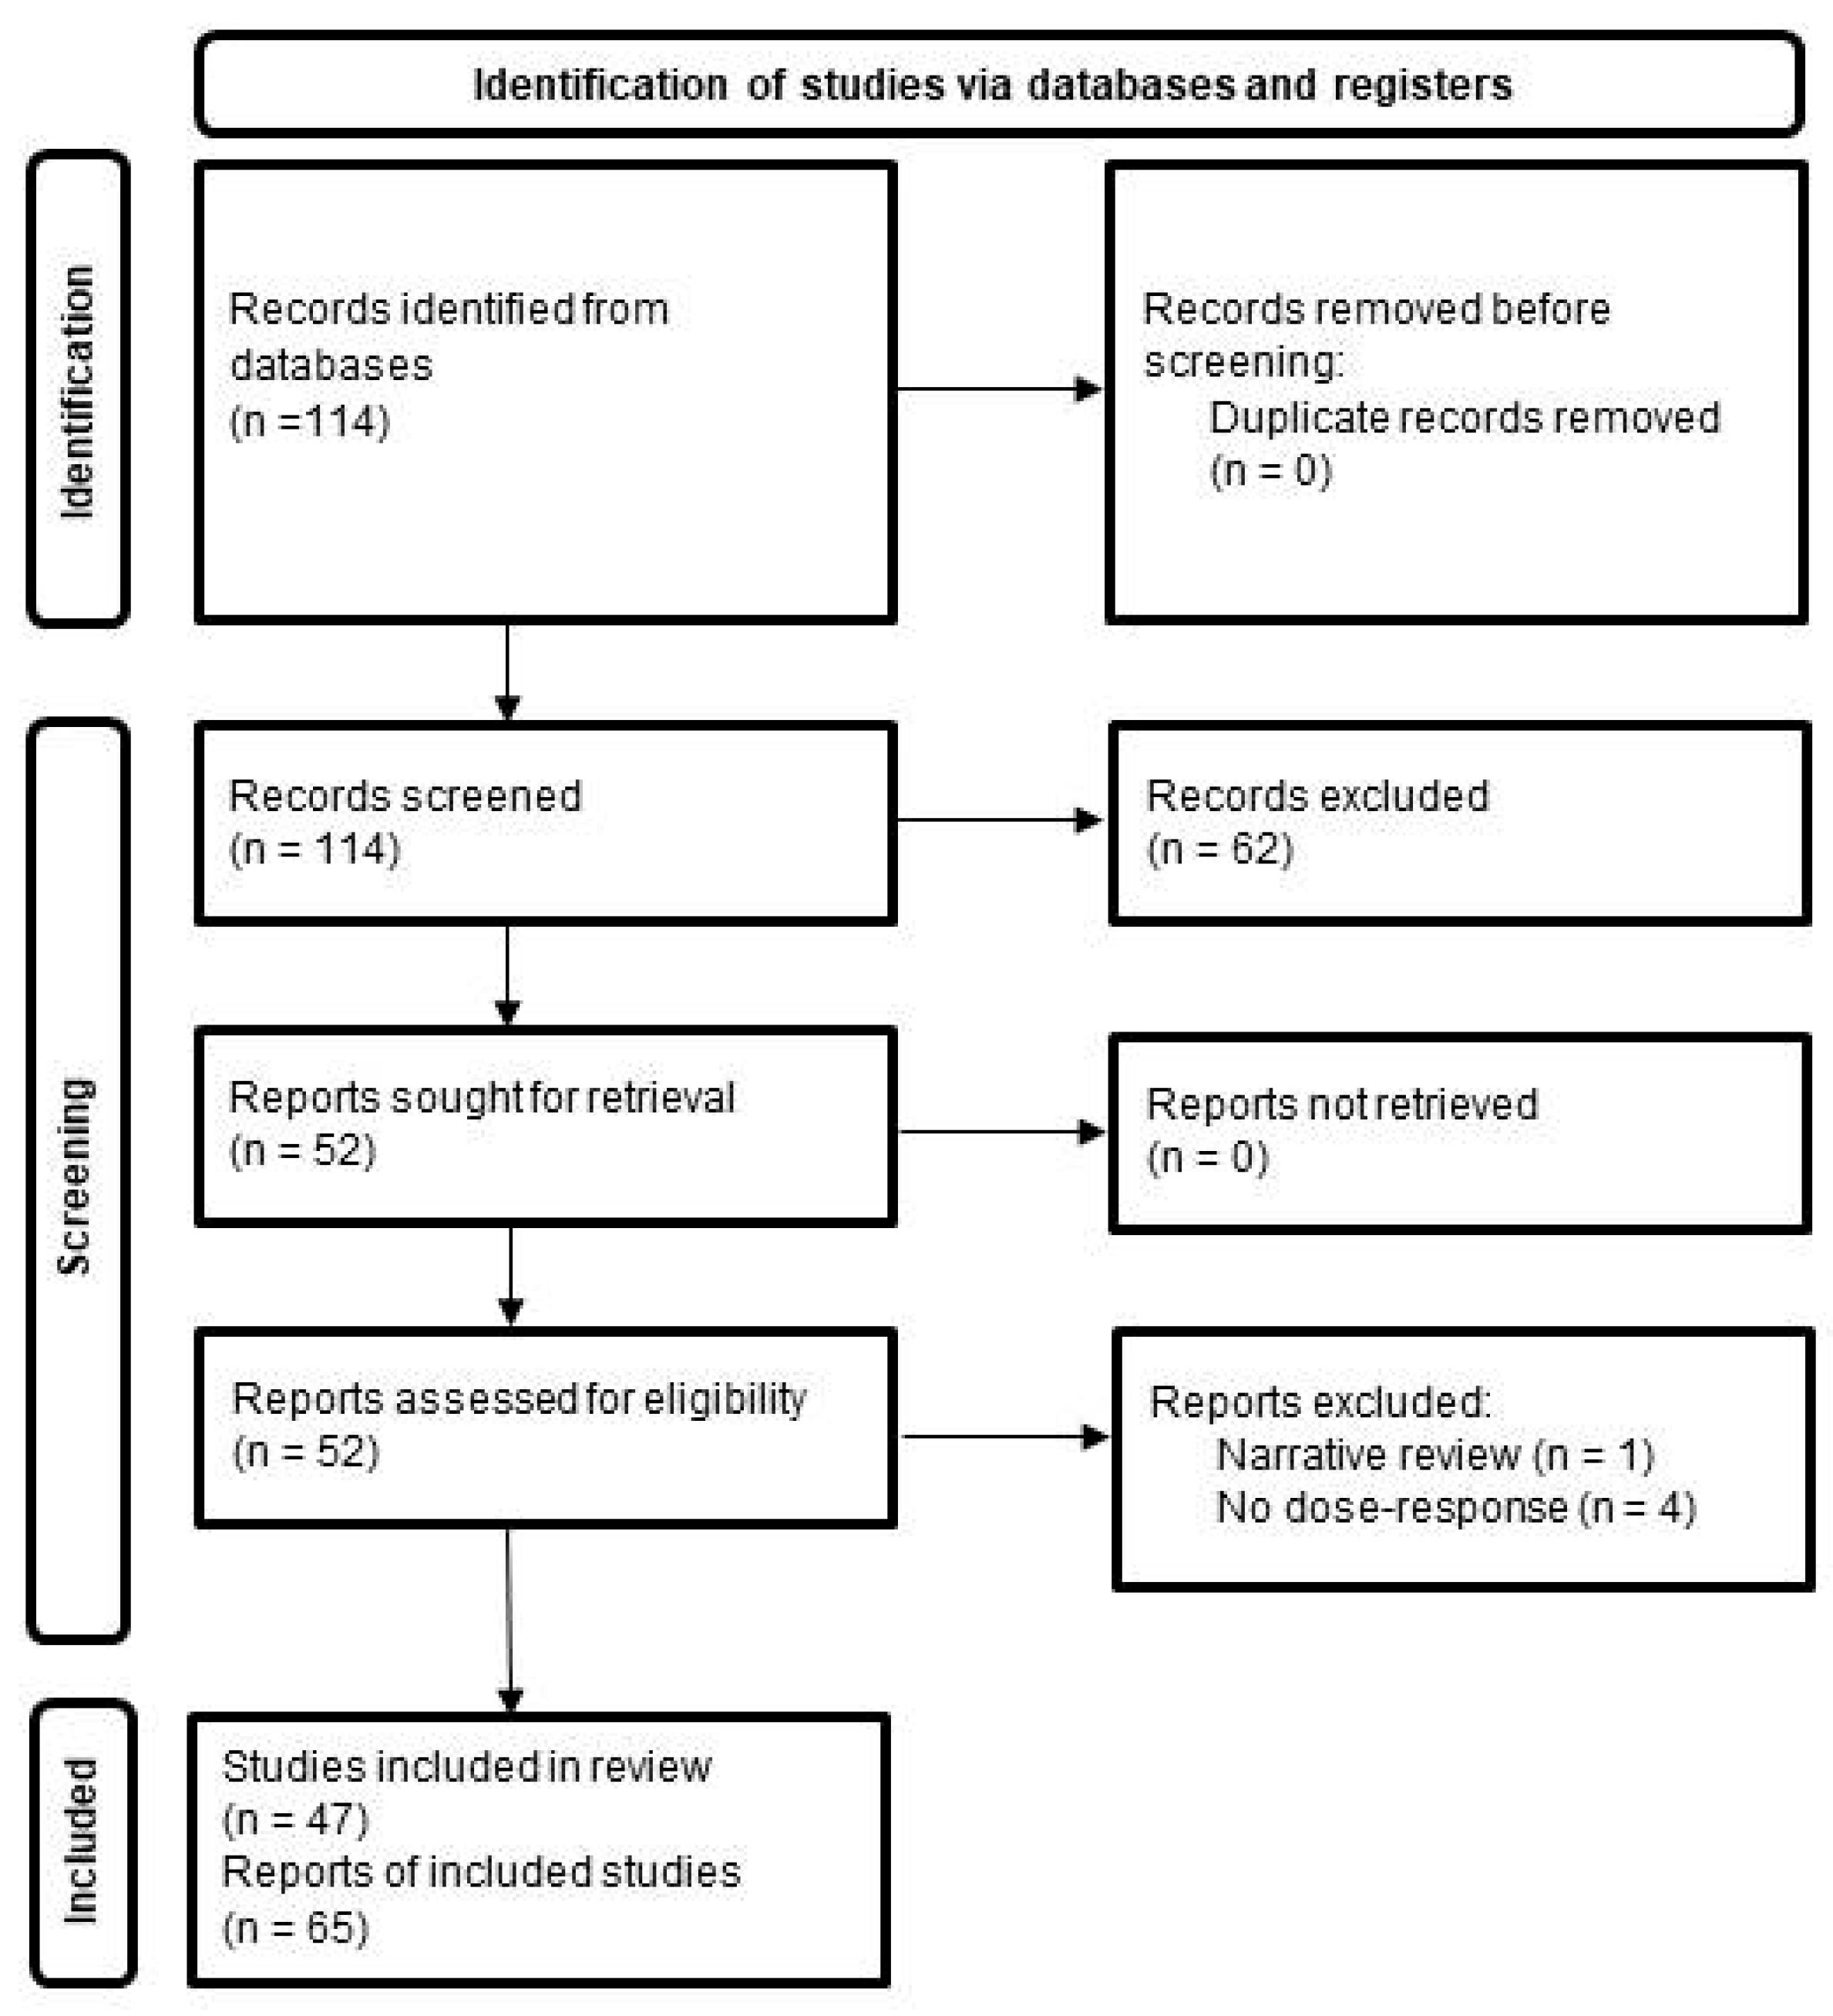
2. Methods
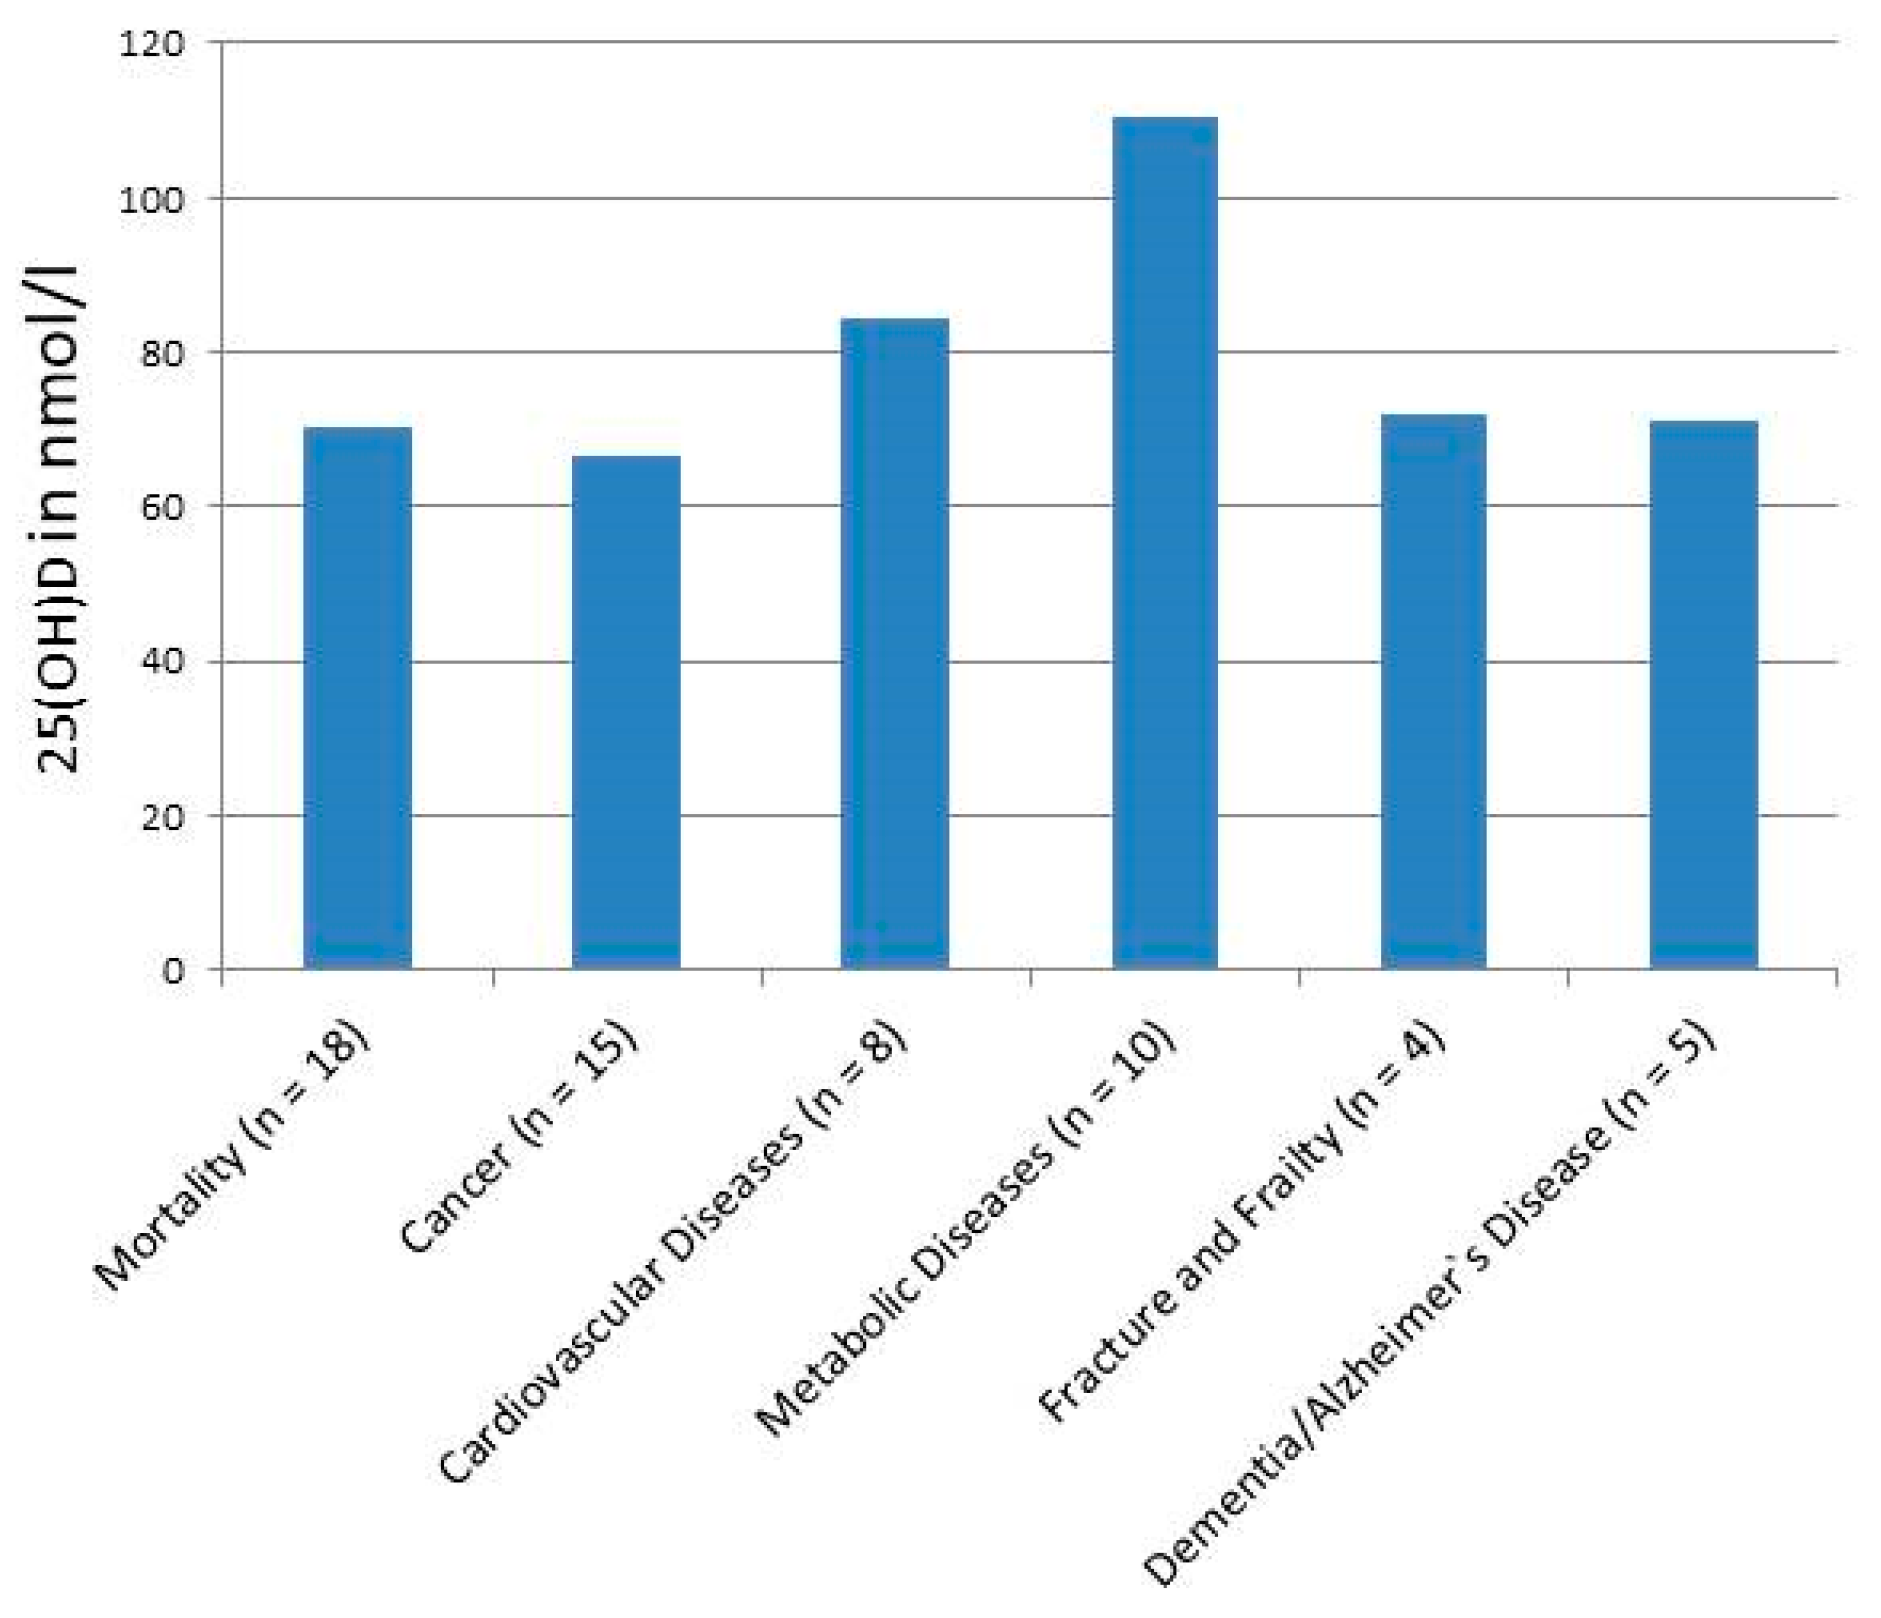
3. Results
4. Discussion
Author Contributions
Funding
Institutional Review Board Statement
Informed Consent Statement
Data Availability Statement
Conflicts of Interest
References
- Holick, M.F. Vitamin D deficiency. N. Engl. J. Med. 2007, 357, 266–281. [Google Scholar] [CrossRef] [PubMed]
- Bischoff-Ferrari, H.A.; Giovannucci, E.; Willett, W.C.; Dietrich, T.; Dawson-Hughes, B. Estimation of optimal serum concentrations of 25-hydroxyvitamin D for multiple health outcomes. Am. J. Clin. Nutr. 2006, 84, 18–28. [Google Scholar] [CrossRef] [PubMed]
- Dawson-Hughes, B. What is the optimal dietary intake of vitamin D for reducing fracture risk? Calcif. Tissue Int. 2013, 92, 184–190. [Google Scholar] [CrossRef] [PubMed]
- Thomas, M.K.; Lloyd-Jones, D.M.; Thadhani, R.I.; Shaw, A.C.; Deraska, D.J.; Kitch, B.T.; Vamvakas, E.C.; Dick, I.M.; Prince, R.L.; Finkelstein, J.S. Hypovitaminosis D in medical inpatients. N. Engl. J. Med. 1998, 338, 777–783. [Google Scholar] [CrossRef]
- Chen, X.; Chu, C.; Doebis, C.; Xiong, Y.; Cao, Y.; Kramer, B.K.; von Baehr, V.; Hocher, B. Vitamin D status and its association with parathyroid hormone in 23,134 outpatients. J. Steroid Biochem. Mol. Biol. 2022, 220, 106101. [Google Scholar] [CrossRef]
- Valcour, A.; Blocki, F.; Hawkins, D.M.; Rao, S.D. Effects of age and serum 25-OH-vitamin D on serum parathyroid hormone levels. J. Clin. Endocrinol. Metab. 2012, 97, 3989–3995. [Google Scholar] [CrossRef]
- Ross, A.C.; Manson, J.E.; Abrams, S.A.; Aloia, J.F.; Brannon, P.M.; Clinton, S.K.; Durazo-Arvizu, R.A.; Gallagher, J.C.; Gallo, R.L.; Jones, G.; et al. The 2011 report on dietary reference intakes for calcium and vitamin D from the Institute of Medicine: What clinicians need to know. J. Clin. Endocrinol. Metab. 2011, 96, 53–58. [Google Scholar] [CrossRef]
- Holick, M.F.; Binkley, N.C.; Bischoff-Ferrari, H.A.; Gordon, C.M.; Hanley, D.A.; Heaney, R.P.; Murad, M.H.; Weaver, C.M. Evaluation, treatment, and prevention of vitamin D deficiency: An Endocrine Society clinical practice guideline. J. Clin. Endocrinol. Metab. 2011, 96, 1911–1930. [Google Scholar] [CrossRef]
- Demay, M.B.; Pittas, A.G.; Bikle, D.D.; Diab, D.L.; Kiely, M.E.; Lazaretti-Castro, M.; Lips, P.; Mitchell, D.M.; Murad, M.H.; Powers, S.; et al. Vitamin D for the Prevention of Disease: An Endocrine Society Clinical Practice Guideline. J. Clin. Endocrinol. Metab. 2024, 109, 1907–1947. [Google Scholar] [CrossRef]
- Grant, W.B.; Al Anouti, F.; Boucher, B.J.; Dursun, E.; Gezen-Ak, D.; Jude, E.B.; Karonova, T.; Pludowski, P. A Narrative Review of the Evidence for Variations in Serum 25-Hydroxyvitamin D Concentration Thresholds for Optimal Health. Nutrients 2022, 14, 639. [Google Scholar] [CrossRef]
- Bischoff-Ferrari, H.A. Optimal serum 25-hydroxyvitamin D levels for multiple health outcomes. Adv. Exp. Med. Biol. 2014, 810, 500–525. [Google Scholar] [PubMed]
- Grant, W.B. Relation between prediagnostic serum 25-hydroxyvitamin D level and incidence of breast, colorectal, and other cancers. J. Photochem. Photobiol. B Biol. 2010, 101, 130–136. [Google Scholar] [CrossRef] [PubMed]
- Souberbielle, J.C.; Body, J.J.; Lappe, J.M.; Plebani, M.; Shoenfeld, Y.; Wang, T.J.; Bischoff-Ferrari, H.A.; Cavalier, E.; Ebeling, P.R.; Fardellone, P.; et al. Vitamin D and musculoskeletal health, cardiovascular disease, autoimmunity and cancer: Recommendations for clinical practice. Autoimmun. Rev. 2010, 9, 709–715. [Google Scholar] [CrossRef] [PubMed]
- Pludowski, P.; Holick, M.F.; Grant, W.B.; Konstantynowicz, J.; Mascarenhas, M.R.; Haq, A.; Povoroznyuk, V.; Balatska, N.; Barbosa, A.P.; Karonova, T.; et al. Vitamin D supplementation guidelines. J. Steroid Biochem. Mol. Biol. 2018, 175, 125–135. [Google Scholar] [CrossRef]
- Balvers, M.G.; Brouwer-Brolsma, E.M.; Endenburg, S.; de Groot, L.C.; Kok, F.J.; Gunnewiek, J.K. Recommended intakes of vitamin D to optimise health, associated circulating 25-hydroxyvitamin D concentrations, and dosing regimens to treat deficiency: Workshop report and overview of current literature. J. Nutr. Sci. 2015, 4, e23. [Google Scholar] [CrossRef]
- Page, M.J.; McKenzie, J.E.; Bossuyt, P.M.; Boutron, I.; Hoffmann, T.C.; Mulrow, C.D.; Shamseer, L.; Tetzlaff, J.M.; Akl, E.A.; Brennan, S.E.; et al. The PRISMA 2020 statement: An updated guideline for reporting systematic reviews. BMJ 2021, 372, n71. [Google Scholar] [CrossRef]
- Gorham, E.D.; Garland, C.F.; Garland, F.C.; Grant, W.B.; Mohr, S.B.; Lipkin, M.; Newmark, H.L.; Giovannucci, E.; Wei, M.; Holick, M.F. Optimal vitamin D status for colorectal cancer prevention: A quantitative meta analysis. Am. J. Prev. Med. 2007, 32, 210–216. [Google Scholar] [CrossRef]
- Chung, M.; Lee, J.; Terasawa, T.; Lau, J.; Trikalinos, T.A. Vitamin D with or without calcium supplementation for prevention of cancer and fractures: An updated meta-analysis for the U.S. Preventive Services Task Force. Ann. Intern. Med. 2011, 155, 827–838. [Google Scholar] [CrossRef]
- Bischoff-Ferrari, H.A.; Willett, W.C.; Orav, E.J.; Lips, P.; Meunier, P.J.; Lyons, R.A.; Flicker, L.; Wark, J.; Jackson, R.D.; Cauley, J.A.; et al. A pooled analysis of vitamin D dose requirements for fracture prevention. N. Engl. J. Med. 2012, 367, 40–49. [Google Scholar] [CrossRef]
- Wang, L.; Song, Y.; Manson, J.E.; Pilz, S.; Marz, W.; Michaelsson, K.; Lundqvist, A.; Jassal, S.K.; Barrett-Connor, E.; Zhang, C.; et al. Circulating 25-hydroxy-vitamin D and risk of cardiovascular disease: A meta-analysis of prospective studies. Circ. Cardiovasc. Qual. Outcomes 2012, 5, 819–829. [Google Scholar] [CrossRef]
- Song, Y.; Wang, L.; Pittas, A.G.; Del Gobbo, L.C.; Zhang, C.; Manson, J.E.; Hu, F.B. Blood 25-hydroxy vitamin D levels and incident type 2 diabetes: A meta-analysis of prospective studies. Diabetes Care 2013, 36, 1422–1428. [Google Scholar] [CrossRef] [PubMed]
- Bauer, S.R.; Hankinson, S.E.; Bertone-Johnson, E.R.; Ding, E.L. Plasma vitamin D levels, menopause, and risk of breast cancer: Dose-response meta-analysis of prospective studies. Medicine 2013, 92, 123–131. [Google Scholar] [CrossRef] [PubMed]
- Schottker, B.; Ball, D.; Gellert, C.; Brenner, H. Serum 25-hydroxyvitamin D levels and overall mortality. A systematic review and meta-analysis of prospective cohort studies. Ageing Res. Rev. 2013, 12, 708–718. [Google Scholar] [CrossRef] [PubMed]
- Ju, S.Y.; Jeong, H.S.; Kim, D.H. Blood vitamin D status and metabolic syndrome in the general adult population: A dose-response meta-analysis. J. Clin. Endocrinol. Metab. 2014, 99, 1053–1063. [Google Scholar] [CrossRef]
- Maalmi, H.; Ordonez-Mena, J.M.; Schottker, B.; Brenner, H. Serum 25-hydroxyvitamin D levels and survival in colorectal and breast cancer patients: Systematic review and meta-analysis of prospective cohort studies. Eur. J. Cancer 2014, 50, 1510–1521. [Google Scholar] [CrossRef]
- Schottker, B.; Jorde, R.; Peasey, A.; Thorand, B.; Jansen, E.H.; Groot, L.; Streppel, M.; Gardiner, J.; Ordonez-Mena, J.M.; Perna, L.; et al. Vitamin D and mortality: Meta-analysis of individual participant data from a large consortium of cohort studies from Europe and the United States. BMJ 2014, 348, g3656. [Google Scholar] [CrossRef]
- Garland, C.F.; Kim, J.J.; Mohr, S.B.; Gorham, E.D.; Grant, W.B.; Giovannucci, E.L.; Baggerly, L.; Hofflich, H.; Ramsdell, J.W.; Zeng, K.; et al. Meta-analysis of all-cause mortality according to serum 25-hydroxyvitamin D. Am. J. Public Health 2014, 104, e43–e50. [Google Scholar] [CrossRef]
- Chen, G.C.; Zhang, Z.L.; Wan, Z.; Wang, L.; Weber, P.; Eggersdorfer, M.; Qin, L.Q.; Zhang, W. Circulating 25-hydroxyvitamin D and risk of lung cancer: A dose-response meta-analysis. Cancer Causes Control 2015, 26, 1719–1728. [Google Scholar] [CrossRef]
- Mohr, S.B.; Gorham, E.D.; Kim, J.; Hofflich, H.; Cuomo, R.E.; Garland, C.F. Could vitamin D sufficiency improve the survival of colorectal cancer patients? J. Steroid Biochem. Mol. Biol. 2015, 148, 239–244. [Google Scholar] [CrossRef]
- Zhao, Y.; Chen, C.; Pan, W.; Gao, M.; He, W.; Mao, R.; Lin, T.; Huang, J. Comparative efficacy of vitamin D status in reducing the risk of bladder cancer: A systematic review and network meta-analysis. Nutrition 2016, 32, 515–523. [Google Scholar] [CrossRef]
- Ekmekcioglu, C.; Haluza, D.; Kundi, M. 25-Hydroxyvitamin D Status and Risk for Colorectal Cancer and Type 2 Diabetes Mellitus: A Systematic Review and Meta-Analysis of Epidemiological Studies. Int. J. Environ. Res. Public Health 2017, 14, 127. [Google Scholar] [CrossRef] [PubMed]
- Feng, Q.; Zhang, H.; Dong, Z.; Zhou, Y.; Ma, J. Circulating 25-hydroxyvitamin D and lung cancer risk and survival: A dose-response meta-analysis of prospective cohort studies. Medicine 2017, 96, e8613. [Google Scholar] [CrossRef] [PubMed]
- Zhang, R.; Li, B.; Gao, X.; Tian, R.; Pan, Y.; Jiang, Y.; Gu, H.; Wang, Y.; Liu, G. Serum 25-hydroxyvitamin D and the risk of cardiovascular disease: Dose-response meta-analysis of prospective studies. Am. J. Clin. Nutr. 2017, 105, 810–819. [Google Scholar] [CrossRef] [PubMed]
- Lv, Q.B.; Gao, X.; Liu, X.; Shao, Z.X.; Xu, Q.H.; Tang, L.; Chi, Y.L.; Wu, A.M. The serum 25-hydroxyvitamin D levels and hip fracture risk: A meta-analysis of prospective cohort studies. Oncotarget 2017, 8, 39849–39858. [Google Scholar] [CrossRef]
- Jayedi, A.; Soltani, S.; Shab-Bidar, S. Vitamin D status and all-cause mortality in patients with chronic kidney disease: A systematic review and dose-response meta-analysis. J. Clin. Endocrinol. Metab. 2017, 102, 2136–2145. [Google Scholar] [CrossRef]
- Garland, C.F.; Gorham, E.D. Dose-response of serum 25-hydroxyvitamin D in association with risk of colorectal cancer: A meta-analysis. J. Steroid Biochem. Mol. Biol. 2017, 168, 1–8. [Google Scholar] [CrossRef]
- Maalmi, H.; Walter, V.; Jansen, L.; Boakye, D.; Schottker, B.; Hoffmeister, M.; Brenner, H. Association between Blood 25-Hydroxyvitamin D Levels and Survival in Colorectal Cancer Patients: An Updated Systematic Review and Meta-Analysis. Nutrients 2018, 10, 896. [Google Scholar] [CrossRef]
- Wei, H.; Jing, H.; Wei, Q.; Wei, G.; Heng, Z. Associations of the risk of lung cancer with serum 25-hydroxyvitamin D level and dietary vitamin D intake: A dose-response PRISMA meta-analysis. Medicine 2018, 97, e12282. [Google Scholar] [CrossRef]
- Hu, K.; Callen, D.F.; Li, J.; Zheng, H. Circulating Vitamin D and Overall Survival in Breast Cancer Patients: A Dose-Response Meta-Analysis of Cohort Studies. Integr. Cancer Ther. 2018, 17, 217–225. [Google Scholar] [CrossRef]
- Ju, S.Y.; Lee, J.Y.; Kim, D.H. Low 25-hydroxyvitamin D levels and the risk of frailty syndrome: A systematic review and dose-response meta-analysis. BMC Geriatr. 2018, 18, 206. [Google Scholar] [CrossRef]
- Chen, H.; Xue, W.; Li, J.; Fu, K.; Shi, H.; Zhang, B.; Teng, W.; Tian, L. 25-Hydroxyvitamin D Levels and the Risk of Dementia and Alzheimer’s Disease: A Dose-Response Meta-Analysis. Front. Aging Neurosci. 2018, 10, 368. [Google Scholar] [CrossRef] [PubMed]
- Han, J.; Guo, X.; Yu, X.; Liu, S.; Cui, X.; Zhang, B.; Liang, H. 25-Hydroxyvitamin D and Total Cancer Incidence and Mortality: A Meta-Analysis of Prospective Cohort Studies. Nutrients 2019, 11, 2295. [Google Scholar] [CrossRef] [PubMed]
- Zhang, L.; Zou, H.; Zhao, Y.; Hu, C.; Atanda, A.; Qin, X.; Jia, P.; Jiang, Y.; Qi, Z. Association between blood circulating vitamin D and colorectal cancer risk in Asian countries: A systematic review and dose-response meta-analysis. BMJ Open 2019, 9, e030513. [Google Scholar] [CrossRef] [PubMed]
- Yang, J.; Ou-Yang, J.; Huang, J. Low serum vitamin D levels increase the mortality of cardiovascular disease in older adults: A dose-response meta-analysis of prospective studies. Medicine 2019, 98, e16733. [Google Scholar] [CrossRef]
- Li, H.; Sun, D.; Wang, A.; Pan, H.; Feng, W.; Ng, C.H.; Ungvari, G.S.; Tao, L.; Li, X.; Wang, W.; et al. Serum 25-Hydroxyvitamin D Levels and Depression in Older Adults: A Dose-Response Meta-Analysis of Prospective Cohort Studies. Am. J. Geriatr. Psychiatry Off. J. Am. Assoc. Geriatr. Psychiatry 2019, 27, 1192–1202. [Google Scholar] [CrossRef]
- Jayedi, A.; Rashidy-Pour, A.; Shab-Bidar, S. Vitamin D status and risk of dementia and Alzheimer’s disease: A meta-analysis of dose-response (dagger). Nutr. Neurosci. 2019, 22, 750–759. [Google Scholar] [CrossRef]
- Shi, H.; Chen, H.; Zhang, Y.; Li, J.; Fu, K.; Xue, W.; Teng, W.; Tian, L. 25-Hydroxyvitamin D level, vitamin D intake, and risk of stroke: A dose-response meta-analysis. Clin. Nutr. 2020, 39, 2025–2034. [Google Scholar] [CrossRef]
- Mahamat-Saleh, Y.; Aune, D.; Schlesinger, S. 25-Hydroxyvitamin D status, vitamin D intake, and skin cancer risk: A systematic review and dose-response meta-analysis of prospective studies. Sci. Rep. 2020, 10, 13151. [Google Scholar] [CrossRef]
- Wu, G.; Xue, M.; Zhao, Y.; Han, Y.; Zhang, S.; Zhang, J.; Li, C.; Xu, J. Low circulating 25-hydroxyvitamin D level is associated with increased colorectal cancer mortality: A systematic review and dose-response meta-analysis. Biosci. Rep. 2020, 40, BSR20201008. [Google Scholar] [CrossRef]
- Tan, Q.; Liu, S.; Chen, D. Poor vitamin D status and the risk of maternal depression: A dose-response meta-analysis of observational studies. Public Health Nutr. 2021, 24, 2161–2170. [Google Scholar] [CrossRef]
- Zhang, D.; Cheng, C.; Wang, Y.; Sun, H.; Yu, S.; Xue, Y.; Liu, Y.; Li, W.; Li, X. Effect of Vitamin D on Blood Pressure and Hypertension in the General Population: An Update Meta-Analysis of Cohort Studies and Randomized Controlled Trials. Prev. Chronic Dis. 2020, 17, E03. [Google Scholar] [CrossRef] [PubMed]
- Hou, Y.; Song, A.; Jin, Y.; Xia, Q.; Song, G.; Xing, X. A dose-response meta-analysis between serum concentration of 25-hydroxy vitamin D and risk of type 1 diabetes mellitus. Eur. J. Clin. Nutr. 2021, 75, 1010–1023. [Google Scholar] [CrossRef] [PubMed]
- Jani, R.; Mhaskar, K.; Tsiampalis, T.; Kassaw, N.A.; Gonzalez, M.A.M.; Panagiotakos, D.B. Circulating 25-hydroxy-vitamin D and the risk of cardiovascular diseases. Systematic review and meta-analysis of prospective cohort studies. Nutr. Metab. Cardiovasc. Dis. 2021, 31, 3282–3304. [Google Scholar] [CrossRef] [PubMed]
- Hajhashemy, Z.; Shahdadian, F.; Ziaei, R.; Saneei, P. Serum vitamin D levels in relation to abdominal obesity: A systematic review and dose-response meta-analysis of epidemiologic studies. Obes. Rev. 2021, 22, e13134. [Google Scholar] [CrossRef]
- Mohammadi, S.; Hajhashemy, Z.; Saneei, P. Serum vitamin D levels in relation to type-2 diabetes and prediabetes in adults: A systematic review and dose-response meta-analysis of epidemiologic studies. Crit. Rev. Food Sci. Nutr. 2022, 62, 8178–8198. [Google Scholar] [CrossRef]
- Lee, K.; Kim, J. Serum vitamin D status and metabolic syndrome: A systematic review and dose-response meta-analysis. Nutr. Res. Pract. 2021, 15, 329–345. [Google Scholar] [CrossRef]
- Mokhtari, E.; Hajhashemy, Z.; Saneei, P. Serum Vitamin D Levels in Relation to Hypertension and Pre-hypertension in Adults: A Systematic Review and Dose-Response Meta-Analysis of Epidemiologic Studies. Front. Nutr. 2022, 9, 829307. [Google Scholar] [CrossRef]
- Bahadorpour, S.; Hajhashemy, Z.; Saneei, P. Serum 25-hydroxyvitamin D levels and dyslipidemia: A systematic review and dose-response meta-analysis of epidemiologic studies. Nutr. Rev. 2022, 81, 1–25. [Google Scholar] [CrossRef]
- Guo, L.L.; Chen, S.S.; Zhong, L.X.; He, K.Y.; Li, Y.T.; Chen, W.W.; Zeng, Q.T.; Tang, S.H. Vitamin D intake as well as circulating 25-hydroxyvitamin D level and risk for the incidence and recurrence of colorectal cancer precursors: A meta-analysis. Front. Med. 2022, 9, 877275. [Google Scholar] [CrossRef]
- Jayedi, A.; Daneshvar, M.; Jibril, A.T.; Sluyter, J.D.; Waterhouse, M.; Romero, B.D.; Neale, R.E.; Manson, J.E.; Shab-Bidar, S. Serum 25(OH)D Concentration, Vitamin D Supplementation, and Risk of Cardiovascular Disease and Mortality in Patients with Type 2 Diabetes or Prediabetes: A Systematic Review and Dose-Response Meta-Analysis. Am. J. Clin. Nutr. 2023, 118, 697–707. [Google Scholar] [CrossRef]
- Rouhani, P.; Mokhtari, E.; Lotfi, K.; Saneei, P. The association between circulating 25-hydroxyvitamin D levels and preeclampsia: A systematic review and dose-response meta-analysis of epidemiologic studies with GRADE assessment. Nutr. Rev. 2023, 81, 1267–1289. [Google Scholar] [CrossRef] [PubMed]
- Vergatti, A.; Abate, V.; Zarrella, A.F.; Manganelli, F.; Tozza, S.; Iodice, R.; De Filippo, G.; D’Elia, L.; Strazzullo, P.; Rendina, D. 25-Hydroxy-Vitamin D and Risk of Recurrent Stroke: A Dose Response Meta-Analysis. Nutrients 2023, 15, 512. [Google Scholar] [CrossRef] [PubMed]
- Cashman, K.D. Global differences in vitamin D status and dietary intake: A review of the data. Endocr. Connect. 2022, 11, e210282. [Google Scholar] [CrossRef] [PubMed]
- Bouillon, R.; Marcocci, C.; Carmeliet, G.; Bikle, D.; White, J.H.; Dawson-Hughes, B.; Lips, P.; Munns, C.F.; Lazaretti-Castro, M.; Giustina, A.; et al. Skeletal and Extraskeletal Actions of Vitamin D: Current Evidence and Outstanding Questions. Endocr. Rev. 2019, 40, 1109–1151. [Google Scholar] [CrossRef]
- Lapauw, B.; Laurent, M.R.; Rozenberg, S.; Body, J.J.; Bruyere, O.; Gielen, E.; Goemaere, S.; Iconaru, L.; Cavalier, E. When and How to Evaluate Vitamin D Status? A Viewpoint from the Belgian Bone Club. Nutrients 2024, 16, 2388. [Google Scholar] [CrossRef]
- Pludowski, P.; Kos-Kudla, B.; Walczak, M.; Fal, A.; Zozulinska-Ziolkiewicz, D.; Sieroszewski, P.; Peregud-Pogorzelski, J.; Lauterbach, R.; Targowski, T.; Lewinski, A.; et al. Guidelines for Preventing and Treating Vitamin D Deficiency: A 2023 Update in Poland. Nutrients 2023, 15, 695. [Google Scholar] [CrossRef]
- Pittas, A.G.; Kawahara, T.; Jorde, R.; Dawson-Hughes, B.; Vickery, E.M.; Angellotti, E.; Nelson, J.; Trikalinos, T.A.; Balk, E.M. Vitamin D and Risk for Type 2 Diabetes in People With Prediabetes: A Systematic Review and Meta-analysis of Individual Participant Data From 3 Randomized Clinical Trials. Ann. Intern. Med. 2023, 176, 355–363. [Google Scholar] [CrossRef]
- Wu, J.; Atkins, A.; Downes, M.; Wei, Z. Vitamin D in Diabetes: Uncovering the Sunshine Hormone’s Role in Glucose Metabolism and Beyond. Nutrients 2023, 15, 1997. [Google Scholar] [CrossRef]
- Dror, Y.; Giveon, S.M.; Hoshen, M.; Feldhamer, I.; Balicer, R.D.; Feldman, B.S. Vitamin D levels for preventing acute coronary syndrome and mortality: Evidence of a nonlinear association. J. Clin. Endocrinol. Metab. 2013, 98, 2160–2167. [Google Scholar] [CrossRef]
- Zittermann, A.; Kuhn, J.; Dreier, J.; Knabbe, C.; Gummert, J.F.; Borgermann, J. Vitamin D status and the risk of major adverse cardiac and cerebrovascular events in cardiac surgery. Eur. Heart J. 2013, 34, 1358–1364. [Google Scholar] [CrossRef]
- Rust, P.; Ekmekcioglu, C. The Role of Diet and Specific Nutrients during the COVID-19 Pandemic: What Have We Learned over the Last Three Years? Int. J. Environ. Res. Public Health 2023, 20, 5400. [Google Scholar] [CrossRef]

| Reference | Outcome(s) | Included Studies for Dose–Response Analysis | Lowest Risk (RR/HR/OR) in nmol/L * | Shape of Association—Nonlinearity (Significance) |
|---|---|---|---|---|
| Gorham ED et al. 2007 [17] | Colorectal cancer | 5 studies | 34 ng/mL (85 nmol/L, 50% reduction in incidence, from paper) | Inverse dose–response gradient in quintiles |
| Grant WB 2010 [12] | Breast cancer | 6 studies | Approx. 78 nmol/L (50% reduction in incidence rate, from paper) | Nonlinear regression line |
| Colorectal cancer | 10 studies | Approx. 60 nmol/L (50% reduction in incidence rate, from paper) | ||
| Chung M et al. 2011 [18] | Colorectal cancer | 9 studies | Lowest risk not clearly extractable; especially for colorectal cancer, most studies found inverse relationship with prediagnosis blood 25- (OH)D concentration | Presentation of individual study curves |
| Prostate cancer | 8 studies | |||
| Breast cancer | 4 studies | |||
| Bischoff-Ferrari HA et al. 2012 [19] | Hip fracture | 4383 study participants | ≥61 nmol/L (from paper) | Threshold assessment for risk of fracture according to quartile of baseline 25(OH)D level |
| Non-vertebral fracture | ≥61 nmol/L (from paper) | |||
| Wang L et al. 2012 [20] | Cardiovascular disease | 16 studies | Approx. 60 nmol/L (from paper) | Linear relation (p = 0.06); higher risk below 50–60 nmol/L; high values not clearly associated with higher risk |
| Song Y et al. 2013 [21] | Type 2 diabetes mellitus | 18 studies | Significantly lower risk at approximately 50 nmol/L (from paper) | Linear relation across range of 25(OH)D concentration from 20 up to 160 nmol/L was significant (p < 0.0001) |
| Around 100 nmol/L (after exclusion of 3 studies; evidence for relation of 25(OH)D concentration of >100 nmol/L with type 2 diabetes was weak) | ||||
| Bauer SR et al. 2013 [22] | Breast cancer in postmenopausal women | Total of 9 studies | 35 ng/mL (87.5 nmol/L, from paper) | Nonlinear association (p = 0.05) |
| Schöttker B et al. 2013 [23] | Overall mortality | 12 studies | Approx. 50–60 nmol/L in most of the studies (rather linear, weak association) | 25(OH)D concentration categories in single studies |
| Ju SY et al. 2014 [24] | Metabolic syndrome | 16 cross-sectional studies | 120 nmol/L (from paper; possibly lower risk at higher levels according to regression model) | Weighted linear regression model was fitted (p for linear trend < 0.001) |
| Maalmi H et al. 2014 [25] | Overall mortality, breast cancer | 5 studies | Approx. 50–100 nmol/L (estimate) | 25(OH)D concentration categories in single studies |
| Overall mortality, colorectal cancer | 5 studies | Approx. 50–100 nmol/L (estimate) Few data points, somewhat high deviation | ||
| Schöttker B et al. 2014 [26] | All-cause mortality | 8 studies | 70 nmol/L | Curvilinear association within quintiles of 25(OH)D concentration |
| Cardiovascular mortality (with or without history of CVD) | 8 studies | 70 nmol/L | ||
| Garland CF et al. 2014 [27] | All-cause mortality | 32 studies | 30–39 ng/mL (75–97.5 nmol/L), with 36 ng/mL (90 nmol/L) n.s. at higher levels (from paper) | Stratified in 10 ng/mL intervals |
| Chen GC et al. 2015 [28] | Lung cancer | 10 studies (?) | Approximately 53 nmol/L (from paper) | U-shaped, nonlinear relationship (Pnonlinearity = 0.02) |
| Mohr SB et al. 2015 [29] | Colorectal cancer mortality | 4 studies | Approx. 30–40 ng/mL (75–100 nmol/L) | Results of individual studies |
| Zhao Y et al. 2016 [30] | Bladder cancer | 7 studies | 75 nmol/L (last quintile) | Inverse linear in quintiles |
| Ekmekcioglu C et al. 2017 [31] | Type 2 diabetes | 119 risk estimates | About 65 ng/mL (162.5 nmol/L, from paper) | Roughly U-shaped association |
| Colorectal cancer | 111 risk estimates | About 55 ng/mL (137.5 nmol/L, from paper) | U-shaped association | |
| Feng Q et al. 2017 [32] | Lung cancer | 9 studies | Around 43 nmol/L (estimate) | Roughly U-shaped |
| Zhang R et al. 2017 [33] | Total cardiovascular events | 32 publications | Approx. 25 ng/mL (62.5 nmol/L, from paper) | Nonlinear association (p < 0.001) |
| CVD mortality | 17 publications | 40 ng/mL (100 nmol/L, end of curve, estimate) | Nonlinear association (p < 0.022) | |
| LV QB et al. 2017 [34] | Hip fracture | 4 studies | Approx. 60 nmol/L (from paper) | p = 0.110 for nonlinearity |
| Jayedi A et al. 2017 [35] | All-cause mortality in patients with chronic kidney disease | 6–7 studies | Approx. 25–30 ng/mL (62.5–75 nmol/L, from paper) | Nonlinear dose–response meta-analysis, significant curvilinear association (Pnonlinearity = 0.002 and 0.004 after exclusion of one study) |
| Garland CF, Gorham ED 2017 [36] | Risk of colorectal cancer | 15 studies | Suggested to be 35 ng/mL (87.5 nmol/L, from paper) | Linear downward trend, medians of ORs for each 10 ng/mL interval |
| Maalmi H et al. 2018 [37] | Overall survival in colorectal cancer patients | 4 studies | Around 40–50 nmol/L (rough estimate) | 25(OH)D concentration categories in single studies |
| Cancer-specific survival | 3 studies | Around 40–50 nmol/L (rough estimate) | 25(OH)D concentration categories in single studies | |
| Wei H et al. 2018 [38] | Lung cancer | 9 studies | Around 60 nmol/L (estimate) | Nonlinear model, nonlinearity tests (p = 0.14) |
| Hu K et al. 2018 [39] | Overall survival in breast cancer patients | 6 studies | Linear decrease (unreliable data in the highest range) | No significant nonlinearity in relationship between overall survival and circulating 25(OH)D levels (Pnonlinearity = 0.13) |
| Ju SY et al. 2018 [40] | Frailty syndrome | 4 cohort studies, 6 cross-sectional studies | 94 nmol/L (lowest RR, from paper) | Linear model |
| Chen H et al. 2018 [41] | Dementia | 9 studies | Approx. 65 nmol/L (end of linear trend, estimate) | Inverse linear trend (p < 0.001), nonlinearity n.s. |
| Alzheimer’s disease | 4 studies | Approx. 65 nmol/L (end of linear trend) | ||
| Han J et al. 2019 [42] | Total cancer incidence | Not indicated for dose–response analyses | Around 30–50 nmol/L (estimation from curve) | Dose–response linear trend (variance-weighted least squares regression of fixed effect model) |
| Total cancer mortality | Not indicated for dose–response analyses | Around 75 nmol/L (estimation from curve) | Dose–response linear trend (variance-weighted least squares regression of fixed effect model) | |
| Zhang L et al. 2019 [43] | Colorectal cancer | 4 studies | Around 37 ng/mL (92.5 nmol/L, end of curve, estimation) | Linear and spline model, nonlinear trend (Pnonlinearity = 0.11) |
| Yang J et al. 2019 [44] | Mortality of cardiovascular disease | Approx. 90 nmol/L (end of curve, almost linear, estimate) | Nonlinear dose relationship, p < 0.001 | |
| Li H et al. 2019 [45] | Depression | 6 studies | Approx. 65 ng/mL (162.5 nmol/L, end of line, estimate) | Restricted cubic splines, linear association (Pnonlinearity = 0.96) |
| Jayedi A et al. 2019 [46] | Dementia | 6 studies | 25 ng/mL (62.5 nmol/L, from paper) | Pnonlinearity = 0.05, U-shaped |
| 5 studies | Approx. 30 ng/mL (75 nmol/L, after exclusion of one study, from paper) | Pnonlinearity = 0.22 | ||
| Alzheimer’s disease | 4 studies | 35 ng/mL (87.5 nmol/L, from paper) | Pnonlinearity = 0.08 | |
| Shi H et al. 2020 [47] | Stroke | 8 cohort studies | 50 nmol/L (from paper) | Nonlinear association (p = 0.04) |
| Mahamat-Saleh Y et al. 2020 [48] | Melanoma | 3 cohort studies | Around 30 nmol/L (estimate) | Nonlinearity n.s. (Pnonlinearity = 0.08) |
| Keratinocyte cancer | 3 cohort studies | Less or more than 60 nmol/L (from paper) | Nonlinear association (Pnonlinearity = 0.01); inverse U-shaped, highest risk around 60 nmol/L (from paper) | |
| Wu G et al. 2020 [49] | All-cause mortality | Total of 17 studies (dose–response not indicated) | Approx. 40 nmol/L (estimate) | L-shaped |
| Colorectal cancer mortality | Approx. 80 nmol/L (estimate) | Nearly inverse linear | ||
| Tan Q et al. 2020 [50] | Risk of maternal depression | 10 studies | 90–110 nmol/L (from paper) | Pnonlinearity = 0.001 |
| Zhang D et al. 2020 [51] | Hypertension | 10 studies | Decreasing risk from 75 nmol/L up to lowest risk at 130 nmol/L (from paper) | Restricted cubic splines, L-shaped, Pnonlinearity = 0.04 |
| Hou Y et al. 2021 [52] | Type 1 diabetes mellitus | 10 studies | 103–113 nmol/L (from paper) | U-shaped association, inverse nonlinear association (p < 0.001) |
| Jani R et al. 2021 [53] | Fatal CVD events | 28 studies | Approx. 30 ng/mL (75 nmol/L) (estimate) | Nonlinear association (Pnonlinearity < 0.001) |
| Non-fatal CVD events | 10 studies | Approx. 65 ng/mL (162.5 nmol/L) (rough estimate, end of line) | Linear association | |
| Combined CVD incidence events | 31 studies | Approx. 30 ng/mL (75 nmol/L) (estimate) | Combined CVD events (Pnonlinearity = 0.001) | |
| Hajhashemy Z et al. 2021 [54] | Abdominal obesity | 8 studies | Approx. 85 nmol/L (estimate) | U-shaped, Pnonlinearity = 0.86 |
| Mohammadi S et al. 2022 [55] | Type 2 diabetes mellitus | 19 studies | Approx. 15 ng/mL (37.5 nmol/L, estimate) | U-shaped (Pnonlinearity = 0.68) |
| Type 2 diabetes mellitus + prediabetes | 4 studies | Approx. 35 ng/mL (87.5 nmol/L, nearly linear, end of curve, estimate) | Pnonlinearity < 0.001 | |
| Lee K, Kim J 2021 [56] | Metabolic syndrome | 23 studies | 150 nmol/L (from paper) | Weighted linear dose–response regression model (Pnonlinearity = 0.10) |
| Mokhtari E et al. 2022 [57] | Hypertension | 10 studies | Around 75 nmol/L (estimate) | Nonlinear association (P nonlinearity < 0.001), roughly U-shaped association |
| Bahadorpour S et al. 2022 [58] | Hypertriglyceridemia | 20 studies | Shape of sinusoidal curve; approx. 55 ng/mL (137.5 nmol/L, end of curve, estimate; first nadir at approx. 15 ng/mL) | Pnonlinearity < 0.001 |
| Guo LL et al. 2022 [59] | Colorectal cancer precursor incidence | 7 studies | Approx. 40 ng/mL (100 nmol/L, almost linear, end of line, estimate) | Significant negative dose–response relationship with circulating 25(OH)D (Pnonlinearity = 0.39) level |
| Jayedi A et al. 2023 [60] | All-cause mortality in patients with diabetes or prediabetes | 11 cohort studies (10 publications) | Around 60 nmol/L (from paper) | J-shaped (Pnonlinearity < 0.001, Pdose–response < 0.001) |
| Cardiovascular mortality in patients with diabetes or prediabetes | 6 cohort studies | Around 60 nmol/L (from paper) | U-shaped (Pnonlinearity < 0.001, Pdose–response < 0.001) | |
| Rouhani P et al. 2023 [61] | Preeclampsia | 13 publications (nonlinear dose–response analysis) | 30 ng/mL (75 nmol/L, from paper) | U-shaped (Pnonlinearity < 0.001) |
| Vergatti A et al. 2023 [62] | Recurrent stroke | 3 prospective studies | 28.1 ng/mL (70.25 nmol/L, from paper) | Nonlinear association (Pnonlinearity < 0.0001) |
Disclaimer/Publisher’s Note: The statements, opinions and data contained in all publications are solely those of the individual author(s) and contributor(s) and not of MDPI and/or the editor(s). MDPI and/or the editor(s) disclaim responsibility for any injury to people or property resulting from any ideas, methods, instructions or products referred to in the content. |
© 2025 by the authors. Licensee MDPI, Basel, Switzerland. This article is an open access article distributed under the terms and conditions of the Creative Commons Attribution (CC BY) license (https://creativecommons.org/licenses/by/4.0/).
Share and Cite
Ekmekcioglu, C.; Poteser, M. The Optimal Protective 25-Hydroxyvitamin D Level for Different Health Outcomes in Adults: A Brief Summary of Dose–Response Meta-Analyses. Metabolites 2025, 15, 264. https://doi.org/10.3390/metabo15040264
Ekmekcioglu C, Poteser M. The Optimal Protective 25-Hydroxyvitamin D Level for Different Health Outcomes in Adults: A Brief Summary of Dose–Response Meta-Analyses. Metabolites. 2025; 15(4):264. https://doi.org/10.3390/metabo15040264
Chicago/Turabian StyleEkmekcioglu, Cem, and Michael Poteser. 2025. "The Optimal Protective 25-Hydroxyvitamin D Level for Different Health Outcomes in Adults: A Brief Summary of Dose–Response Meta-Analyses" Metabolites 15, no. 4: 264. https://doi.org/10.3390/metabo15040264
APA StyleEkmekcioglu, C., & Poteser, M. (2025). The Optimal Protective 25-Hydroxyvitamin D Level for Different Health Outcomes in Adults: A Brief Summary of Dose–Response Meta-Analyses. Metabolites, 15(4), 264. https://doi.org/10.3390/metabo15040264