Insights from Population Genomics to Enhance and Sustain Biological Control of Insect Pests


Abstract
1. Introduction
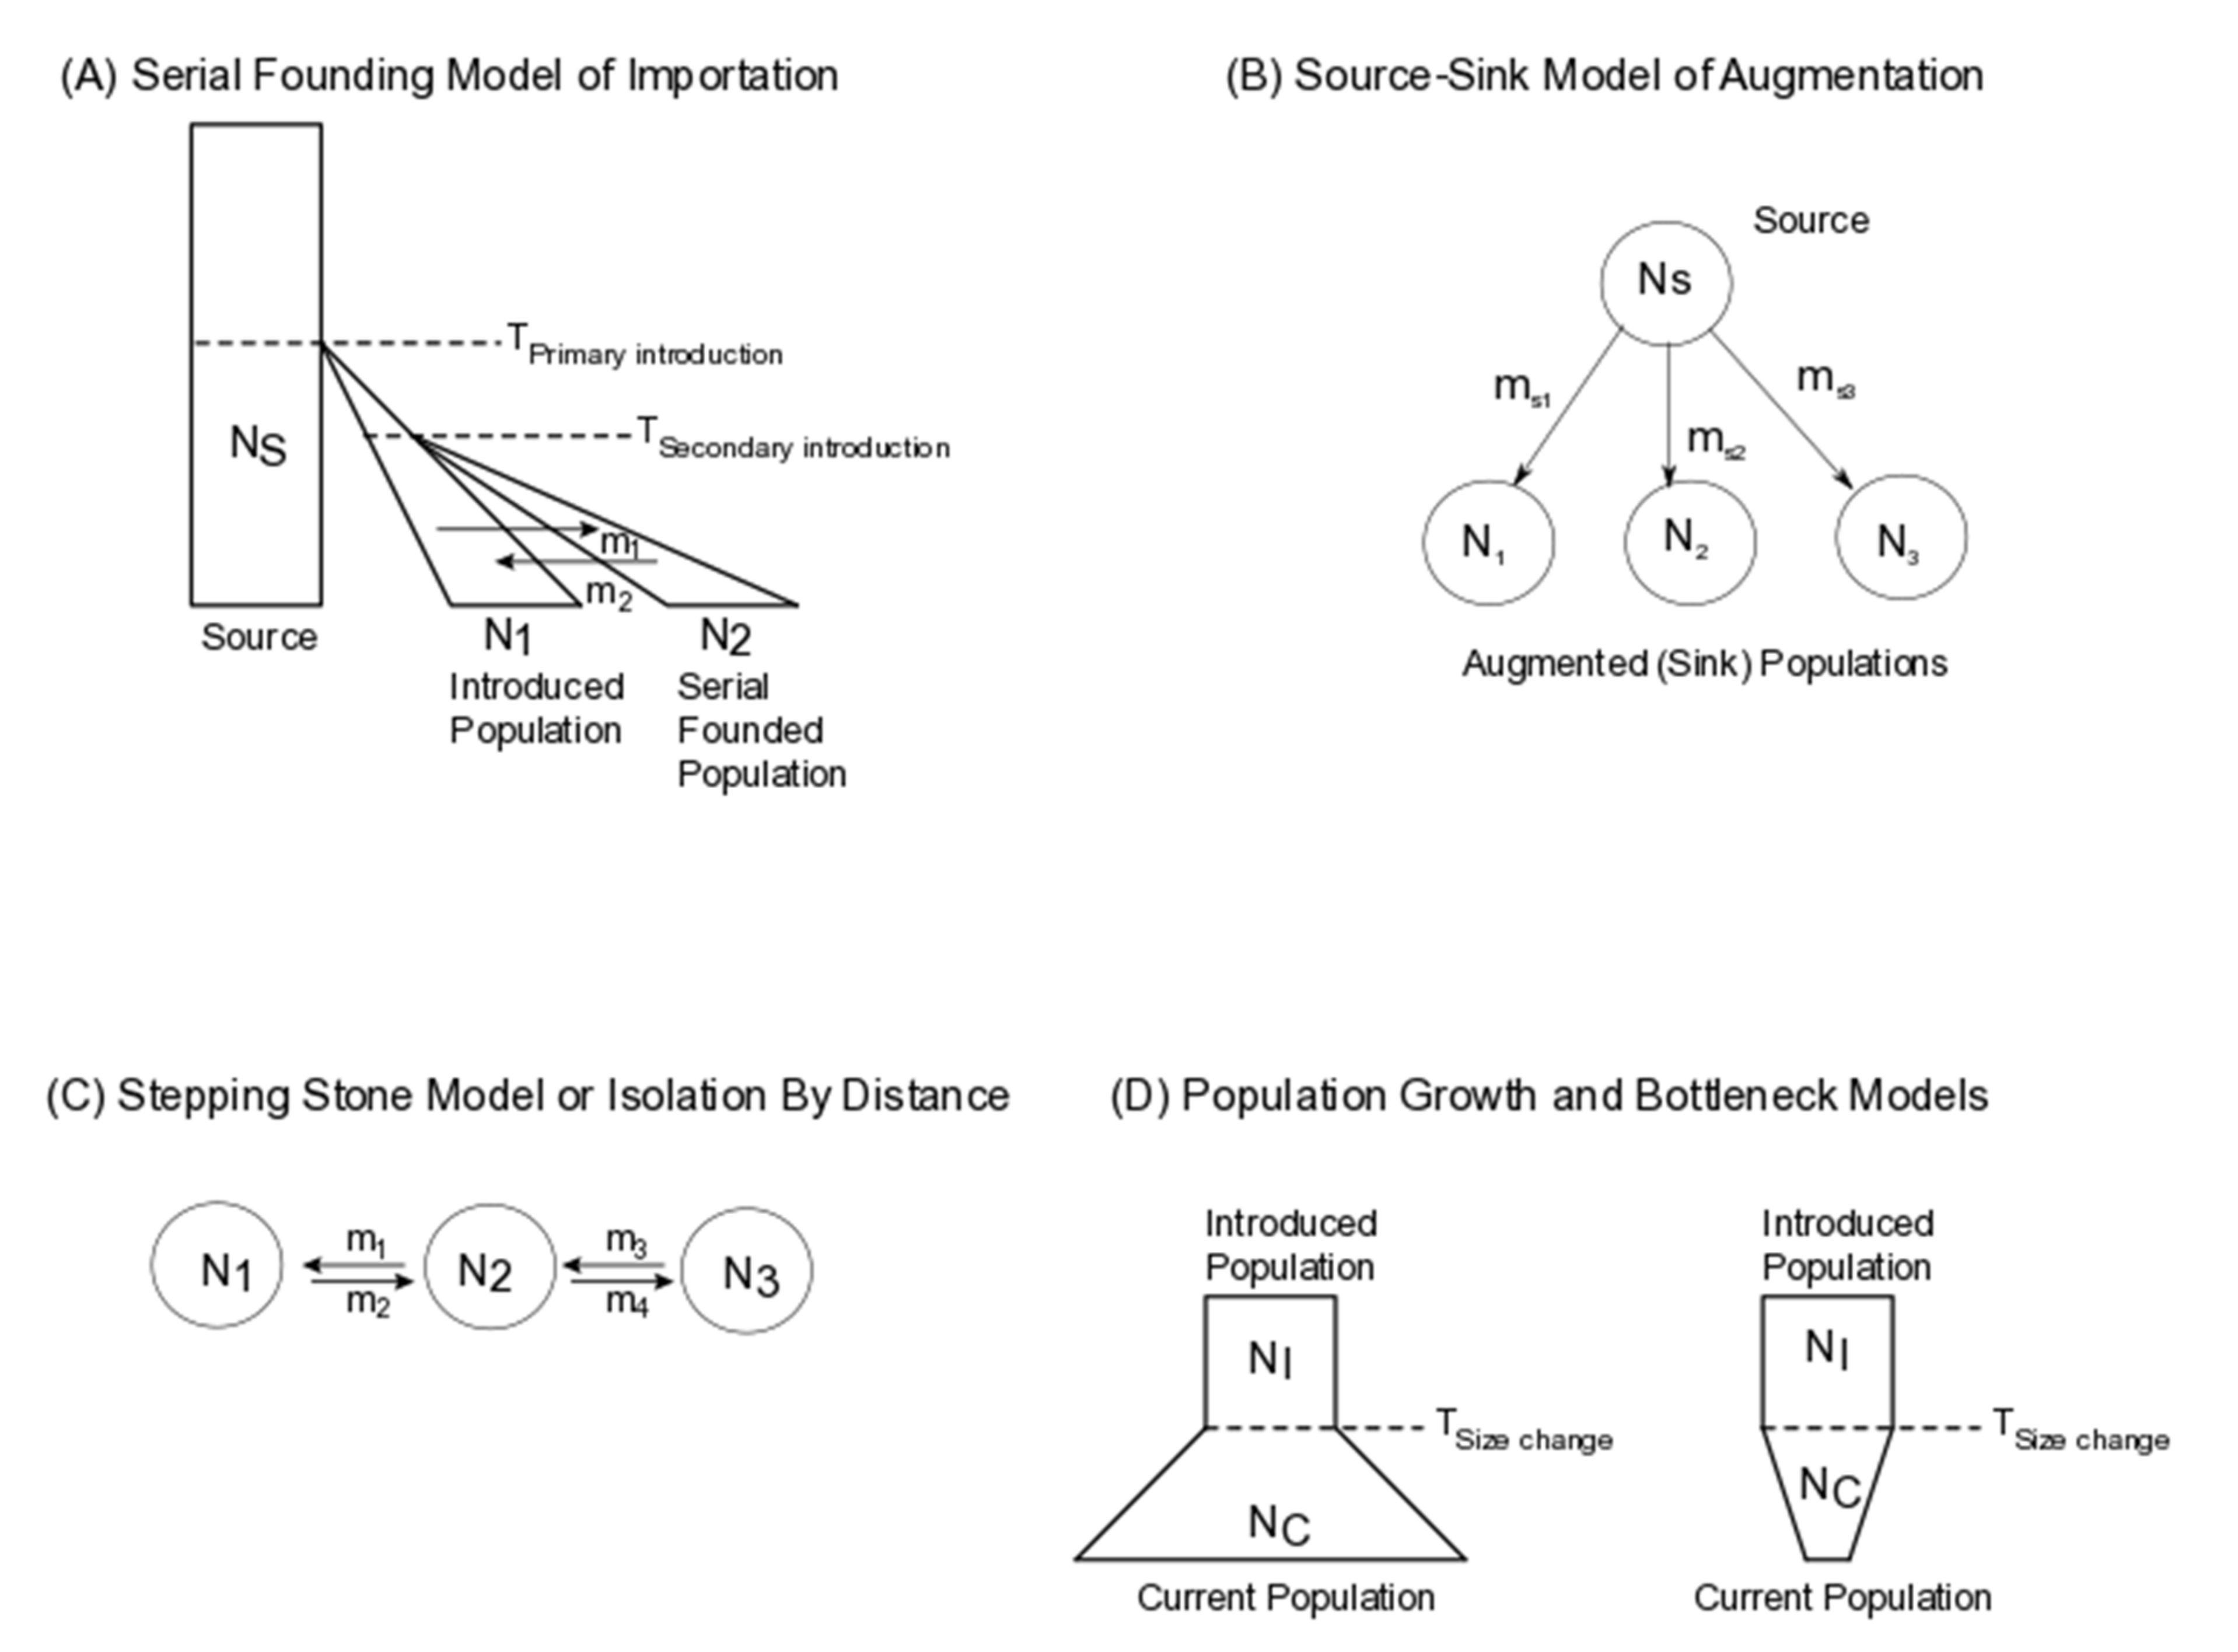
2. Application of Population Genomic Models to Biological Control
3. Genomic Signatures during Biological Control
3.1. Population Size Change
3.2. Natural Selection and Evolution
3.3. Gene Flow (Admixture/Migration)
3.4. Inbreeding
4. Discussion and Recommendations
4.1. Genomic Considerations for Successful Biological Control
4.2. Suggested Pipeline For Including Genomics Into Biological Control Programs
- Define biological questions about the system and build a hypothesized quantitative model of evolution based on mode of biological control. Is there a historical record of introductions in other regions, trophic-level interactions and ecological success parameters (described in Reference [13], including census size estimation and range expansion with host? For example, H. axyridis has successfully established populations across the world owing to importation for biological control and invasiveness. Due to its known historical record of introduction, Lombaert et al., 2010 [20] propose and test a model of hybridization of inbred Eastern and Western clusters of the species that putatively yielded the invasive Eastern North American population.
- Develop a sampling plan. Numerous studies [120,121] describe the issue of sample sizes, determined as(a) the number of individuals sampled per locale, (b) the number of sampling locales, (c) and the number and type of genomic loci analyzed. In short, although large sample sizes are preferable for estimating genomic diversity and differentiation, coalescent modeling and estimation of evolutionary history can work well with smaller sample sizes and greater number of genomic loci. Using replicated random samples of 3000 SNPs (Single Nucleotide Polymorphisms) from a large 2bRAD dataset from populations of the biological control organism H. axyridis, Li et al., 2020 [122] determined that a minimum of 6 individuals per population are sufficient to accurately estimate within- and between-population genomic diversity and differentiation. The ideal sampling plan should also be informed by the sequencing platform or protocol used for genotyping-by-sequencing, which is optimized to run up to 96 uniquely barcoded individuals to obtain thousands of informative sites.
- Conduct genotyping/sequencing. Strategies for obtaining molecular sequence or genotype information are contingent primarily on previously available genomic information from the species of interest. For example, many arthropod genomes are currently available (476 as of May 2020), with more in the works (see Arthropod Genomic Consortium, http://i5k.github.io/arthropod_genomes_at_ncbi) [123]. Alternatively, dense reduced representation library-based sequencing/genotyping [124] via technologies like RADseq [125] and PoolSeq [126] offer opportunities for demographic inference using SNPs in species with little prior genomic information. Meanwhile, repeat-based markers such as microsatellites continue to provide useful genetic insights into biological control organisms [20,21,98,127].
- Undertake preliminary bioinformatics steps involved in sequence/genotype clean-up, assembly, alignment and variant calling. Pipelines and tools have been developed to ease processing genomic/genotypic/sequencing data, including GATK [128], vcftools [129], SAMtools [130], BAMtools [131] and STACKS [132]. Resources for preliminary bioinformatics analyses are summarized under contributions of the Galaxy Project (www.galaxyproject.org) [133,134].
- Perform exploratory analyses. Calculate Method of Moments estimates of summary statistics, including heterozygosity, polymorphism, diversity indices, differentiation, allelic richness and inbreeding coefficients. Tools that bundle methods to estimate most basic summary statistics from genomic data include STACKS [132], VCFTools [129], PopGenome [135] and adegenet/pegas [136,137] packages in R (Table 3).
- Perform secondary analyses. Build data-sets (from whole genomic, reduced representation or genotypic data) that satisfy assumptions of the model or method of choice. Each method listed in Table 1 has its own set of caveats, assumptions and models, more details about which have been summarized in Reference [138].
- Simulate/estimate parameters under the model. The choice of programs for estimating demographic parameters depends on the type of genomic data (Table 1). Genotypic data (e.g., SNPs) are amenable for use in frequency-based statistics to infer demography and processes of divergent evolution. For instance, using SNP loci to compute divergence statistics (Fst—[139] and other variants—[140,141], D statistic—ABBA-BABA tests—see References [60,142] can reveal migratory history between populations. Similarly, allele frequencies computed from individual loci can be used in likelihood and Bayesian methods to estimate population genetic structure and admixture, which is the basis of the widely cited program, STRUCTURE [41]. With ongoing improvements in sequencing technologies that offer high coverage and long reads, genotyping-by-sequencing technologies likely will be the go-to in terms of generating and analyzing large-scale population genomic data for biological control where no extensive whole genomic resources are available currently.
- Model selection. Demographic models often oversimplify the irrefutably complex reality of how populations evolve. However, statistics allow us to rigorously identify a model that explains the data better. Depending on the statistical methods applied, commonly utilized model-selection paradigms include likelihood ratio tests [54] and Akaike/Bayesian Information Criteria [143].
- Interpret estimated parameters under the “best” model, reconciling assumptions and biology of the system. The final step involves using a statistically informed explanation of the biological processes affecting populations of introduced biological control organisms and discussing the caveats of using model-based population genomics.
5. Conclusions
Funding
Acknowledgments
Conflicts of Interest
References
- Gutierrez, A.; Caltagirone, L.; Meikle, W. Evaluation of results: Economics of biological control. In Handbook of Biological Control; Elsevier: Amsterdam, The Netherlands, 1999; pp. 243–252. [Google Scholar]
- Gurr, G.; Wratten, S. FORUM ‘Integrated biological control’: A proposal for enhancing success in biological control. Int. J. Pest Manag. 1999, 45, 81–84. [Google Scholar] [CrossRef]
- Gurr, G.; Wratten, S.; Barbosa, P. Success in conservation biological control of arthropods. In Biological control: Measures of Success; Springer: Berlin/Heidelberg, Germany, 2000; pp. 105–132. [Google Scholar]
- Fisher, T.; Bellows, T.S.; Caltagirone, L.; Dahlsten, D.; Huffaker, C.B.; Gordh, G. Handbook of Biological Control: Principles and Applications of Biological Control; Elsevier: Amsterdam, The Netherlands, 1999. [Google Scholar]
- Pickett, C.; Pitcairn, M. Classical biological control of ash whitefly: Factors contributing to its success in California. BioControl 1999, 44, 143–158. [Google Scholar] [CrossRef]
- Van Driesche, R.G.; Bellows, T.S. Biology of arthropod parasitoids and predators. In Biological Control; Springer: Berlin/Heidelberg, Germany, 1996; pp. 309–336. [Google Scholar]
- Neuenschwander, P. Biological control of the cassava mealybug in Africa: A review. Biol. Control. 2001, 21, 214–229. [Google Scholar] [CrossRef]
- Haynes, D.; Gage, S. The cereal leaf beetle in North America. Annu. Rev. Entomol. 1981, 26, 259–287. [Google Scholar] [CrossRef]
- Hajek, A.E.; Eilenberg, J. Natural Enemies: An Introduction to Biological Control; Cambridge University Press: Cambridge, UK, 2018. [Google Scholar]
- Wajnberg, E.; Scott, J.K.; Quimby, P.C. Evaluating Indirect Ecological Effects of Biological Control; CABI: Wallingford, UK, 2001. [Google Scholar]
- Follett, P.A.; Duan, J.J. Nontarget Effects of Biological Control; Springer: Berlin/Heidelberg, Germany, 2012. [Google Scholar]
- Ehler, L.E.; Sforza, R.; Mateille, T. Genetics, Evolution, and Biological Control; CABI: Wallingford, UK, 2003. [Google Scholar]
- Gurr, G.M.; Wratten, S.D.; Snyder, W.E. Biodiversity and Insect Pests: Key Issues for Sustainable Management; John Wiley & Sons: Hoboken, NJ, USA, 2012. [Google Scholar]
- Guillemaud, T.; Ciosi, M.; Lombaert, E.; Estoup, A. Biological invasions in agricultural settings: Insights from evolutionary biology and population genetics. Comptes Rendus Biol. 2011, 334, 237–246. [Google Scholar] [CrossRef] [PubMed]
- Gassmann, A.J.; Onstad, D.W.; Pittendrigh, B.R. Evolutionary analysis of herbivorous insects in natural and agricultural environments. Pest. Manag. Sci. Former. Pestic. Sci. 2009, 65, 1174–1181. [Google Scholar] [CrossRef] [PubMed]
- Rius, M.; Bourne, S.; Hornsby, H.G.; Chapman, M.A. Applications of next-generation sequencing to the study of biological invasions. Curr. Zool. 2015, 61, 488–504. [Google Scholar] [CrossRef]
- Hufbauer, R.A.; Roderick, G.K. Microevolution in biological control: Mechanisms, patterns, and processes. Biol. Control 2005, 35, 227–239. [Google Scholar] [CrossRef]
- Clausen, C. Introduced parasites and predators of arthropod pests and weeds: A world review. Curculionidae. US Dep. Agric. Agric. Handb. 1978, 480, 259–276. [Google Scholar]
- Kajita, Y.; O’Neill, E.M.; Zheng, Y.; Obrycki, J.J.; Weisrock, D.W. A population genetic signature of human releases in an invasive ladybeetle. Mol. Ecol. 2012, 21, 5473–5483. [Google Scholar] [CrossRef]
- Lombaert, E.; Guillemaud, T.; Cornuet, J.-M.; Malausa, T.; Facon, B.; Estoup, A. Bridgehead effect in the worldwide invasion of the biocontrol harlequin ladybird. PLoS ONE 2010, 5, e9743. [Google Scholar] [CrossRef] [PubMed]
- Lombaert, E.; Estoup, A.; Facon, B.; Joubard, B.; Grégoire, J.-C.; Jannin, A.; Blin, A.; Guillemaud, T. Rapid increase in dispersal during range expansion in the invasive ladybird Harmonia axyridis. J. Evol. Biol. 2014, 27, 508–517. [Google Scholar] [CrossRef]
- Caltagirone, L.; Doutt, R. The history of the vedalia beetle importation to California and its impact on the development of biological control. Annu. Rev. Entomol. 1989, 34, 1–16. [Google Scholar] [CrossRef]
- Slatkin, M.; Excoffier, L. Serial founder effects during range expansion: A spatial analog of genetic drift. Genetics 2012, 191, 171–181. [Google Scholar] [CrossRef] [PubMed]
- Talamas, E.J.; Herlihy, M.V.; Dieckhoff, C.; Hoelmer, K.A.; Buffington, M.; Bon, M.-C.; Weber, D.C. Trissolcus japonicus (Ashmead)(Hymenoptera, Scelionidae) emerges in North America. J. Hymenopt. Res. 2015, 43, 119. [Google Scholar] [CrossRef]
- Estoup, A.; Guillemaud, T. Reconstructing routes of invasion using genetic data: Why, how and so what? Mol. Ecol. 2010, 19, 4113–4130. [Google Scholar] [CrossRef]
- Calfee, E.; Agra, M.N.; Palacio, M.A.; Ramírez, S.R.; Coop, G. Selection and hybridization shaped the Africanized honey bee invasion of the Americas. BioRxiv 2020. [Google Scholar] [CrossRef]
- Van Lenteren, J. Success in biological control of arthropods by augmentation of natural enemies. In Biological Control: Measures of Success; Springer: Berlin/Heidelberg, Germany, 2000; pp. 77–103. [Google Scholar]
- Elzen, G.W.; King, E.G. Periodic release and manipulation of natural enemies. In Handbook of Biological Control; Elsevier: Amsterdam, The Netherlands, 1999; pp. 253–270. [Google Scholar]
- Van Lenteren, J.C. The state of commercial augmentative biological control: Plenty of natural enemies, but a frustrating lack of uptake. BioControl 2012, 57, 1–20. [Google Scholar] [CrossRef]
- Collier, T.; Van Steenwyk, R. A critical evaluation of augmentative biological control. Biol. Control. 2004, 31, 245–256. [Google Scholar] [CrossRef]
- Brewer, M.J.; Nelson, D.J.; Ahern, R.G.; Donahue, J.D.; Prokrym, D.R. Recovery and range expansion of parasitoids (Hymenoptera: Aphelinidae and Braconidae) released for biological control of Diuraphis noxia (Homoptera: Aphididae) in Wyoming. Environ. Entomol. 2001, 30, 578–588. [Google Scholar] [CrossRef]
- Louda, S.M.; Kendall, D.; Connor, J.; Simberloff, D. Ecological effects of an insect introduced for the biological control of weeds. Science 1997, 277, 1088–1090. [Google Scholar] [CrossRef]
- Louda, S.M.; Pemberton, R.; Johnson, M.; Follett, P. Nontarget effects—The Achilles’ heel of biological control? Retrospective analyses to reduce risk associated with biocontrol introductions. Annu. Rev. Entomol. 2003, 48, 365–396. [Google Scholar] [CrossRef]
- Simberloff, D.; Stiling, P. How risky is biological control? Ecology 1996, 77, 1965–1974. [Google Scholar] [CrossRef]
- Wright, S. Isolation by distance. Genetics 1943, 28, 114. [Google Scholar]
- Rousset, F. Genetic differentiation and estimation of gene flow from F-statistics under isolation by distance. Genetics 1997, 145, 1219–1228. [Google Scholar]
- Aguillon, S.M.; Fitzpatrick, J.W.; Bowman, R.; Schoech, S.J.; Clark, A.G.; Coop, G.; Chen, N. Deconstructing isolation-by-distance: The genomic consequences of limited dispersal. PLoS Genet. 2017, 13, e1006911. [Google Scholar] [CrossRef] [PubMed]
- Williamson, M.H.; Fitter, A. The characters of successful invaders. Biol. Conserv. 1996, 78, 163–170. [Google Scholar] [CrossRef]
- Maruyama, T.; Fuerst, P.A. Population bottlenecks and nonequilibrium models in population genetics. II. Number of alleles in a small population that was formed by a recent bottleneck. Genetics 1985, 111, 675–689. [Google Scholar] [PubMed]
- Cornuet, J.M.; Luikart, G. Description and power analysis of two tests for detecting recent population bottlenecks from allele frequency data. Genetics 1996, 144, 2001–2014. [Google Scholar]
- Pritchard, J.K.; Stephens, M.; Donnelly, P. Inference of population structure using multilocus genotype data. Genetics 2000, 155, 945–959. [Google Scholar]
- Wu, B.; Liu, N.; Zhao, H. PSMIX: An R package for population structure inference via maximum likelihood method. BMC Bioinform. 2006, 7, 317. [Google Scholar]
- Alexander, D.H.; Novembre, J.; Lange, K. Fast model-based estimation of ancestry in unrelated individuals. Genome Res. 2009, 19, 1655–1664. [Google Scholar] [CrossRef] [PubMed]
- Tang, H.; Peng, J.; Wang, P.; Risch, N.J. Estimation of individual admixture: Analytical and study design considerations. Genet. Epidemiol. Off. Publ. Int. Genet. Epidemiol. Soc. 2005, 28, 289–301. [Google Scholar] [CrossRef]
- Price, A.L.; Patterson, N.J.; Plenge, R.M.; Weinblatt, M.E.; Shadick, N.A.; Reich, D. Principal components analysis corrects for stratification in genome-wide association studies. Nat. Genet. 2006, 38, 904–909. [Google Scholar] [CrossRef]
- Hey, J.; Nielsen, R. Multilocus methods for estimating population sizes, migration rates and divergence time, with applications to the divergence of Drosophila pseudoobscura and D. persimilis. Genetics 2004, 167, 747–760. [Google Scholar] [CrossRef] [PubMed]
- Hey, J.; Nielsen, R. Integration within the Felsenstein equation for improved Markov chain Monte Carlo methods in population genetics. Proc. Natl. Acad. Sci. USA 2007, 104, 2785–2790. [Google Scholar] [CrossRef]
- Hey, J. Isolation with migration models for more than two populations. Mol. Biol. Evol. 2010, 27, 905–920. [Google Scholar] [CrossRef]
- Sethuraman, A.; Hey, J. IM a2p–parallel MCMC and inference of ancient demography under the Isolation with migration (IM) model. Mol. Ecol. Resour. 2016, 16, 206–215. [Google Scholar] [CrossRef]
- Beerli, P.; Felsenstein, J. Maximum likelihood estimation of a migration matrix and effective population sizes in n subpopulations by using a coalescent approach. Proc. Natl. Acad. Sci. USA 2001, 98, 4563–4568. [Google Scholar] [CrossRef]
- Beerli, P.; Felsenstein, J. Maximum-likelihood estimation of migration rates and effective population numbers in two populations using a coalescent approach. Genetics 1999, 152, 763–773. [Google Scholar]
- Beerli, P. MIGRATE-N: Estimation of population sizes and gene flow using the coalescent. 2008. Available online: popgen.sc.fsu.edu/Migrate/Download.html (accessed on 1 June 2020).
- Wilson, G.A.; Rannala, B. Bayesian inference of recent migration rates using multilocus genotypes. Genetics 2003, 163, 1177–1191. [Google Scholar] [PubMed]
- Nielsen, R.; Wakeley, J. Distinguishing migration from isolation: A Markov chain Monte Carlo approach. Genetics 2001, 158, 885–896. [Google Scholar] [PubMed]
- Kuhner, M.K. LAMARC 2.0: Maximum likelihood and Bayesian estimation of population parameters. Bioinformatics 2006, 22, 768–770. [Google Scholar] [CrossRef] [PubMed]
- Cornuet, J.-M.; Ravigné, V.; Estoup, A. Inference on population history and model checking using DNA sequence and microsatellite data with the software DIYABC (v1. 0). BMC Bioinform. 2010, 11, 401. [Google Scholar] [CrossRef]
- Beaumont, M.A. Estimation of population growth or decline in genetically monitored populations. Genetics 2003, 164, 1139–1160. [Google Scholar]
- Chen, C.; Forbes, F.; François, O. fastruct: Model-based clustering made faster. Mol. Ecol. Notes 2006, 6, 980–983. [Google Scholar] [CrossRef]
- Corander, J.; Marttinen, P. Bayesian identification of admixture events using multilocus molecular markers. Mol. Ecol. 2006, 15, 2833–2843. [Google Scholar] [CrossRef]
- Patterson, N.; Moorjani, P.; Luo, Y.; Mallick, S.; Rohland, N.; Zhan, Y.; Genschoreck, T.; Webster, T.; Reich, D. Ancient admixture in human history. Genetics 2012, 192, 1065–1093. [Google Scholar] [CrossRef]
- Pickrell, J.; Pritchard, J. Inference of population splits and mixtures from genome-wide allele frequency data. Nat. Preced. 2012, 8. [Google Scholar] [CrossRef]
- Kuhner, M.K.; Yamato, J.; Felsenstein, J. Maximum likelihood estimation of population growth rates based on the coalescent. Genetics 1998, 149, 429–434. [Google Scholar]
- Raj, A.; Stephens, M.; Pritchard, J.K. fastSTRUCTURE: Variational inference of population structure in large SNP data sets. Genetics 2014, 197, 573–589. [Google Scholar] [CrossRef] [PubMed]
- Gronau, I.; Hubisz, M.J.; Gulko, B.; Danko, C.G.; Siepel, A. Bayesian inference of ancient human demography from individual genome sequences. Nat. Genet. 2011, 43, 1031. [Google Scholar] [CrossRef] [PubMed]
- Li, H.; Durbin, R. Fast and accurate long-read alignment with Burrows–Wheeler transform. Bioinformatics 2010, 26, 589–595. [Google Scholar] [CrossRef]
- Excoffier, L.; Dupanloup, I.; Huerta-Sánchez, E.; Sousa, V.C.; Foll, M. Robust demographic inference from genomic and SNP data. PLoS Genet. 2013, 9, e1003905. [Google Scholar] [CrossRef] [PubMed]
- Gutenkunst, R.; Hernandez, R.; Williamson, S.; Bustamante, C. Diffusion approximations for demographic inference: DaDi. Nat. Preced. 2010. [Google Scholar] [CrossRef]
- Excoffier, C.L.D.W.L. Bayesian computation and model selection in population genetics. arXiv 2009, arXiv:0901.2231. [Google Scholar]
- Huelsenbeck, J.P.; Andolfatto, P.; Huelsenbeck, E.T. Structurama: Bayesian inference of population structure. Evol. Bioinform. 2011, 7, EBO-S6761. [Google Scholar] [CrossRef]
- Sheehan, S.; Harris, K.; Song, Y.S. Estimating variable effective population sizes from multiple genomes: A sequentially Markov conditional sampling distribution approach. Genetics 2013, 194, 647–662. [Google Scholar] [CrossRef]
- Pavlidis, P.; Živković, D.; Stamatakis, A.; Alachiotis, N. SweeD: Likelihood-based detection of selective sweeps in thousands of genomes. Mol. Biol. Evol. 2013, 30, 2224–2234. [Google Scholar] [CrossRef]
- DeGiorgio, M.; Huber, C.D.; Hubisz, M.J.; Hellmann, I.; Nielsen, R. SweepFinder2: Increased sensitivity, robustness and flexibility. Bioinformatics 2016, 32, 1895–1897. [Google Scholar] [CrossRef]
- Wang, J.; Whitlock, M.C. Estimating effective population size and migration rates from genetic samples over space and time. Genetics 2003, 163, 429–446. [Google Scholar]
- Do, C.; Waples, R.S.; Peel, D.; Macbeth, G.; Tillett, B.J.; Ovenden, J.R. NeEstimator v2: Re-implementation of software for the estimation of contemporary effective population size (Ne) from genetic data. Mol. Ecol. Resour. 2014, 14, 209–214. [Google Scholar] [CrossRef]
- Fauvergue, X.; Vercken, E.; Malausa, T.; Hufbauer, R.A. The biology of small, introduced populations, with special reference to biological control. Evol. Appl. 2012, 5, 424–443. [Google Scholar] [CrossRef]
- Franks, S.J.; Pratt, P.D.; Tsutsui, N.D. The genetic consequences of a demographic bottleneck in an introduced biological control insect. Conserv. Genet. 2011, 12, 201–211. [Google Scholar] [CrossRef]
- Estoup, A.; Wilson, I.J.; Sullivan, C.; Cornuet, J.-M.; Moritz, C. Inferring population history from microsatellite and enzyme data in serially introduced cane toads, Bufo marinus. Genetics 2001, 159, 1671–1687. [Google Scholar]
- Fowler, S.V.; Peterson, P.; Barrett, D.P.; Forgie, S.; Gleeson, D.M.; Harman, H.; Houliston, G.J.; Smith, L. Investigating the poor performance of heather beetle, Lochmaea suturalis (Thompson) (Coleoptera: Chrysomelidae), as a weed biocontrol agent in New Zealand: Has genetic bottlenecking resulted in small body size and poor winter survival? Biol. Control. 2015, 87, 32–38. [Google Scholar] [CrossRef]
- Roy, H.; Wajnberg, E. From biological control to invasion: The ladybird Harmonia axyridis as a model species. BioControl 2008, 53, 1–4. [Google Scholar] [CrossRef]
- Davidson, A.M.; Jennions, M.; Nicotra, A.B. Do invasive species show higher phenotypic plasticity than native species and, if so, is it adaptive? A meta-analysis. Ecol. Lett. 2011, 14, 419–431. [Google Scholar] [CrossRef]
- Fischer, M.J.; Havill, N.P.; Brewster, C.C.; Davis, G.A.; Salom, S.M.; Kok, L.T. Field assessment of hybridization between Laricobius nigrinus and L. rubidus, predators of Adelgidae. Biol. Control. 2015, 82, 1–6. [Google Scholar] [CrossRef]
- Tayeh, A.; Hufbauer, R.A.; Estoup, A.; Ravigné, V.; Frachon, L.; Facon, B. Biological invasion and biological control select for different life histories. Nat. Commun. 2015, 6, 1–5. [Google Scholar] [CrossRef]
- Nielsen, R. Molecular signatures of natural selection. Annu. Rev. Genet. 2005, 39, 197–218. [Google Scholar] [CrossRef] [PubMed]
- Phillips, P.C.; Arnold, S.J. Visualizing multivariate selection. Evolution 1989, 43, 1209–1222. [Google Scholar] [CrossRef] [PubMed]
- Phillips, C.; Baird, D.; Iline, I.; McNeill, M.; Proffitt, J.; Goldson, S.; Kean, J. East meets west: Adaptive evolution of an insect introduced for biological control. J. Appl. Ecol. 2008, 45, 948–956. [Google Scholar] [CrossRef]
- Dlugosch, K.M.; Parker, I.M. Founding events in species invasions: Genetic variation, adaptive evolution, and the role of multiple introductions. Mol. Ecol. 2008, 17, 431–449. [Google Scholar] [CrossRef]
- Kolbe, J.J.; Glor, R.E.; Schettino, L.R.; Lara, A.C.; Larson, A.; Losos, J.B. Genetic variation increases during biological invasion by a Cuban lizard. Nature 2004, 431, 177–181. [Google Scholar] [CrossRef]
- Turner, K.G.; Hufbauer, R.A.; Rieseberg, L.H. Rapid evolution of an invasive weed. New Phytol. 2014, 202, 309–321. [Google Scholar] [CrossRef]
- Goldson, S.; Wratten, S.; Ferguson, C.; Gerard, P.; Barratt, B.; Hardwick, S.; McNeill, M.; Phillips, C.; Popay, A.; Tylianakis, J.; et al. If and when successful classical biological control fails. Biol. Control. 2014, 72, 76–79. [Google Scholar] [CrossRef]
- Biondi, A.; Desneux, N.; Siscaro, G.; Zappalà, L. Using organic-certified rather than synthetic pesticides may not be safer for biological control agents: Selectivity and side effects of 14 pesticides on the predator Orius laevigatus. Chemosphere 2012, 87, 803–812. [Google Scholar] [CrossRef]
- Heimpel, G.E.; Asplen, M.K. A ‘Goldilocks’ hypothesis for dispersal of biological control agents. BioControl 2011, 56, 441–450. [Google Scholar] [CrossRef]
- Welch, J.J.; Jiggins, C.D. Standing and flowing: The complex origins of adaptive variation. Mol. Ecol. 2014, 23, 3935–3937. [Google Scholar] [CrossRef]
- Cruickshank, T.E.; Hahn, M.W. Reanalysis suggests that genomic islands of speciation are due to reduced diversity, not reduced gene flow. Mol. Ecol. 2014, 23, 3133–3157. [Google Scholar] [CrossRef] [PubMed]
- Hufbauer, R.A.; Szucs, M.; Kasyon, E.; Youngberg, C.; Koontz, M.J.; Richards, C.; Tuff, T.; Melbourne, B.A. Three types of rescue can avert extinction in a changing environment. Proc. Natl. Acad. Sci. USA 2015, 112, 10557–10562. [Google Scholar] [CrossRef] [PubMed]
- Hufbauer, R.; Rutschmann, A.; Serrate, B.; Vermeil de Conchard, H.; Facon, B. Role of propagule pressure in colonization success: Disentangling the relative importance of demographic, genetic and habitat effects. J. Evol. Biol. 2013, 26, 1691–1699. [Google Scholar] [CrossRef]
- Facon, B.; Hufbauer, R.A.; Tayeh, A.; Loiseau, A.; Lombaert, E.; Vitalis, R.; Guillemaud, T.; Lundgren, J.G.; Estoup, A. Inbreeding depression is purged in the invasive insect Harmonia axyridis. Curr. Biol. 2011, 21, 424–427. [Google Scholar] [CrossRef] [PubMed]
- Obrycki, J.J.; Krafsur, E.S.; Bogran, C.E.; Gomez, L.E.; Cave, R.E. Comparative studies of three populations of the lady beetle predator Hippodamia convergens (Coleoptera: Coccinellidae). Fla. Entomol. 2001, 84, 55–62. [Google Scholar] [CrossRef]
- Sethuraman, A.; Janzen, F.J.; Obrycki, J. Population genetics of the predatory lady beetle Hippodamia convergens. Biol. Control. 2015, 84, 1–10. [Google Scholar] [CrossRef]
- Turgeon, J.; Tayeh, A.; Facon, B.; Lombaert, E.; De Clercq, P.; Berkvens, N.; Lundgren, J.; Estoup, A. Experimental evidence for the phenotypic impact of admixture between wild and biocontrol Asian ladybird (Harmonia axyridis) involved in the European invasion. J. Evol. Biol. 2011, 24, 1044–1052. [Google Scholar] [CrossRef]
- Szucs, M.; Schaffner, U.; Price, W.J.; Schwarzländer, M. Post-introduction evolution in the biological control agent Longitarsus jacobaeae (Coleoptera: Chrysomelidae). Evol. Appl. 2012, 5, 858–868. [Google Scholar] [CrossRef]
- Havill, N.P.; Davis, G.; Mausel, D.L.; Klein, J.; McDonald, R.; Jones, C.; Fischer, M.; Salom, S.; Caccone, A. Hybridization between a native and introduced predator of Adelgidae: An unintended result of classical biological control. Biol. Control. 2012, 63, 359–369. [Google Scholar] [CrossRef]
- Hedrick, P.W. Adaptive introgression in animals: Examples and comparison to new mutation and standing variation as sources of adaptive variation. Mol. Ecol. 2013, 22, 4606–4618. [Google Scholar] [CrossRef]
- Arnold, M.L.; Martin, N.H. Adaptation by introgression. J. Biol. 2009, 8, 82. [Google Scholar] [CrossRef] [PubMed]
- Lenormand, T. Gene flow and the limits to natural selection. Trends Ecol. Evol. 2002, 17, 183–189. [Google Scholar] [CrossRef]
- Rhymer, J.M.; Simberloff, D. Extinction by hybridization and introgression. Annu. Rev. Ecol. Syst. 1996, 27, 83–109. [Google Scholar] [CrossRef]
- Blackburn, T.M.; Lockwood, J.L.; Cassey, P. The influence of numbers on invasion success. Mol. Ecol. 2015, 24, 1942–1953. [Google Scholar] [CrossRef] [PubMed]
- Grenier, C.; Summerhays, B.; Cartmill, R.; Martinez, T.; Saisho, R.; Rothenberg, A.; Scott, J.; Obrycki, J.; Sethuraman, A. Lack of phenotypic variation in larval utilization of pea aphids in populations of the ladybeetle Hippodamia convergens. bioRxiv 2019, 740506. [Google Scholar] [CrossRef]
- Stiling, P.; Cornelissen, T. What makes a successful biocontrol agent? A meta-analysis of biological control agent performance. Biol. Control 2005, 34, 236–246. [Google Scholar] [CrossRef]
- Gilbert, K.J.; Whitlock, M.C. Evaluating methods for estimating local effective population size with and without migration. Evolution 2015, 69, 2154–2166. [Google Scholar] [CrossRef]
- Tribolium Genome Sequencing Consortium. The genome of the model beetle and pest Tribolium castaneum. Nature 2008, 452, 949–955. [Google Scholar] [CrossRef]
- Keeling, C.I.; Yuen, M.M.; Liao, N.Y.; Docking, T.R.; Chan, S.K.; Taylor, G.A.; Palmquist, D.L.; Jackman, S.D.; Nguyen, A.; Li, M.; et al. Draft genome of the mountain pine beetle, Dendroctonus ponderosae Hopkins, a major forest pest. Genome Biol. 2013, 14, R27. [Google Scholar] [CrossRef]
- Qi, X.; Zhang, L.; Han, Y.; Ren, X.; Huang, J.; Chen, H. De novo transcriptome sequencing and analysis of Coccinella septempunctata L. in non-diapause, diapause and diapause-terminated states to identify diapause-associated genes. BMC Genom. 2015, 16, 1086. [Google Scholar] [CrossRef]
- Kim, M.J.; Wan, X.; Kim, I. Complete mitochondrial genome of the seven-spotted lady beetle, Coccinella septempunctata (Coleoptera: Coccinellidae). Mitochondrial DNA 2012, 23, 179–181. [Google Scholar] [CrossRef] [PubMed]
- Sork, V.; Aitken, S.; Dyer, R.; Eckert, A.; Legendre, P.; Neale, D. Putting the landscape into the genomics of trees: Approaches for understanding local adaptation and population responses to changing climate. Tree Genet. Genomes 2013, 9, 901–911. [Google Scholar] [CrossRef]
- Joost, S.; Vuilleumier, S.; Jensen, J.D.; Schoville, S.; Leempoel, K.; Stucki, S.; Widmer, I.; Melodelima, C.; Rolland, J.; Manel, S. Uncovering the genetic basis of adaptive change: On the intersection of landscape genomics and theoretical population genetics. Mol. Ecol. 2013, 22, 3659–3665. [Google Scholar] [CrossRef] [PubMed]
- Schwartz, M.K.; McKelvey, K.S.; Cushman, S.A.; Luikart, G. Landscape genomics: A brief perspective. In Spatial Complexity, Informatics, and Wildlife Conservation; Springer: Berlin/Heidelberg, Germany, 2010; pp. 165–174. [Google Scholar]
- Gurr, G.; Wratten, S. Biological control: Measures of Success; Springer: Berlin/Heidelberg, Germany, 2000. [Google Scholar]
- Wajnberg, E. Measuring genetic variation in natural enemies used for biological control: Why and how. Genet. Evol. Biol. Control 2004, 19–37. [Google Scholar] [CrossRef]
- Roderick, G. Tracing the origin of pests and natural enemies: Genetic and statistical approaches. Genet. Evol. Biol. Control 2004, 97–112. [Google Scholar] [CrossRef]
- Nielsen, R.; Beaumont, M.A. Statistical inferences in phylogeography. Mol. Ecol. 2009, 18, 1034–1047. [Google Scholar] [CrossRef]
- Felsenstein, J. Accuracy of coalescent likelihood estimates: Do we need more sites, more sequences, or more loci? Mol. Biol. Evol. 2006, 23, 691–700. [Google Scholar] [CrossRef]
- Li, H.; Qu, W.; Obrycki, J.J.; Meng, L.; Zhou, X.; Chu, D.; Li, B. Optimizing Sample Size for Population Genomic Study in a Global Invasive Lady Beetle, Harmonia axyridis. Insects 2020, 11, 290. [Google Scholar] [CrossRef]
- Thomas, G.W.; Dohmen, E.; Hughes, D.S.; Murali, S.C.; Poelchau, M.; Glastad, K.; Anstead, C.A.; Ayoub, N.A.; Batterham, P.; Bellair, M.; et al. Gene content evolution in the arthropods. Genome Biol. 2020, 21, 1–14. [Google Scholar] [CrossRef]
- Davey, J.W.; Hohenlohe, P.A.; Etter, P.D.; Boone, J.Q.; Catchen, J.M.; Blaxter, M.L. Genome-wide genetic marker discovery and genotyping using next-generation sequencing. Nat. Rev. Genet. 2011, 12, 499–510. [Google Scholar] [CrossRef]
- Andrews, K.R.; Good, J.M.; Miller, M.R.; Luikart, G.; Hohenlohe, P.A. Harnessing the power of RADseq for ecological and evolutionary genomics. Nat. Rev. Genet. 2016, 17, 81. [Google Scholar] [CrossRef] [PubMed]
- Schlötterer, C.; Tobler, R.; Kofler, R.; Nolte, V. Sequencing pools of individuals—Mining genome-wide polymorphism data without big funding. Nat. Rev. Genet. 2014, 15, 749–763. [Google Scholar] [CrossRef] [PubMed]
- Sethuraman, A.; Janzen, F.J.; Rubio, M.A.; Vasquez, Y.; Obrycki, J.J. Demographic histories of three predatory lady beetles reveal complex patterns of diversity and population size change in the United States. Insect Sci. 2018, 25, 1065–1079. [Google Scholar] [CrossRef] [PubMed]
- McKenna, A.; Hanna, M.; Banks, E.; Sivachenko, A.; Cibulskis, K.; Kernytsky, A.; Garimella, K.; Altshuler, D.; Gabriel, S.; Daly, M.; et al. The Genome Analysis Toolkit: A MapReduce framework for analyzing next-generation DNA sequencing data. Genome Res. 2010, 20, 1297–1303. [Google Scholar] [CrossRef]
- Danecek, P.; Auton, A.; Abecasis, G.; Albers, C.A.; Banks, E.; DePristo, M.A.; Handsaker, R.E.; Lunter, G.; Marth, G.T.; Sherry, S.T.; et al. The variant call format and VCFtools. Bioinformatics 2011, 27, 2156–2158. [Google Scholar] [CrossRef]
- Li, H.; Handsaker, B.; Wysoker, A.; Fennell, T.; Ruan, J.; Homer, N.; Marth, G.; Abecasis, G.; Durbin, R. The sequence alignment/map format and SAMtools. Bioinformatics 2009, 25, 2078–2079. [Google Scholar] [CrossRef]
- Barnett, D.W.; Garrison, E.K.; Quinlan, A.R.; Strömberg, M.P.; Marth, G.T. BamTools: A C++ API and toolkit for analyzing and managing BAM files. Bioinformatics 2011, 27, 1691–1692. [Google Scholar] [CrossRef]
- Catchen, J.M.; Amores, A.; Hohenlohe, P.; Cresko, W.; Postlethwait, J.H. Stacks: Building and genotyping loci de novo from short-read sequences. G3 GenesGenomesGenet. 2011, 1, 171–182. [Google Scholar] [CrossRef]
- Goecks, J.; Nekrutenko, A.; Taylor, J.; Galaxy Team. Galaxy: A comprehensive approach for supporting accessible, reproducible, and transparent computational research in the life sciences. Genome Biol. 2010, 11, R86. [Google Scholar] [CrossRef]
- Blankenberg, D.; Kuster, G.V.; Coraor, N.; Ananda, G.; Lazarus, R.; Mangan, M.; Nekrutenko, A.; Taylor, J. Galaxy: A web-based genome analysis tool for experimentalists. Curr. Protoc. Mol. Biol. 2010, 89, 10–19. [Google Scholar] [CrossRef]
- Pfeifer, B.; Wittelsbürger, U.; Ramos-Onsins, S.E.; Lercher, M.J. PopGenome: An efficient Swiss army knife for population genomic analyses in R. Mol. Biol. Evol. 2014, 31, 1929–1936. [Google Scholar] [CrossRef] [PubMed]
- Jombart, T. adegenet: A R package for the multivariate analysis of genetic markers. Bioinformatics 2008, 24, 1403–1405. [Google Scholar] [CrossRef] [PubMed]
- Paradis, E. pegas: An R package for population genetics with an integrated–modular approach. Bioinformatics 2010, 26, 419–420. [Google Scholar] [CrossRef] [PubMed]
- Schraiber, J.G.; Akey, J.M. Methods and models for unravelling human evolutionary history. Nat. Rev. Genet. 2015, 16, 727–740. [Google Scholar] [CrossRef]
- Wright, S. The genetical structure of populations. Ann. Eugen. 1949, 15, 323–354. [Google Scholar] [CrossRef]
- Nei, M.; Chesser, R.K. Estimation of fixation indices and gene diversities. Ann. Hum. Genet. 1983, 47, 253–259. [Google Scholar] [CrossRef]
- Weir, B.S.; Cockerham, C.C. Estimating F-statistics for the analysis of population structure. Evolution 1984, 38, 1358–1370. [Google Scholar]
- Durand, E.Y.; Patterson, N.; Reich, D.; Slatkin, M. Testing for ancient admixture between closely related populations. Mol. Biol. Evol. 2011, 28, 2239–2252. [Google Scholar] [CrossRef]
- Johnson, J.B.; Omland, K.S. Model selection in ecology and evolution. Trends Ecol. Evol. 2004, 19, 101–108. [Google Scholar] [CrossRef]
- Lindenbaum, P. Jvarkit: Java utilities for bioinformatics. 2015. Available online: https://figshare.com/articles/JVarkit_java_based_utilities_for_Bioinformatics/1425030 (accessed on 1 June 2020).
- Page, A.J.; Taylor, B.; Delaney, A.J.; Soares, J.; Seemann, T.; Keane, J.A.; Harris, S.R. SNP-sites: Rapid efficient extraction of SNPs from multi-FASTA alignments. Microb. Genom. 2016, 2, e000056. [Google Scholar] [CrossRef]
- Gentleman, R.C.; Carey, V.J.; Bates, D.M.; Bolstad, B.; Dettling, M.; Dudoit, S.; Ellis, B.; Gautier, L.; Ge, Y.; Gentry, J.; et al. Bioconductor: Open software development for computational biology and bioinformatics. Genome Biol. 2004, 5, R80. [Google Scholar] [CrossRef]
- Tamura, K.; Stecher, G.; Peterson, D.; Filipski, A.; Kumar, S. MEGA6: Molecular evolutionary genetics analysis version 6.0. Mol. Biol. Evol. 2013, 30, 2725–2729. [Google Scholar] [CrossRef] [PubMed]
- Rousset, F. Inbreeding and relatedness coefficients: What do they measure? Heredity 2002, 88, 371–380. [Google Scholar] [CrossRef] [PubMed]
- Excoffier, L.; Lischer, H.E. Arlequin suite ver 3.5: A new series of programs to perform population genetics analyses under Linux and Windows. Mol. Ecol. Resour. 2010, 10, 564–567. [Google Scholar] [CrossRef] [PubMed]
- Librado, P.; Rozas, J. DnaSP v5: A software for comprehensive analysis of DNA polymorphism data. Bioinformatics 2009, 25, 1451–1452. [Google Scholar] [CrossRef] [PubMed]
- Quinlan, A.R. BEDTools: The Swiss-army tool for genome feature analysis. Curr. Protoc. Bioinform. 2014, 47, 11–12. [Google Scholar] [CrossRef]
- Whitten, M.; Hoy, M.A. Genetic improvement and other genetic considerations for improving the efficacy and success rate of biological control. In Handbook of Biological Control; Elsevier: Amsterdam, The Netherlands, 1999; pp. 271–296. [Google Scholar]
- Mackauer, M. Genetic problems in the production of biological control agents. Annu. Rev. Entomol. 1976, 21, 369–385. [Google Scholar] [CrossRef]
- Messenger, P.; Wilson, F.; Whitten, M. Variation, fitness, and adaptability of natural enemies. In Theory and Practice of Biological Control; Elsevier: Amsterdam, The Netherlands, 1976; pp. 209–231. [Google Scholar]
- Hopper, K.; Roush, R.T.; Powell, W. Management of genetics of biological-control introductions. Annu. Rev. Entomol. 1993, 38, 27–51. [Google Scholar] [CrossRef]
- Unruh, T.; Woolley, J. Molecular Methods in Classical Biological Control. In Handbook of Biological Control; Elsevier: Amsterdam, The Netherlands, 1999; pp. 57–85. [Google Scholar]
- Roderick, G.K.; Navajas, M. Genes in new environments: Genetics and evolution in biological control. Nat. Rev. Genet. 2003, 4, 889–899. [Google Scholar] [CrossRef]
- Roderick, G.; Navajas, M. The primacy of evolution in biological control. In Proceedings of the XII International Symposium on Biological Control of Weeds, La Grande Motte, France, 22–27 April 2007; pp. 22–27. [Google Scholar]
- Roderick, G.K.; Hufbauer, R.; Navajas, M. Evolution and biological control. Evol. Appl. 2012, 5, 419. [Google Scholar] [CrossRef]


| Software | Statistical Method | Citation | Purpose | Availability |
|---|---|---|---|---|
| STRUCTURE | Bayesian MCMC | Pritchard et al., 2000 [41] | Estimating admixture proportions, ancestral subpopulation allele frequencies. | OS, Binaries |
| PSMIX | ML | Wu et al., 2006 [42] | Estimating admixture proportions, ancestral subpopulation allele frequencies. | OS, R package |
| ADMIXTURE | ML | Alexander et al., 2009 [43] | Estimating admixture proportions, ancestral subpopulation allele frequencies. | Binary only |
| FRAPPE | ML | Tang et al., 2005 [44] | Estimating admixture proportions, ancestral subpopulation allele frequencies. | Binary only |
| EIGENSTRAT | PCA | Price et al., 2006 [45] | Estimating population stratification | OS, Binaries |
| IM | Bayesian MCMC | Hey and Nielsen 2004 [46] | Estimating ancestral demography under an Isolation with migration model | OS, Binaries |
| IMa2 | Bayesian MCMC | Hey and Nielsen 2007 [47], Hey 2010 [48] | Estimating ancestral demography under an Isolation with migration model | OS, Binaries |
| IMa2p | Bayesian MCMC | Sethuraman and Hey 2016 [49] | Estimating ancestral demography under an Isolation with migration model | OS |
| MIGRATE | Bayesian MCMC | Beerli and Felsenstein 2001 [50], 1999 [51], Beerli 2008 [52] | Estimating ancestral demography under an island model | OS, Binaries |
| BayesAss | Bayesian MCMC | Wilson and Rannala 2003 [53] | Estimating recent migration under a divergence model | OS, Binaries |
| MDIV | Bayesian MCMC | Nielsen and Wakeley 2001 [54] | Estimating ancestral demography under an Isolation with migration model | OS, Binaries |
| LAMARC | Bayesian MCMC | Kuhner 2006 [55] | Estimating ancestral demography under an island model | OS, Binaries |
| DIYABC | ABC | Cornuet et al., 2010 [56] | Testing complex population histories and estimate parameters | OS, Binaries |
| MSVAR | Bayesian MCMC | Beaumont 2003 [57] | Estimating population size change under a panmictic model | OS |
| FASTRUCT | ML | Chen et al., 2006 [58] | Estimating admixture proportions, ancestral subpopulation allele frequencies. | Binary only |
| BAPS | Bayesian MCMC | Corander et al., 2006 [59] | Estimating admixture proportions, ancestral subpopulation allele frequencies. | Binaries only |
| ADMIXTOOLS | Summary Statistics | Patterson et al., 2012 [60] | Tests of admixture occurrence | OS |
| TREEMIX | ML | Pickrell and Pritchard 2012 [61] | Inferring divergence and mixtures from genomic data | OS |
| FLUCTUATE | Bayesian MCMC | Kuhner, Yamato and Felsenstein 1998 [62] | Inferring population size change from genetic data | OS |
| BOTTLENECK | Bayesian MCMC | Cornuet and Luikart 1996 [40] | Inferring population size bottlenecks from genetic data | Binary only |
| FASTRUCTURE | Bayesian MCMC | Raj et al., 2014 [63] | Inferring population structure from SNP data | OS |
| GPHOCS | Bayesian MCMC | Gronau et al., 2012 [64] | Inferring demography from individual genome sequences | OS |
| PSMC | HMM | Li and Durbin 2010 [65] | Inferring population size history from diploid genomes | OS |
| FASTSIMCOAL2 | Bayesian MCMC, ML | Excoffier et al., 2013 [66] | Inferring ancestral demography from SNP data | Binary only |
| DADI | ML | Gutenkunst et al., 2010 [67] | Inferring ancestral demography from SNP data, testing complex population histories | OS |
| ABCreg | ABC | Excoffier et al., 2009 [68] | Testing complex population histories and estimate parameters | OS |
| STRUCTURAMA | Bayesian MCMC | Huelsenbeck and Andolfato 2011 [69] | Estimating admixture proportions, ancestral subpopulation allele frequencies. | OS |
| DICAL | HMM | Sheehan et al., 2013 [70] | Inferring demography from individual genome sequences | OS |
| SWEED | ML, LLR | Pavlidis et al., 2013 [71] | Inferring selective sweeps | OS |
| SWEEPFINDER2 | ML, LLR | DeGiorgio et al., 2016 [72] | Inferring selective sweeps | OS |
| MLNE | ML | Wang and Whitlock 2003 [73] | Inferring contemporary effective population size | OS |
| LDNE | Summary Statistics | Do et al., 2014 [74] | Inferring contemporary effective population size | Binary only |
| Category | Ecological Parameters | Evolutionary Parameters | Genomic Method | Evolutionary Perspective |
|---|---|---|---|---|
| Agent efficacy, establishment | Mortality/survivorship, abundance before/after release | Effective population size | Contemporary Ne—Colony2, ONeSamp, Estim, etc.—see Gilbert and Whitlock 2015 [109], Ancestral and current Ne—IM, IMa2, IMa2p, MIGRATE, LAMARC, PSMC | Ne measures the size of the natural enemy population evolving neutrally by genetic drift. It differs from census sizes, in that it offers a perspective on genetic diversity and hence adaptability of the population, response to new environments and resilience to failed introductions. Ancestral Ne versus current Ne thus determines increase or decrease in genomic diversity. |
| Diversity, polymorphism, heterozygosity, homozygosity, differentiation, inbreeding coefficients | Genepop, Arlequin, ADEGENET, DNASP, MEGA | Broadly lumped together as genomic diversity indices, all these indices are indicators of the ’genetic health’ of the introduced population. Successful control programs would thus expect sustainable natural enemy populations to have higher genetic diversity, polymorphism, differentiation with respect to other populations and thus lower homozygosity and inbreeding. | ||
| Spatio-temporal distribution | Spatial, temporal scale assessment of abundance, distribution | Divergence times, time since population size change, phylogeography | TreeMix, IM, IMa2, IMa2p, BEAST, DIYABC, MrBayes, Bottleneck, MSVAR, FLUCTUATE, LAMARC, GeoPhyloBuilder, etc. | Divergence time estimates provide evidence of time since introduction of natural enemies. Similarly, time since population size change can be used to estimate times of bottlenecks or invasiveness. Phylogeography studies also allow overlaying the current phylogenetic tree over geographical data. |
| Agent management techniques | Agent manipulation by strain selection | Selection, demography | Fst-GWAS, SweepFinder, SweeD, McDonald-Kreitman tests | Estimating genome-wide selection across strains allows prediction of genotype-phenotype interactions and efficacy of selection in adaptive evolution of the natural enemy population to be introduced. |
| Non-target effects, invasiveness | Other species, other than target/pests | Selection, demography | Ancestral and current demography, genomic diversity, differentiation and inbreeding coefficients can be used as a proxy for competition or predation of non-target species or populations. | |
| QTL mapping | Understanding underlying traits of adaptive evolution and invasiveness. | |||
| Biotic effects on target/agents | Inter-, intra-guild predation, competition | Admixture, migration, inbreeding | Admixture—STRUCTURE, Admixture, MULTICLUST, BAPS, TREEMIX Migration—MIGRATE, LAMARC, IMa2, IMa2p, IM, GPhoCS, DIYABC | Admixture (and migration) between stock and native populations is a measure of degree of hybrid compatibility and increase in genomic diversity due to gene flow. Similarly, lack thereof is a measure of predation/competition and genome-level incompatibilities. Successful biological control populations would thus be expected to have higher levels of admixture and bidirectional migration with local populations (especially in augmentative bio-control). |
| Software | Citation | Type of Data | Purpose |
|---|---|---|---|
| VCFTOOLS | Danecek et al., 2011 [129] | Genomic, SNP | Variant calling, summary statistics, data filtering, file manipulation |
| SAMTOOLS | Li et al., 2009 [130] | Genomic, multiple sequence alignment | Data filtering, cleanup, multiple sequence alignment, file manipulation |
| BAMTOOLS | Barnett et al., 2011 [131] | Genomic, multiple sequence alignment | Data filtering, cleanup, multiple sequence alignment, file manipulation |
| GATK | McKenna et al., 2010 [128] | Genomic, SNP | Variant calling, summary statistics, data filtering |
| GALAXY PROJECT | Blankenberg et al., 2010 [134] | All | Suite of pipelines for numerous bioinformatics analyses of genomic data |
| JVARKIT | Lindenbaum 2015 [144] | Genomic, SNP | Suite of tools for data filtering, file manipulation, cleanup |
| SNP-SITES | Page et al., 2016 [145] | Genomic, SNP | Variant calling |
| BIOCONDUCTOR | Gentleman et al., 2004 [146] | All | Suite of pipelines for numerous bioinformatics analyses of genomic data |
| ADEGENET/PEGAS | Jombart 2008 [136], Paradis 2010 [137] | Genomic, SNP | Suite of tools for data filtering, file manipulation, cleanup |
| POPGENOME | Pfeifer et al., 2014 [135] | Genomic, multiple sequence alignment | Suite of tools for data filtering, file manipulation, cleanup |
| STACKS | Catchen et al., 2011 [132] | RAD, SNP | Variant calling, summary statistics, data filtering, file manipulation |
| MEGA6 | Tamura et al., 2013 [147] | Multiple sequence alignment, microsatellite, SNP | Summary statistics |
| GENEPOP | Rousset 2002 [148] | Multiple sequence alignment, microsatellite, SNP | Summary statistics |
| ARLEQUIN | Excoffier et al., 2010 [149] | Multiple sequence alignment, microsatellite, SNP | Summary statistics |
| DNASP | Librado and Rozas 2009 [150] | Multiple sequence alignment, microsatellite, SNP | Summary statistics |
| BEDTOOLS | Quinlan 2014 [151] | Genomic, SNP | Data filtering, cleanup, multiple sequence alignment, file manipulation |
© 2020 by the authors. Licensee MDPI, Basel, Switzerland. This article is an open access article distributed under the terms and conditions of the Creative Commons Attribution (CC BY) license (http://creativecommons.org/licenses/by/4.0/).
Share and Cite
Sethuraman, A.; Janzen, F.J.; Weisrock, D.W.; Obrycki, J.J. Insights from Population Genomics to Enhance and Sustain Biological Control of Insect Pests. Insects 2020, 11, 462. https://doi.org/10.3390/insects11080462
Sethuraman A, Janzen FJ, Weisrock DW, Obrycki JJ. Insights from Population Genomics to Enhance and Sustain Biological Control of Insect Pests. Insects. 2020; 11(8):462. https://doi.org/10.3390/insects11080462
Chicago/Turabian StyleSethuraman, Arun, Fredric J. Janzen, David W. Weisrock, and John J. Obrycki. 2020. "Insights from Population Genomics to Enhance and Sustain Biological Control of Insect Pests" Insects 11, no. 8: 462. https://doi.org/10.3390/insects11080462
APA StyleSethuraman, A., Janzen, F. J., Weisrock, D. W., & Obrycki, J. J. (2020). Insights from Population Genomics to Enhance and Sustain Biological Control of Insect Pests. Insects, 11(8), 462. https://doi.org/10.3390/insects11080462