

Novel Link Between Myeloid-Specific Adenosine Deaminase 2 and CXCL10-CXCR3 Axis in Infectious ARDS

 , , and
Abstract
:1. Introduction
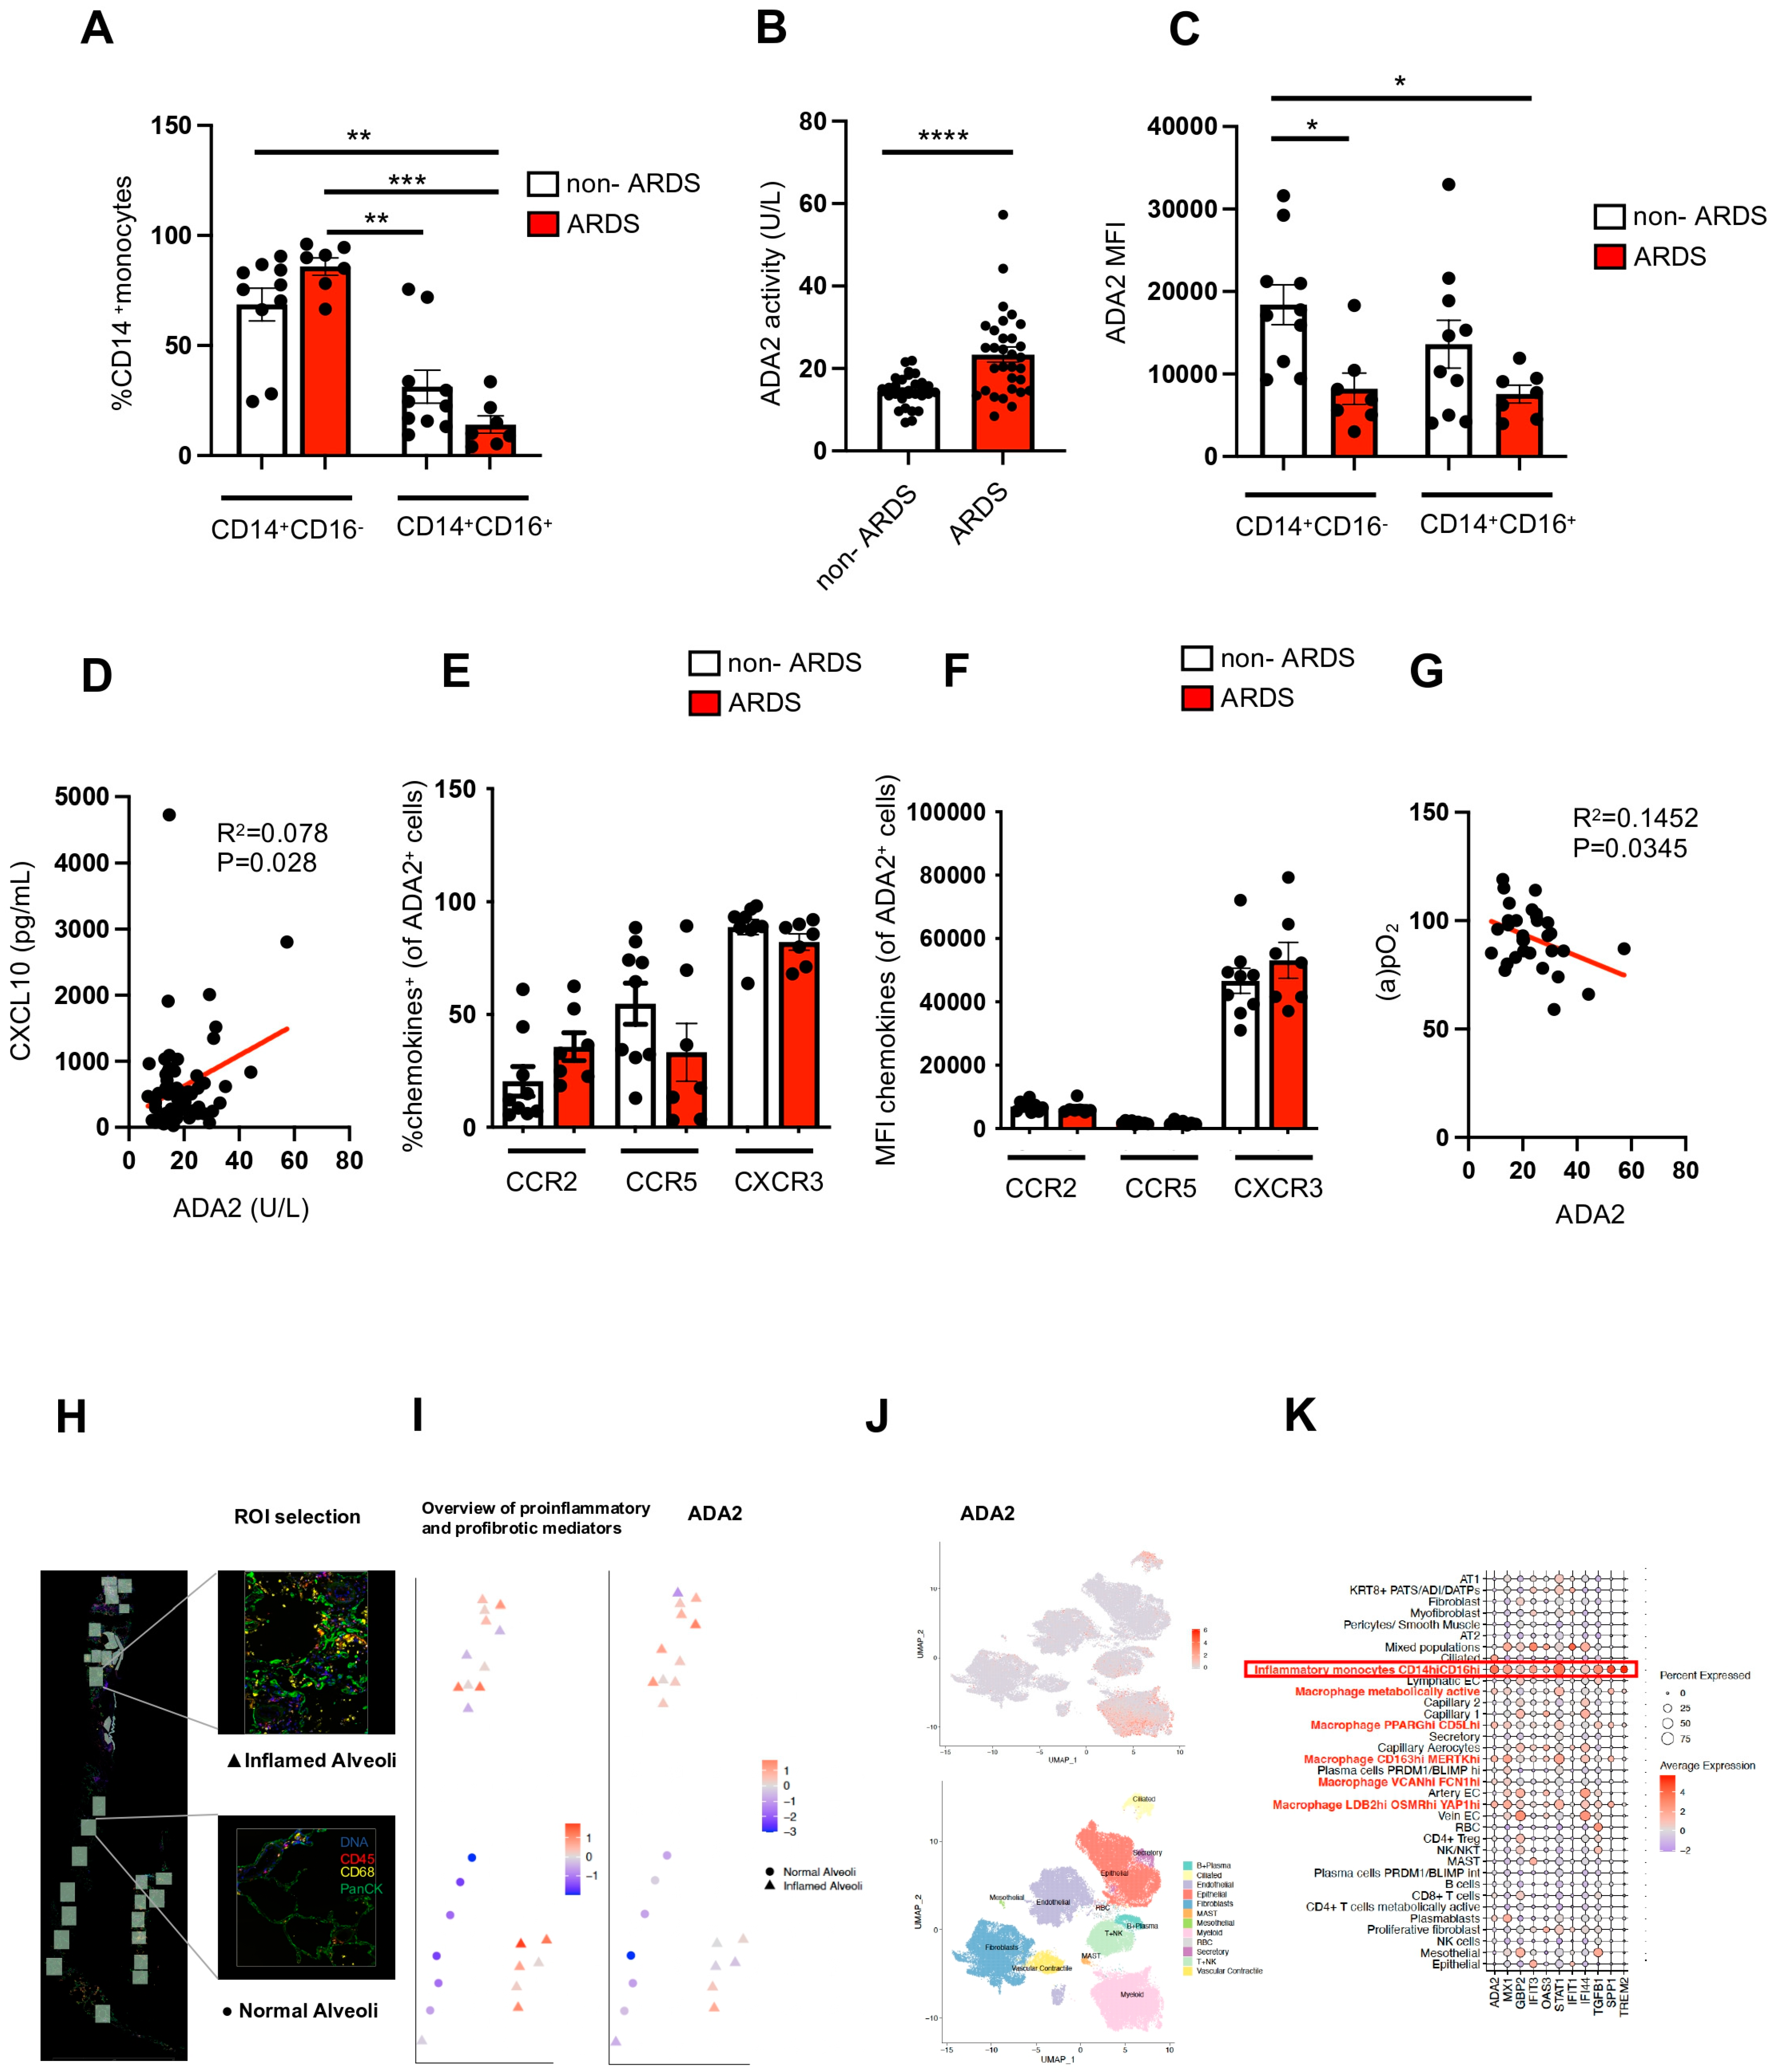
2. Results
3. Discussion
4. Materials and Methods
4.1. Patient Cohort
4.2. ADA2 Serum Activity, CXCL10 Serum Level, and Flow Cytometry
4.3. Single Cell RNAseq and Digital Spatial Transcriptomics
4.4. Statistical Analysis
Author Contributions
Funding
Institutional Review Board Statement
Informed Consent Statement
Data Availability Statement
Acknowledgments
Conflicts of Interest
References
- Wendisch, D.; Dietrich, O.; Mari, T.; von Stillfried, S.; Ibarra, I.L.; Mittermaier, M.; Mache, C.; Chua, R.L.; Knoll, R.; Timm, S.; et al. SARS-CoV-2 infection triggers profibrotic macrophage responses and lung fibrosis. Cell 2021, 184, 6243–6261.e27. [Google Scholar] [CrossRef] [PubMed]
- Merad, M.; Martin, J.C. Pathological inflammation in patients with COVID-19: A key role for monocytes and macrophages. Nat. Rev. Immunol. 2020, 20, 355–362. [Google Scholar] [CrossRef] [PubMed]
- Tiwari-Heckler, S.; Yee, E.U.; Yalcin, Y.; Park, J.; Nguyen, D.H.T.; Gao, W.; Csizmadia, E.; Afdhal, N.; Mukamal, K.J.; Robson, S.C.; et al. Adenosine deaminase 2 produced by infiltrative monocytes promotes liver fibrosis in nonalcoholic fatty liver disease. Cell Rep. 2021, 37, 109897. [Google Scholar] [CrossRef] [PubMed]
- Eltzschig, H.K.; Sitkovsky, M.V.; Robson, S.C. Purinergic signaling during inflammation. N. Engl. J. Med. 2012, 367, 2322–2333. [Google Scholar] [CrossRef] [PubMed]
- Ranieri, V.M.; Rubenfeld, G.D.; Thompson, B.T.; Ferguson, N.D.; Caldwell, E.; Fan, E.; Camporota, L.; Slutsky, A.S. Acute Respiratory Distress Syndrome: The Berlin Definition. JAMA 2012, 307, 2526–2533. [Google Scholar] [PubMed]
- Delorey, T.M.; Ziegler, C.G.K.; Heimberg, G.; Normand, R.; Yang, Y.; Segerstolpe, Å.; Abbondanza, D.; Fleming, S.J.; Subramanian, A.; Montoro, D.T.; et al. COVID-19 tissue atlases reveal SARS-CoV-2 pathology and cellular targets. Nature 2021, 595, 107–113. [Google Scholar] [CrossRef] [PubMed]
- Lee, P.Y.; Aksentijevich, I.; Zhou, Q. Mechanisms of vascular inflammation in deficiency of adenosine deaminase 2 (DADA2). Semin. Immunopathol. 2022, 44, 269–280. [Google Scholar] [CrossRef] [PubMed]
- Eltzschig, H.K.; Faigle, M.; Knapp, S.; Karhausen, J.; Ibla, J.; Rosenberger, P.; Odegard, K.C.; Laussen, P.C.; Thompson, L.F.; Colgan, S.P. Endothelial catabolism of extracellular adenosine during hypoxia: The role of surface adenosine deaminase and CD26. Blood 2006, 108, 1602–1610. [Google Scholar] [CrossRef] [PubMed]
- Doğan, H.O.; Şenol, O.; Bolat, S.; Yıldız, Ş.N.; Büyüktuna, S.A.; Sarıismailoğlu, R.; Doğan, K.; Hasbek, M.; Hekim, S.N. Understanding the pathophysiological changes via untargeted metabolomics in COVID-19 patients. J. Med. Virol. 2021, 93, 2340–2349. [Google Scholar] [CrossRef] [PubMed]
- Schultz, I.C.; Bertoni, A.P.S.; Wink, M.R. Purinergic signaling elements are correlated with coagulation players in peripheral blood and leukocyte samples from COVID-19 patients. J. Mol. Med. 2022, 100, 569–584. [Google Scholar] [CrossRef] [PubMed]
- Ichikawa, A.; Kuba, K.; Morita, M.; Chida, S.; Tezuka, H.; Hara, H.; Sasaki, T.; Ohteki, T.; Ranieri, V.M.; Dos Santos, C.C.; et al. CXCL10-CXCR3 Enhances the Development of Neutrophil-mediated Fulminant Lung Injury of Viral and Nonviral Origin. Am. J. Respir. Crit. Care Med. 2013, 187, 65–77. [Google Scholar] [CrossRef] [PubMed]
- Pita-Juarez, Y.; Karagkouni, D.; Kalavros, N.; Melms, J.C.; Niezen, S.; Delorey, T.M.; Essene, A.L.; Brook, O.R.; Pant, D.; Skelton-Badlani, D.; et al. A single-nucleus and spatial transcriptomic atlas of the COVID-19 liver reveals topological, functional, and regenerative organ disruption in patients. Genome Biol. 2025, 26, 56. [Google Scholar] [CrossRef] [PubMed]

| Characteristics | |||
|---|---|---|---|
| ARDS (N = 34) | non-ARDS (N = 33) | p-value | |
| Age (years, mean ± SD) | 68 ± 12 | 59 ± 16 | NS |
| Female gender (n, %) | 9 (26%) | 9 (27%) | NS |
| Oxygen therapy | |||
| Total | 34 (100%) | 23 (70%) | *** p < 0.001 |
| Mechanical ventilation (n, %) | 34 (100%) | 0 (0%) | |
| Low-flow oxygen therapy (n, %) | 0 (0%) | 23 (70%) | |
| Horowitz Quotient (mmHg, mean ± SD) | 178 ± 44 | >300 | |
| PaO2 (mmHg, mean ± SD) | 91 ± 14 | ||
| FiO2 (mean ± SD) | 0.54 ± 0.14 | ||
| Main Comorbidities (n,%) | |||
| Cardiovascular Disease | 25 (74%) | 12 (9%) | ** p < 0.01 |
| Hypertension | 22 (65%) | 11 (33%) | * p < 0.05 |
| Diabetes | 11 (24%) | 2 (6%) | ** p < 0.01 |
| Pulmonary Disease | 2 (6%) | 1 (3%) | NS |
| Malignancy | 7 (21%) | 1 (3%) | * p < 0.05 |
| Outcome (n) | |||
| Death | 14 | 0 | **** p < 0.0001 |
| Recovery | 20 | 33 |
Disclaimer/Publisher’s Note: The statements, opinions and data contained in all publications are solely those of the individual author(s) and contributor(s) and not of MDPI and/or the editor(s). MDPI and/or the editor(s) disclaim responsibility for any injury to people or property resulting from any ideas, methods, instructions or products referred to in the content. |
© 2025 by the authors. Licensee MDPI, Basel, Switzerland. This article is an open access article distributed under the terms and conditions of the Creative Commons Attribution (CC BY) license (https://creativecommons.org/licenses/by/4.0/).
Share and Cite
Tiwari-Heckler, S.; Pita-Juarez, Y.; Vierbaum, L.; Michl, P.; Vlachos, I.S.; Merle, U.; Jiang, Z.G. Novel Link Between Myeloid-Specific Adenosine Deaminase 2 and CXCL10-CXCR3 Axis in Infectious ARDS. Int. J. Mol. Sci. 2025, 26, 3678. https://doi.org/10.3390/ijms26083678
Tiwari-Heckler S, Pita-Juarez Y, Vierbaum L, Michl P, Vlachos IS, Merle U, Jiang ZG. Novel Link Between Myeloid-Specific Adenosine Deaminase 2 and CXCL10-CXCR3 Axis in Infectious ARDS. International Journal of Molecular Sciences. 2025; 26(8):3678. https://doi.org/10.3390/ijms26083678
Chicago/Turabian StyleTiwari-Heckler, Shilpa, Yered Pita-Juarez, Lisa Vierbaum, Patrick Michl, Ioannis S. Vlachos, Uta Merle, and Z Gordon Jiang. 2025. "Novel Link Between Myeloid-Specific Adenosine Deaminase 2 and CXCL10-CXCR3 Axis in Infectious ARDS" International Journal of Molecular Sciences 26, no. 8: 3678. https://doi.org/10.3390/ijms26083678
APA StyleTiwari-Heckler, S., Pita-Juarez, Y., Vierbaum, L., Michl, P., Vlachos, I. S., Merle, U., & Jiang, Z. G. (2025). Novel Link Between Myeloid-Specific Adenosine Deaminase 2 and CXCL10-CXCR3 Axis in Infectious ARDS. International Journal of Molecular Sciences, 26(8), 3678. https://doi.org/10.3390/ijms26083678