Review

Characterization of Carbonic Anhydrase In Vivo Using Magnetic Resonance Spectroscopy

Molecular Imaging Branch, National Institute of Mental Health, NIH, Bethesda, MD 20892, USA
*
Author to whom correspondence should be addressed.
Int. J. Mol. Sci. 2020, 21(7), 2442; https://doi.org/10.3390/ijms21072442
Submission received: 10 February 2020 / Revised: 29 March 2020 / Accepted: 30 March 2020 / Published: 1 April 2020
(This article belongs to the Special Issue Carbonic Anhydrase and Biomarker Research 2020)

Abstract

:
Carbonic anhydrase is a ubiquitous metalloenzyme that catalyzes the reversible interconversion of CO2/HCO3. Equilibrium of these species is maintained by the action of carbonic anhydrase. Recent advances in magnetic resonance spectroscopy have allowed, for the first time, in vivo characterization of carbonic anhydrase in the human brain. In this article, we review the theories and techniques of in vivo 13C magnetization (saturation) transfer magnetic resonance spectroscopy as they are applied to measuring the rate of exchange between CO2 and HCO3 catalyzed by carbonic anhydrase. Inhibitors of carbonic anhydrase have a wide range of therapeutic applications. Role of carbonic anhydrases and their inhibitors in many diseases are also reviewed to illustrate future applications of in vivo carbonic anhydrase assessment by magnetic resonance spectroscopy.

Graphical Abstract

1. Introduction

Carbonic anhydrase (CA, also known as carbonate dehydratase or carbonic dehydratase) is a family of enzymes that are present in many different isoforms or carbonic anhydrase-related proteins. CO2 is a toxic by-product of cellular respiration, so it needs to be removed from the body. CA catalyzes the interconversion between carbon dioxide and bicarbonate anion, a reaction that occurs very slowly in the absence of CA:
carbon dioxide + H2O ↔ H+ + bicarbonate
The catalytic action by CA permits near equilibrium between CO2 and bicarbonate [1]. The change catalyzed by CA is an interconversion between the nonpolar gaseous carbon dioxide and the conjugate base of carbonic acid, the bicarbonate ion. The exchange between CO2 and bicarbonate is almost instantaneous in the presence of CA. In mammals, carbon dioxide gas generated by cellular metabolism leaves the body by the action of red blood cells which rapidly convert it to bicarbonate ion via CA catalysis for transport. Then the bicarbonate ions are converted back to carbon dioxide to be exhaled. CA is a metalloenzyme that exists ubiquitously in seven families: α, β, γ, δ, ζ, θ, and η [2]. These families differ in their preference for metal ions used for performing catalysis.
In mammals sixteen different isoforms of α-CA (CA I, II, III, IV, VA, VB, VI, VII, IX, XII, XIII, XIV CA XV and CARP VIII, CARP X, and CARP XI) have been identified. These isoforms differ in catalytic activity, their subcellular localization, tissue distribution and sensitivity toward inhibitors. CA I, II, III, VII, XIII exist in cytoplasm; CA VA, VB in the mitochondria, CA IV, IX, XII, XIV, XV in plasma membrane and CA VI is secreted with saliva [3]. CARPs [4] expression is identified in central nervous system (CNS) but their physiological role in CNS is not well established [5]. CARPs lack classical CA activity due to absence of the histidine residue required for catalysis. CARP VIII is associated with motor coordination. Mutation in CARP VIII gene has been associated with ataxia, mental retardation and quadrupedal gait, motor dysfunction, and altered calcium dynamics [6].
Expression levels of CA have been considered as biomarkers in many clinical studies. Several CAs (CA II, IX, XII, and CARPs VIII and XI) are linked with cancer progression and response to cancer chemotherapy [7,8,9,10,11,12]. For example, expression of CA isoform IX is strongly upregulated in several types of tumors including ependymomas, mesotheliomas, follicular carcinomas [13,14,15,16,17,18,19,20] and brain tumors [21,22]. Abnormalities in CA III have been found to be associated with acute myocardial infarction, post infarction treatment efficacy and perioperative myocardial complications [23,24]. CA II, III, IV, and VII are expressed in nervous tissue [25,26]. Isoform CAV II is linked to cellular ion homeostasis and susceptibility to epileptogenesis [27].
Overall, CA activity regulates pH and CO2 homeostasis, electrolyte secretion and transport, many biosynthetic reactions (e.g., gluconeogenesis, lipogenesis, and ureagenesis), bone resorption, calcification, and tumorigenicity [28]. In the brain there is a general lack of significant CA activities in neurons. Because neurons are metabolically highly active, neuronal CA would hinder the rapid removal of the freely diffusible carbon dioxide through cell membranes [29,30]. The compartmentation of CA in the brain leads to the hydration of carbon dioxide to bicarbonate predominantly in glial cells. As a result, glial cells act as sinks of carbon dioxide [31]. It has been hypothesized that glial hydration of carbon dioxide and transfer of energy with high neuronal activity are coupled to uptake of glutamate by glia [32]. In the brain, CA has also been found to modulate GABAergic excitation, long-term synaptic transformation, attentional gating of memory storage, and cerebrospinal fluid formation [33,34,35].
Historically, assessing carbonic anhydrase activities required biopsied tissues and in vitro techniques, making it impossible to study brain CA function and dysfunction in vivo. In contrast to in vitro techniques, magnetic resonance spectroscopy (MRS) allows non-invasive detection of specific biologically relevant molecules in vivo [36]. It has become a very useful and versatile tool for both clinical and basic science studies because it can measure concentrations of many important endogenous and exogenous molecules [37]. Our laboratory discovered the phenomenon of in vivo enzyme-specific 13C magnetization transfer [38,39,40,41,42,43] and developed in vivo 13C magnetization transfer MRS techniques for measuring carbonic anhydrase-catalyzed interconversion between carbon dioxide and bicarbonate [40]. We first quantified the in vivo rate of bicarbonate dehydration in the rodent brain and the effect of acetazolamide administration on the catalytic action of CA [40]. Recently we have succeeded in measuring brain CA in healthy human subjects [43].
In this article we review in vivo MRS theories and techniques for detecting carbonic anhydrase activities. The implications of CA in neurological and psychiatric disorders and clinically applicable carbonic anhydrase inhibitors (such as acetazolamide) will be discussed in the context of future clinical applications of in vivo MRS characterization of carbonic anhydrase. These will include clinical application of CA inhibitors (CAIs) in brain disorders such as schizophrenia and bipolar disorder [44,45,46,47,48,49,50,51,52,53,54,55,56,57]. As abnormalities in CA are widespread and many drugs target or act on CA, noninvasive in vivo MRS techniques are poised to play an important role in characterizing and elucidating the function and dysfunction of carbonic anhydrase in many brain disorders as well as in monitoring treatment.

2. In Vivo Magnetic Resonance Spectroscopy (MRS) for Studying Carbonic Anhydrase

CA expression level is an important biomarker and its association with several diseases is well established [58]. Many CA isoforms are either upregulated or downregulated under pathological conditions. As CA function depends on microenvironments (tumor cell, nerve cell, blood cell, lungs cell), estimation of enzyme expression from excised tissue may not accurately reflect abnormalities of its catalytic functions. Therefore, techniques that can measure in vivo CA activities are highly desirable. In vivo MRS can measure the rate of enzyme-catalyzed reactions using magnetization (or saturation) transfer method. When kinetically relevant reporter molecules are spin labeled with repetitive saturation of their exchange partner molecules to gain enough SNR, the exchange rate can be quantified from signal change and longitudinal relaxation time (T1) of the reporter molecules. By introducing exogenous 13C-labeled substrates, certain metabolic pathways can be studied using in vivo 13C MRS [36,37]. In our laboratory, several methods including an inverse detection method have been developed to measure different enzymatic reactions and their rate constants in vivo using 13C MRS [38,39,40,41,42,43].
Magnetization transfer can be incorporated into 13C MRS and the rate of CA-catalyzed carbon dioxide–bicarbonate exchange reaction can be measured quantitatively. Literature studies have suggested that CA inhibitors (CAIs) exert therapeutic effects on various neurodegenerative and psychiatric disorders [20,59,60,61,62,63,64,65,66,67]. Effect of CAIs and CA activators on carbon dioxide–bicarbonate saturation transfer can be monitored using in vivo MRS because they alter the rate of carbon dioxide–bicarbonate interconversion.

2.1. Theory of 13C Magnetization Transfer Catalyzed by Carbonic Anhydrase

Magnetization transfer spectroscopy can measure fast enzymatic reactions [68,69,70]. The concentration of dissolved free carbon dioxide gas in brain tissue is approximately 1 mM at normal physiological conditions [71]. In contrast, bicarbonate concentration in the brain under normal physiological conditions is much higher (> 20 mM) [72] than CO2. Here we will provide a theoretical analysis of saturation transfer between carbon dioxide and bicarbonate catalyzed by CA using a two-site kinetic model that consists of a small CO2 pool and a large bicarbonate pool and quantitatively examine the effect of rapidly turning over CO2, which may require the use of relatively high radio frequency power for irradiation. The large difference between the CO2 and bicarbonate pool sizes also allows a quasi-steady state approximation of the dynamic longitudinal relaxation process of bicarbonate in the presence of its rapid exchange with the much smaller CO2 pool.
The rapid interconversion between the small carbon dioxide pool (A) resonating at 125.0 ppm and the large bicarbonate pool (B) resonating at 160.7 ppm (Figure 1) can be quantitatively described following the analysis of the α-ketoglutarate-glutamate exchange system [36]. The irradiating radio frequency pulse is applied along the x-axis in the radio frequency rotating frame centered at the resonant frequency of the CO2 13C spin at 125.0 ppm. The amplitude of this irradiating radio frequency pulse is designated as ω1. The magnitude of the x, y, z magnetizations of the 13C spin of CO2 (MxA, MyA, MzA) and those of bicarbonate (MxB, MyB, MzB) are governed by the Bloch-McConnell equations [73,74] for CA-catalyzed rapid interconversion between CO2 and bicarbonate:
d M x A d t = M x A T 2 A k A B M x A + k B A M x B
d M y A d t = ω 1 M z A M y A T 2 A k A B M y A + k B A M y B
d M z A d t = ω 1 M y A M z A M 0 A T 1 A k A B M z A + k B A M z B
d M x B d t = Δ ω M y B M x B T 2 B + k A B M x A k B A M x B
d M y B d t = Δ ω M x B + ω 1 M z B M y B T 2 B + k A B M y A k B A M y B
d M z B d t = ω 1 M y B M z B M 0 B T 1 B + k A B M z A k B A M z B
In the above equations, Δω denotes the chemical shift difference between the 13C spins of bicarbonate and CO2; T1B, T1A, T2B, and T2A are T1 and transverse relaxation times (T2); kBA and kAB are the pseudo-first-order rate constants of the unidirectional dehydration reaction bicarbonate → CO2, and hydration reaction CO2 → bicarbonate, respectively.
Because the concentration of CO2 is much smaller than that of bicarbonate the standard quasi- steady-state assumption [74] in kinetics analysis is applicable here:
d M x A d t d M y A d t d M z A d t 0
At equilibrium, we have
k B A M 0 B = k A B M 0 A
where M0A and M0B represent the thermal equilibrium magnetizations of the 13C spins of CO2 and bicarbonate, respectively.
When CO2 is saturated by a radio frequency pulse that does not act on the bicarbonate signal directly, we observe a change in the steady state magnetization of bicarbonate ΔMzB. The expression for kBA can be shown to be the same as that for glutamate → α-ketoglutarate reaction given in ref. [36] despite that the concentration of CO2 is orders of magnitude higher than the concentration of α-ketoglutarate:
k B A = ( 1 + p q ω 1 2 ) Δ M z B M 0 B T 1 B s a t
where Δ M z B M 0 B M z B s s , T 1 B s a t T 1 B ( 1 + k B A T 1 B ) , p 1 T 2 A + k A B k A B k B A T 2 B 1 + k B A T 2 B , and q 1 T 1 A + k A B k A B k B A T 1 B 1 + k B A T 1 B according to the expanded Bloch-McConnell equations (Equations (1)–(6)).
Significant errors in measuring kBA may occur when the longitudinal magnetization of the 13C spin of bicarbonate at 160.7 ppm is significantly perturbed by the irradiating field ω1 [75,76] placed at 125.0 ppm. Using M0A = 1 mM, M0B = 20 mM, kBA = 0.28 s−1 and T1B = 9.6 s [43], p and q can be estimated by assuming kBAT2B << 1 which can be justified based on the relatively narrow in vivo bicarbonate linewidth. Using Equation (8) we obtain kAB and therefore p ≈ 5.6 s−1 and q ≈ 1.5 s−1 and pq ≈ 8.4 s−2. For < 1% error in kBA originated from Equation (9) the theoretically minimum ω1 is calculated to be merely ~5 Hz. As a nominal ω1 of 50 Hz was used experimentally to saturation CO2 no significant error is expected from incomplete saturation of CO2.
Because ω1 is sufficiently large kBA as a function of ω1 ( p q ) and Δω can be derived from the full Bloch-McConnell Equations (1)–(6) for the bicarbonate steady-state magnetization. Again, this expression (Equation (10)) is found to assume the same form as that of the α-ketoglutarate ↔ glutamate exchange system [36] in spite of the large differences between the two exchange systems including the large difference in chemical shift separation between A and B:
k B A = Δ M z B M 0 B ( 1 T 1 B s a t + r ) r
where r ω 1 2 T 2 B s a t 1 + Δ ω 2 T 2 B s a t 2 , T 2 B s a t T 2 B 1 + k B A T 2 B . When ω 1 p q complete saturation of CO2 is achieved. When the separation between the resonance signals of CO2 and bicarbonate is sufficiently large, i.e., Δ ω ω 1 T 1 B s a t T 2 B s a t , r in Equation (10) becomes negligible. At 7 Tesla the chemical shift difference between bicarbonate and CO2 Δω is 3562 Hz. From Equation (10) and because Δ ω T 2 B s a t   >> 1, r ≈ 0.002–0.004 s−1 for ω1 = 50 Hz and T2B ≈ 0.05–0.1 s. Therefore, any error in kBA due to RF spill over is negligible, thanks to the large chemical shift dispersion at the high magnetic field strength of 7 Tesla. At lower field strength such as 1.5 Tesla, RF spill over can still be made negligible because of the very low ω1 threshold required for complete CO2 saturation. Therefore, with proper experimental design, both Equations (9) and (10) reduce to the well-known classical formula for saturation transfer [68,69,77]:
k B A = Δ M z B M 0 B T 1 B s a t
or
k B A = Δ M z B M z B s s T 1 B
From the above analysis, Equations (11) and (12) [68,69,77] are valid for extracting kBA of bicarbonate-CO2 exchange accurately from data acquired in a steady-state magnetization (saturation) transfer experiment under the conditions of p q ω 1 Δ ω T 1 B s a t T 2 B s a t . These conditions can be readily met using modern scanners because of the relatively large chemical shift separation between carbon dioxide (125.0 ppm) and bicarbonate (160.7 ppm). Equation (12) becomes Equation (1) in ref. [43] when the recycle delay is infinitely long. The above analysis therefore validated the simplified treatment used in ref. [43] for extracting kBA from our in vivo measurement.
Because of its small pool size, the magnetization of CO2 is approximately in instantaneous equilibrium with the large bicarbonate pool. Under conditions of complete radio frequency saturation of CO2 and no radio frequency perturbation of bicarbonate Equation (6) describes a longitudinal relaxation process for bicarbonate with a single time constant. When CO2 is not saturated, the dynamics of bicarbonate longitudinal relaxation is described by the analytical solutions to the classic Bloch-McConnell equations for two-site exchange [78]. The longitudinal relaxation behavior of bicarbonate with radio frequency saturation of CO2 is approximately the same as that in the absence of any exchange with CO2.

2.2. 13C Magnetization Transfer MRS

The 13C magnetization (saturation) transfer technique used to measure the bicarbonate dehydration rate constant in human brain [43] is summarized here. Although the original MRS method employed surface coil for spatial localization we emphasize that the more precise gradient-based localization techniques can also be used, thanks to the large in vivo magnetization transfer effects catalyzed by carbonic anhydrase.

2.2.1. Magnetic Resonance Hardware

A two-channel spectrometer is required for measuring carbonic anhydrase using in vivo 13C saturation transfer experiments. Our in vivo 13C MRS magnetization transfer experiments for measuring carbonic anhydrase in the human brain [43] were performed on a Siemens Magnetom 7 Tesla scanner (Siemens Healthcare, Erlangen, Germany). A home-made RF coil assembly consisted of a circular 13C coil with a diameter of 7 cm and a quadrature half-volume proton coil which were mounted on three half-cylindrical plastic tubes, respectively. No proton blocking L-C tank circuit was found to be necessary for the 13C coil. A slotted RF shield made of copper foil with equally spaced gaps was placed on the outer surface of the lower plastic tube. The space between adjacent gaps was approximately 5 cm with one 1000 pF capacitor used to bridge each gap. Each proton loop had a single-tuned 1H cable trap (RG-316). A 13C/1H dual-tuned cable trap was placed inside an RF-shielded box and connected to the 13C coil. At proton frequency (300 MHz), RF isolation between the two proton loops was −20 dB. The RF isolation between the 13C coil and the two proton loops were −40 dB. At 13C frequency (75 MHz), isolation between the 13C coil and the two proton coils was −38 dB. The home-made 13C/1H coil system was connected to the 7 Tesla scanner through a commercially available interface box provided by Quality ElectroDynamics (Mayfeld Village, OH, USA).

2.2.2. 13C Magnetization Transfer MRS Pulse Sequence

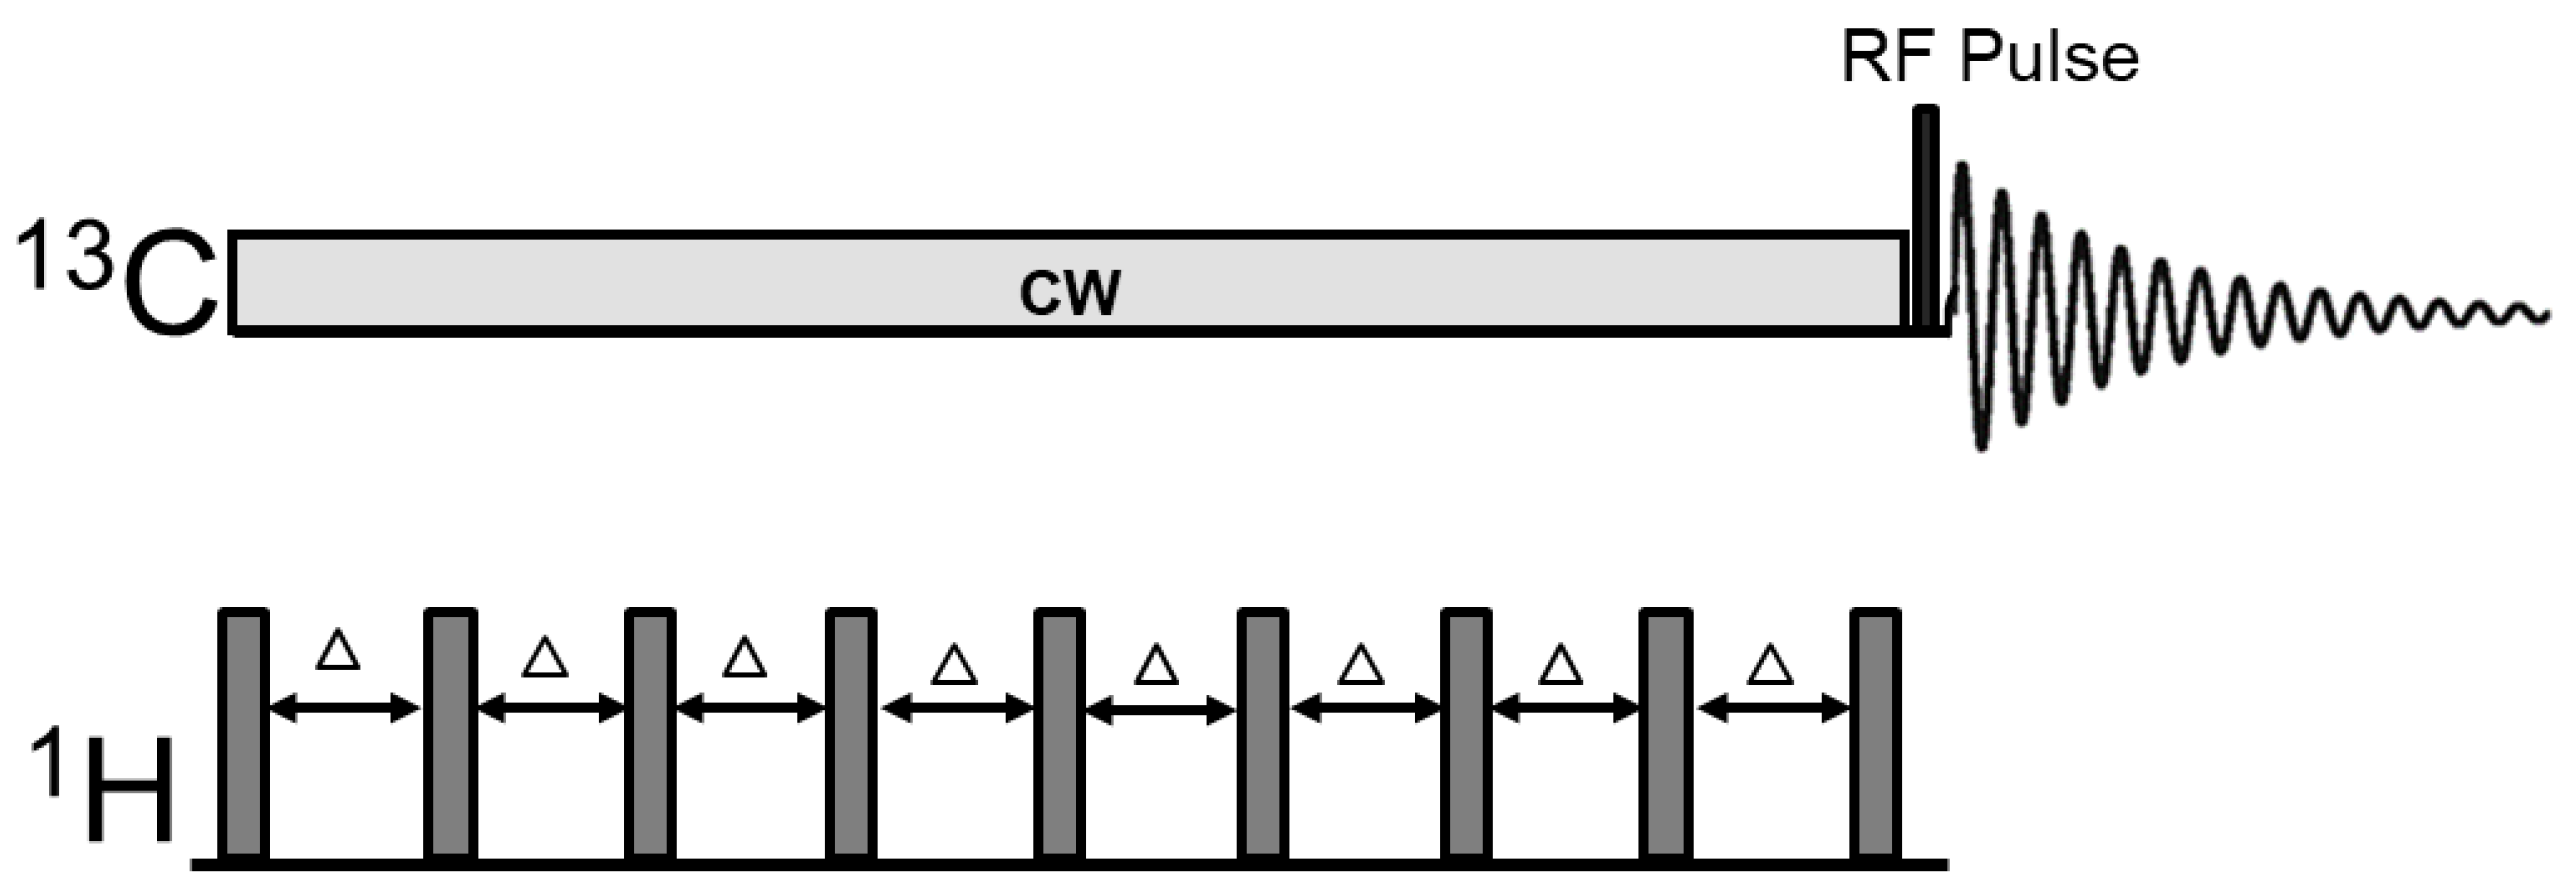
The RF pulse sequence for measuring carbonic anhydrase-catalyzed magnetization transfer is depicted in Figure 2. The 13C magnetization transfer effect catalyzed by carbonic anhydrase can be detected by spatial localization using either field gradient or surface coil with an interleaved acquisition scheme. Radio frequency saturation of CO2 was conducted by continuous wave (CW) or a train of evenly spaced spectrally selective shaped pulses for acquiring saturation transfer spectra using the 13C channel. To acquire the control spectra, the identical continuous wave saturating pulse or spectrally selective shaped pulses were placed at an equal spectral distance from the observed 13C spin of bicarbonate but on the opposite site of the CO2 resonance. The following interleaved acquisition scheme was used: {control irradiation–bicarbonate excitation–acquisition}–{carbon dioxide saturation–bicarbonate excitation–acquisition} to minimize the effect of changes in the signal intensity of 13C-labeled bicarbonate during MRS scan. For our 7 Tesla study [43], the excitation hard pulse (250 μs) was placed on-resonance (at 160.7 ppm, the resonance frequency of bicarbonate). A 50 ms composite pulse block was repeatedly applied from the end of data acquisition to the start of excitation by the 13C hard pulse. Each composite pulse block consists of a 1.0 ms proton hard pulse for generating broadband heteronuclear nuclear Overhauser enhancement and a 48.0 ms continuous wave 13C pulse (nominal γB1 = 50 Hz) for saturating carbon dioxide at 125.0 ppm or for irradiation at the control frequency. Proton decoupling was not conducted because the proton of bicarbonate is in very rapid exchange with tissue water and it is self-decoupled from 13C spins via its chemical exchange with water. Each pair of spectra for measuring saturation transfer signal difference consisted of 24 free induction decays (number of averages = 24 with 12 averages for each irradiated frequency). The following acquisition parameters were used: spectral width = 8 kHz, data points = 2048, acquisition time = 256 ms, and recycle delay = 30 s.
For absolute quantification of the bicarbonate dehydration rate constant, the longitudinal relaxation time of the observed 13C spin of bicarbonate was measured by a T 1 B s a t or T 1 B null experiment ( exp ( T 1 n u l l T 1 B s a t ) + exp ( T R T 1 n u l l T 1 B s a t ) = 2 ). TR is the repetition time. T1null is the time when the 13C spin of bicarbonate magnetization reaches zero. For TR >> T1B, exp ( T 1 n u l l T 1 B s a t ) = 2 . The T1null of bicarbonate ( T 1 B ) with optional saturation of CO2 ( T 1 B s a t ) was measured using a 30-ms hyperbolic secant inversion pulse for adiabatic inversion with a much longer recycle delay of 55 s followed by direct excitation and detection of free induction decay of 13C-labeled bicarbonate spins.

2.3. Isotope Labeling Strategies and 13C MRS of the Carboxylic/Amide Spectral Region

Natural abundance of 13C is only 1.1%, so exogenous 13C -labeled glucose was administered to human subjects to introduce 13C labels to CO2 and bicarbonate molecules. For in vivo determination of carbonic anhydrase-catalyzed interconversion between CO2 and bicarbonate uniformly 13C labeled glucose is an excellent choice as all six 13C labels on a glucose molecule are eventually passed to CO2 and bicarbonate via the pyruvate dehydrogenase reaction and the tricarboxylic acid cycle. Use of uniformly 13C labeled glucose leads to maximum 13C enrichment of CO2 and bicarbonate.
Since the 13C labeling kinetics of the tricarboxylic acid cycle is not of concern for measuring the carbonic anhydrase reaction, 13C labeled glucose can be conveniently administered orally. We administered a solution of 20% w/w 99% enriched [U-13C6] glucose at a dose of 0.75 g [U-13C6] glucose per kg of body weight before initiation of 13C MRS scans. All subjects underwent at least 12-h fasting before the MRS study. Following oral administration of glucose, 13C labels are rapidly incorporated into glutamate, glutamine, aspartate, and bicarbonate molecules. In the carboxylic/amide spectral region, a steady increase in the signal intensity of glutamate (C5 and C1), glutamine (C5 and C1), aspartate (C4 and C1), and bicarbonate were observed (see Figure 3 and Figure 4).
Variations in 13C signal intensity of bicarbonate may cause errors in measuring the saturation transfer effect which requires subtraction of two spectra acquired 30 s apart. As shown in Figure 3 and Figure 4, variation in 13C signal intensity of bicarbonate is much slower on a time scale measured by hours. Therefore, changes in the intensity of 13C-labeled bicarbonate is negligible over a period of 30 s, which is the recycle delay of our interleaved acquisition scheme shown in Figure 2. The slow 13C labeling kinetics of bicarbonate following oral intake of 13C-labeled glucose can be attributed to the damping effect exerted by the stomach and to the large size of label trapping pools such as cerebral glutamate. For measuring the in vivo activity of carbonic anhydrase, the absolute 13C fractional enrichment of bicarbonate is not of concern except that higher 13C fractional enrichment leads to higher SNR as Equations (11) and (12) narrates that only the relative change in the 13C-labeled bicarbonate signal is needed to calculate the bicarbonate dehydration rate constant. Therefore, from a technical point of view, the optimal time to measure carbonic anhydrase activity following administration of exogenous 13C labels is when the intensity of 13C-labeled bicarbonate reaches maximum. Furthermore, because only the relative change in 13C-labeled bicarbonate signal intensity upon saturating CO2 is used to calculate kBA so differences in individual subject’s response to glucose administration will not affect the accuracy of carbonic anhydrase activity measurement.
The signal of 13C-labeled carbon dioxide has not been observed in the human brain. This could be due to its small pool size (~1 mM), the off-resonance effect of the excitation pulse, the presumably very long T1 of the unprotonated CO2, and possible line-broadening of the electrically neutral CO2 molecule in vivo. In Figure 2, a 250 us block pulse was used to excite the bicarbonate signal. Because the signal of CO2 was observed in early in vitro studies of protein and membrane systems [79], significant CO2 line-broadening in vivo is highly unlikely. Because tissue pH and pCO2 were not measured, the total concentration of bicarbonate cannot be determined. Fortunately, because the pseudo first-order dehydration rate constant is derived from Equations (9)–(12), the absolute concentration of CO2 and bicarbonate have no effect on the absolute quantification of the bicarbonate dehydration reaction rate constant, if sufficient signal-to-noise ratio is achieved.

2.4. Characterization of Carbonic Anhydrase Reaction in the Human Brain

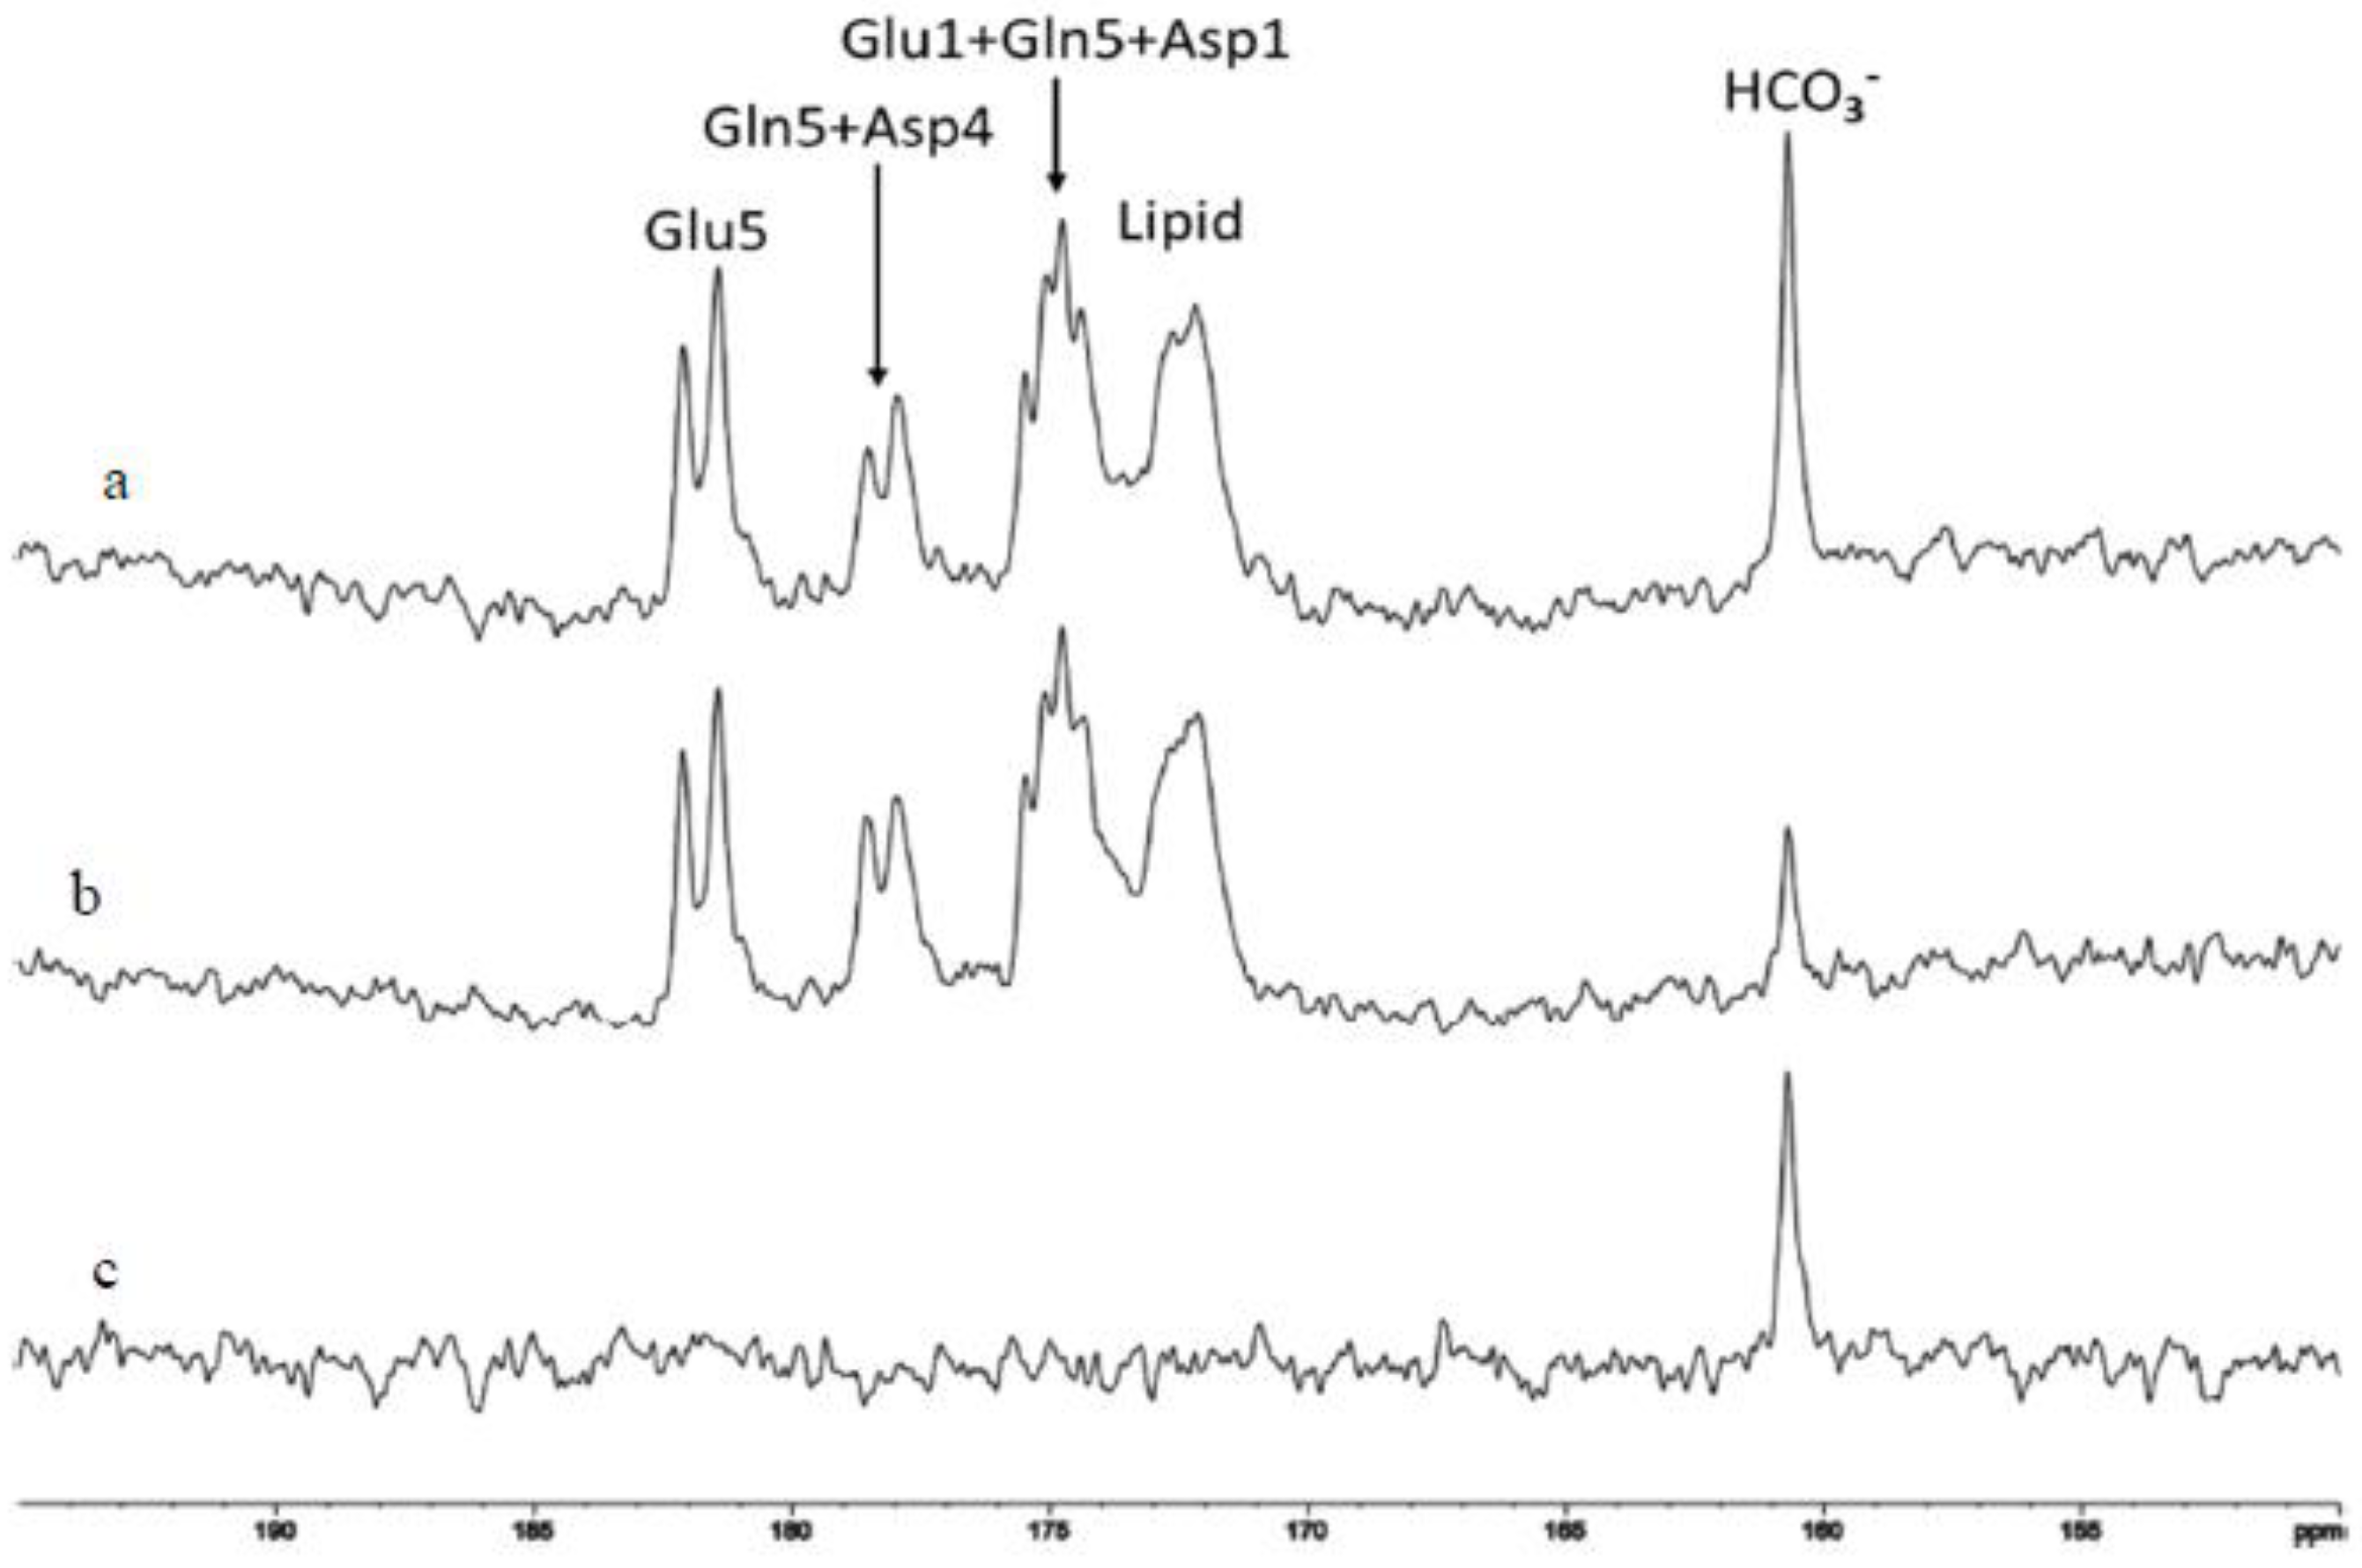
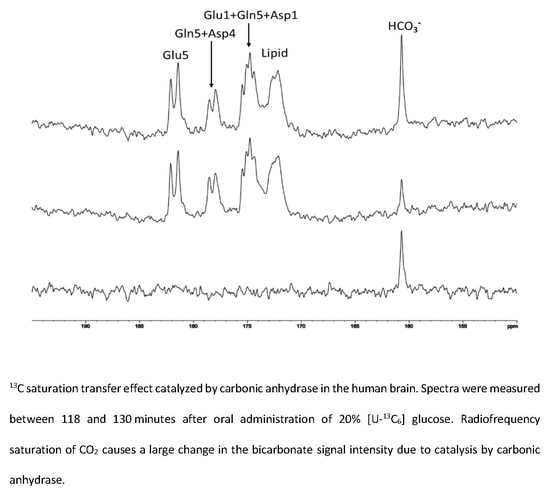
For the two-site exchange reaction depicted in Figure 1, RF saturation of CO2 is carried over to bicarbonate due to the interconversion between the two. Therefore, RF saturation of CO2 causes a reduction in the magnetization of bicarbonate. This reduction in the magnetization of bicarbonate perturbs its thermal equilibrium, triggering its longitudinal relaxation toward regaining its thermal equilibrium. These two opposing forces reach a steady state and result in an attenuated bicarbonate magnetization. Figure 5 shows the spectra of 13C saturation transfer results measured between 118 and 130 min after the oral administration of [U-13C6] glucose. The top spectrum (Figure 5a) is the control spectrum. Such control irradiation is unnecessary at high magnetic field as our previous studies had shown that there were no detectable nonspecific 13C off-resonance magnetization transfer effects [37,38] and Section 2.1 indicates that RF spillover effect is negligible at 7 Tesla. In Figure 5a the full signal intensity of 13C-labeled bicarbonate was recorded. The middle spectrum (Figure 5b) was acquired with RF saturation of carbon dioxide at 125.0 ppm. A large reduction in the bicarbonate signal intensity is seen due to carryover of saturation from the CO2 magnetization to bicarbonate. The bottom spectrum (Figure 5c) is the difference spectrum obtained by subtraction of Figure 5b from Figure 5a. A large reduction of the signal intensity of bicarbonate by 72% ± 0.03 (n = 3) due to carbon dioxide saturation transfer was measured for the first time in the human brain [43]. This represents the largest known saturation transfer effect among chemicals observable in vivo in human subjects. The bicarbonate dehydration rate constant (kBA) in the human brain was found to be 0.27 ± 0.03 sec−1 (n = 3).

3. Future Applications of in Vivo MRS of Carbonic Anhydrase Reaction

The non-invasive in vivo MRS technique for measuring the carbonic anhydrase reaction has the exciting potential to characterize carbonic anhydrase activities in many biomedical applications, especially in studying brain disorders where in most situations biopsy is not feasible. Here we provide a brief literature survey of the roles of carbonic anhydrase and its inhibitors in basic neuroscience and in many neurological and psychiatric diseases. Potential applications of in vivo MRS of carbonic anhydrase in these studies will be discussed.
Epilepsy is a complex neurological disorder of varying etiology manifested by abnormal excessive or synchronous neuronal activity in the brain. An epileptic episode is linked to fast alterations in the neuron ionic compositions [35,80,81,82,83,84,85,86,87]. In vivo MRS has been applied to studying epilepsy and its treatment for decades [88]. Most MRS studies have focused on measuring N-acetyl aspartate as a neuronal marker, glutamate as a marker of the excitatory glutamatergic neurons, as well as GABA and GABAergic system [89] in epilepsy patients. Of them, detection of a deficit in GABA level and the elevation of GABA level and corresponding reduction in seizure activities following treatment using vigabatrin have been a major milestone in the technical development and clinical application of in vivo MRS [90].
Carbonic anhydrase inhibitors (CAIs) are known to exhibit anticonvulsant properties. Some carbonic anhydrase inhibitors are clinically used to treat epilepsy. In the CNS carbonic anhydrase inhibition enhances inhibitory neurotransmission [91]. Augmentation of inhibition following carbonic anhydrase inhibition has been well studied at the level of voltage- and ligand-gated ion channels and gap junctions [92]. Correlation between extent of carbonic anhydrase inhibition and GABAergic effect of carbonic anhydrase inhibition is well established, so in vivo MRS is well-positioned to study GABA-carbonic anhydrase interactions in patients with neurological or psychiatric diseases.
Historically, CAI acetazolamide was marketed as a diuretic drug and concurrently its anticonvulsant property was discovered [93]. In addition, use of CAI in the treatment of several psychiatric disorders has also been reported. Analysis of protein–protein interaction network of schizophrenia associated genes and drug–protein interactome resulted in 12 potential repurposable drugs including acetazolamide [94]. Many genes within this network showed association with various neuropsychiatric disorders and a few of these genes were acetazolamide targets [94]. Additionally, recent proteomic studies of brain disorders such as schizophrenia and major depression have also revealed marked alterations in CA expression [44,95].
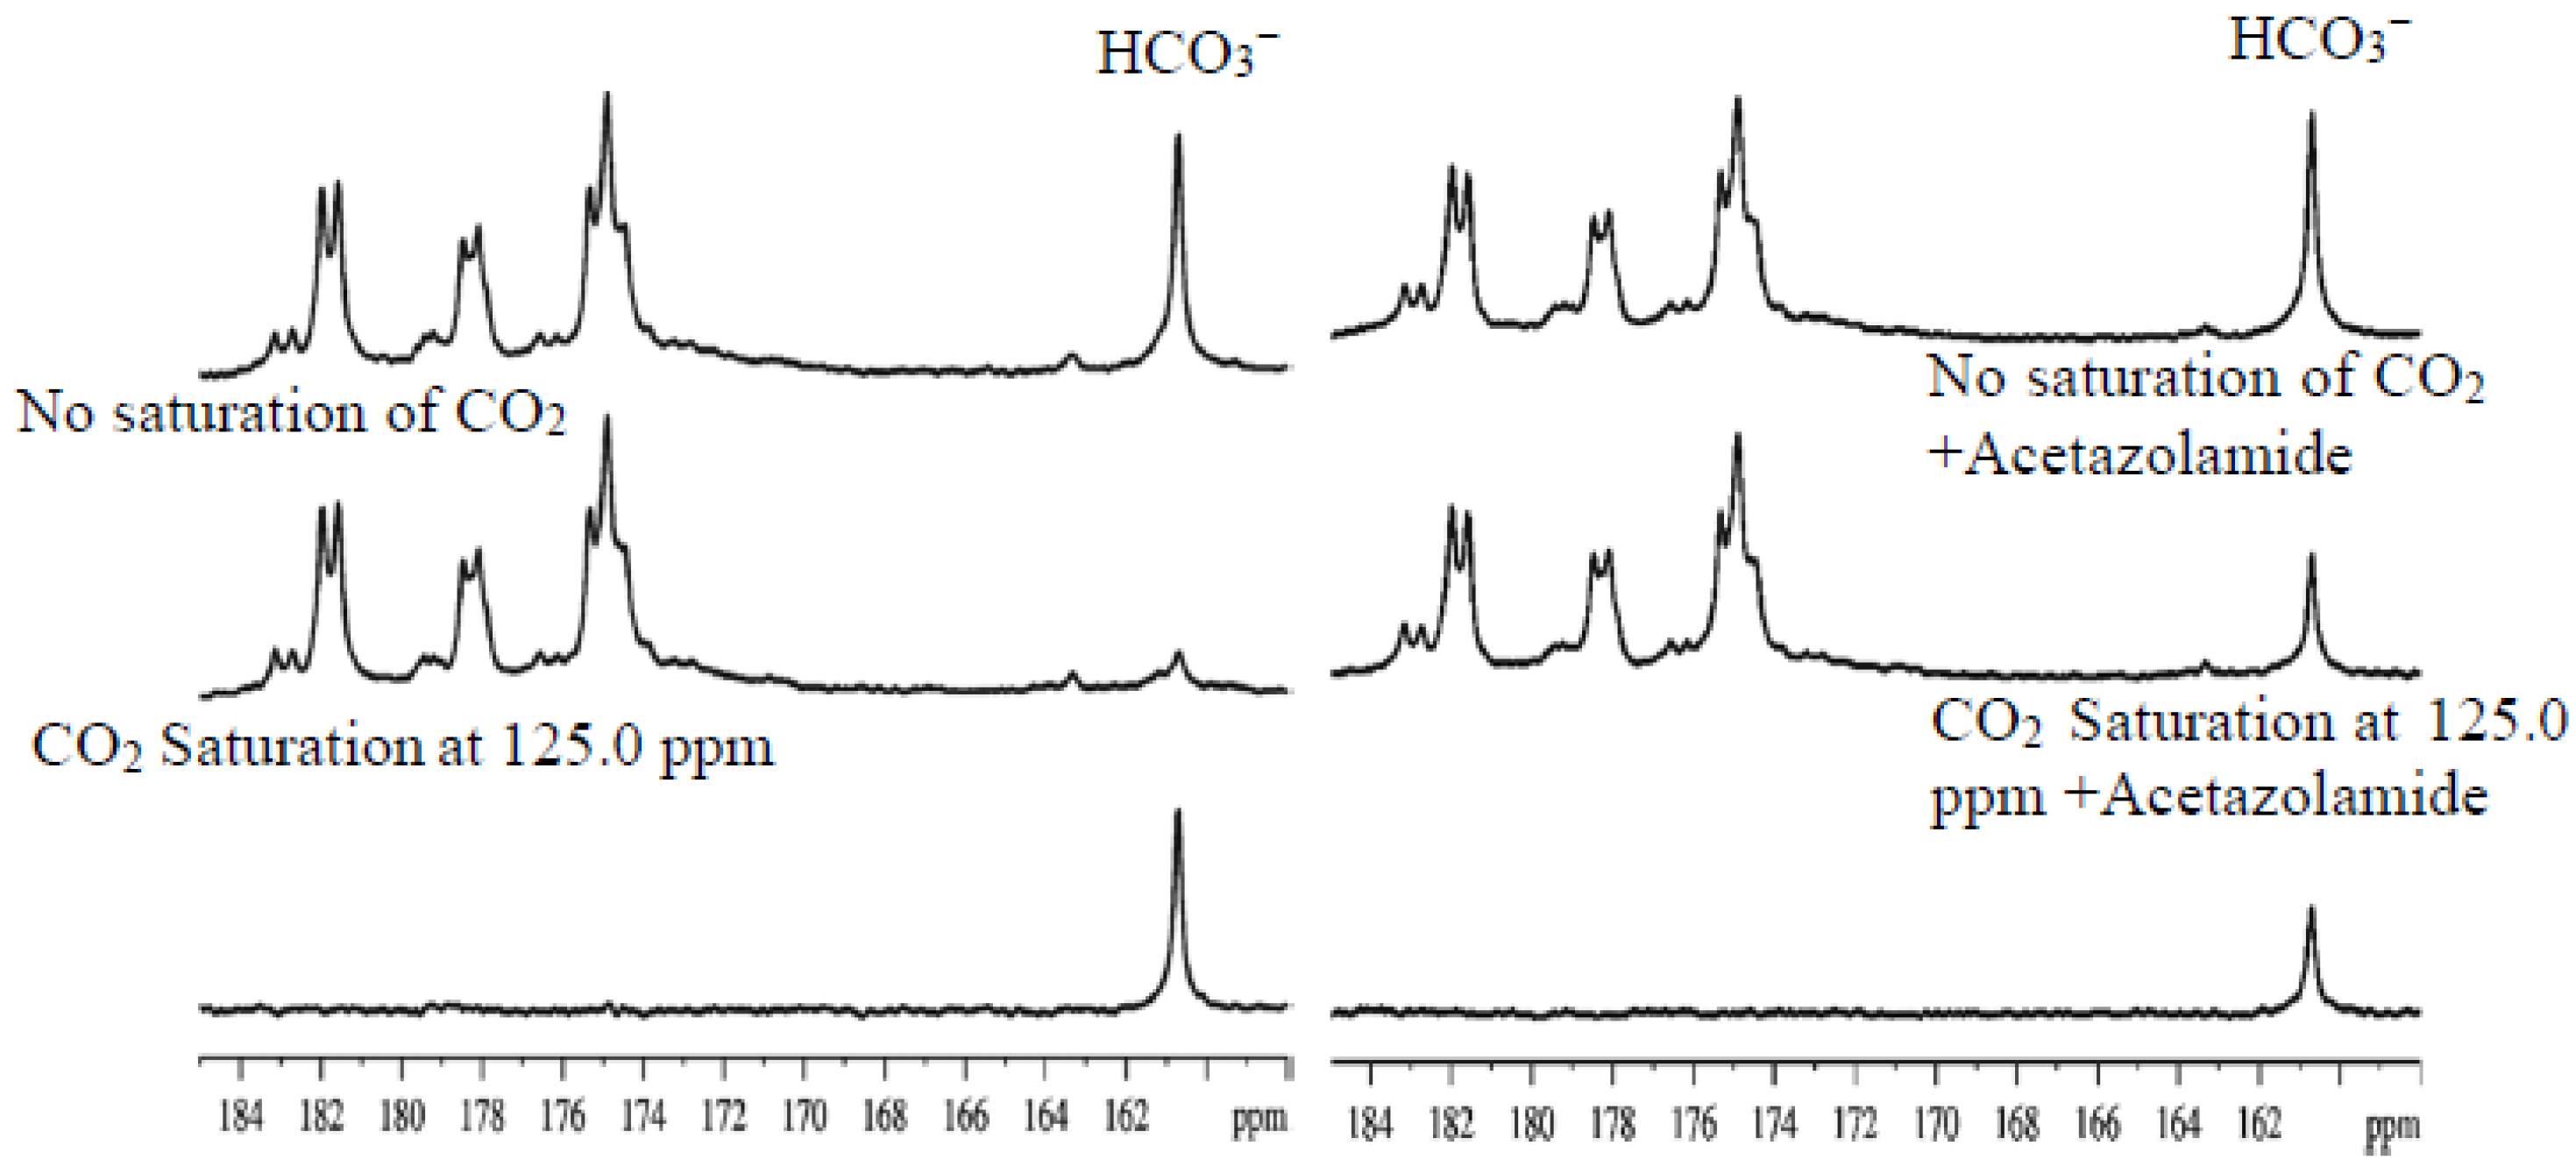
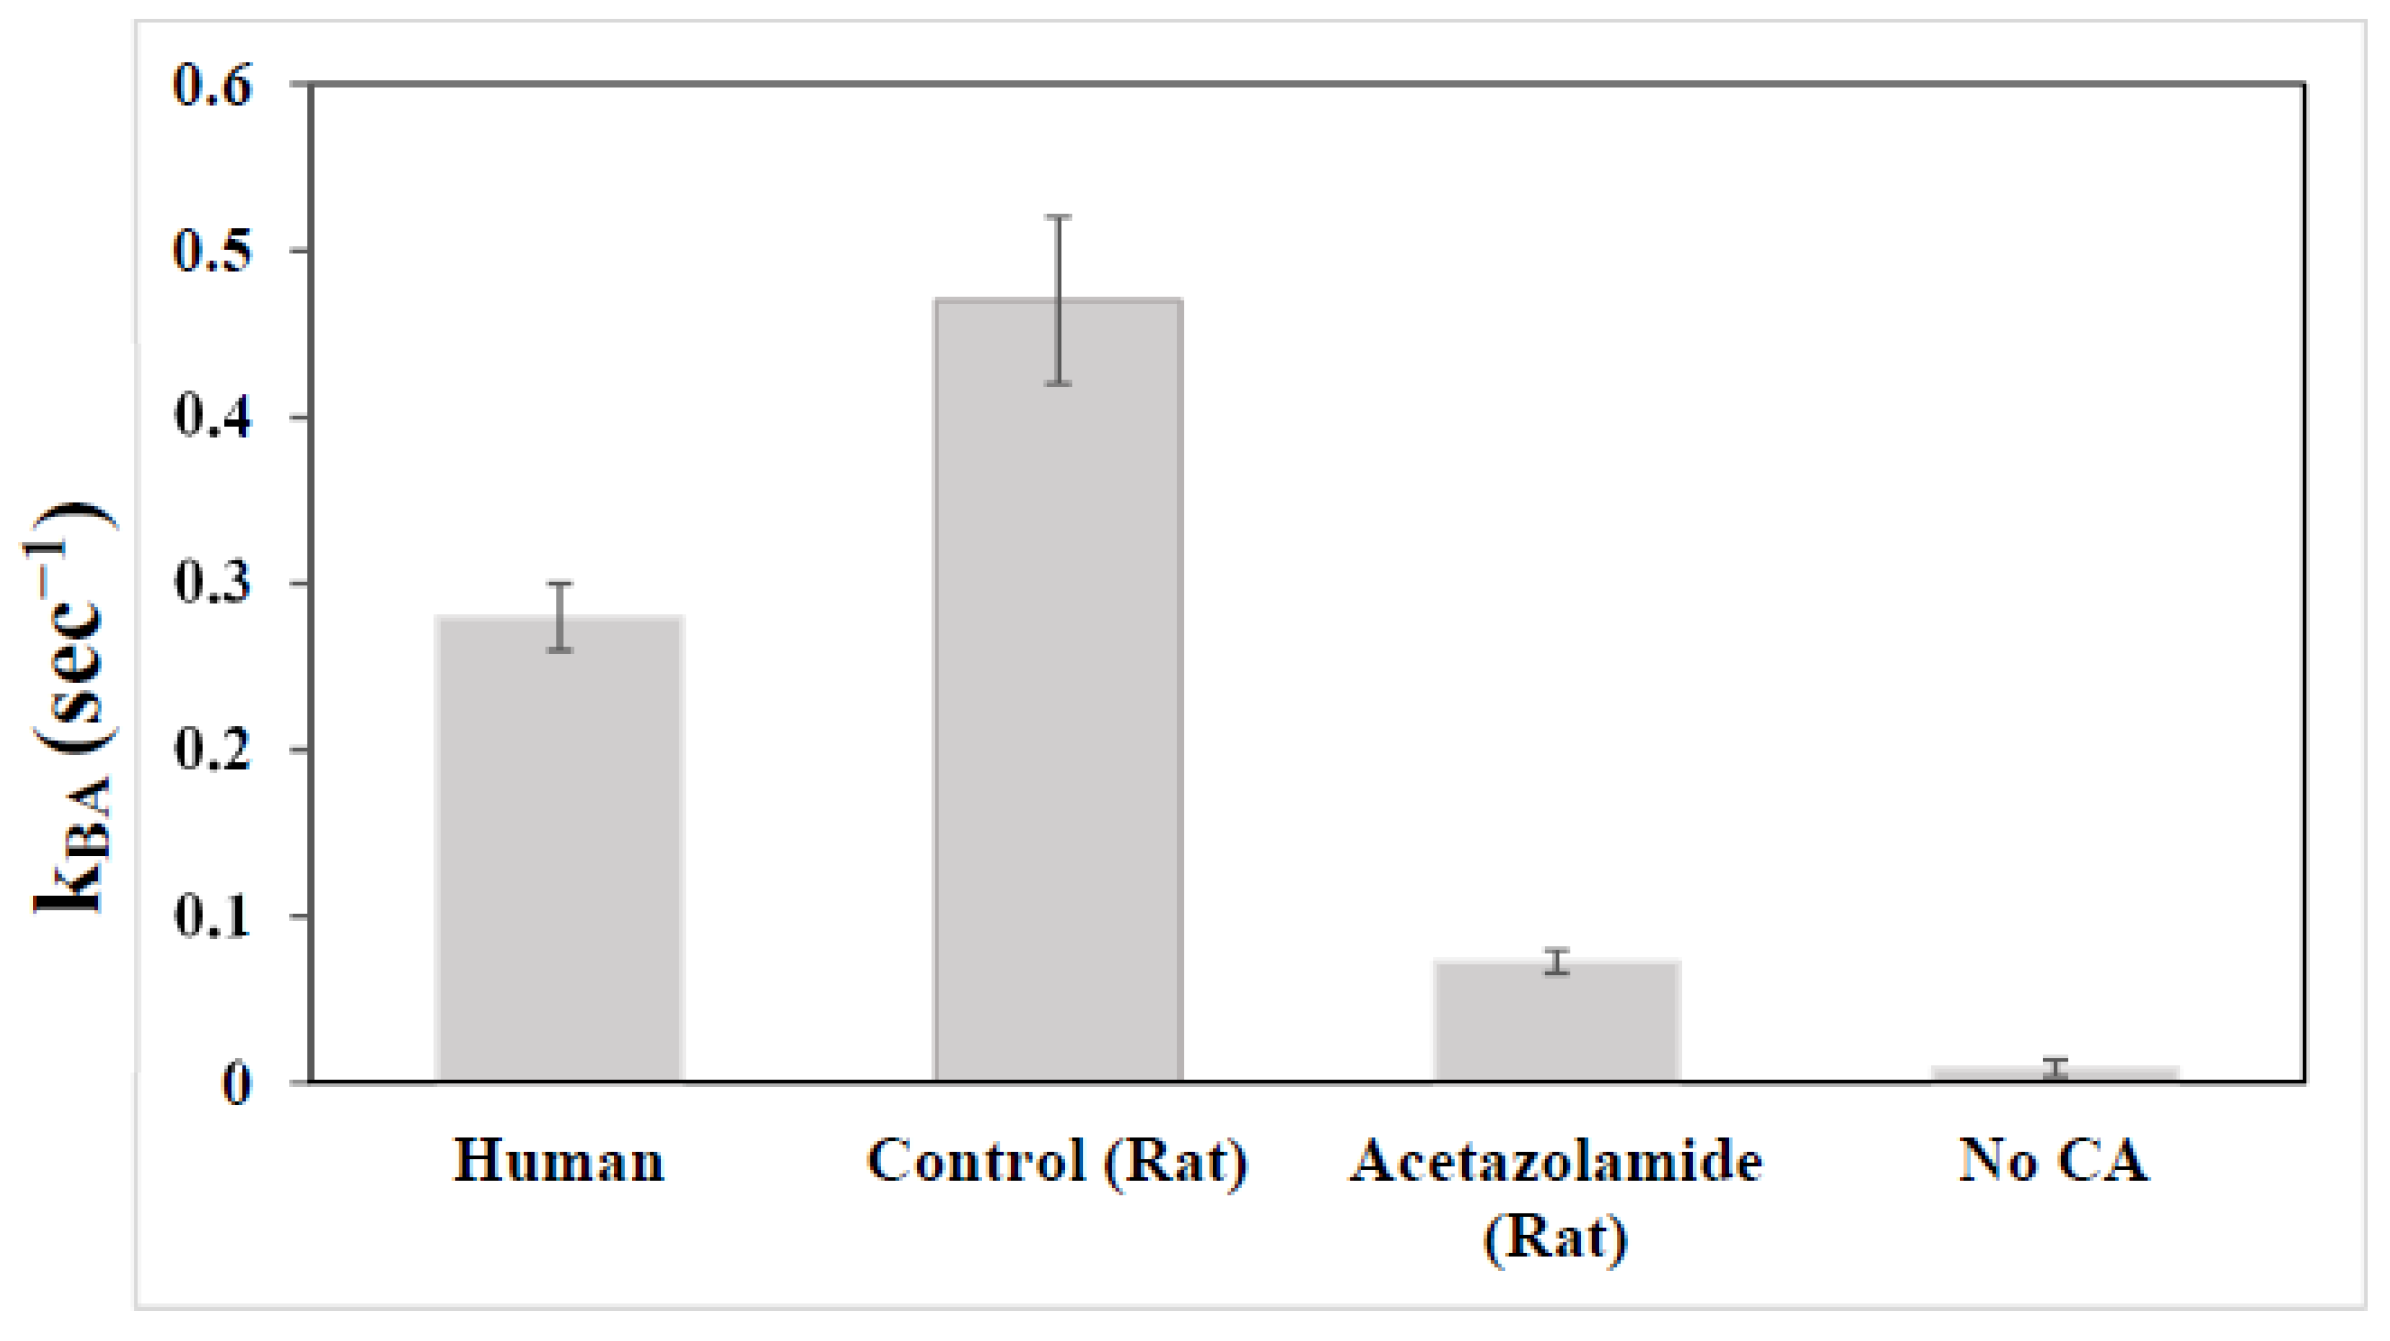
Several clinically used antipsychotic drugs have been screened against CA and many of them inhibit CA at micromolar concentration [96]. Interestingly, the well-known selective serotonin reuptake inhibitors fuoxetine, sertraline, and citalopram are strong CA activators [97]. In a previous double-blind crossover randomized placebo-controlled clinical trial, adjunctive acetazolamide was found to significantly improve both positive and negative symptoms in treatment-refractory schizophrenia patients [98,99]. The beneficial effects of CA inhibitor acetazolamide in the treatment of schizophrenia and bipolar disorder have also been reported by other studies [54,55,93,94,100]. In a previous animal study [40], we showed that administration of acetazolamide to rodents led to a significant reduction in the rate of bicarbonate dehydration in vivo. This reduction in carbonic anhydrase activity caused by acetazolamide is reflected by a markedly reduced 13C magnetization transfer effect readily quantifiable by in vivo magnetization transfer MRS [40] (Figure 6 and Figure 7). Figure 7 also compares the bicarbonate dehydration rate constants measured from human and rodent brains. Interestingly, the carbonic anhydrase activity in healthy human subjects as measured by the bicarbonate dehydration rate constant is notably lower than in control rats not treated with carbonic anhydrase inhibitor acetazolamide.

4. Conclusions

A growing body of evidence links altered carbonic anhydrase expression with many diseases including major neurological and psychiatric disorders. Carbonic anhydrase inhibitors have been in clinical use for decades with a wide range of therapeutic effects. However, there had been no in vivo techniques to directly and noninvasively assess carbonic anhydrase activity and to monitor treatments that target carbonic anhydrase activity until the recent emergence of in vivo 13C magnetization transfer spectroscopy directly measuring the carbonic anhydrase activity. In vivo MRS of carbonic anhydrase reaction has great importance for studying the role of carbonic anhydrase in brain disorders and to evaluate target engagement of carbonic anhydrase inhibitors and activators in the human brain. It is expected that in vivo MRS will play an important role in our understanding of carbonic anhydrase and its modulation in many diseases and their treatments.

Acknowledgments

This work is supported by the Intramural Research Program of National Institute of Mental Health, NIH.

Conflicts of Interest

The authors declare no conflict of interest.

Abbreviations

CACarbonic anhydrase
CAICarbonic anhydrases inhibitor
MRSMagnetic resonance spectroscopy

References

  1. Maren, T.H. Carbonic anhydrase: Chemistry, physiology, and inhibition. Physiol. Rev. 1967, 47, 595–781. [Google Scholar] [CrossRef]
  2. Lomelino, C.L.; Andring, J.T.; McKenna, R. Crystallography and its impact on carbonic anhydrase research. Int. J. Med. Chem. 2018, 2018, 1–21. [Google Scholar] [CrossRef] [PubMed] [Green Version]
  3. Aspatwar, A.; Tolvanen, M.E.E.; Ortutay, C.; Parkkila, S. Carbonic anhydrase related proteins: Molecular biology and evolution. Subcell Biochem. 2014, 75, 135–156. [Google Scholar] [PubMed]
  4. Aspatwar, A.; Tolvanen, M.E.E.; Parkkila, S. An update on carbonic anhydrase-related proteins VIII, X and XI. J. Enzyme Inhib. Med. Chem. 2013, 28, 1129–1142. [Google Scholar] [CrossRef] [PubMed]
  5. Tashian, R.E.; Hewett-Emmett, D.; Carter, N.; Bergenhem, N.C.H. Carbonic anhydrase (CA)-related proteins (CA-RPs) and transmembrane proteins with CA or CA-RP domains. In The carbonic Anhydrases: New Horizons; Chegwidden, W.R., Carter, N.D., Edwards, Y.H., Eds.; Birkhäuser: Basel, Switzerland, 2000; pp. 105–120. [Google Scholar]
  6. Aspatwar, A.; Tolvanen, M.E.; Ortutay, C.; Parkkila, S. Carbonic anhydrase related protein VIII and its role in neurodegeneration and cancer. Curr. Pharm. Des. 2010, 16, 3264–3276. [Google Scholar] [CrossRef] [PubMed]
  7. Niemelä, A.M.; Hynninen, P.; Mecklin, J.P.; Kuopio, T.; Kokko, A.; Aaltonen, L.; Parkkila, A.K.; Pastorekova, S.; Pastorek, J.; Waheed, A.; et al. Carbonic anhydrase IX is highly expressed in hereditary nonpolyposis colorectal cancer. Cancer Epidemiol. Biomark. Prev. 2007, 16, 1760–1766. [Google Scholar] [CrossRef] [PubMed] [Green Version]
  8. Watson, P.H.; Chia, S.K.; Wykoff, C.C.; Han, C.; Leek, R.D.; Sly, W.S.; Gatter, K.C.; Ratcliffe, P.; Harris, A.L. Carbonic anhydrase XII is a marker of good prognosis in invasive breast carcinoma. Br. J. Cancer 2003, 88, 1065–1070. [Google Scholar] [CrossRef] [PubMed] [Green Version]
  9. Ilie, M.; Mazure, N.M.; Hofman, V.; Ammadi, R.E.; Ortholan, C.; Bonnetaud, C.; Havet, K.; Venissac, N.; Mograbi, B.; Mouroux, J.; et al. High levels of carbonic anhydrase IX in tumour tissue and plasma are biomarkers of poor prognostic in patients with non-small cell lung cancer. Br. J. Cancer. 2010, 102, 1627–1635. [Google Scholar] [CrossRef] [Green Version]
  10. Karjalainen, S.L.; Haapasalo, H.K.; Aspatwar, A.; Barker, H.; Parkkila, S.; Haapasalo, J.A. Carbonic anhydrase related protein expression in astrocytomas and oligodendroglial tumors. BMC Cancer 2018, 18, 584–593. [Google Scholar] [CrossRef]
  11. Haapasalo, J.A.; Nordfors, K.M.; Hilvo, M.; Rantala, I.J.; Soini, Y.; Parkkila, A.-K.; Pastoreková, S.; Pastorek, J.; Parkkila, S.M.; Haapasalo, H.K. Expression of carbonic anhydrase IX in astrocytic tumors predicts poor prognosis. Clin. Cancer Res. 2006, 12, 473–477. [Google Scholar] [CrossRef] [Green Version]
  12. Swietach, P.; Vaughan-Jones, R.D.; Harris, A.L. Regulation of tumor pH and the role of carbonic anhydrase 9. Cancer Metastasis Rev. 2007, 26, 299–310. [Google Scholar] [CrossRef] [PubMed]
  13. Supuran, C.T. Carbonic anhydrase: Catalytic and inhibition mechanisms, distribution and physiological roles. In Carbonic Anhydrase: Its Inhibitors and Activators; Supuran, C.T., Scozzafava, A., Conway, J., Eds.; CRC Press: Boca Raton, FL, USA, 2004; pp. 1–23. [Google Scholar]
  14. Semenza, G.L. Hypoxia and cancer. Cancer Metastasis Rev. 2007, 26, 223–224. [Google Scholar] [CrossRef] [PubMed]
  15. Trastour, C.; Benizri, E.; Ettore, F.; Ramaioli, A.; Chamorey, E.; Pouysségur, J.; Berra, E. HIF-1α and CA IX staining in invasive breast carcinomas: Prognosis and treatment outcome. Int. J. Cancer. 2007, 120, 1451–1458. [Google Scholar] [CrossRef] [PubMed]
  16. Monti, S.M.; Supuran, C.T.; De Simone, G. Anticancer carbonic anhydrase inhibitors: A patent review (2008–2013). Expert. Opin. Ther. Pat. 2013, 23, 737–749. [Google Scholar] [CrossRef]
  17. Hussain, S.A.; Ganesan, R.; Reynolds, G.; Gross, L.; Stevens, A.; Pastorek, J.; Murray, P.G.; Perunovic, B.; Anwar, M.S.; Billingham, L.; et al. Hypoxia-regulated carbonic anhydrase IX expression is associated with poor survival in patients with invasive breast cancer. Br. J. Cancer 2007, 96, 104–109. [Google Scholar] [CrossRef]
  18. Potter, C.P.; Harris, A.L. Diagnostic, prognostic and therapeutic implications of carbonic anhydrases in cancer. Br. J. Cancer 2003, 89, 2–7. [Google Scholar] [CrossRef] [Green Version]
  19. Nocentini, A.; Supuran, C.T. Carbonic anhydrase inhibitors as antitumor/antimetastatic agents: A patent review (2008–2018). Expert. Opin. Ther. Pat. 2018, 28, 729–740. [Google Scholar] [CrossRef]
  20. Pastorekova, S.; Parkkila, S.; Pastorek, J.; Supuran, C.T. Carbonic anhydrases: Current state of the art, therapeutic applications and future prospects. J. Enzyme Inhib. Med. Chem. 2004, 19, 199–229. [Google Scholar] [CrossRef]
  21. Proescholdt, M.A.; Mayer, C.; Kubitza, M.; Schubert, T.; Liao, S.Y.; Stanbridge, E.J.; Ivanov, S.; Oldfield, E.H.; Brawanski, A.; Merrill, M.J. Expression of hypoxia-inducible carbonic anhydrases in brain tumors. Neuro Oncol. 2005, 7, 465–475. [Google Scholar] [CrossRef]
  22. Järvelä, S.; Parkkila, S.; Bragge, H.; Kähkönen, M.; Parkkila, A.K.; Soini, Y.; Pastorekova, S.; Pastorek, J.; Haapasalo, H. Carbonic anhydrase IX in oligodendroglial brain tumors. BMC Cancer 2008, 8, 1. [Google Scholar] [CrossRef] [Green Version]
  23. Vuotikka, P.; Uusimaa, P.; Niemelä, M.; Väänänen, K.; Vuori, J.; Peuhkurinen, K. Serum myoglobin/carbonic anhydrase III ratio as a marker of reperfusion after miocardial infarction. Int. J. Cardiol. 2003, 91, 137–144. [Google Scholar] [CrossRef]
  24. Beuerle, J.R.; Azzazy, H.M.; Styba, G.; Duh, S.H.; Christenson, R.H. Characteristics of myoglobin, carbonic anhydrase III and the myoglobin/carbonic anhydrase III ratio in trauma, exercise, and myocardial infarction patients. Clin. Chim. Acta 2000, 294, 115–128. [Google Scholar] [CrossRef]
  25. Sapirstein, V.S.; Strocchi, P.; Gilbert, J.M. Properties and function of brain carbonic anhydrase. Ann. N. Y. Acad. Sci. 1984, 429, 481–493. [Google Scholar] [CrossRef] [PubMed]
  26. Ghandour, M.S.; Parkkila, A.K.; Parkkila, S.; Waheed, A.; Sly, W.S. Mitochondrial carbonic anhydrase in the nervous system: Expression in neuronal and glial cells. J. Neurochem. 2000, 75, 2212–2220. [Google Scholar] [CrossRef]
  27. Ruusuvuori, E.; Huebner, A.K.; Kirilkin, I.; Yukin, A.Y.; Blaesse, P.; Helmy, M.; Kang, H.J.; El Muayed, M.; Hennings, J.C.; Voipio, J.; et al. Neuronal carbonic anhydrase VII provides GABAergic excitatory drive to exacerbate febrile seizures. EMBO J. 2013, 32, 2275–2286. [Google Scholar] [CrossRef] [Green Version]
  28. Supuran, C.T. Carbonic anhydrases: Novel therapeutic applications for inhibitors and activators. Nat. Rev. Drug Discov. 2008, 7, 168–181. [Google Scholar] [CrossRef]
  29. Agnati, L.F.; Tinner, B.; Staines, W.A.; Väänänen, K.; Fuxe, K. On the cellular localization and distribution of carbonic anhydrase II immunoreactivity in the rat brain. Brain. Res. 1995, 676, 10–24. [Google Scholar] [CrossRef]
  30. Giacobini, E. Localization of carbonic anhydrase in the nervous system. Science 1961, 134, 1524–1525. [Google Scholar] [CrossRef]
  31. Deitmer, J.W. Strategies for metabolic exchange between glial cells and neurons. Respir. Physiol. 2001, 129, 71–81. [Google Scholar] [CrossRef]
  32. Deitmer, J.W. Glial strategy for metabolic shuttling and neuronal function. Bioessays 2000, 22, 747–752. [Google Scholar] [CrossRef]
  33. Cammer, W.B.; Brion, L.P. Carbonic anhydrase in the nervous system. In The Carbonic Anhydrases: New Horizons; Chegwidden, W.R., Carter, N.D., Edwards, Y.H., Eds.; Birkhäuser: Basel, Switzerland, 2000; pp. 475–489. [Google Scholar]
  34. Sun, M.K.; Alkon, D.L. Carbonic anhydrase gating of attention: Memory therapy and enhancement. Trends Pharmacol. Sci. 2002, 23, 83–89. [Google Scholar] [CrossRef]
  35. Gavernet, L. Carbonic Anhydrase and Epilepsy. In Antiepileptic Drug Discovery; Talevi, A., Rocha, L., Eds.; Humana Press: New York, NY, USA, 2016; pp. 37–51. [Google Scholar]
  36. Shen, J.; Xu, S. Theoretical analysis of carbon-13 magnetization transfer for in vivo exchange between a-ketoglutarate and glutamate. NMR Biomed. 2006, 19, 248–254. [Google Scholar] [CrossRef] [PubMed]
  37. Shen, J. In vivo carbon-13 magnetization transfer effect. Detection of aspartate aminotransferase reaction. Magn. Reson. Med. 2005, 54, 1321–1326. [Google Scholar] [CrossRef] [PubMed]
  38. Xu, S.; Yang, J.; Shen, J. In vivo 13C saturation transfer effect of the lactate dehydrogenase reaction. Magn. Reson. Med. 2007, 57, 258–264. [Google Scholar] [CrossRef] [PubMed]
  39. Yang, J.; Shen, J. Relayed 13C magnetization transfer: Detection of malate dehydrogenase reaction in vivo. J. Magn. Reson. 2007, 184, 344–349. [Google Scholar] [CrossRef] [PubMed] [Green Version]
  40. Yang, J.; Singh, S.; Shen, J. 13C saturation transfer effect of carbon dioxide-bicarbonate exchange catalyzed by carbonic anhydrase in vivo. Magn. Reson. Med. 2008, 59, 492–498. [Google Scholar] [CrossRef]
  41. Xu, S.; Yang, J.; Shen, J. Inverse Polarization Transfer for Detecting in Vivo 13C Magnetization Transfer Effect of Specific Enzyme Reactions in 1H Spectra. Magn. Reson. Imaging 2008, 26, 413–419. [Google Scholar] [CrossRef] [Green Version]
  42. Li, S.; Yang, J.; Shen, J. Novel strategy for cerebral 13C MRS using very low RF power for proton decoupling. Magn. Reson. Med. 2007, 57, 265–271. [Google Scholar] [CrossRef]
  43. Li, S.; An, L.; Duan, Q.; Araneta, M.F.; Johnson, C.S.; Shen, J. Determining the rate of carbonic anhydrase reaction in the human brain. Sci. Rep. 2018, 8, 2328. [Google Scholar] [CrossRef] [Green Version]
  44. Johnston-Wilson, N.L.; Sims, C.D.; Hofmann, J.P.; Anderson, L.; Shore, A.D.; Torrey, E.F.; Yolken, R.H. Disease-specific alterations in frontal cortex brain proteins in schizophrenia, bipolar disorder, and major depressive disorder. The Stanley Neuropathology Consortium. Mol. Psychiatry 2000, 5, 142–149. [Google Scholar] [CrossRef] [Green Version]
  45. Supuran, C.T. Carbonic anhydrase inhibitors and activators for novel therapeutic applications. Future Med. Chem. 2011, 3, 1165–1180. [Google Scholar] [CrossRef] [PubMed]
  46. Asiedu, M.; Ossipov, M.H.; Kaila, K.; Price, T.J. Acetazolamide and midazolam act synergistically to inhibit neuropathic pain. Pain 2010, 148, 302–308. [Google Scholar] [CrossRef] [PubMed] [Green Version]
  47. Reiss, W.G.; Oles, K.S. Acetazolamide in the treatment of seizures. Ann. Pharmacother. 1996, 30, 514–519. [Google Scholar] [CrossRef] [PubMed]
  48. Di Cesare Mannelli, L.; Micheli, L.; Carta, F.; Cozzi, A.; Ghelardini, C.; Supuran, C.T. Carbonic anhydrase inhibition for the management of cerebral ischemia: In vivo evaluation of sulfonamide and coumarin inhibitors. Enzyme Inhib. Med. Chem. 2016, 31, 894–899. [Google Scholar] [CrossRef] [Green Version]
  49. Cowen, M.A.; Gree, M.; Bertoll, D.N.; Abbot, K. A treatment for tardive dyskinesia and some other extrapyramidal symptoms. J. Clin. Psychopharmacol. 1997, 17, 190–193. [Google Scholar] [CrossRef]
  50. Uitti, R.J. Medical treatment of essential tremor and Parkinson’s disease. Geriatrics 1998, 53, 46–48, 53–57. [Google Scholar]
  51. Bernhard, W.N.; Schalik, L.M.; Delaney, P.A.; Bernhard, T.M.; Barnas, G.M. Acetazolamide plus low-dose dexamethasone is better than acetazolamide alone to ameliorate symptoms of acute mountain sickness. Aviat. Space. Environ. Med. 1998, 69, 883–886. [Google Scholar]
  52. Makoto, H.; Masaaki, I.; Haruo, S.; Hiroshi, I.; Koji, M. A case of schizophrenia with favorable effect of acetazolamide. Kyushu Neuropsychiatry 1996, 42, 189–193. [Google Scholar]
  53. Ahmed, S.E.; Khan, A.H. Acetazolamide: Treatment of psychogenic polydipsia. Cureus. 2017, 9, e1553. [Google Scholar] [CrossRef] [Green Version]
  54. Hayes, S.G. Acetazolamide in bipolar affective disorders. Ann. Clin. Psychiatry. 1994, 6, 91–98. [Google Scholar] [CrossRef]
  55. Brandt, C.; Grunze, H.; Normann, C.; Walden, J. Acetazolamide in the treatment of acute mania. A case report. Neuropsychobiology 1998, 38, 202–203. [Google Scholar] [CrossRef] [PubMed] [Green Version]
  56. Carta, F.; Di Cesare Mannelli, L.; Pinard, M.; Ghelardini, C.; Scozzafava, A.; McKenna, R.; Supurana, C.T. A class of sulfonamide carbonic anhydrase inhibitors with neuropathic pain modulating effects. Bioorg. Med. Chem. 2015, 23, 1828–1840. [Google Scholar] [CrossRef] [PubMed]
  57. Supuran, C.T. Acetazolamide for the treatment of idiopathic intracranial hypertension. Expert. Rev. Neurother. 2015, 15, 851–856. [Google Scholar] [CrossRef] [PubMed]
  58. Supuran, C.T. Carbonic anhydrase inhibitors and their potential in a range of therapeutic areas. Expert. Opin. Ther. Pat. 2018, 28, 709–712. [Google Scholar] [CrossRef] [Green Version]
  59. Shank, R.P.; Gardocki, J.F.; Streeter, A.J.; Maryanoff, B.E. An overview of the preclinical aspects of topiramate: Pharmacology, pharmacokinetics, and mechanism of action. Epilepsia 2000, 41, S3–S9. [Google Scholar] [CrossRef]
  60. Kudin, A.P.; Debska-Vielhaber, G.; Vielhaber, S.; Elger, C.E.; Kunz, W.S. The mechanism of neuroprotection by topiramate in an animal model of epilepsy. Epilepsia 2004, 45, 1478–1487. [Google Scholar] [CrossRef]
  61. Bermejo, P.E.; Dorado, R. Zonisamide for migraine prophylaxis in patient’s refractory to topiramate. Clin. Neuropharmacol. 2009, 32, 103–106. [Google Scholar] [CrossRef]
  62. Lai, E.C.; Chang, C.H.; Kao Yang, Y.H.; Lin, S.J.; Lin, C.Y. Effectiveness of sulpiride in adult patients with schizophrenia. Schizophr. Bull. 2013, 3, 673–683. [Google Scholar] [CrossRef] [Green Version]
  63. Kaila, K.; Voipio, J. Postsynaptic fall in intracellular pH induced by GABA-activated bicarbonate conductance. Nature 1987, 330, 163–165. [Google Scholar] [CrossRef]
  64. Marini, S.; De Berardis, D.; Vellante, F.; Santacroce, R.; Orsolini, L.; Valchera, A.; Girinelli, G.; Carano, A.; Fornaro, M.; Gambi, F.; et al. Celecoxib Adjunctive Treatment to Antipsychotics in Schizophrenia: A Review of Randomized Clinical Add-On Trials. Mediators Inflamm. 2016, 2016, 3476240. [Google Scholar] [CrossRef] [Green Version]
  65. Bavaresco, D.V.; Colonetti, T.; Grande, A.J.; Colom, F.; Valvassori, S.S.; Quevedo, J.; da Rosa, M.I. Efficacy of Celecoxib Adjunct Treatment on Bipolar Disorder: Systematic Review and Meta-Analysis. CNS Neurol. Disord. Drug. Targets. 2019, 18, 19–28. [Google Scholar] [CrossRef] [PubMed]
  66. Shalbafan, M.; Malekpour, F.; Donboli, S.; Shirazi, E.; Moridian, M. The role of celecoxib in treatment of psychiatric disorders: A review article. J. Neurol. Psychol. 2018, 6, 4. [Google Scholar]
  67. Dodgson, S.J.; Shank, R.P.; Maryanoff, B.E. Topiramate as an inhibitor of carbonic anhydrase isoenzymes. Epilepsia 2000, 41, S35–S39. [Google Scholar] [CrossRef] [PubMed]
  68. Alger, J.R.; Shulman, R.G. NMR studies of enzymatic rates in vitro and in vivo by magnetization transfer. Q. Rev. Biophys. 1984, 17, 83–124. [Google Scholar] [CrossRef] [PubMed]
  69. Kuchel, P.W. Spin-exchange NMR spectroscopy in studies of the kinetics of enzymes and membrane transport. NMR Biomed. 1990, 3, 102–119. [Google Scholar] [CrossRef]
  70. Rudin, M.; Sauter, A. Measurement of Reaction Rates In Vivo Using Magnetization Transfer Techniques. In In-Vivo Magnetic Resonance Spectroscopy II: Localization and Spectral Editing; Rudin, M., Ed.; Springer: Berlin/Heidelberg, Germany, 1992; pp. 257–293. [Google Scholar]
  71. Ames, A. CNS energy metabolism as related to function. Brain. Res. Rev. 2000, 34, 42–68. [Google Scholar] [CrossRef]
  72. Weyne, J.; Demeester, G.; Leusen, I. Bicarbonate and chloride shifts in rat brain during acute and prolonged respiratory acid-base changes. Arch. Int. Physiol. Biochim. 1968, 76, 415–433. [Google Scholar] [CrossRef]
  73. Torrey, H.C. Bloch Equations with Diffusion Terms. Phys. Rev. 1956, 104, 563–565. [Google Scholar] [CrossRef]
  74. Zhou, J.; van Zijl, P.C.M. Chemical exchange saturation transfer imaging and spectroscopy. Prog. Nucl. Magn. Reson. Spectrosc. 2006, 48, 109–136. [Google Scholar] [CrossRef]
  75. Baguet, E.; Roby, C. Off-resonance irradiation effect in steady-state NMR saturation transfer. J. Magn. Reson. 1997, 128, 149–160. [Google Scholar] [CrossRef]
  76. Kingsley, P.B.; Monahan, W.G. Corrections for off-resonance effects and incomplete saturation in conventional (two-site) saturation-transfer kinetic measurements. Magn. Reson. Med. 2000, 43, 810–819. [Google Scholar] [CrossRef]
  77. Brown, T.R. Saturation transfer in living systems. Philos Trans. R. Soc. Lond. B. Biol. Sci. 1980, 289, 441–444. [Google Scholar] [PubMed]
  78. Led, J.J.; Gesmar, H. The applicability of the magnetization-transfer NMR technique to determine chemical exchange rates in extreme cases. The importance of complementary experiments. J. Magn. Reson. 1982, 49, 444–463. [Google Scholar] [CrossRef]
  79. Shporer, M.; Forster, R.E.; Civan, M.M. Kinetics of CO2 exchange in human erythrocytes analyzed by 13C-NMR. Am. J. Physiol. 1984, 246, C231–C234. [Google Scholar] [CrossRef]
  80. Ruusuvuori, E.; Kaila, K. Carbonic anhydrases and brain pH in the control of neuronal excitability. In Carbonic Anhydrase: Mechanism, Regulation, Links to Disease, and Industrial Applications; Frost, S.C., McKenna, R., Eds.; Springer: Dordrecht, The Netherlands, 2014; pp. 271–290. [Google Scholar]
  81. Xiong, Z.Q.; Stringer, J.L. Regulation of extracellular pH in the developing hippocampus. Dev. Brain Res. 2000, 122, 113–117. [Google Scholar] [CrossRef]
  82. Aram, J.A.; Lodge, D. Epileptiform activity induced by alkalosis in rat neocortical slices: Block by antagonists of N-methyl-D-aspartate. Neurosci. Lett. 1987, 83, 345–350. [Google Scholar] [CrossRef]
  83. White, H.S. Woodbury, D.M.; Chen, C.F.; Kemp, J.W.; Chow, S.Y.; Yen-Chow, Y.C. Role of glial cation and anion transport mechanisms in etiology and arrest of seizures. Adv. Neurol. 1986, 44, 695–712. [Google Scholar]
  84. Thiry, A.; Dogné, J.M.; Supuran, C.T.; Masereel, B. Carbonic anhydrase inhibitors as anticonvulsant agents. Curr. Top. Med. Chem. 2007, 7, 855–864. [Google Scholar] [CrossRef]
  85. Aggarwal, M.; Kondeti, B.; McKenna, R. Anticonvulsant/antiepileptic carbonic anhydrase inhibitors: A patent review. Expert. Opin. Ther. Pat. 2013, 23, 717–724. [Google Scholar] [CrossRef]
  86. Hamidi, S.; Avoli, M. Carbonic anhydrase inhibition by acetazolamide reduces in vitro epileptiform synchronization. Neuropharmacology 2015, 95, 377–387. [Google Scholar] [CrossRef] [Green Version]
  87. Petroff, O.A.; Rothman, D.L.; Behar, K.L.; Mattson, R.H. Low brain GABA level is associated with poor seizure control. Ann. Neurol. 1996, 40, 908–991. [Google Scholar] [CrossRef] [PubMed]
  88. Puts, N.A.; Edden, R.A. In vivo magnetic resonance spectroscopy of GABA: A methodological review. Prog. Nucl. Magn. Reson. Spectrosc. 2012, 60, 29–41. [Google Scholar] [CrossRef] [PubMed] [Green Version]
  89. Levy, L.M.; Degnan, A.J. GABA-Based Evaluation of Neurologic Conditions: MR Spectroscopy. AJNR. Am. J. Neuroradiol. 2013, 34, 259–265. [Google Scholar] [CrossRef] [PubMed] [Green Version]
  90. Rothman, D.L.; Petroff, O.A.; Behar, K.L.; Mattson, R.H. Localized 1H NMR measurements of gamma-aminobutyric acid in human brain in vivo. Proc. Nat. Acad. Sci USA 1993, 90, 5662–5666. [Google Scholar] [CrossRef] [PubMed] [Green Version]
  91. Rivera, C.; Voipio, J.; Kaila, K. Two developmental switches in GABAergic signalling: The K+-Cl- cotransporter KCC2 and carbonic anhydrase CAVII. J. Physiol. 2005, 562, 27–36. [Google Scholar] [CrossRef] [PubMed]
  92. Frost, S.C.; McKenna, R. Carbonic Anhydrase: Mechanism, Regulation, Links to Disease and Industrial Applications; Springer: Dordrecht, The Netherlands, 2014. [Google Scholar]
  93. Inoue, H.; Hazama, H.; Hamazoe, K.; Ichikawa, M.; Omura, F.; Fukuma, E.; Inoue, K.; Umezawa, Y. Antipsychotic and prophylactic effects of acetazolamide (Diamox) on atypical psychosis. Folia Psychiatr. Neurol. Jpn. 1984, 38, 425–436. [Google Scholar] [CrossRef]
  94. Karunakaran, K.B.; Chaparala, S.; Ganapathiraju, M.K. Potentially repurposable drugs for schizophrenia identified from its interactome. Sci. Rep. 2019, 9, 12682. [Google Scholar] [CrossRef] [Green Version]
  95. Kakunje, A.; Prabhu, A.; Es, S.P.; Karkal, R.; Pookoth, R.K.; Rekha, P.D. Acetazolamide for antipsychotic-associated weight gain in schizophrenia. J. Clin. Psychopharmacol. 2018, 38, 652–653. [Google Scholar] [CrossRef]
  96. Erzengin, M.; Bilen, C.; Ergun, A.; Gencer, N. Antipsychotic agents screened as human carbonic anhydrase I and II inhibitors. Arch. Physiol. Biochem. 2014, 120, 29–33. [Google Scholar] [CrossRef]
  97. Supuran, C.T. Carbonic anhydrase activators. Future Med. Chem. 2018, 10, 561–573. [Google Scholar] [CrossRef]
  98. Sacks, W.; Esser, A.H.; Sacks, S. Inhibition of pyruvate dehydrogenase complex (PDHC) by antipsychotic drugs. Biol Psychiatry 1991, 29, 176–182. [Google Scholar] [CrossRef]
  99. Sacks, W.; Esser, A.H.; Feitel, B.; Abbott, K. Acetazolamide and thiamine: An ancillary therapy for chronic mental illness. Psychiatry Res. 1989, 28, 279–288. [Google Scholar] [CrossRef]
  100. Mechtcheriakov, S.; Oehl, M.A.; Hausmann, A.; Fleischhacker, W.W.; Boesch, S.; Schocke, M.; Donnemiller, E. Schizophrenia and episodic ataxia type 2. J. Neurol. Neurosurg. Psychiatry 2003, 74, 688–689. [Google Scholar] [CrossRef] [PubMed] [Green Version]
Figure 1. The two-site exchange diagram for CO2 ↔ HCO3 catalyzed by carbonic anhydrase. M0A and M0B denote the magnetization of CO2 and HCO3 at thermal equilibrium. T1A, T1B and T2A, T2B are their respective longitudinal and transverse relaxation times without any chemical exchange. kAB and kBA represent the pseudo-first-order rate constants of the unidirectional CO2 → HCO3 hydration and HCO3 → CO2 dehydration reactions, respectively.
Ijms 21 02442 g001
Figure 2. Radiofrequency pulse sequence for the 13C saturation transfer experiments. 1H→13C heteronuclear Nuclear Overhauser Enhancement (NOE) was generated by saturating proton signals using evenly spaced non-selective hard pulses. A continuous wave (CW) 13C pulse or a train of spectrally selective shaped 13C pulses was used for radiofrequency saturation at CO2 resonance or at the control frequency on the opposite side of bicarbonate. For excitation, a 13C block pulse was used. Δ: Delay between proton pulses (48 ms).
Ijms 21 02442 g002
Figure 3. A typical time-course of control spectra acquired from a single subject after oral administration of [U-13C6] glucose without proton decoupling. Each spectrum was acquired with recycle delay = 30 s, spectral width = 8 kHz, number of data points = 2048, number of averages = 12, and line broadening = 8 Hz. The time interval indicates the beginning and end of acquisition following oral glucose intake. Lipid: carboxylic carbons of natural abundance lipids (172.5 ppm), Glu5: glutamate C5 (182.0 ppm), Glu1: glutamate C1 (175.4 ppm), Gln5: glutamine C5 (178.5 ppm), Gln1: glutamine C1 (174.8 ppm), Asp4: aspartate C4 (178.3 ppm), Asp1: aspartate C1 (175.0 ppm) (reprinted from ref. [43]. https://creativecommons.org/licenses/by/4.0/).
Ijms 21 02442 g003
Figure 4. Bicarbonate signal intensities as a function of time after oral administration of [U-13C6] glucose. The glucose level was different in different subjects during the scan time. Bicarbonate signal increased monotonically (reprinted from ref. [43]. https://creativecommons.org/licenses/by/4.0/).
Ijms 21 02442 g004
Figure 5. 13C saturation transfer effect catalyzed by carbonic anhydrase (CA) in the human brain. Spectra were measured from a single subject between 118 and 130 minutes after oral administration of 20% [U-13C6] glucose. (a) control spectrum with 13C irradiation at 228 ppm; (b) with saturation of carbon dioxide at 125.0 ppm; (c) difference spectrum.
Ijms 21 02442 g005
Figure 6. In vivo 13C magnetization transfer effect of carbon dioxide–bicarbonate exchange in rat brain before (left) and after (right) carbonic anhydrase inhibition. Upper traces: no saturation of carbon dioxide. Middle traces: with saturation of carbon dioxide at 125.0 ppm. Lower traces: difference spectra. The 13C magnetization transfer effect of the carbon dioxide–bicarbonate exchange was significantly reduced after blockade of carbonic anhydrase (adapted from ref [40] with permission from John Wiley and Sons Ltd.).
Ijms 21 02442 g006
Figure 7. Pseudo first-order unidirectional bicarbonate dehydration rate constant kBA determined from healthy human subjects, control rats, rats treated with acetazolamide, and a phantom (standard deviation is plotted as error bars).
Ijms 21 02442 g007