Efficacy and Safety of Pemafibrate, a Novel Selective Peroxisome Proliferator-Activated Receptor α Modulator (SPPARMα): Pooled Analysis of Phase 2 and 3 Studies in Dyslipidemic Patients with or without Statin Combination


Abstract
1. Introduction
2. Results
2.1. Patient Characteristics
2.2. Efficacy
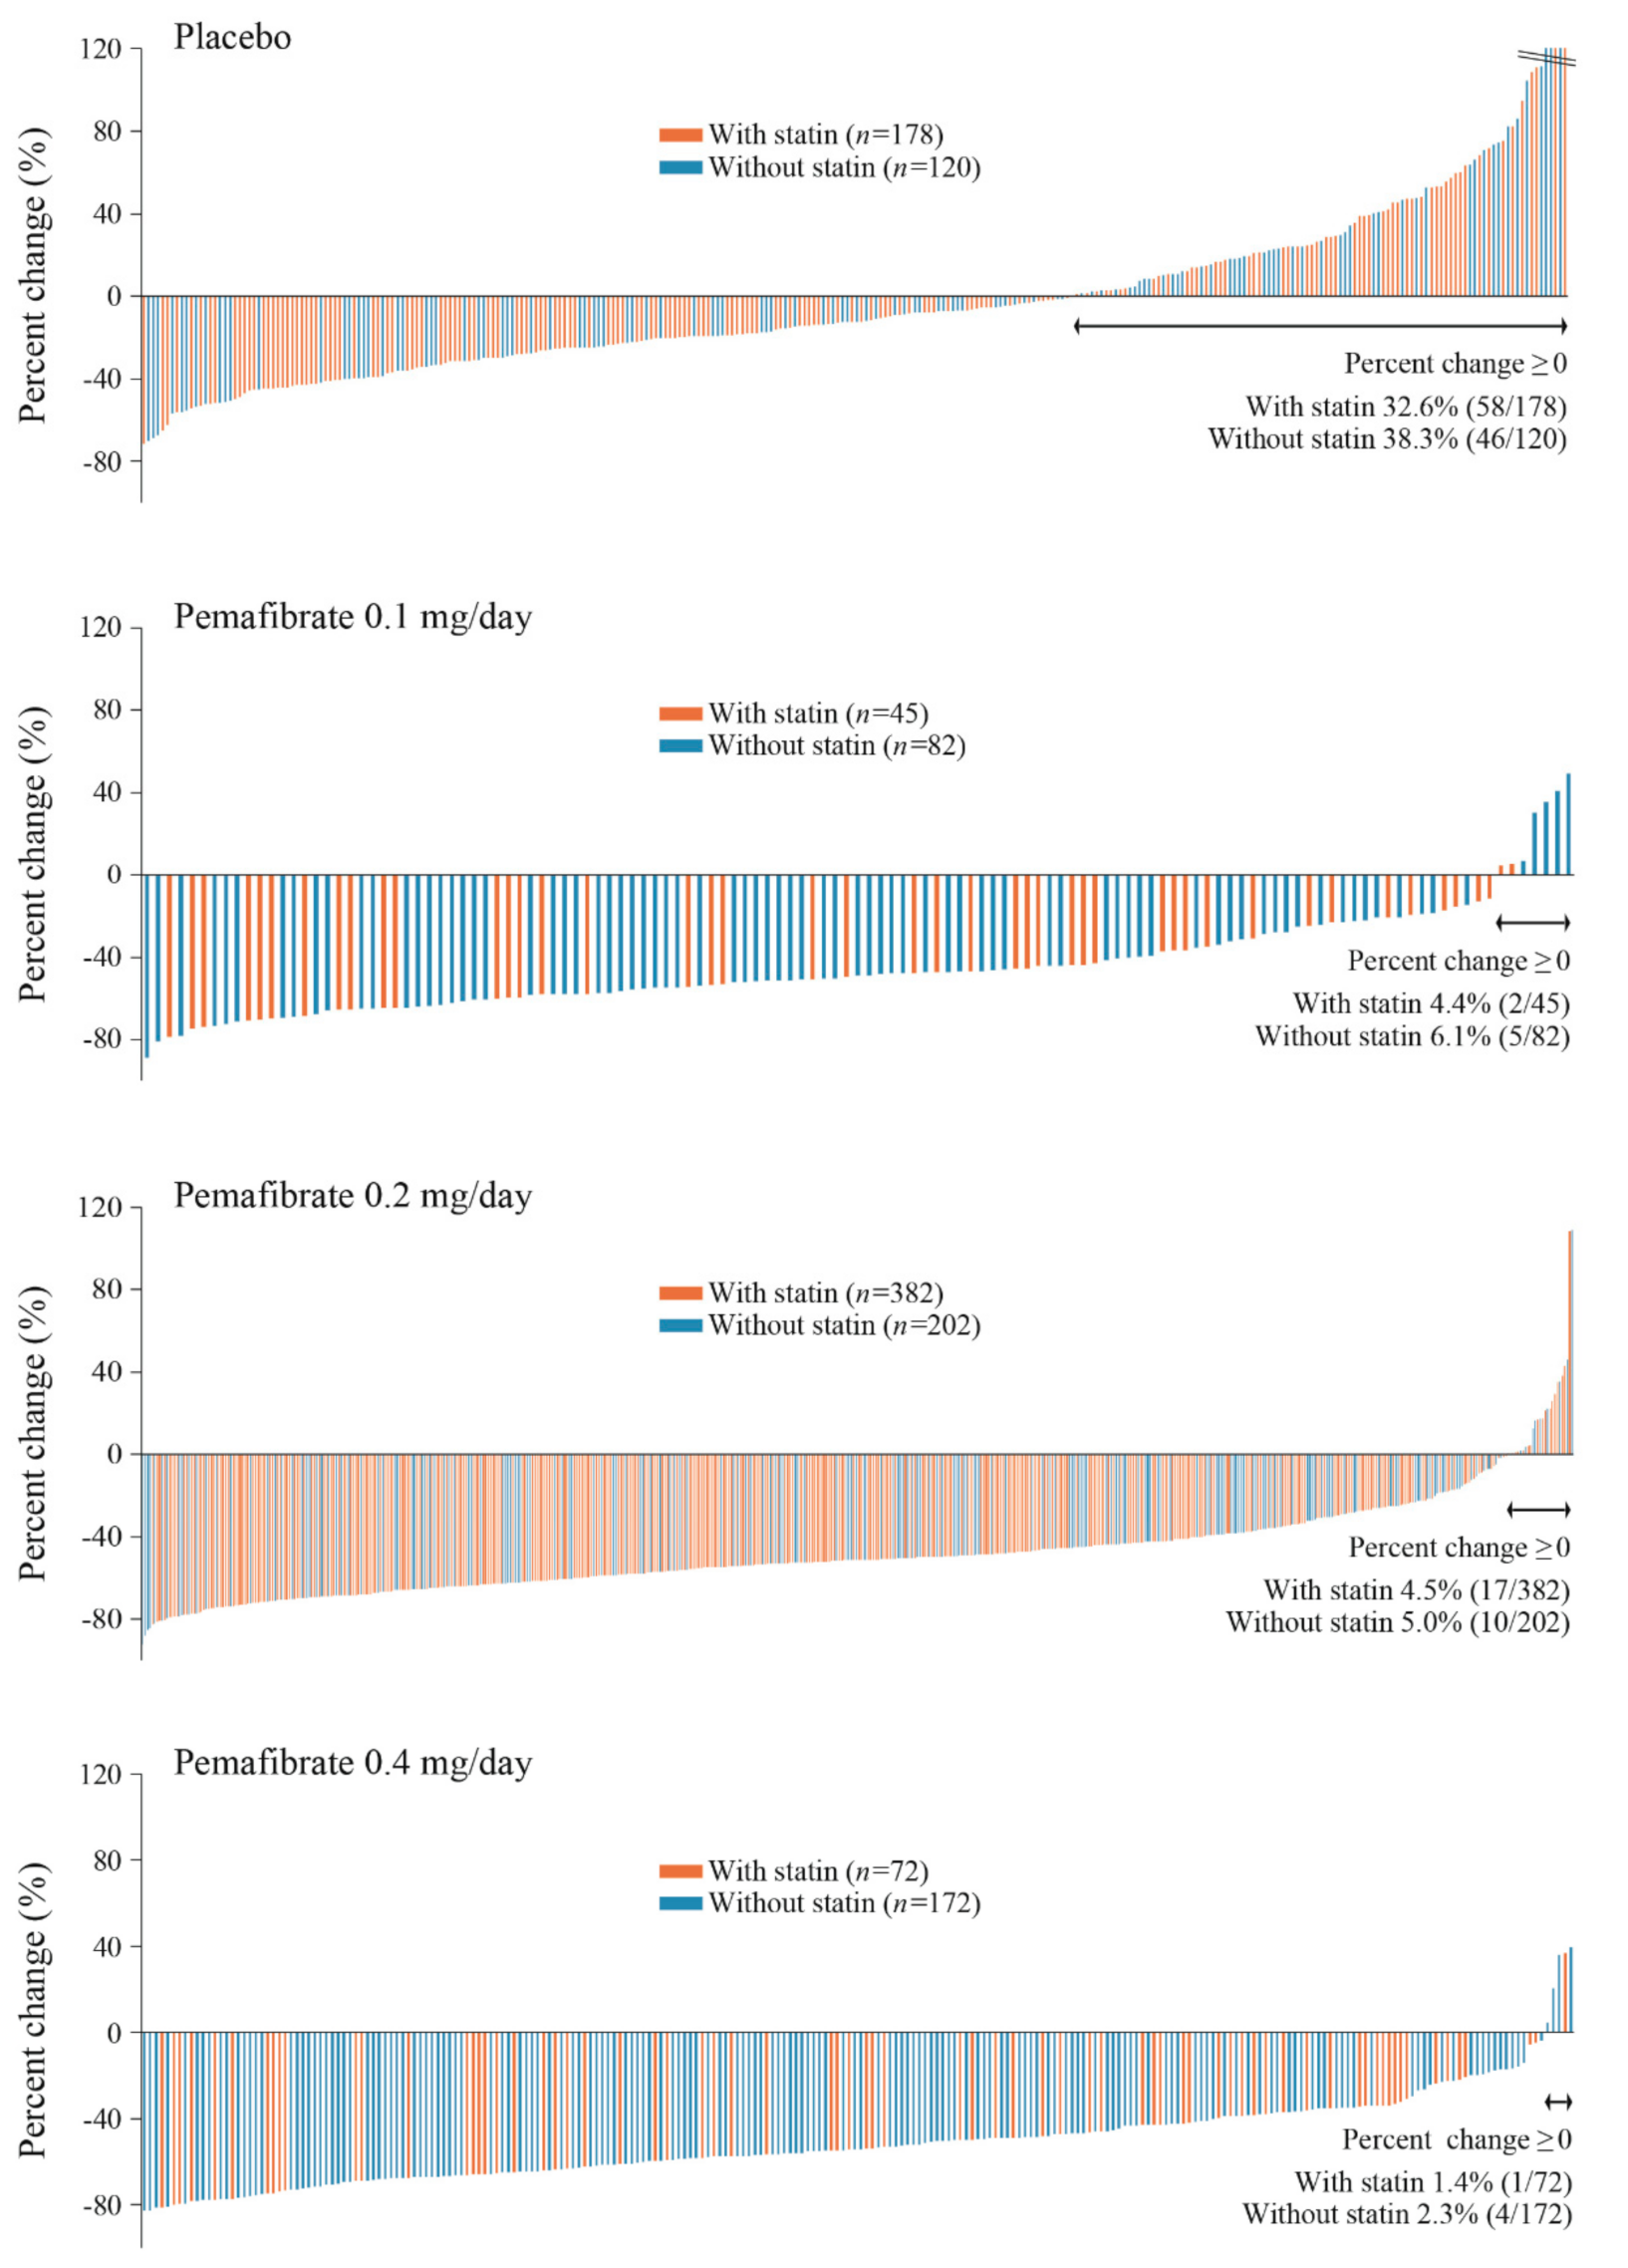
2.2.1. Effects on TG
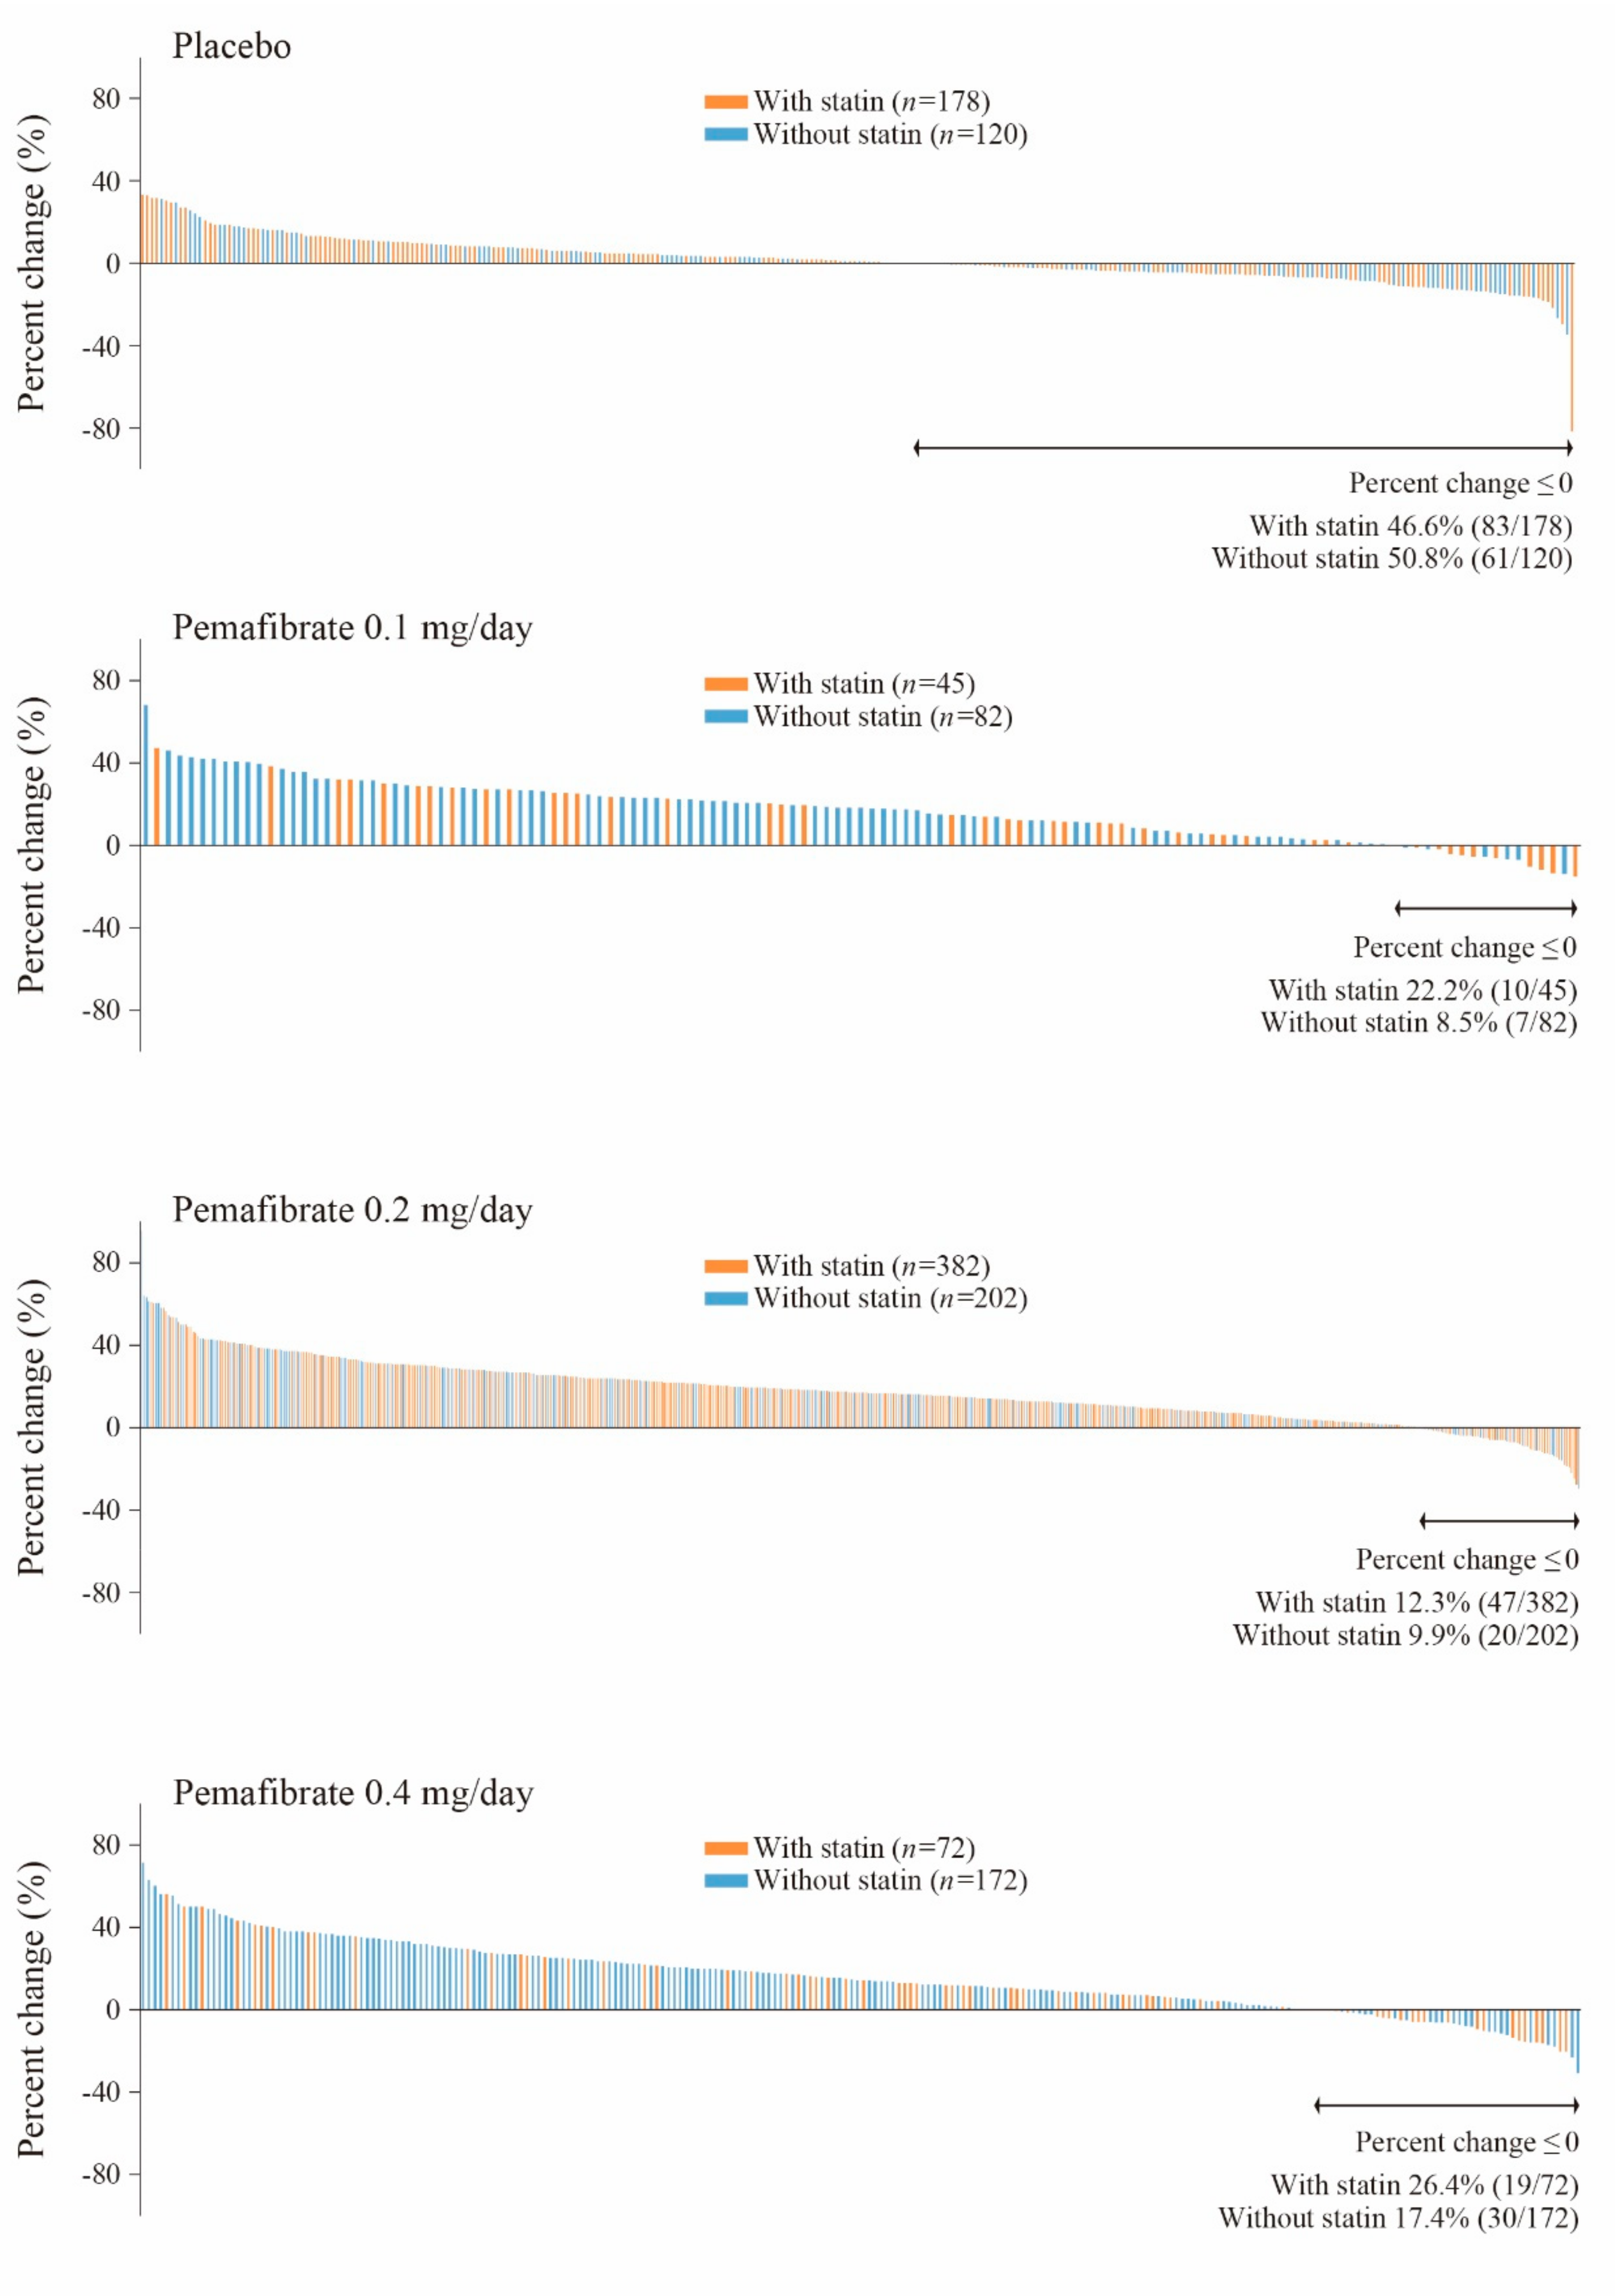
2.2.2. Effects on HDL-C
2.2.3. Effects on LDL-C and Other Lipid Parameters
2.2.4. Analysis Stratified by Presence or Absence of Renal Dysfunction
2.3. Safety
2.3.1. Adverse Events and Adverse Drug Reactions
Analysis Stratified by Presence or Absence of Statin
Analysis Stratified by Presence or Absence of Renal Dysfunction in the “with-Statin” Group
2.3.2. Safety Evaluation Using Cutoff Values for AST, ALT, sCr, and CK
Analysis Stratified by Presence or Absence of a Statin
Analysis Stratified by Presence or Absence of Renal Dysfunction in the “with-Statin” Groups
2.3.3. Renal Function, CK, and Liver Function
Analysis by Presence or Absence of Statin
Analysis by Presence or Absence of Renal Dysfunction in “with-Statin” Groups
3. Discussion
4. Subjects and Methods
5. Conclusions
Supplementary Materials
Author Contributions
Funding
Acknowledgments
Conflicts of Interest
Abbreviations
| Abbreviation | Expansion |
| ABCA1 | ATP-binding cassette transporter A1 |
| ABCG1 | ATP-binding cassette transporter G1 |
| ADRs | adverse drug reactions |
| AEs | adverse events |
| ALP | alkaline phosphatase |
| ALT | alanine aminotransferase |
| ANCOVA | analysis of covariance |
| ATP | adenosine triphosphate |
| Apo | apolipoprotein |
| AST | aspartate aminotransferase |
| BMI | body mass index |
| CEC | cholesterol efflux capacity |
| CK | creatine kinase |
| CKD | chronic kidney disease |
| CM-C | chylomicron-cholesterol |
| CV | cardiovascular |
| eGFR | estimated glomerular filtration rate |
| FAS | full analysis set |
| FDA | Food and Drug Administration |
| FGF21 | fibroblast growth factor 21 |
| Hb | hemoglobin |
| HDL-C | high-density lipoprotein-cholesterol |
| HPLC | high-performance liquid chromatography |
| IL | interleukin |
| LDL-C | low-density lipoprotein-cholesterol |
| LOCF | last observation carried forward |
| LPL | lipoprotein lipase |
| LS | least squares |
| mRNA | messenger ribonucleic acid |
| NPC1L1 | Niemann-Pick C 1-Like-1 |
| PPARα | peroxisome proliferator-activated receptor α |
| RemL-C | remnant lipoprotein-cholesterol |
| sCr | serum creatinine |
| SPPARMα | selective peroxisome proliferator-activated receptor α modulator |
| TC | total cholesterol |
| TG | triglyceride |
| VCAM-1 | vascular cell adhesion molecule-1 |
| VLDL-C | very-low-density lipoprotein-cholesterol |
| γ-GT | gamma-glutamyltransferase |
References
- Pencina, M.; D’Agostino, R.B., Sr.; Larson, M.G.; Massaro, J.M.; Vasan, R.S. Predicting the 30-year risk of cardiovascular disease: The Framingham heart study. Circulation 2009, 119, 3078–3084. [Google Scholar] [CrossRef] [PubMed]
- Scandinavian Simvastatin Study Group. Randomised trial of cholesterol lowering in 4444 patients with coronary heart disease: The Scandinavian simvastatin survival study (4S). Lancet 1994, 334, 1383–1389. [Google Scholar]
- Baigent, C.; Blackwell, L.; Emberson, J.; Holland, L.E.; Reith, C.; Bhala, N.; Peto, R.; Barnes, E.H.; Keech, A.; Simes, J.; et al. Efficacy and safety of more intensive lowering of LDL cholesterol: A meta-analysis of data from 170 000 participants in 26 randomised trials. Lancet 2010, 376, 1670–1681. [Google Scholar] [PubMed]
- Fulcher, J.; O’Connell, R.; Voysey, M.; Emberson, J.; Blackwell, L.; Mihaylova, B.; Simes, J.; Collins, R.; Kirby, A.; Colhoun, H.; et al. Efficacy and safety of LDL-lowering therapy among men and women: Meta-analysis of individual data from 174 000 participants in 27 randomised trials. Lancet 2015, 385, 1397–1405. [Google Scholar]
- Schwartz, G.G.; Abt, M.; Bao, W.; Demicco, D.; Kallend, D.; Miller, M.; Mundl, H.; Olsson, A.G. Fasting triglycerides predict recurrent ischemic events in patients with acute coronary syndrome treated with statins. J. Am. Coll. Cardiol. 2015, 65, 2267–2275. [Google Scholar] [CrossRef]
- Okopień, B.; Buldak, L.; Bołdys, A. Fibrates in the management of atherogenic dyslipidemia. Expert Rev. Cardiovasc. Ther. 2017, 15, 913–921. [Google Scholar] [CrossRef]
- Fruchart, J.-C. Pemafibrate (K-877), a novel selective peroxisome proliferator-activated receptor alpha modulator for management of atherogenic dyslipidaemia. Cardiovasc. Diabetol. 2017, 16, 124. [Google Scholar] [CrossRef]
- Yamashita, S.; Masuda, D.; Matsuzawa, Y. Clinical applications of a novel selective PPARα modulator, pemafibrate, in dyslipidemia and metabolic diseases. J. Atheroscler. Thromb. 2019, 26, 389–402. [Google Scholar] [CrossRef]
- Raza-Iqbal, S.; Tanaka, T.; Anai, M.; Inagaki, T.; Matsumura, Y.; Ikeda, K.; Taguchi, A.; Gonzalez, F.J.; Sakai, J.; Kodama, T. Transcriptome analysis of K-877 (a novel selective PPARα Modulator (SPPARMα))-Regulated genes in primary human hepatocytes and the mouse liver. J. Atheroscler. Thromb. 2015, 22, 754–772. [Google Scholar] [CrossRef]
- Yamamoto, Y.; Takei, K.; Arulmozhiraja, S.; Sladek, V.; Matsuo, N.; Han, S.I.; Matsuzaka, T.; Sekiya, M.; Tokiwa, T.; Shoji, M.; et al. Molecular association model of PPARalpha and its new specific and efficient ligand, pemafibrate: Structural basis for SPPARMalpha. Biochem. Biophys. Res. Commun. 2018, 499, 239–245. [Google Scholar] [CrossRef]
- Arai, H.; Yamashita, S.; Yokote, K.; Araki, E.; Suganami, H.; Ishibashi, S. Efficacy and safety of pemafibrate versus fenofibrate in patients with high triglyceride and low HDL cholesterol levels: A multicenter, placebo-controlled, double-blind, randomized trial. J. Atheroscler. Thromb. 2018, 25, 521–538. [Google Scholar] [CrossRef] [PubMed]
- Ishibashi, S.; Arai, H.; Yokote, K.; Araki, E.; Suganami, H.; Yamashita, S. Efficacy and safety of pemafibrate (K-877), a selective peroxisome proliferator-activated receptor alpha modulator, in patients with dyslipidemia: Results from a 24-week, randomized, double blind, active-controlled, phase 3 trial. J. Clin. Lipidol. 2018, 12, 173–184. [Google Scholar] [CrossRef] [PubMed]
- Hounslow, N.; Mair, S.; Suganami, H.; Nakamura, M. Pemafibrate has high bioavailability and is principally excreted via the liver. Atheroscler. Suppl. 2018, 32, 157. [Google Scholar] [CrossRef]
- Hosford, D.; Gordon, G.; Suganami, H.; Nakamura, M. The plasma concentration and pharmacokinetic parameters of pemafibrate did not increase in a creatinine clearance-dependent manner. Atheroscler. Suppl. 2018, 32, 150. [Google Scholar] [CrossRef]
- Yokote, K.; Yamashita, S.; Arai, H.; Araki, E.; Suganami, H.; Ishibashi, S. Long-term efficacy and safety of pemafibrate, a novel selective peroxisome proliferator-activated receptor-α modulator (SPPARMα), in dyslipidemic patients with renal impairment. Int. J. Mol. Sci. 2019, 20, 706. [Google Scholar] [CrossRef]
- Hounslow, N.; Suganami, H.; Nakamura, M. Pemafibrate minimally affected the systemic exposure of statins, and vice versa, in healthy male volunteers. Atheroscler. Suppl. 2018, 32, 156–157. [Google Scholar] [CrossRef]
- Ishibashi, S.; Yamashita, S.; Arai, H.; Araki, E.; Yokote, K.; Suganami, H.; Fruchart, J.-C.; Kodama, T. Effects of K-877, a novel selective PPARα modulator (SPPARMα), in dyslipidaemic patients: A randomized, double blind, active- and placebo-controlled, phase 2 trial. Atherosclerosis 2016, 249, 36–43. [Google Scholar] [CrossRef]
- Arai, H.; Yamashita, S.; Yokote, K.; Araki, E.; Suganami, H.; Ishibashi, S. Efficacy and safety of K-877, a novel selective peroxisome proliferator-activated receptor α modulator (SPPARMα), in combination with statin treatment: Two randomised, double-blind, placebo-controlled clinical trials in patients with dyslipidaemia. Atherosclerosis 2017, 261, 144–152. [Google Scholar] [CrossRef]
- Araki, E.; Yamashita, S.; Arai, H.; Yokote, K.; Satoh, J.; Inoguchi, T.; Nakamura, J.; Maegawa, H.; Yoshioka, N.; Tanizawa, Y.; et al. Effect of pemafibrate, a novel selective PPARα modulator, on lipid and glucose metabolism in patients with type 2 diabetes and hypertriglyceridemia: A randomized, double-blind, placebo-controlled, phase 3 trial. Diabetes Care 2018, 41, 538–546. [Google Scholar] [CrossRef]
- Matsuba, I.; Matsuba, R.; Ishibashi, S.; Yamashita, S.; Arai, H.; Yokote, K.; Suganami, H.; Araki, E. Effects of a novel selective peroxisome proliferator-activated receptor-α modulator, pemafibrate, on hepatic and peripheral glucose uptake in patients with hypertriglyceridemia and insulin resistance. J. Diabetes. Investig. 2018, 9, 1323–1332. [Google Scholar] [CrossRef]
- Okazaki, M.; Yamashita, S. Recent advances in analytical methods on lipoprotein subclasses: Calculation of particle numbers from lipid levels by gel permeation HPLC using “spherical particle model”. J. Oleo Sci. 2016, 65, 265–282. [Google Scholar] [CrossRef] [PubMed]
- Yamashita, S.; Arai, H.; Yokote, K.; Araki, E.; Suganami, H.; Ishibashi, S. Effects of pemafibrate (K-877) on cholesterol efflux capacity and postprandial hyperlipidemia in patients with atherogenic dyslipidemia. J. Clin. Lipidol. 2018, 12, 1267–1279.e4. [Google Scholar] [CrossRef] [PubMed]
- Hennuyer, N.; Duplan, I.; Paquet, C.; Vanhoutte, J.; Woitrain, E.; Touche, V.; Colin, S.; Vallez, E.; Lestavel, S.; Lefebvre, P. The novel selective PPARα modulator (SPPARMα) pemafibrate improves dyslipidemia, enhances reverse cholesterol transport and decreases inflammation and atherosclerosis. Atherosclerosis 2016, 249, 200–208. [Google Scholar] [CrossRef] [PubMed]
- Sakai, N.; Uchida, Y.; Ohashi, K.; Hibuse, T.; Saika, Y.; Tomari, Y.; Kihara, S.; Hiraoka, H.; Nakamura, T.; Ito, S.; et al. Measurement of fasting serum apoB-48 levels in normolipidemic and hyperlipidemic subjects by ELISA. J. Lipid Res. 2003, 44, 1256–1262. [Google Scholar] [CrossRef]
- Masuda, D.; Sakai, N.; Sugimoto, T.; Kitazume-Taneike, R.; Yamashita, T.; Kawase, R.; Nakaoka, H.; Inagaki, M.; Nakatani, K.; Yuasa-Kawase, M.; et al. Fasting serum apolipoprotein B-48 can be a marker of postprandial hyperlipidemia. J Atheroscler Thromb. 2011, 18, 1062–1070. [Google Scholar] [CrossRef]
- Sairyo, M.; Kobayashi, T.; Masuda, D.; Kanno, K.; Zhu, Y.; Okada, T.; Koseki, M.; Ohama, T.; Nishida, M.; Sakata, Y.; et al. A novel selective PPARα modulator (SPPARMα), K-877 (Pemafibrate), attenuates postprandial hypertriglyceridemia in mice. J. Atheroscler. Thromb. 2018, 25, 142–152. [Google Scholar] [CrossRef]
- Takei, K.; Nakagawa, Y.; Wang, Y.; Han, S.I.; Satoh, A.; Sekiya, M.; Matsuzaka, T.; Shimano, H. Effects of K-877, a novel selective PPARα modulator, on small intestine contribute to the amelioration of hyperlipidemia in low-density lipoprotein receptor knockout mice. J. Pharmacol. Sci. 2017, 133, 214–222. [Google Scholar] [CrossRef]
- Ginsberg, H.N.; Le, N.A.; Goldberg, I.J.; Gibson, J.C.; Rubinstein, A.; Wang-Iverson, P.; Norum, R.; Brown, W.V. Apolipoprotein B metabolism in subjects with deficiency of apolipoproteins CIII and AI. Evidence that apolipoprotein CIII inhibits catabolism of triglyceride-rich lipoproteins by lipoprotein lipase in vivo. J. Clin. Investig. 1986, 78, 1287–1295. [Google Scholar] [CrossRef]
- Kaptoge, S.; Di Angelantonio, E.; Pennells, L.; Wood, A.M. C-reactive protein, fibrinogen, and cardiovascular disease prediction. N. Engl. J. Med. 2012, 367, 1310–1320. [Google Scholar]
- Pradhan, A.D.; Paynter, N.P.; Everett, B.M.; Glynn, R.J.; Amarenco, P.; Elam, M.; Ginsberg, H.; Hiatt, W.R.; Ishibashi, S.; Koenig, W.; et al. Rationale and design of the pemafibrate to reduce cardiovascular outcomes by reducing triglycerides in patients with diabetes (PROMINENT) study. Am. Heart J. 2018, 206, 80–93. [Google Scholar] [CrossRef]
- Backman, J.T.; Kyrklund, C.; Neuvonen, M.; Neuvonen, P.J. Gemfibrozil greatly increases plasma concentrations of cerivastatin. Clin. Pharmacol. Ther. 2002, 72, 685–691. [Google Scholar] [CrossRef] [PubMed]
- Jacobson, T.A. Myopathy with statin–fibrate combination therapy: Clinical considerations. Nat. Rev. Endocrinol. 2009, 5, 507–518. [Google Scholar] [CrossRef] [PubMed]
- Jones, P.H.; Davidson, M.H. Reporting rate of rhabdomyolysis with fenofibrate+ statin versus gemfibrozil+ any statin. Am. J. Cardiol. 2005, 95, 120–122. [Google Scholar] [CrossRef] [PubMed]
- Ginsberg, H.N.; Elam, M.B.; Lovato, L.C.; Crouse, J.R., 3rd; Leiter, L.A.; Linz, P.; Friedewald, W.T.; Buse, J.B.; Gerstein, H.C.; Probstfield, J.; et al. Effects of combination lipid therapy in type 2 diabetes mellitus. N. Engl. J. Med. 2010, 362, 1563–1574. [Google Scholar]
- Davidson, M.H.; Rosenson, R.S.; Maki, K.C.; Nicholls, S.J.; Ballantyne, C.M.; Mazzone, T.; Carlson, D.M.; Williams, L.A.; Kelly, M.T.; Camp, H.S. Effects of fenofibric acid on carotid intima-media thickness in patients with mixed dyslipidemia on atorvastatin therapy: Randomized, placebo-controlled study (FIRST). Arterioscler. Thromb. Vasc. Biol. 2014, 34, 1298–1306. [Google Scholar] [CrossRef]
- Davidson, M.H.; Armani, A.; McKenney, J.M.; Jacobson, T.A. Safety considerations with fibrate therapy. Am. J. Cardiol. 2007, 99, S3–S18. [Google Scholar] [CrossRef]
- Halstenson, C.E.; Triscari, J.; DeVault, A.; Shapiro, B.; Keane, W.; Pan, H. Single-dose pharmacokinetics of pravastatin and metabolites in patients with renal impairment. J. Clin. Pharmacol. 1992, 32, 124–132. [Google Scholar] [CrossRef]
- Stern, R.; Yang, B.B.; Horton, M.; Moore, S.; Abel, R.; Olson, S. Renal dysfunction does not alter the pharmacokinetics or LDL-cholesterol reduction of atorvastatin. J. Clin. Pharmacol. 1997, 37, 816–819. [Google Scholar] [CrossRef]
- Morgan, R.E.; Campbel, S.E.; Yu, C.Y.; Sponseller, C.A.; Muster, H.A. Comparison of the safety, tolerability, and pharmacokinetic profile of a single oral dose of pitavastatin 4 mg in adult subjects with severe renal impairment not on hemodialysis versus healthy adult subjects. J. Cardiovasc. Pharmacol. 2012, 60, 42–48. [Google Scholar] [CrossRef]
- Birmingham, B.K.; Swan, S.K.; Puchalski, T.; Mitchell, P.; Azumaya, C.; Zalikowski, J.; Wang, Y. Pharmacokinetic and pharmacodynamic profile of rosuvastatin in patients with end-stage renal disease on chronic haemodialysis. Clin. Drug Investig. 2013, 33, 233–241. [Google Scholar] [CrossRef]
- Kwan, B.C.; Kronenberg, F.; Beddhu, S.; Cheung, A.K. Lipoprotein metabolism and lipid management in chronic kidney disease. J. Am. Soc. Nephrol. 2007, 18, 1246–1261. [Google Scholar] [CrossRef] [PubMed]
- Harper, C.R.; Jacobson, T.A. Managing dyslipidemia in chronic kidney disease. J. Am. Coll. Cardiol. 2008, 51, 2375–2384. [Google Scholar] [CrossRef] [PubMed]
- Palmer, S.C.; Craig, J.C.; Navaneethan, S.D.; Tonelli, M.; Pellegrini, F.; Strippoli, G.F. Benefits and harms of statin therapy for persons with chronic kidney disease: A systematic review and meta-analysis. Ann. Intern. Med. 2012, 157, 263–275. [Google Scholar] [CrossRef] [PubMed]
- Wanner, C.; Krane, V.; März, W.; Olschewski, M.; Mann, J.F.E.; Ruf, G.; Ritz, E.; for the German Diabetes and Dialysis Study Investigators. Atorvastatin in patients with type 2 diabetes mellitus undergoing hemodialysis. N. Eng. J. Med. 2005, 353, 238–248. [Google Scholar] [CrossRef] [PubMed]
- Fellström, B.; Jardine, A.G.; Schmieder, R.E.; Holdaas, H.; Bannister, K.; Beutler, J.; Chae, D.W.; Chevaile, A.; Cobbe, S.M.; Groönhagen-Riska, C.; et al. Rosuvastatin and cardiovascular events in patients undergoing hemodialysis. N. Eng. J. Med. 2009, 360, 1395–1407. [Google Scholar]
- Baigent, C.; Landray, M.J.; Reith, C.; Emberson, J.; Wheeler, D.C.; Tomson, C.; Wanner, C.; Krane, V.; Cass, A.; Craig, J.; et al. The effects of lowering LDL cholesterol with simvastatin plus ezetimibe in patients with chronic kidney disease (Study of Heart and Renal Protection): A randomised placebo-controlled trial. Lancet 2011, 377, 2181–2192. [Google Scholar] [CrossRef]
- Matsushita, K.; van der Velde, M.; Astor, B.C.; Woodward, M.; Levey, A.S.; de Jong, P.E.; Coresh, J.; Gansevoort, R.T.; (Chronic Kidney Disease Prognosis Consortium). Association of estimated glomerular filtration rate and albuminuria with all-cause and cardiovascular mortality in general population cohorts: A collaborative meta-analysis. Lancet 2010, 375, 2073–2081. [Google Scholar]
- Keith, D.S.; Nichols, G.A.; Gullion, C.M.; Brown, J.B.; Smith, D.H. Longitudinal follow-up and outcomes among a population with chronic kidney disease in a large managed care organization. Arch. Intern. Med. 2004, 164, 659–663. [Google Scholar] [CrossRef]
- Matsuo, S.; Imai, E.; Horio, M.; Yasuda, Y.; Tomita, K.; Nitta, K.; Yamagata, K.; Tomino, Y.; Yokoyama, H.; Hishida, A. Revised equations for estimated GFR from serum creatinine in Japan. Am. J. Kidney Dis. 2009, 53, 982–992. [Google Scholar] [CrossRef]


| Parameter | With Statin | Without Statin | ||||||||
|---|---|---|---|---|---|---|---|---|---|---|
| Placebo | Pemafibrate | All | Placebo | Pemafibrate | All | |||||
| 0.1 mg/day | 0.2 mg/day | 0.4 mg/day | 0.1 mg/day | 0.2 mg/day | 0.4 mg/day | |||||
| n | 178 | 45 | 382 | 72 | 677 | 120 | 82 | 202 | 172 | 576 |
| Age (years) | 56.9 (11.4) | 55.0 (10.3) | 56.9 (11.1) | 55.7 (11.1) | 56.6 (11.1) | 52.0 (10.6) | 50.0 (11.3) | 52.0 (11.4) | 51.6 (11.1) | 51.6 (11.1) |
| Age ≥ 65 years | 44 (24.7) | 7 (15.6) | 103 (27.0) | 13 (18.1) | 167 (24.7) | 18 (15.0) | 9 (11.0) | 27 (13.4) | 27 (15.7) | 81 (14.1) |
| Sex, Female | 38 (21.3) | 9 (20.0) | 73 (19.1) | 14 (19.4) | 134 (19.8) | 15 (12.5) | 2 (2.4) | 21 (10.4) | 12 (7.0) | 50 (8.7) |
| Body weight (kg) | 74.73 (14.05) | 75.76 (12.58) | 74.35 (14.14) 1 | 73.03 (13.05) | 74.40 (13.89) 2 | 75.75 (12.45) | 77.15 (11.74) | 76.82 (13.43) | 74.88 (12.20) | 76.07 (12.64) |
| BMI (kg/m2) | 27.22 (3.71) | 27.38 (3.70) | 27.18 (4.01) 1 | 26.35 (3.43) | 27.12 (3.85) 2 | 26.45 (3.41) | 26.88 (3.57) | 26.87 (3.60) | 26.21 (3.46) | 26.59 (3.52) |
| BMI ≥ 25 kg/m2 | 125 (70.2) | 34 (75.6) | 257 (67.3) | 43 (59.7) | 459 (67.8) | 75 (62.5) | 53 (64.6) | 131 (64.9) | 102 (59.3) | 361 (62.7) |
| Type 2 diabetes | 72 (40.4) | 15 (33.3) | 154 (40.3) | 39 (54.2) | 280 (41.4) | 44 (36.7) | 8 (9.8) | 65 (32.2) | 52 (30.2) | 169 (29.3) |
| Hypertension | 107 (60.1) | 20 (44.4) | 251 (65.7) | 43 (59.7) | 421 (62.2) | 42 (35.0) | 23 (28.0) | 71 (35.1) | 45 (26.2) | 181 (31.4) |
| Fatty liver | 106 (59.6) | 13 (28.9) | 235 (61.5) | 27 (37.5) | 381 (56.3) | 37 (30.8) | 15 (18.3) | 60 (29.7) | 41 (23.8) | 153 (26.6) |
| Pravastatin | 22 (12.4) | 0 | 49 (12.8) | 0 | 71 (10.5) | 0 | 0 | 0 | 0 | 0 |
| Simvastatin | 5 (2.8) | 0 | 7 (1.8) | 1 (1.4) | 13 (1.9) | 0 | 0 | 0 | 0 | 0 |
| Fluvastatin | 4 (2.2) | 0 | 8 (2.1) | 4 (5.6) | 16 (2.4) | 0 | 0 | 0 | 0 | 0 |
| Atorvastatin | 30 (16.9) | 0 | 76 (19.9) 3 | 3 (4.2) | 109 (16.1) | 0 | 0 | 0 | 0 | 0 |
| Pitavastatin | 73 (41.0) | 45 (100) | 134 (35.1) | 57 (79.2) | 309 (45.6) | 0 | 0 | 0 | 0 | 0 |
| Rosuvastatin | 44 (24.7) 4 | 0 | 108 (28.3) 3 | 7 (9.7) | 159 (23.5) | 0 | 0 | 0 | 0 | 0 |
| TG (mmol/L) | 3.78 (1.72) | 3.88 (1.43) | 3.69 (1.52) | 3.62 (1.35) | 3.72 (1.55) | 3.69 (1.36) | 3.71 (1.08) | 3.80 (1.60) | 3.75 (1.61) | 3.75 (1.49) |
| HDL-C (mmol/L) | 1.18 (0.27) | 1.25 (0.22) | 1.19 (0.26) | 1.19 (0.22) | 1.19 (0.26) | 1.07 (0.19) | 1.01 (0.14) | 1.04 (0.19) | 1.07 (0.44) | 1.05 (0.28) |
| LDL-C (mmol/L) | 2.89 (0.76) | 3.24 (0.51) | 2.85 (0.78) | 3.10 (0.61) | 2.91 (0.75) | 3.61 (0.87) | 3.39 (0.96) | 3.49 (0.96) | 3.49 (0.97) | 3.50 (0.95) |
| HbA1c (%) | 6.39 (0.76) | 6.31 (0.61) | 6.42 (0.85) | 6.60 (0.65) | 6.43 (0.80) | 6.17 (0.78) | 5.69 (0.59) | 6.11 (0.74) | 6.09 (0.76) | 6.06 (0.75) |
| eGFR 5 (mL/min/1.73 m2) | 76.4 (18.5) | 78.2 (17.6) | 77.8 (16.7) | 78.1 (17.0) | 77.5 (17.3) | 78.7 (15.4) | 75.9 (14.5) | 79.2 (15.7) | 78.9 (15.3) | 78.5 (15.3) |
| (A) With Statin | |||||
| Parameter | Placebo | Pemafibrate | |||
| 0.1 mg/day | 0.2 mg/day | 0.4 mg/day | |||
| TG (mmol/L) | n | 178 | 45 | 382 | 72 |
| Baseline | 3.78 (1.72) | 3.88 (1.43) | 3.69 (1.52) | 3.62 (1.35) | |
| Week 12 (LOCF) | 3.74 (4.73) | 2.12 (1.22) | 1.83 (0.97) | 1.72 (0.87) | |
| % Change | −2.0 (−7.0, 3.1) | −45.1 (−55.1, −35.1) *** | −48.5 (−51.9, −45.1) *** | −50.0 (−57.9, −42.1) *** | |
| HDL-C (mmol/L) | n | 178 | 45 | 382 | 72 |
| Baseline | 1.18 (0.27) | 1.25 (0.22) | 1.19 (0.26) | 1.19 (0.22) | |
| Week 12 (LOCF) | 1.20 (0.29) | 1.41 (0.33) | 1.38 (0.33) | 1.31 (0.25) | |
| % Change | 1.7 (−0.4, 3.9) | 13.2 (8.9, 17.4) *** | 16.5 (15.1, 18.0) *** | 11.9 (8.5, 15.2) *** | |
| LDL-C (mmol/L) | n | 178 | 45 | 382 | 72 |
| Baseline | 2.89 (0.76) | 3.24 (0.51) | 2.85 (0.78) | 3.10 (0.61) | |
| Week 12 (LOCF) | 2.82 (0.79) | 3.22 (0.83) | 2.99 (0.72) | 3.17 (0.85) | |
| % Change | −1.8 (−5.3, 1.7) | 5.2 (−1.8, 12.1) | 8.8 (6.4, 11.2) *** | 7.0 (1.5, 12.5) ** | |
| Non-HDL-C (mmol/L) | n | 178 | 45 | 382 | 72 |
| Baseline | 4.05 (0.70) | 4.43 (0.56) | 3.99 (0.74) | 4.24 (0.68) | |
| Week 12 (LOCF) | 3.94 (1.34) | 3.92 (0.95) | 3.62 (0.77) | 3.83 (0.96) | |
| % Change | −2.5 (−5.3, 0.3) | −9.7 (−15.3, −4.1) * | −8.7 (−10.6, −6.8) *** | −8.0 (−12.4, −3.5) * | |
| TC (mmol/L) | n | 178 | 45 | 382 | 72 |
| Baseline | 5.23 (0.77) | 5.68 (0.60) | 5.18 (0.79) | 5.43 (0.69) | |
| Week 12 (LOCF) | 5.14 (1.31) | 5.33 (0.99) | 5.00 (0.75) | 5.14 (0.89) | |
| % Change | −1.6 (−3.7, 0.5) | −3.8 (−8.1, 0.4) | −3.1 (−4.5, −1.6) | −3.6 (−6.9, −0.3) | |
| RemL-C (mmol/L) | n | 44 | 44 | 49 | 47 |
| Baseline | 0.66 (0.38) | 0.61 (0.36) | 0.64 (0.45) | 0.69 (0.44) | |
| Week 12 (LOCF) | 0.62 (0.31) | 0.32 (0.25) | 0.26 (0.17) | 0.28 (0.23) | |
| % Change | 13.9 (0.8, 26.9) | −42.5 (−55.6, −29.5) *** | −49.2 (−61.5, −36.8) *** | −50.0 (−62.6, −37.3) *** | |
| ApoAI (mg/dL) | n | 148 | 44 | 361 | 47 |
| Baseline | 138.4 (21.9) | 142.4 (16.9) | 136.6 (21.1) | 136.2 (16.9) | |
| Week 12 (LOCF) | 137.0 (22.1) | 146.0 (21.3) | 142.7 (19.5) | 137.5 (16.2) | |
| % Change | −0.6 (−2.0, 0.7) | 3.2 (0.7, 5.8) ** | 4.9 (4.1, 5.8) *** | 1.6 (−0.9, 4.0) | |
| (A) With Statin | |||||
| Parameter | Placebo | Pemafibrate | |||
| 0.1 mg/day | 0.2 mg/day | 0.4 mg/day | |||
| ApoAII (mg/dL) | n | 148 | 44 | 361 | 47 |
| Baseline | 32.0 (4.8) | 33.7 (4.6) | 31.8 (4.9) | 32.6 (4.4) | |
| Week 12 (LOCF) | 31.9 (5.1) | 39.9 (8.5) | 40.1 (7.2) | 41.8 (7.2) | |
| % Change | −0.3 (−2.7, 2.2) | 18.9 (14.4, 23.4) *** | 26.8 (25.3, 28.4) *** | 29.1 (24.8, 33.5) *** | |
| ApoB (mg/dL) | n | 148 | 44 | 361 | 47 |
| Baseline | 98.7 (17.9) | 105.8 (13.0) | 96.1 (19.0) | 103.6 (12.9) | |
| Week 12 (LOCF) | 94.0 (16.6) | 96.9 (21.1) | 89.8 (18.7) | 94.7 (17.9) | |
| % Change | −3.7 (−6.2, −1.2) | −5.8 (−10.5, −1.2) | −5.8 (−7.5, −4.2) | −5.9 (−10.3, −1.4) | |
| ApoB48 (μg/mL) | n | 46 | 45 | 49 | 47 |
| Baseline | 13.9 (10.2) | 11.0 (7.0) | 12.5 (13.8) | 12.1 (7.7) | |
| Week 12 (LOCF) | 14.2 (15.3) | 5.7 (4.5) | 4.3 (3.2) | 4.5 (4.0) | |
| % Change | 27.3 (10.7, 43.9) | −45.5 (−62.3, −28.7) *** | −55.1 (−71.2, −39.0) *** | −59.7 (−76.1, −43.3) *** | |
| ApoB100 (mg/dL) | n | 44 | 44 | 49 | 47 |
| Baseline | 102.7 (17.6) | 104.7 (12.8) | 104.5 (18.8) | 102.4 (12.8) | |
| Week 12 (LOCF) | 98.7 (16.9) | 96.3 (20.9) | 94.9 (18.9) | 94.2 (17.7) | |
| % Change | −3.6 (−8.2, 1.0) | −7.7 (−12.3, −3.2) | −7.4 (−11.8, −3.1) | −7.5 (−11.9, −3.0) | |
| ApoCII (mg/dL) | n | 148 | 44 | 361 | 47 |
| Baseline | 8.1 (2.6) | 8.2 (3.0) | 8.2 (2.5) | 8.6 (2.1) | |
| Week 12 (LOCF) | 7.9 (2.2) | 6.7 (2.4) | 6.4 (2.2) | 6.4 (2.5) | |
| % Change | −0.2 (−3.7, 3.3) | −16.0 (−22.3, −9.6) *** | −20.6 (−22.8, −18.4) *** | −24.5 (−30.7, −18.4) *** | |
| ApoCIII (mg/dL) | n | 148 | 44 | 361 | 47 |
| Baseline | 17.7 (6.4) | 17.5 (6.7) | 17.1 (5.6) | 18.3 (5.2) | |
| Week 12 (LOCF) | 16.9 (5.8) | 12.8 (5.6) | 11.1 (3.9) | 10.6 (3.7) | |
| % Change | −0.3 (−3.6, 3.0) | −25.0 (−31.0, −18.9) *** | −33.2 (−35.3, −31.1) *** | −38.1 (−44.0, −32.3) *** | |
| ApoCIII/ApoCII | n | 148 | 44 | 361 | 47 |
| Baseline | 2.2 (0.5) | 2.2 (0.5) | 2.1 (0.5) | 2.2 (0.5) | |
| Week 12 (LOCF) | 2.2 (0.5) | 2.0 (0.5) | 1.8 (0.4) | 1.7 (0.4) | |
| % Change | 0.6 (−2.0, 3.2) | −8.5 (−13.3, −3.7) ** | −14.6 (−16.3, −12.9) *** | −17.9 (−22.6, −13.3) *** | |
| (A) With Statin | |||||
| Parameter | Placebo | Pemafibrate | |||
| 0.1 mg/day | 0.2 mg/day | 0.4 mg/day | |||
| ApoE (mg/dL) | n | 148 | 44 | 361 | 47 |
| Baseline | 5.4 (2.0) | 5.3 (2.2) | 5.2 (1.7) | 5.5 (2.1) | |
| Week 12 (LOCF) | 5.2 (1.6) | 4.2 (1.2) | 4.0 (0.9) | 4.0 (1.1) | |
| % Change | 1.0 (−2.1, 4.1) | −13.7 (−19.4, −8.1) *** | −19.6 (−21.6, −17.6) *** | −20.3 (−25.8, −14.9) *** | |
| Fibrinogen (mg/dL) | n | 177 | 45 | 381 | 72 |
| Baseline | 285.8 (49.0) | 278.6 (48.7) | 287.8 (54.1) | 285.3 (46.9) | |
| Week 12 (LOCF) | 288.8 (50.1) | 251.6 (51.1) | 242.1 (54.8) | 229.2 (43.0) | |
| Change | 2.8 (−3.7, 9.2) | −30.5 (−43.4, −17.7) *** | −45.1 (−49.5, −40.7) *** | −56.6 (−66.8, −46.5) *** | |
| FGF21 (pg/mL) | n | 46 | 45 | 49 | 47 |
| Baseline | 601.7 (875.8) | 429.8 (160.8) | 411.4 (182.7) | 692.3 (1482.8) | |
| Week 12 (LOCF) | 478.4 (262.3) | 718.2 (498.0) | 743.0 (402.0) | 1156.0 (2107.2) | |
| Change | −125.5 (−317.2, 66.1) | 291.6 (97.7, 485.5) ** | 335.4 (149.4, 521.4) *** | 458.7 (268.4, 648.9) *** | |
| (B) Without Statin | |||||
| Parameter | Placebo | Pemafibrate | |||
| 0.1 mg/day | 0.2 mg/day | 0.4 mg/day | |||
| TG (mmol/L) | n | 120 | 82 | 202 | 172 |
| Baseline | 3.69 (1.36) | 3.71 (1.08) | 3.80 (1.60) | 3.75 (1.61) | |
| Week 12 (LOCF) | 3.72 (2.62) | 2.01 (1.02) | 1.94 (1.00) | 1.72 (0.81) | |
| % Change | 1.2 (−4.5, 6.9) | −44.5 (−51.4, −37.6) *** | −45.5 (−49.9, −41.1) *** | −51.3 (−56.1, −46.5) *** | |
| HDL−C (mmol/L) | n | 120 | 82 | 202 | 172 |
| Baseline | 1.07 (0.19) | 1.01 (0.14) | 1.04 (0.19) | 1.07 (0.44) | |
| Week 12 (LOCF) | 1.08 (0.24) | 1.21 (0.23) | 1.24 (0.25) | 1.24 (0.34) | |
| % Change | 0.8 (−2.0, 3.6) | 19.1 (15.7, 22.5) *** | 19.7 (17.5, 21.9) *** | 17.8 (15.5, 20.2) *** | |
| LDL−C (mmol/L) | n | 120 | 82 | 202 | 172 |
| Baseline | 3.61 (0.87) | 3.39 (0.96) | 3.49 (0.96) | 3.49 (0.97) | |
| Week 12 (LOCF) | 3.52 (0.86) | 3.48 (0.88) | 3.71 (0.95) | 3.66 (0.85) | |
| % Change | 0.6 (−3.7, 5.0) | 5.0 (−0.3, 10.3) | 11.0 (7.7, 14.4) *** | 9.7 (6.0, 13.3) ** | |
| Non-HDL-C (mmol/L) | n | 120 | 82 | 202 | 172 |
| Baseline | 4.80 (0.79) | 4.57 (0.92) | 4.74 (0.95) | 4.67 (0.96) | |
| Week 12 (LOCF) | 4.71 (0.81) | 4.15 (0.92) | 4.39 (1.08) | 4.31 (0.91) | |
| % Change | −1.0 (−3.6, 1.5) | −8.7 (−11.9, −5.6) *** | −6.8 (−8.8, −4.8) *** | −6.6 (−8.8, −4.5) ** | |
| (B) Without Statin | |||||
| Parameter | Placebo | Pemafibrate | |||
| 0.1 mg/day | 0.2 mg/day | 0.4 mg/day | |||
| TC (mmol/L) | n | 120 | 82 | 202 | 172 |
| Baseline | 5.88 (0.83) | 5.59 (0.97) | 5.79 (0.98) | 5.75 (1.02) | |
| Week 12 (LOCF) | 5.79 (0.82) | 5.37 (0.92) | 5.63 (1.07) | 5.55 (0.91) | |
| % Change | −0.7 (−2.7, 1.4) | −4.0 (−6.5, −1.5) * | −2.1 (−3.7, −0.5) | −2.3 (−4.0, −0.6) | |
| RemL-C (mmol/L) | n | 86 | 82 | 159 | 139 |
| Baseline | 0.59 (0.30) | 0.58 (0.30) | 0.66 (0.43) | 0.65 (0.45) | |
| Week 12 (LOCF) | 0.67 (0.39) | 0.30 (0.19) | 0.30 (0.20) | 0.26 (0.15) | |
| % Change | 24.3 (15.8, 32.9) | −46.6 (−55.4, −37.9) *** | −46.2 (−52.4, −39.9) *** | −48.6 (−55.3, −41.9) *** | |
| ApoAI (mg/dL) | n | 86 | 82 | 161 | 139 |
| Baseline | 125.7 (12.2) | 126.1 (10.7) | 127.6 (13.3) | 124.8 (12.4) | |
| Week 12 (LOCF) | 125.3 (11.4) | 133.5 (14.0) | 136.8 (15.5) | 134.8 (16.0) | |
| % Change | 0.0 (−2.0, 1.9) | 6.0 (4.0, 8.0) *** | 7.8 (6.4, 9.3) *** | 8.1 (6.5, 9.6) *** | |
| ApoAII (mg/dL) | n | 86 | 82 | 161 | 139 |
| Baseline | 29.8 (2.9) | 29.4 (3.7) | 30.3 (3.8) | 29.4 (3.5) | |
| Week 12 (LOCF) | 29.4 (3.0) | 33.8 (4.5) | 36.6 (5.1) | 38.3 (5.5) | |
| % Change | −1.2 (−4.2, 1.7) | 14.9 (11.8, 17.9) *** | 22.2 (20.0, 24.3) *** | 30.3 (28.0, 32.6) *** | |
| ApoB (mg/dL) | n | 86 | 82 | 161 | 139 |
| Baseline | 113.2 (19.2) | 107.7 (20.1) | 113.0 (22.6) | 109.5 (22.7) | |
| Week 12 (LOCF) | 111.2 (18.4) | 102.6 (21.4) | 109.9 (25.7) | 107.3 (21.3) | |
| % Change | −0.6 (−3.7, 2.5) | −4.7 (−7.9, −1.5) | −1.3 (−3.6, 0.9) | −0.9 (−3.4, 1.5) | |
| ApoB48 (μg/mL) | n | 87 | 82 | 164 | 140 |
| Baseline | 10.1 (6.3) | 10.5 (6.1) | 11.7 (8.7) | 11.6 (8.8) | |
| Week 12 (LOCF) | 10.9 (6.8) | 4.9 (3.7) | 4.5 (3.4) | 4.0 (2.7) | |
| % Change | 31.0 (18.2, 43.9) | −46.4 (−59.7, −33.2) *** | −51.1 (−60.4, −41.7) *** | −56.1 (−66.2, −46.0) *** | |
| ApoB100 (mg/dL) | n | 86 | 82 | 161 | 139 |
| Baseline | 112.2 (19.3) | 106.7 (20.1) | 111.8 (22.7) | 108.3 (22.8) | |
| Week 12 (LOCF) | 110.2 (18.4) | 102.1 (21.4) | 109.5 (25.6) | 106.9 (21.3) | |
| % Change | −0.6 (−3.7, 2.6) | −4.2 (−7.4, −1.0) | −0.6 (−2.9, 1.7) | −0.2 (−2.7, 2.3) | |
| (B) Without Statin | |||||
| Parameter | Placebo | Pemafibrate | |||
| 0.1 mg/day | 0.2 mg/day | 0.4 mg/day | |||
| ApoCII (mg/dL) | n | 86 | 82 | 161 | 139 |
| Baseline | 7.7 (2.4) | 7.2 (1.8) | 8.3 (3.2) | 8.1 (3.3) | |
| Week 12 (LOCF) | 7.9 (2.5) | 6.1 (1.8) | 6.5 (2.5) | 6.2 (2.2) | |
| % Change | 5.0 (0.3, 9.8) | −17.2 (−22.1, −12.3) *** | −17.4 (−20.9, −13.9) *** | −19.7 (−23.4, −15.9) *** | |
| ApoCIII (mg/dL) | n | 86 | 82 | 161 | 139 |
| Baseline | 15.3 (4.7) | 15.2 (4.4) | 16.8 (6.2) | 15.6 (6.1) | |
| Week 12 (LOCF) | 16.1 (6.0) | 10.9 (3.5) | 10.8 (3.7) | 9.5 (3.1) | |
| % Change | 7.3 (2.5, 12.2) | −26.9 (−31.9, −21.9) *** | −30.1 (−33.7, −26.6) *** | −35.4 (−39.2, −31.6) *** | |
| ApoCIII/ApoCII | n | 86 | 82 | 161 | 139 |
| Baseline | 2.0 (0.3) | 2.1 (0.5) | 2.1 (0.6) | 2.0 (0.4) | |
| Week 12 (LOCF) | 2.1 (0.5) | 1.8 (0.4) | 1.7 (0.5) | 1.6 (0.4) | |
| % Change | 2.7 (−1.1, 6.6) | −10.4 (−14.3, −6.5) *** | −14.9 (−17.7, −12.1) *** | −17.9 (−20.9, −14.9) *** | |
| ApoE (mg/dL) | n | 86 | 82 | 161 | 139 |
| Baseline | 5.3 (1.6) | 5.3 (1.4) | 5.6 (1.9) | 5.6 (2.2) | |
| Week 12 (LOCF) | 5.6 (1.9) | 3.9 (0.9) | 4.1 (1.1) | 4.0 (1.0) | |
| % Change | 5.7 (1.8, 9.6) | −24.1 (−28.1, −20.2) *** | −21.5 (−24.3, −18.7) *** | −22.7 (−25.8, −19.7) *** | |
| Fibrinogen (mg/dL) | n | 120 | 82 | 202 | 172 |
| Baseline | 289.4 (45.8) | 291.3 (64.5) | 295.1 (52.6) | 293.5 (51.9) | |
| Week 12 (LOCF) | 292.7 (50.2) | 247.6 (50.6) | 251.8 (51.5) | 230.1 (47.0) | |
| Change | 1.6 (−5.8, 9.1) | −44.4 (−53.5, −35.4) *** | −42.2 (−48.0, −36.5) *** | −63.1 (−69.4, −56.9) *** | |
| FGF21 (pg/mL) | n | 83 | 76 | 137 | 125 |
| Baseline | 423.6 (215.0) | 404.5 (281.6) | 548.7 (647.1) | 579.0 (973.6) | |
| Week 12 (LOCF) | 430.8 (206.3) | 678.8 (531.9) | 732.2 (420.6) | 870.0 (669.0) | |
| Change | −43.0 (−134.7, 48.8) | 212.7 (116.8, 308.7) *** | 208.5 (137.2, 279.9) *** | 334.3 (259.5, 409.0) *** | |
| (A) With Statin | |||||
| Parameter | Placebo | Pemafibrate | |||
| 0.1 mg/day | 0.2 mg/day | 0.4 mg/day | |||
| CM-C | n | 174 | 45 | 370 | 71 |
| (mmol/L) | Baseline | 0.203 (0.202) | 0.220 (0.185) | 0.196 (0.172) | 0.205 (0.200) |
| Week 12 (LOCF) | 0.174 (0.254) | 0.072 (0.078) | 0.050 (0.061) | 0.050 (0.074) | |
| % Change | 23.8 (11.5, 36.0) | −50.4 (−74.6, −26.3) *** | −64.1 (−72.5, −55.7) *** | −62.3 (−81.5, −43.1) *** | |
| VLDL-C | n | 174 | 45 | 370 | 71 |
| (mmol/L) | Baseline | 1.315 (0.391) | 1.399 (0.429) | 1.314 (0.372) | 1.316 (0.385) |
| Week 12 (LOCF) | 1.271 (0.434) | 1.047 (0.373) | 0.904 (0.280) | 0.947 (0.397) | |
| % Change | −0.5 (−3.8, 2.7) | −20.5 (−26.9, −14.2) *** | −28.7 (−31.0, −26.5) *** | −26.5 (−31.6, −21.4) *** | |
| Large LDL-C | n | 174 | 45 | 370 | 71 |
| (mmol/L) | Baseline | 0.490 (0.150) | 0.532 (0.122) | 0.485 (0.158) | 0.511 (0.157) |
| Week 12 (LOCF) | 0.499 (0.161) | 0.687 (0.184) | 0.691 (0.178) | 0.762 (0.198) | |
| % Change | 4.3 (−0.8, 9.4) | 37.0 (26.9, 47.1) *** | 51.1 (47.5, 54.6) *** | 60.2 (52.1, 68.2) *** | |
| Medium LDL-C | n | 174 | 45 | 370 | 71 |
| (mmol/L) | Baseline | 0.975 (0.278) | 1.050 (0.198) | 0.952 (0.297) | 1.033 (0.224) |
| Week 12 (LOCF) | 0.966 (0.276) | 1.140 (0.266) | 1.119 (0.269) | 1.177 (0.308) | |
| % Change | 1.0 (−3.4, 5.4) | 15.3 (6.6, 23.9) ** | 24.8 (21.7, 27.8) *** | 21.4 (14.5, 28.2) *** | |
| Small LDL-C | n | 174 | 45 | 370 | 71 |
| (mmol/L) | Baseline | 0.642 (0.183) | 0.692 (0.134) | 0.631 (0.191) | 0.678 (0.153) |
| Week 12 (LOCF) | 0.623 (0.173) | 0.619 (0.162) | 0.574 (0.174) | 0.563 (0.184) | |
| % Change | −1.2 (−5.0, 2.6) | −6.0 (−13.5, 1.5) | −5.1 (−7.7, −2.5) | −12.2 (−18.2, −6.2) ** | |
| Very small LDL-C | n | 174 | 45 | 370 | 71 |
| (mmol/L) | Baseline | 0.270 (0.082) | 0.306 (0.067) | 0.269 (0.082) | 0.287 (0.077) |
| Week 12 (LOCF) | 0.261 (0.077) | 0.262 (0.079) | 0.229 (0.070) | 0.223 (0.069) | |
| % Change | −1.5 (−4.9, 1.9) | −9.6 (−16.3, −3.0) * | −12.3 (−14.6, −10.0) *** | −17.3 (−22.6, −12.1) *** | |
| Very large HDL-C | n | 174 | 45 | 370 | 71 |
| (mmol/L) | Baseline | 0.054 (0.017) | 0.061 (0.017) | 0.055 (0.019) | 0.053 (0.013) |
| Week 12 (LOCF) | 0.054 (0.017) | 0.059 (0.018) | 0.053 (0.018) | 0.047 (0.009) | |
| % Change | −0.1 (−2.8, 2.6) | −0.7 (−6.1, 4.6) | −2.2 (−4.1, −0.4) | −10.8 (−15.0, −6.6) *** | |
| (A) With Statin | |||||
| Parameter | Placebo | Pemafibrate | |||
| 0.1 mg/day | 0.2 mg/day | 0.4 mg/day | |||
| Large HDL-C | n | 174 | 45 | 370 | 71 |
| (mmol/L) | Baseline | 0.144 (0.074) | 0.159 (0.064) | 0.151 (0.081) | 0.139 (0.066) |
| Week 12 (LOCF) | 0.146 (0.074) | 0.162 (0.081) | 0.137 (0.085) | 0.101 (0.061) | |
| % Change | 4.0 (−0.2, 8.2) | 2.1 (−6.1, 10.3) | −8.0 (−10.9, −5.2) *** | −26.3 (−32.9, −19.8) *** | |
| Medium HDL-C | n | 174 | 45 | 370 | 71 |
| (mmol/L) | Baseline | 0.361 (0.104) | 0.363 (0.086) | 0.363 (0.108) | 0.363 (0.089) |
| Week 12 (LOCF) | 0.363 (0.107) | 0.438 (0.128) | 0.437 (0.138) | 0.416 (0.118) | |
| % Change | 1.5 (−1.7, 4.6) | 20.3 (14.2, 26.5) *** | 21.6 (19.5, 23.8) *** | 16.2 (11.3, 21.1) *** | |
| Small HDL-C | n | 174 | 45 | 370 | 71 |
| (mmol/L) | Baseline | 0.377 (0.077) | 0.379 (0.066) | 0.374 (0.074) | 0.377 (0.066) |
| Week 12 (LOCF) | 0.378 (0.075) | 0.455 (0.088) | 0.473 (0.083) | 0.476 (0.078) | |
| % Change | 1.2 (−1.3, 3.8) | 21.9 (16.9, 26.8) *** | 28.2 (26.5, 30.0) *** | 28.7 (24.8, 32.7) *** | |
| Very small HDL-C | n | 174 | 45 | 370 | 71 |
| (mmol/L) | Baseline | 0.171 (0.037) | 0.185 (0.036) | 0.172 (0.033) | 0.172 (0.037) |
| Week 12 (LOCF) | 0.172 (0.037) | 0.210 (0.045) | 0.204 (0.037) | 0.203 (0.039) | |
| % Change | 1.3 (−1.3, 4.0) | 17.9 (12.6, 23.3) *** | 20.3 (18.4, 22.1) *** | 20.5 (16.3, 24.7) *** | |
| (B) Without Statin | |||||
| Parameter | Placebo | Pemafibrate | |||
| 0.1 mg/day | 0.2 mg/day | 0.4 mg/day | |||
| CM-C | n | 110 | 82 | 199 | 150 |
| (mmol/L) | Baseline | 0.221 (0.175) | 0.224 (0.177) | 0.250 (0.227) | 0.224 (0.218) |
| Week 12 (LOCF) | 0.212 (0.189) | 0.072 (0.081) | 0.065 (0.072) | 0.053 (0.058) | |
| % Change | 24.5 (13.3, 35.7) | −60.8 (−73.8, −47.8) *** | −62.4 (−70.7, −54.1) *** | −62.3 (−71.9, −52.7) *** | |
| VLDL-C | n | 110 | 82 | 199 | 150 |
| (mmol/L) | Baseline | 1.554 (0.393) | 1.492 (0.382) | 1.523 (0.430) | 1.530 (0.466) |
| Week 12 (LOCF) | 1.477 (0.435) | 1.121 (0.327) | 1.113 (0.377) | 1.104 (0.346) | |
| % Change | −3.3 (−7.0, 0.5) | −24.0 (−28.3, −19.6) *** | −25.5 (−28.3, −22.7) *** | −24.5 (−27.8, −21.3) *** | |
| Large LDL-C | n | 110 | 82 | 199 | 150 |
| (mmol/L) | Baseline | 0.565 (0.186) | 0.542 (0.200) | 0.555 (0.199) | 0.559 (0.192) |
| Week 12 (LOCF) | 0.558 (0.178) | 0.730 (0.216) | 0.811 (0.210) | 0.872 (0.228) | |
| % Change | 4.6 (−3.1, 12.4) | 40.6 (31.5, 49.6) *** | 60.0 (54.2, 65.8) *** | 68.0 (61.3, 74.6) *** | |
| (B) Without Statin | |||||
| Parameter | Placebo | Pemafibrate | |||
| 0.1 mg/day | 0.2 mg/day | 0.4 mg/day | |||
| Medium LDL-C | n | 110 | 82 | 199 | 150 |
| (mmol/L) | Baseline | 1.234 (0.353) | 1.140 (0.344) | 1.187 (0.383) | 1.162 (0.371) |
| Week 12 (LOCF) | 1.200 (0.309) | 1.317 (0.327) | 1.404 (0.352) | 1.392 (0.327) | |
| % Change | 4.3 (−2.5, 11.1) | 19.0 (11.1, 26.9) ** | 30.3 (25.3, 35.4) *** | 27.2 (21.4, 33.1) *** | |
| Small LDL-C | n | 110 | 82 | 199 | 150 |
| (mmol/L) | Baseline | 0.815 (0.212) | 0.750 (0.217) | 0.773 (0.251) | 0.750 (0.229) |
| Week 12 (LOCF) | 0.782 (0.205) | 0.696 (0.211) | 0.686 (0.253) | 0.641 (0.201) | |
| % Change | 0.0 (−5.1, 5.1) | −5.0 (−10.9, 0.8) | −6.8 (−10.6, −3.0) * | −11.5 (−15.8, −7.1) *** | |
| Very small LDL-C | n | 110 | 82 | 199 | 150 |
| (mmol/L) | Baseline | 0.338 (0.099) | 0.315 (0.094) | 0.317 (0.110) | 0.314 (0.101) |
| Week 12 (LOCF) | 0.321 (0.096) | 0.278 (0.091) | 0.271 (0.110) | 0.257 (0.084) | |
| % Change | −2.3 (−6.5, 1.8) | −10.0 (−14.8, −5.2) * | −12.5 (−15.6, −9.4) *** | −15.8 (−19.4, −12.3) *** | |
| Very large HDL-C | n | 110 | 82 | 199 | 150 |
| (mmol/L) | Baseline | 0.052 (0.020) | 0.051 (0.012) | 0.049 (0.013) | 0.062 (0.145) |
| Week 12 (LOCF) | 0.051 (0.018) | 0.053 (0.014) | 0.050 (0.014) | 0.049 (0.040) | |
| % Change | −1.0 (−4.0, 2.0) | 4.0 (0.5, 7.4) * | 2.2 (0.0, 4.4) | −5.3 (−7.9, −2.7) * | |
| Large HDL-C | n | 110 | 82 | 199 | 150 |
| (mmol/L) | Baseline | 0.108 (0.079) | 0.108 (0.042) | 0.105 (0.052) | 0.119 (0.158) |
| Week 12 (LOCF) | 0.107 (0.081) | 0.117 (0.068) | 0.096 (0.061) | 0.088 (0.140) | |
| % Change | 2.6 (−3.6, 8.7) | 6.4 (−0.7, 13.5) | −7.3 (−11.9, −2.8) * | −24.8 (−30.0, −19.5) *** | |
| Medium HDL-C | n | 110 | 82 | 199 | 150 |
| (mmol/L) | Baseline | 0.315 (0.079) | 0.309 (0.068) | 0.313 (0.083) | 0.308 (0.081) |
| Week 12 (LOCF) | 0.314 (0.079) | 0.380 (0.091) | 0.384 (0.105) | 0.371 (0.120) | |
| % Change | 1.9 (−2.6, 6.4) | 24.2 (19.0, 29.3) *** | 24.9 (21.5, 28.2) *** | 21.5 (17.6, 25.3) *** | |
| Small HDL-C | n | 110 | 82 | 199 | 150 |
| (mmol/L) | Baseline | 0.360 (0.062) | 0.333 (0.058) | 0.348 (0.071) | 0.342 (0.062) |
| Week 12 (LOCF) | 0.361 (0.064) | 0.406 (0.065) | 0.447 (0.082) | 0.454 (0.076) | |
| % Change | 3.2 (−0.3, 6.8) | 21.4 (17.3, 25.5) *** | 31.5 (28.9, 34.1) *** | 34.5 (31.5, 37.5) *** | |
| (B) Without Statin | |||||
| Parameter | Placebo | Pemafibrate | |||
| 0.1 mg/day | 0.2 mg/day | 0.4 mg/day | |||
| Very small HDL-C | n | 110 | 82 | 199 | 150 |
| (mmol/L) | Baseline | 0.162 (0.032) | 0.155 (0.033) | 0.152 (0.034) | 0.154 (0.034) |
| Week 12 (LOCF) | 0.160 (0.034) | 0.177 (0.041) | 0.184 (0.039) | 0.190 (0.041) | |
| % Change | 1.2 (−2.4, 4.9) | 15.0 (10.8, 19.1) *** | 22.1 (19.4, 24.7) *** | 25.5 (22.4, 28.6) *** | |
| (A) With Statin | ||||
| Parameter | Placebo | Pemafibrate | ||
| 0.1 mg/day | 0.2 mg/day | 0.4 mg/day | ||
| n | 178 | 45 | 382 | 72 |
| AE | ||||
| Total | 73 (41.0) | 29 (64.4) | 164 (42.9) | 34 (47.2) |
| Serious | 2 (1.1) | 2 (4.4) | 6 (1.6) | 0 |
| Leading to withdrawal | 2 (1.1) | 2 (4.4) | 12 (3.1) | 0 |
| ADR | ||||
| Total | 17 (9.6) | 3 (6.7) | 36 (9.4) | 2 (2.8) |
| Serious | 1 (0.6) | 0 | 2 (0.5) | 0 |
| Leading to withdrawal | 2 (1.1) | 1 (2.2) | 11 (2.9) | 0 |
| n | 178 | 45 | 382 | 72 |
| AST ≥ ULN × 3 | 0 1 | 0 | 1 (0.3) | 1 (1.4) |
| ALT ≥ ULN × 3 | 1 (0.6) | 1 (2.2) | 0 | 1 (1.4) |
| sCr ≥ ULN | 37 (20.8) | 8 (17.8) | 61 (16.0) | 11 (15.3) |
| CK ≥ 2.5 and < ULN × 5 | 4 (2.2) | 2 (4.4) | 7 (1.8) | 2 (2.8) |
| CK ≥ 5 and < ULN × 10 | 0 | 0 | 3 (0.8) | 0 |
| CK ≥ ULN × 10 | 0 | 0 | 1 (0.3) | 0 |
| (B) Without Statin | ||||
| Parameter | Placebo | Pemafibrate | ||
| 0.1 mg/day | 0.2 mg/day | 0.4 mg/day | ||
| n | 120 | 82 | 202 | 174 |
| AE | ||||
| Total | 55 (45.8) | 27 (32.9) | 78 (38.6) | 60 (34.5) |
| Serious | 0 | 1 (1.2) | 4 (2.0) | 2 (1.1) |
| Leading to withdrawal | 0 | 2 (2.4) | 3 (1.5) | 6 (3.4) |
| ADR | ||||
| Total | 10 (8.3) | 3 (3.7) | 14 (6.9) | 16 (9.2) |
| Serious | 0 | 0 | 1 (0.5) | 1 (0.6) |
| Leading to withdrawal | 0 | 1 (1.2) | 2 (1.0) | 3 (1.7) |
| n | 120 | 82 | 202 | 173 |
| AST ≥ ULN × 3 | 0 | 0 | 0 | 1 (0.6) |
| ALT ≥ ULN × 3 | 0 | 0 | 0 | 0 |
| sCr ≥ ULN | 16 (13.3) | 15 (18.3) | 34 (16.8) | 22 (12.7) |
| CK ≥ 2.5 and < ULN × 5 | 1 (0.8) | 2 (2.4) | 3 (1.5) | 0 |
| CK ≥ 5 and < ULN × 10 | 1 (0.8) | 0 | 0 | 1 (0.6) |
| CK ≥ ULN × 10 | 0 | 0 | 0 | 1 (0.6) |
| (A) Baseline eGFR 1 ≥ 60 mL/min/1.73 m2 | ||||
| Parameter | Placebo | Pemafibrate | ||
| 0.1 mg/day | 0.2 mg/day | 0.4 mg/day | ||
| n | 143 | 39 | 335 | 64 |
| AE | ||||
| Total | 55 (38.5) | 26 (66.7) | 141 (42.1) | 31 (48.4) |
| Serious | 1 (0.7) | 2 (5.1) | 3 (0.9) | 0 |
| Leading to withdrawal | 0 | 2 (5.1) | 10 (3.0) | 0 |
| ADR | ||||
| Total | 9 (6.3) | 3 (7.7) | 28 (8.4) | 2 (3.1) |
| Serious | 0 | 0 | 1 (0.3) | 0 |
| Leading to withdrawal | 0 | 1 (2.6) | 9 (2.7) | 0 |
| n | 143 | 39 | 335 | 64 |
| AST ≥ ULN × 3 | 0 2 | 0 | 0 | 1 (1.6) |
| ALT ≥ ULN × 3 | 1 (0.7) | 1 (2.6) | 0 | 1 (1.6) |
| sCr ≥ ULN | 5 (3.5) | 2 (5.1) | 21 (6.3) | 4 (6.3) |
| CK ≥ 2.5 and < ULN × 5 | 1 (0.7) | 2 (5.1) | 6 (1.8) | 2 (3.1) |
| CK ≥ 5 and < ULN × 10 | 0 | 0 | 2 (0.6) | 0 |
| CK ≥ ULN × 10 | 0 | 0 | 1 (0.3) | 0 |
| (B) Baseline eGFR 1 < 60 mL/min/1.73 m2 | ||||
| Parameter | Placebo | Pemafibrate | ||
| 0.1 mg/day | 0.2 mg/day | 0.4 mg/day | ||
| n | 35 | 6 | 47 | 8 |
| AE | ||||
| Total | 18 (51.4) | 3 (50.0) | 23 (48.9) | 3 (37.5) |
| Serious | 1 (2.9) | 0 | 3 (6.4) | 0 |
| Leading to withdrawal | 2 (5.7) | 0 | 2 (4.3) | 0 |
| ADR | ||||
| Total | 8 (22.9) | 0 | 8 (17.0) | 0 |
| Serious | 1 (2.9) | 0 | 1 (2.1) | 0 |
| Leading to withdrawal | 2 (5.7) | 0 | 2 (4.3) | 0 |
| n | 35 | 6 | 47 | 8 |
| AST ≥ ULN × 3 | 0 | 0 | 1 (2.1) | 0 |
| ALT ≥ ULN × 3 | 0 | 0 | 0 | 0 |
| sCr ≥ ULN | 32 (91.4) | 6 (100.0) | 40 (85.1) | 7 (87.5) |
| CK ≥ 2.5 and < ULN × 5 | 3 (8.6) | 0 | 1 (2.1) | 0 |
| CK ≥ 5 and < ULN × 10 | 0 | 0 | 1 (2.1) | 0 |
| CK ≥ ULN × 10 | 0 | 0 | 0 | 0 |
| (A) With Statin | |||||
| Parameter | Placebo | Pemafibrate | |||
| 0.1 mg/day | 0.2 mg/day | 0.4 mg/day | |||
| sCr (mg/dL) | n | 174 | 44 | 368 | 71 |
| Baseline | 0.81 (0.18) | 0.80 (0.18) | 0.79 (0.16) | 0.80 (0.17) | |
| Week 12 | 0.80 (0.18) | 0.81 (0.18) | 0.82 (0.18) | 0.85 (0.19) | |
| Change | 0.00 (−0.01, 0.01) | 0.01 (−0.01, 0.03) | 0.02 (0.02, 0.03) *** | 0.05 (0.04, 0.07) *** | |
| eGFR 1 | n | 174 | 44 | 368 | 71 |
| (mL/min/1.73 m2) | Baseline | 76.8 (18.5) | 78.1 (17.8) | 77.9 (16.5) | 78.2 (17.1) |
| Week 12 | 76.9 (18.1) | 77.1 (16.7) | 75.7 (16.1) | 73.3 (17.2) | |
| Change | 0.0 (−1.0, 1.0) | −0.9 (−2.9, 1.1) | −2.2 (−2.8, −1.5) *** | −4.8 (−6.3, −3.2) *** | |
| CK (U/L) | n | 174 | 44 | 368 | 71 |
| Baseline | 145.2 (128.9) | 151.5 (108.1) | 132.8 (105.4) | 137.9 (71.0) | |
| Week 12 | 129.0 (59.5) | 154.0 (118.5) | 140.7 (125.8) | 151.9 (111.7) | |
| Change | −11.2 (−26.8, 4.4) | 11.9 (−19.1, 42.9) | 4.4 (−6.3, 15.1) | 14.0 (−10.4, 38.4) | |
| AST (U/L) | n | 169 | 44 | 362 | 70 |
| Baseline | 31.2 (10.0) | 30.5 (8.1) | 31.5 (13.7) | 31.9 (17.8) | |
| Week 12 | 31.6 (11.5) | 32.4 (15.4) | 30.6 (13.0) | 29.6 (7.5) | |
| Change | 0.3 (−1.2, 1.8) | 1.5 (−1.4, 4.3) | −0.8 (−1.8, 0.2) | −2.1 (−4.4, 0.2) | |
| ALT (U/L) | n | 174 | 44 | 368 | 71 |
| Baseline | 38.3 (18.0) | 37.5 (17.0) | 38.5 (21.1) | 38.1 (20.6) | |
| Week 12 | 38.9 (20.8) | 36.5 (27.0) | 29.5 (18.2) | 27.4 (14.1) | |
| Change | 0.6 (−1.5, 2.7) | −1.3 (−5.5, 2.9) | −8.9 (−10.4, −7.5) *** | −10.8 (−14.2, −7.5) *** | |
| γ-GT (U/L) | n | 174 | 44 | 368 | 71 |
| Baseline | 84.7 (90.7) | 80.9 (70.1) | 82.1 (74.5) | 75.8 (99.9) | |
| Week 12 | 89.0 (105.6) | 51.3 (38.2) | 45.9 (46.9) | 31.2 (25.0) | |
| Change | 5.3 (−0.8, 11.3) | −30.0 (−42.0, −18.0) *** | −36.2 (−40.3, −32.0) *** | −46.9 (−56.3, −37.4) *** | |
| ALP (U/L) | n | 174 | 44 | 368 | 71 |
| Baseline | 231.9 (61.4) | 231.4 (59.0) | 242.4 (72.5) | 221.1 (53.8) | |
| Week 12 | 229.8 (62.4) | 177.8 (49.5) | 165.1 (54.4) | 131.6 (32.1) | |
| Change | −3.5 (−8.0, 1.0) | −55.2 (−64.2, −46.2) *** | −75.4 (−78.5, −72.3) *** | −94.5 (−101.6, −87.4) *** | |
| Total bilirubin | n | 174 | 44 | 368 | 71 |
| (mg/dL) | Baseline | 0.77 (0.36) | 0.75 (0.30) | 0.76 (0.30) | 0.75 (0.40) |
| Week 12 | 0.79 (0.32) | 0.66 (0.27) | 0.64 (0.21) | 0.59 (0.19) | |
| Change | 0.02 (−0.01, 0.05) | −0.10 (−0.15, −0.04) *** | −0.12 (−0.14, −0.10) *** | −0.16 (−0.21, −0.12) *** | |
| (B) Without Statin | |||||
| Parameter | Placebo | Pemafibrate | |||
| 0.1 mg/day | 0.2 mg/day | 0.4 mg/day | |||
| sCr (mg/dL) | n | 118 | 79 | 196 | 165 |
| Baseline | 0.82 (0.17) | 0.87 (0.14) | 0.82 (0.16) | 0.83 (0.16) | |
| Week 12 | 0.81 (0.17) | 0.87 (0.14) | 0.84 (0.23) | 0.86 (0.25) | |
| Change | −0.01 (−0.03, 0.01) | −0.01 (−0.03, 0.02) | 0.02 (0.01, 0.04) * | 0.04 (0.02, 0.05) *** | |
| eGFR 1 | n | 118 | 79 | 196 | 165 |
| (mL/min/1.73 m2) | Baseline | 78.6 (15.5) | 75.9 (14.5) | 78.9 (15.5) | 78.9 (15.5) |
| Week 12 | 79.9 (15.8) | 75.7 (14.4) | 78.1 (17.3) | 76.9 (17.5) | |
| Change | 1.3 (0.1, 2.6) | −0.2 (−1.8, 1.3) | −0.7 (−1.7, 0.2) * | −2.0 (−3.1, −0.9) *** | |
| CK (U/L) | n | 118 | 79 | 196 | 165 |
| Baseline | 125.4 (69.0) | 148.3 (209.9) | 120.6 (118.2) | 125.8 (89.5) | |
| Week 12 | 127.4 (84.3) | 128.4 (60.7) | 119.3 (55.4) | 124.5 (60.7) | |
| Change | 0.6 (−10.6, 11.8) | −2.0 (−15.7, 11.8) | −6.8 (−15.5, 1.9) | −2.4 (−11.8, 7.1) | |
| AST (U/L) | n | 117 | 78 | 193 | 162 |
| Baseline | 28.1 (11.8) | 27.1 (8.4) | 27.8 (11.3) | 27.6 (9.4) | |
| Week 12 | 29.0 (13.3) | 27.4 (9.9) | 28.0 (10.1) | 29.6 (10.5) | |
| Change | 1.0 (−0.4, 2.5) | 0.1 (−1.6, 1.9) | 0.2 (−0.9, 1.3) | 2.0 (0.8, 3.3) | |
| ALT (U/L) | n | 118 | 79 | 196 | 165 |
| Baseline | 36.4 (19.1) | 34.7 (16.8) | 33.9 (18.8) | 33.6 (17.7) | |
| Week 12 | 37.8 (21.9) | 30.4 (17.2) | 28.7 (15.5) | 28.1 (15.4) | |
| Change | 2.0 (−0.2, 4.1) | −4.2 (−6.8, −1.6) *** | −5.4 (−7.0, −3.7) *** | −5.8 (−7.6, −4.0) *** | |
| γ-GT (U/L) | n | 118 | 79 | 196 | 165 |
| Baseline | 65.9 (61.6) | 56.6 (39.1) | 65.7 (54.8) | 57.6 (47.8) | |
| Week 12 | 65.3 (61.9) | 38.3 (23.9) | 38.3 (41.8) | 28.4 (18.5) | |
| Change | 1.0 (−3.6, 5.6) | −20.5 (−26.2, −14.9) *** | −25.9 (−29.4, −22.3) *** | −31.0 (−35.0, −27.1) *** | |
| (B) Without Statin | |||||
| Parameter | Placebo | Pemafibrate | |||
| 0.1 mg/day | 0.2 mg/day | 0.4 mg/day | |||
| ALP (U/L) | n | 118 | 79 | 196 | 165 |
| Baseline | 236.9 (62.2) | 226.9 (55.6) | 229.5 (62.0) | 225.6 (55.9) | |
| Week 12 | 237.7 (61.4) | 176.5 (47.9) | 164.1 (49.2) | 145.0 (42.2) | |
| Change | 3.2 (−2.2, 8.7) | −51.3 (−57.9, −44.6) *** | −65.5 (−69.7, −61.2) *** | −81.9 (−86.5, −77.3) *** | |
| Total bilirubin | n | 118 | 79 | 196 | 165 |
| (mg/dL) | Baseline | 0.85 (0.31) | 0.78 (0.31) | 0.81 (0.34) | 0.75 (0.28) |
| Week 12 | 0.82 (0.32) | 0.68 (0.22) | 0.67 (0.26) | 0.64 (0.21) | |
| Change | 0.00 (−0.04, 0.03) | −0.11 (−0.15, −0.07) *** | −0.13 (−0.16, −0.10) *** | −0.13 (−0.16, −0.10) *** | |
© 2019 by the authors. Licensee MDPI, Basel, Switzerland. This article is an open access article distributed under the terms and conditions of the Creative Commons Attribution (CC BY) license (http://creativecommons.org/licenses/by/4.0/).
Share and Cite
Yamashita, S.; Arai, H.; Yokote, K.; Araki, E.; Matsushita, M.; Nojima, T.; Suganami, H.; Ishibashi, S. Efficacy and Safety of Pemafibrate, a Novel Selective Peroxisome Proliferator-Activated Receptor α Modulator (SPPARMα): Pooled Analysis of Phase 2 and 3 Studies in Dyslipidemic Patients with or without Statin Combination. Int. J. Mol. Sci. 2019, 20, 5537. https://doi.org/10.3390/ijms20225537
Yamashita S, Arai H, Yokote K, Araki E, Matsushita M, Nojima T, Suganami H, Ishibashi S. Efficacy and Safety of Pemafibrate, a Novel Selective Peroxisome Proliferator-Activated Receptor α Modulator (SPPARMα): Pooled Analysis of Phase 2 and 3 Studies in Dyslipidemic Patients with or without Statin Combination. International Journal of Molecular Sciences. 2019; 20(22):5537. https://doi.org/10.3390/ijms20225537
Chicago/Turabian StyleYamashita, Shizuya, Hidenori Arai, Koutaro Yokote, Eiichi Araki, Mitsunori Matsushita, Toshiaki Nojima, Hideki Suganami, and Shun Ishibashi. 2019. "Efficacy and Safety of Pemafibrate, a Novel Selective Peroxisome Proliferator-Activated Receptor α Modulator (SPPARMα): Pooled Analysis of Phase 2 and 3 Studies in Dyslipidemic Patients with or without Statin Combination" International Journal of Molecular Sciences 20, no. 22: 5537. https://doi.org/10.3390/ijms20225537
APA StyleYamashita, S., Arai, H., Yokote, K., Araki, E., Matsushita, M., Nojima, T., Suganami, H., & Ishibashi, S. (2019). Efficacy and Safety of Pemafibrate, a Novel Selective Peroxisome Proliferator-Activated Receptor α Modulator (SPPARMα): Pooled Analysis of Phase 2 and 3 Studies in Dyslipidemic Patients with or without Statin Combination. International Journal of Molecular Sciences, 20(22), 5537. https://doi.org/10.3390/ijms20225537