DNA Methylation Markers for Pan-Cancer Prediction by Deep Learning
Abstract
1. Introduction
2. Materials and Methods
2.1. Datasets
2.2. Identifying Markers
2.3. Constructing Diagnostic Prediction Models
3. Results
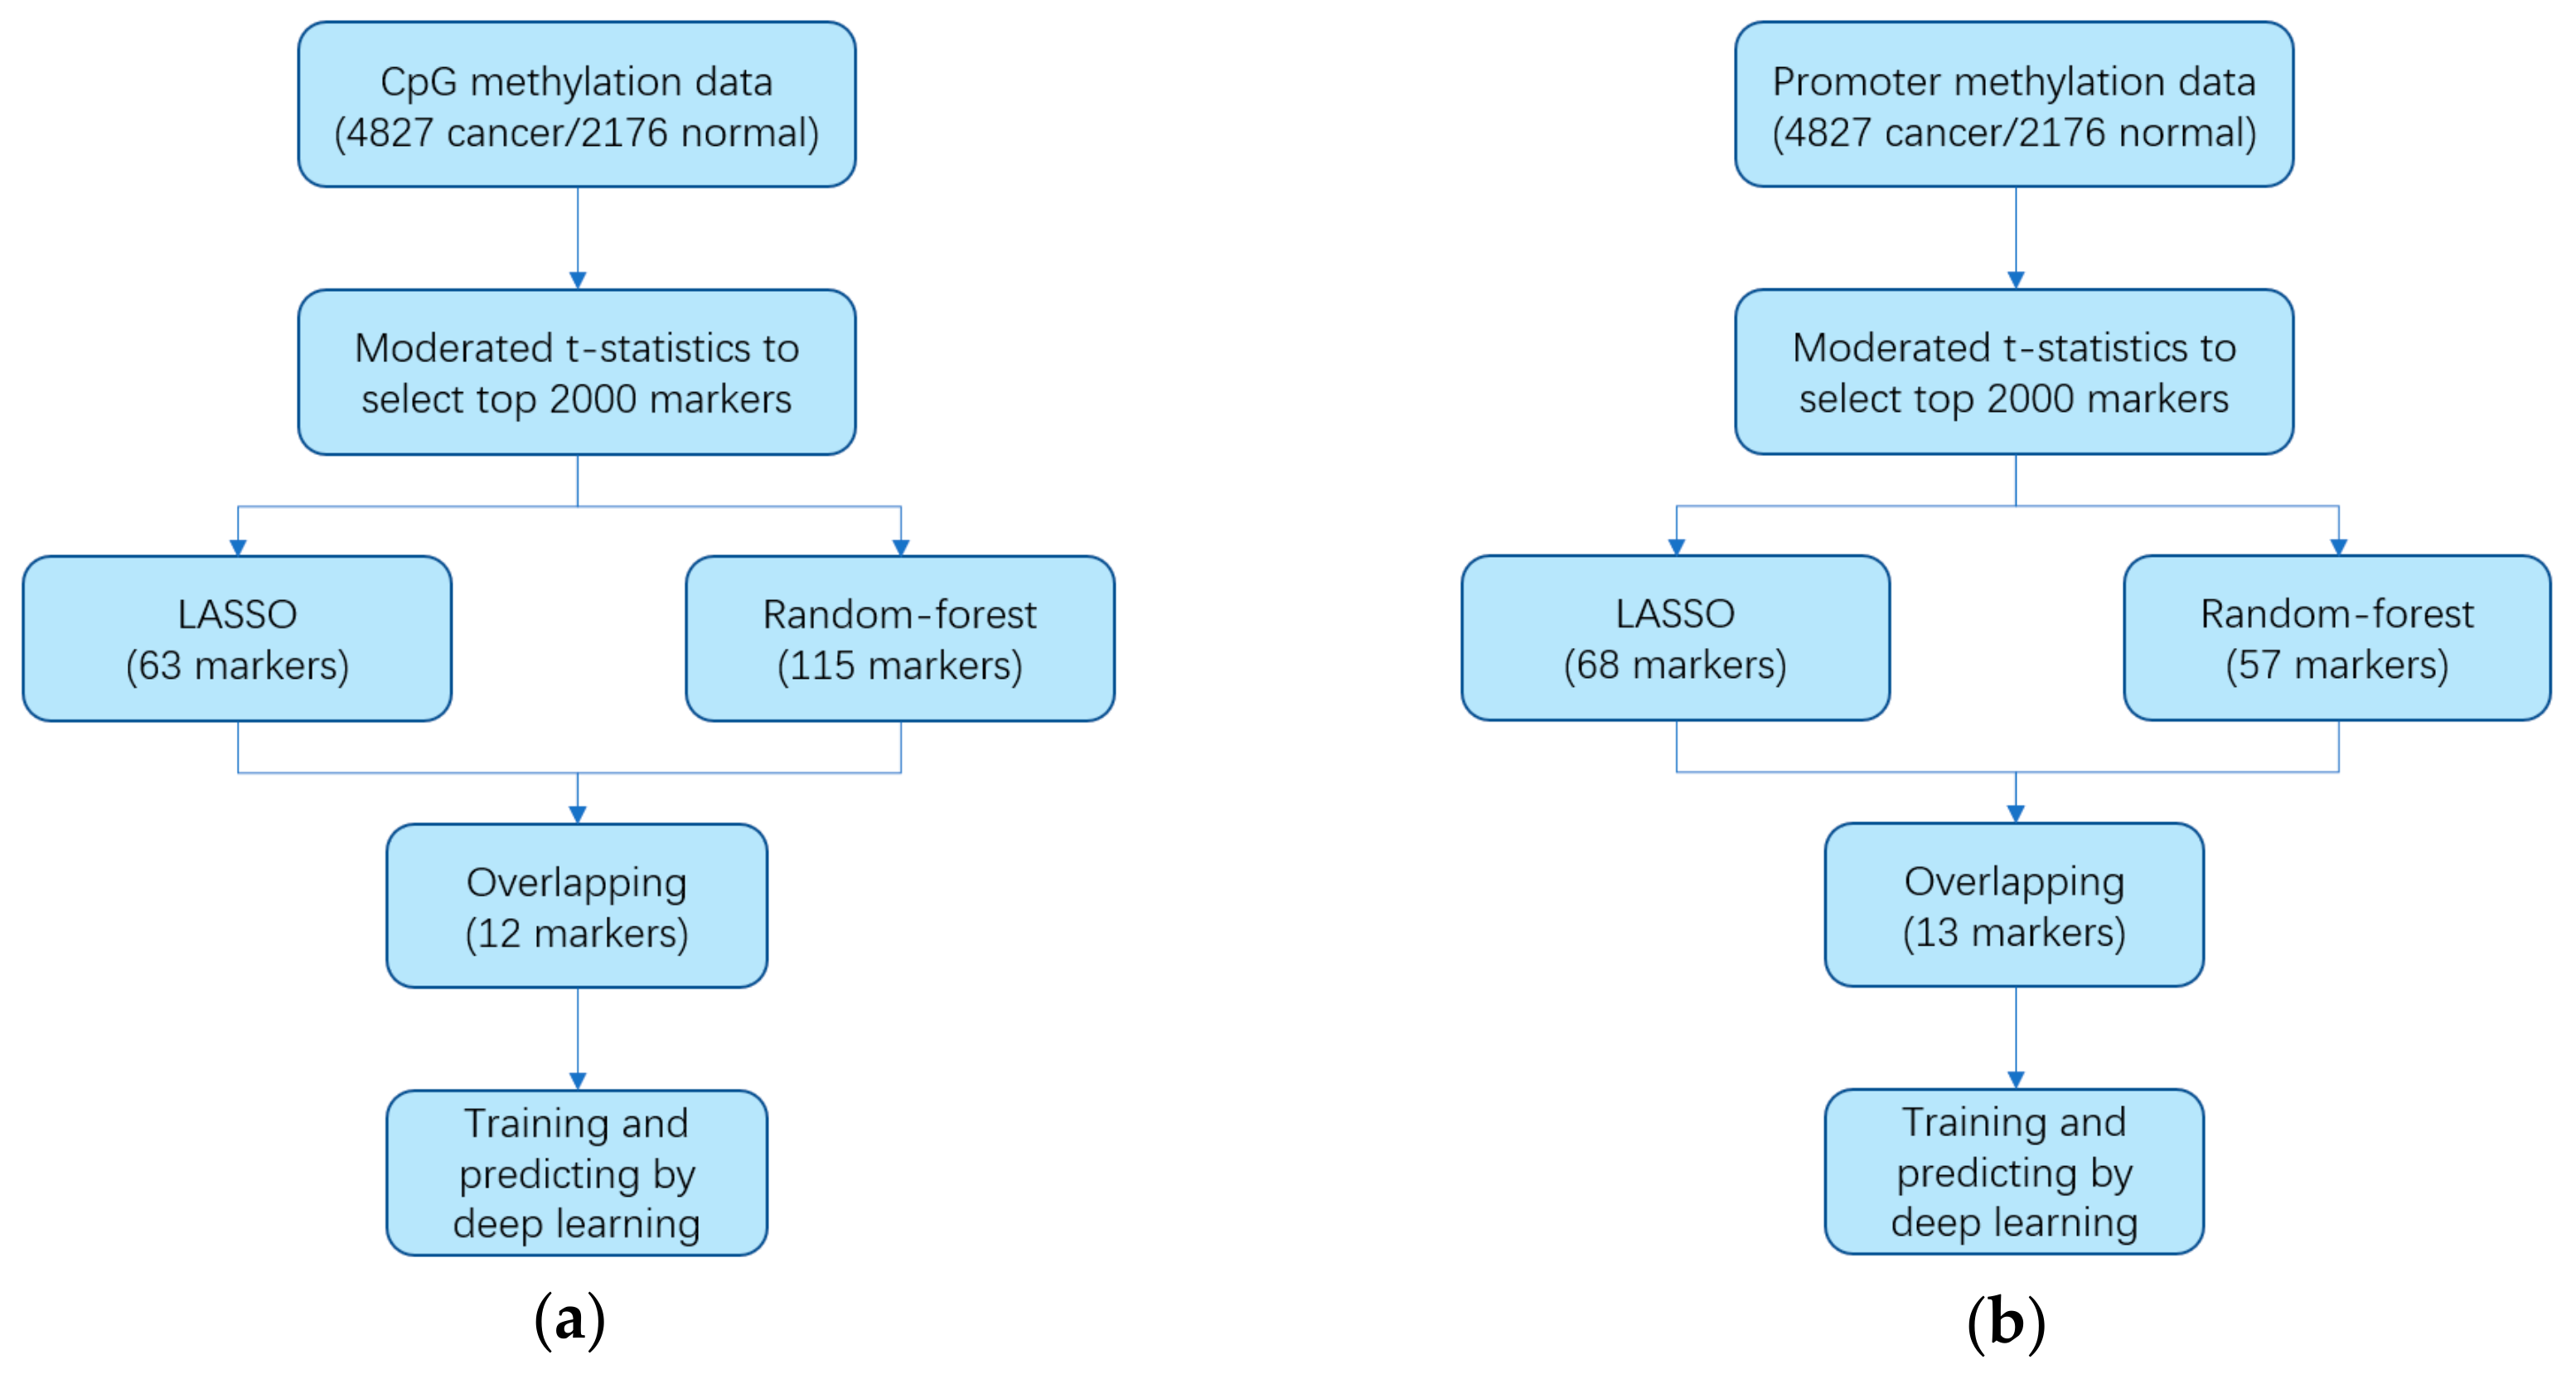
3.1. Identifying Cancer-Specific Methylation Markers by Machine Learning
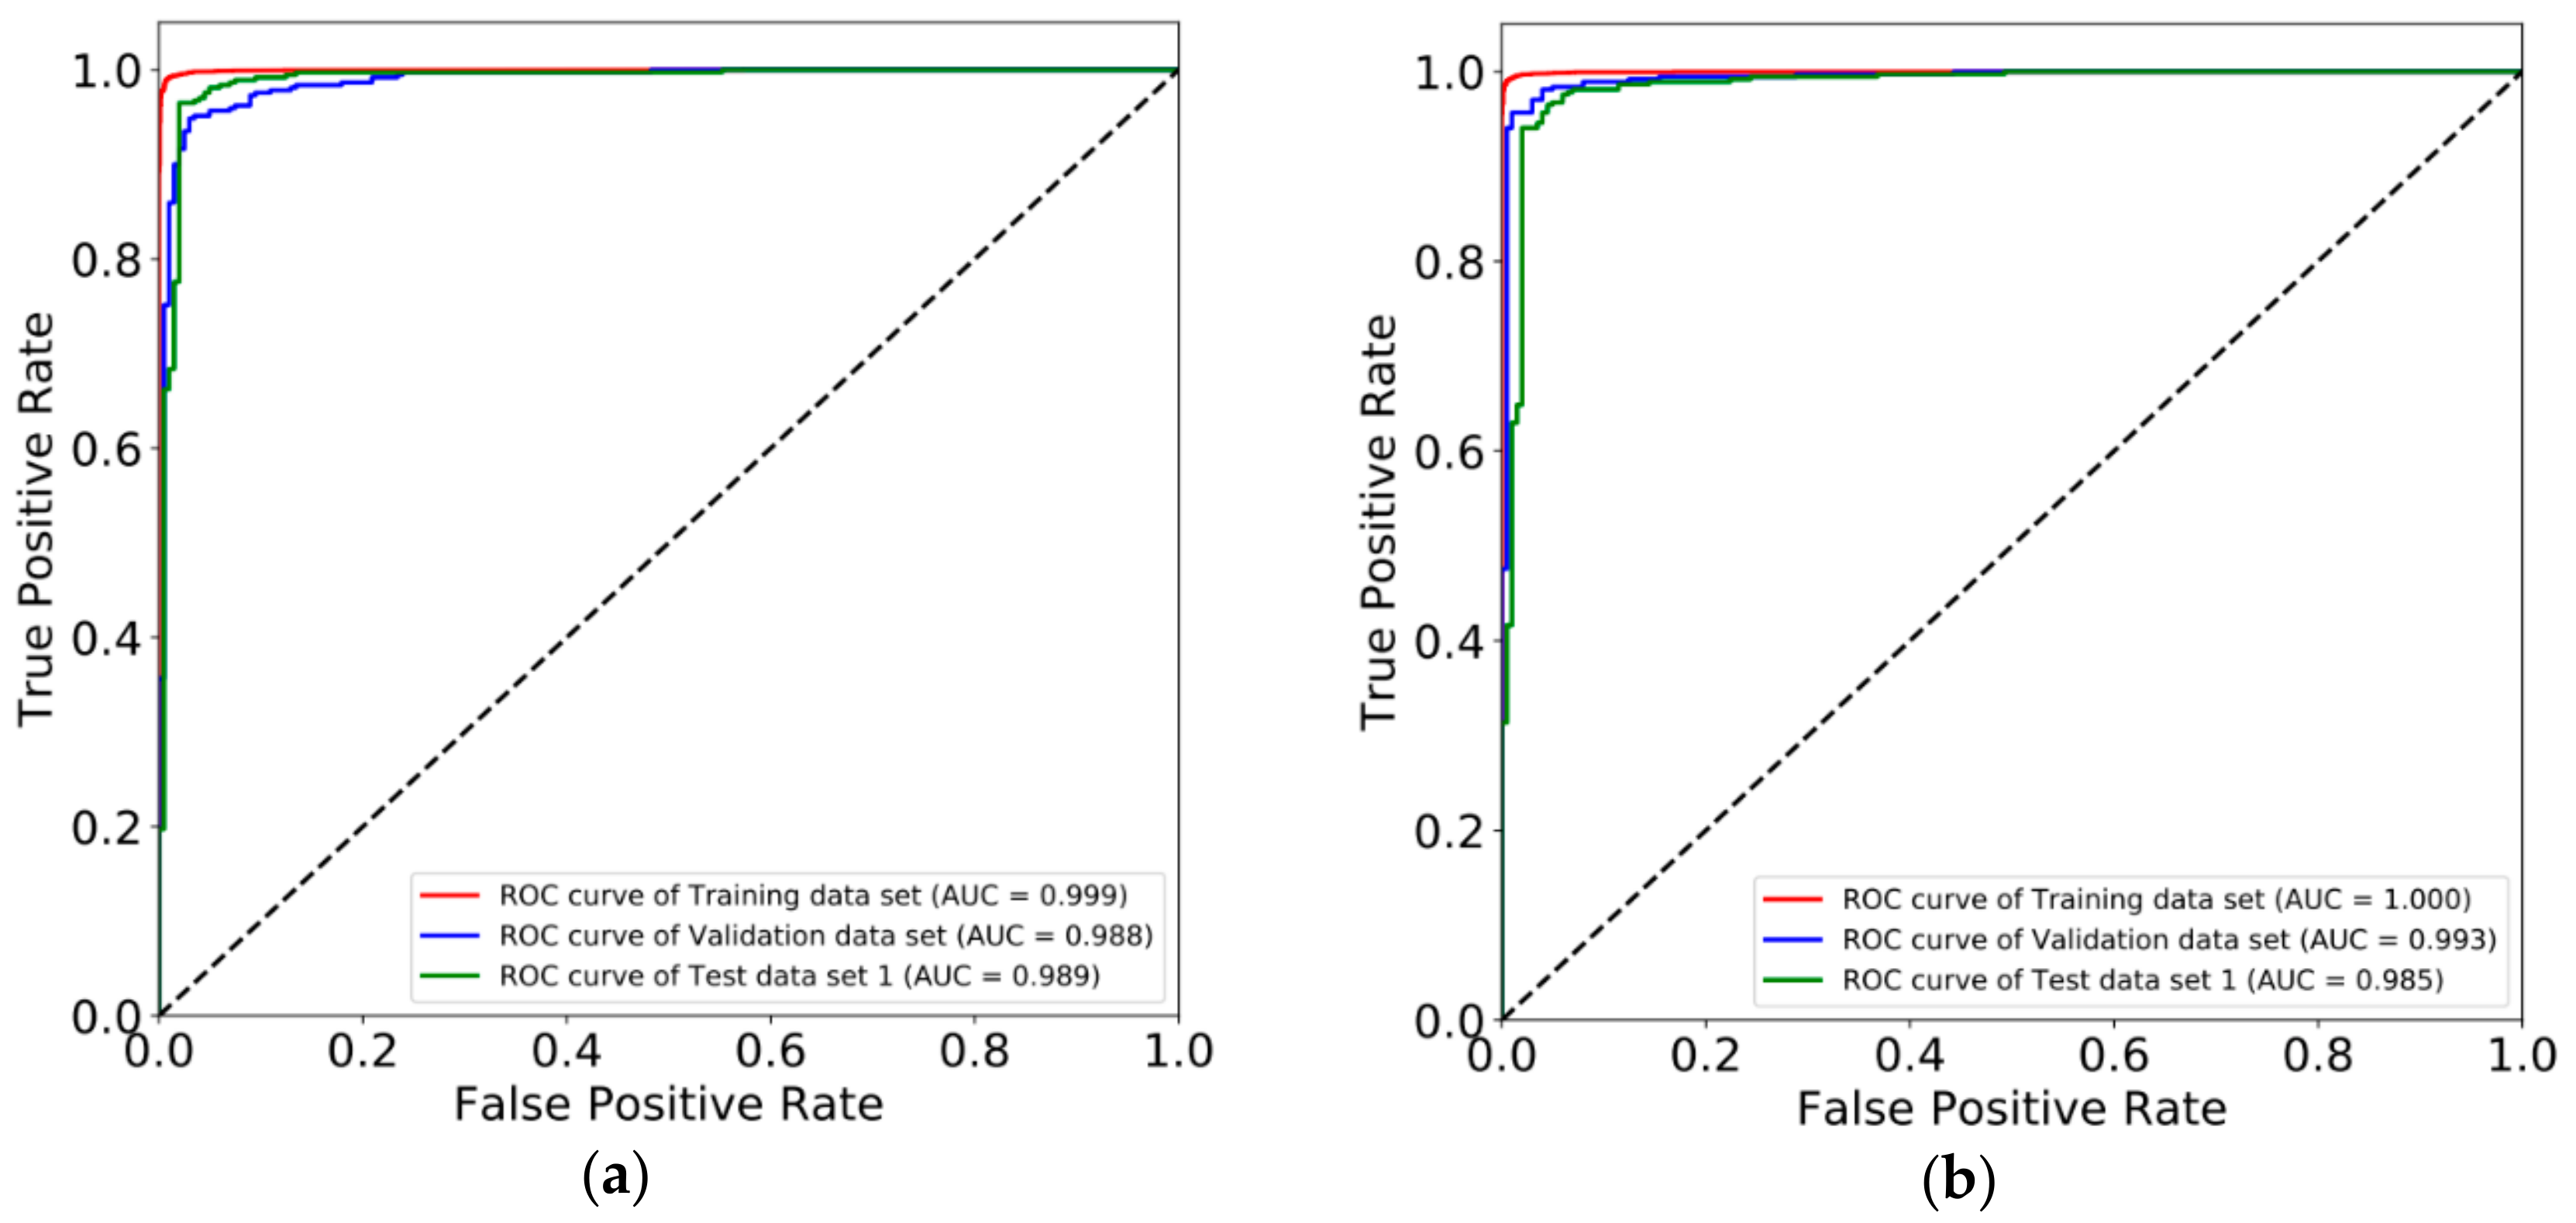
3.2. Constructing Diagnostic Prediction Models by Deep Learning
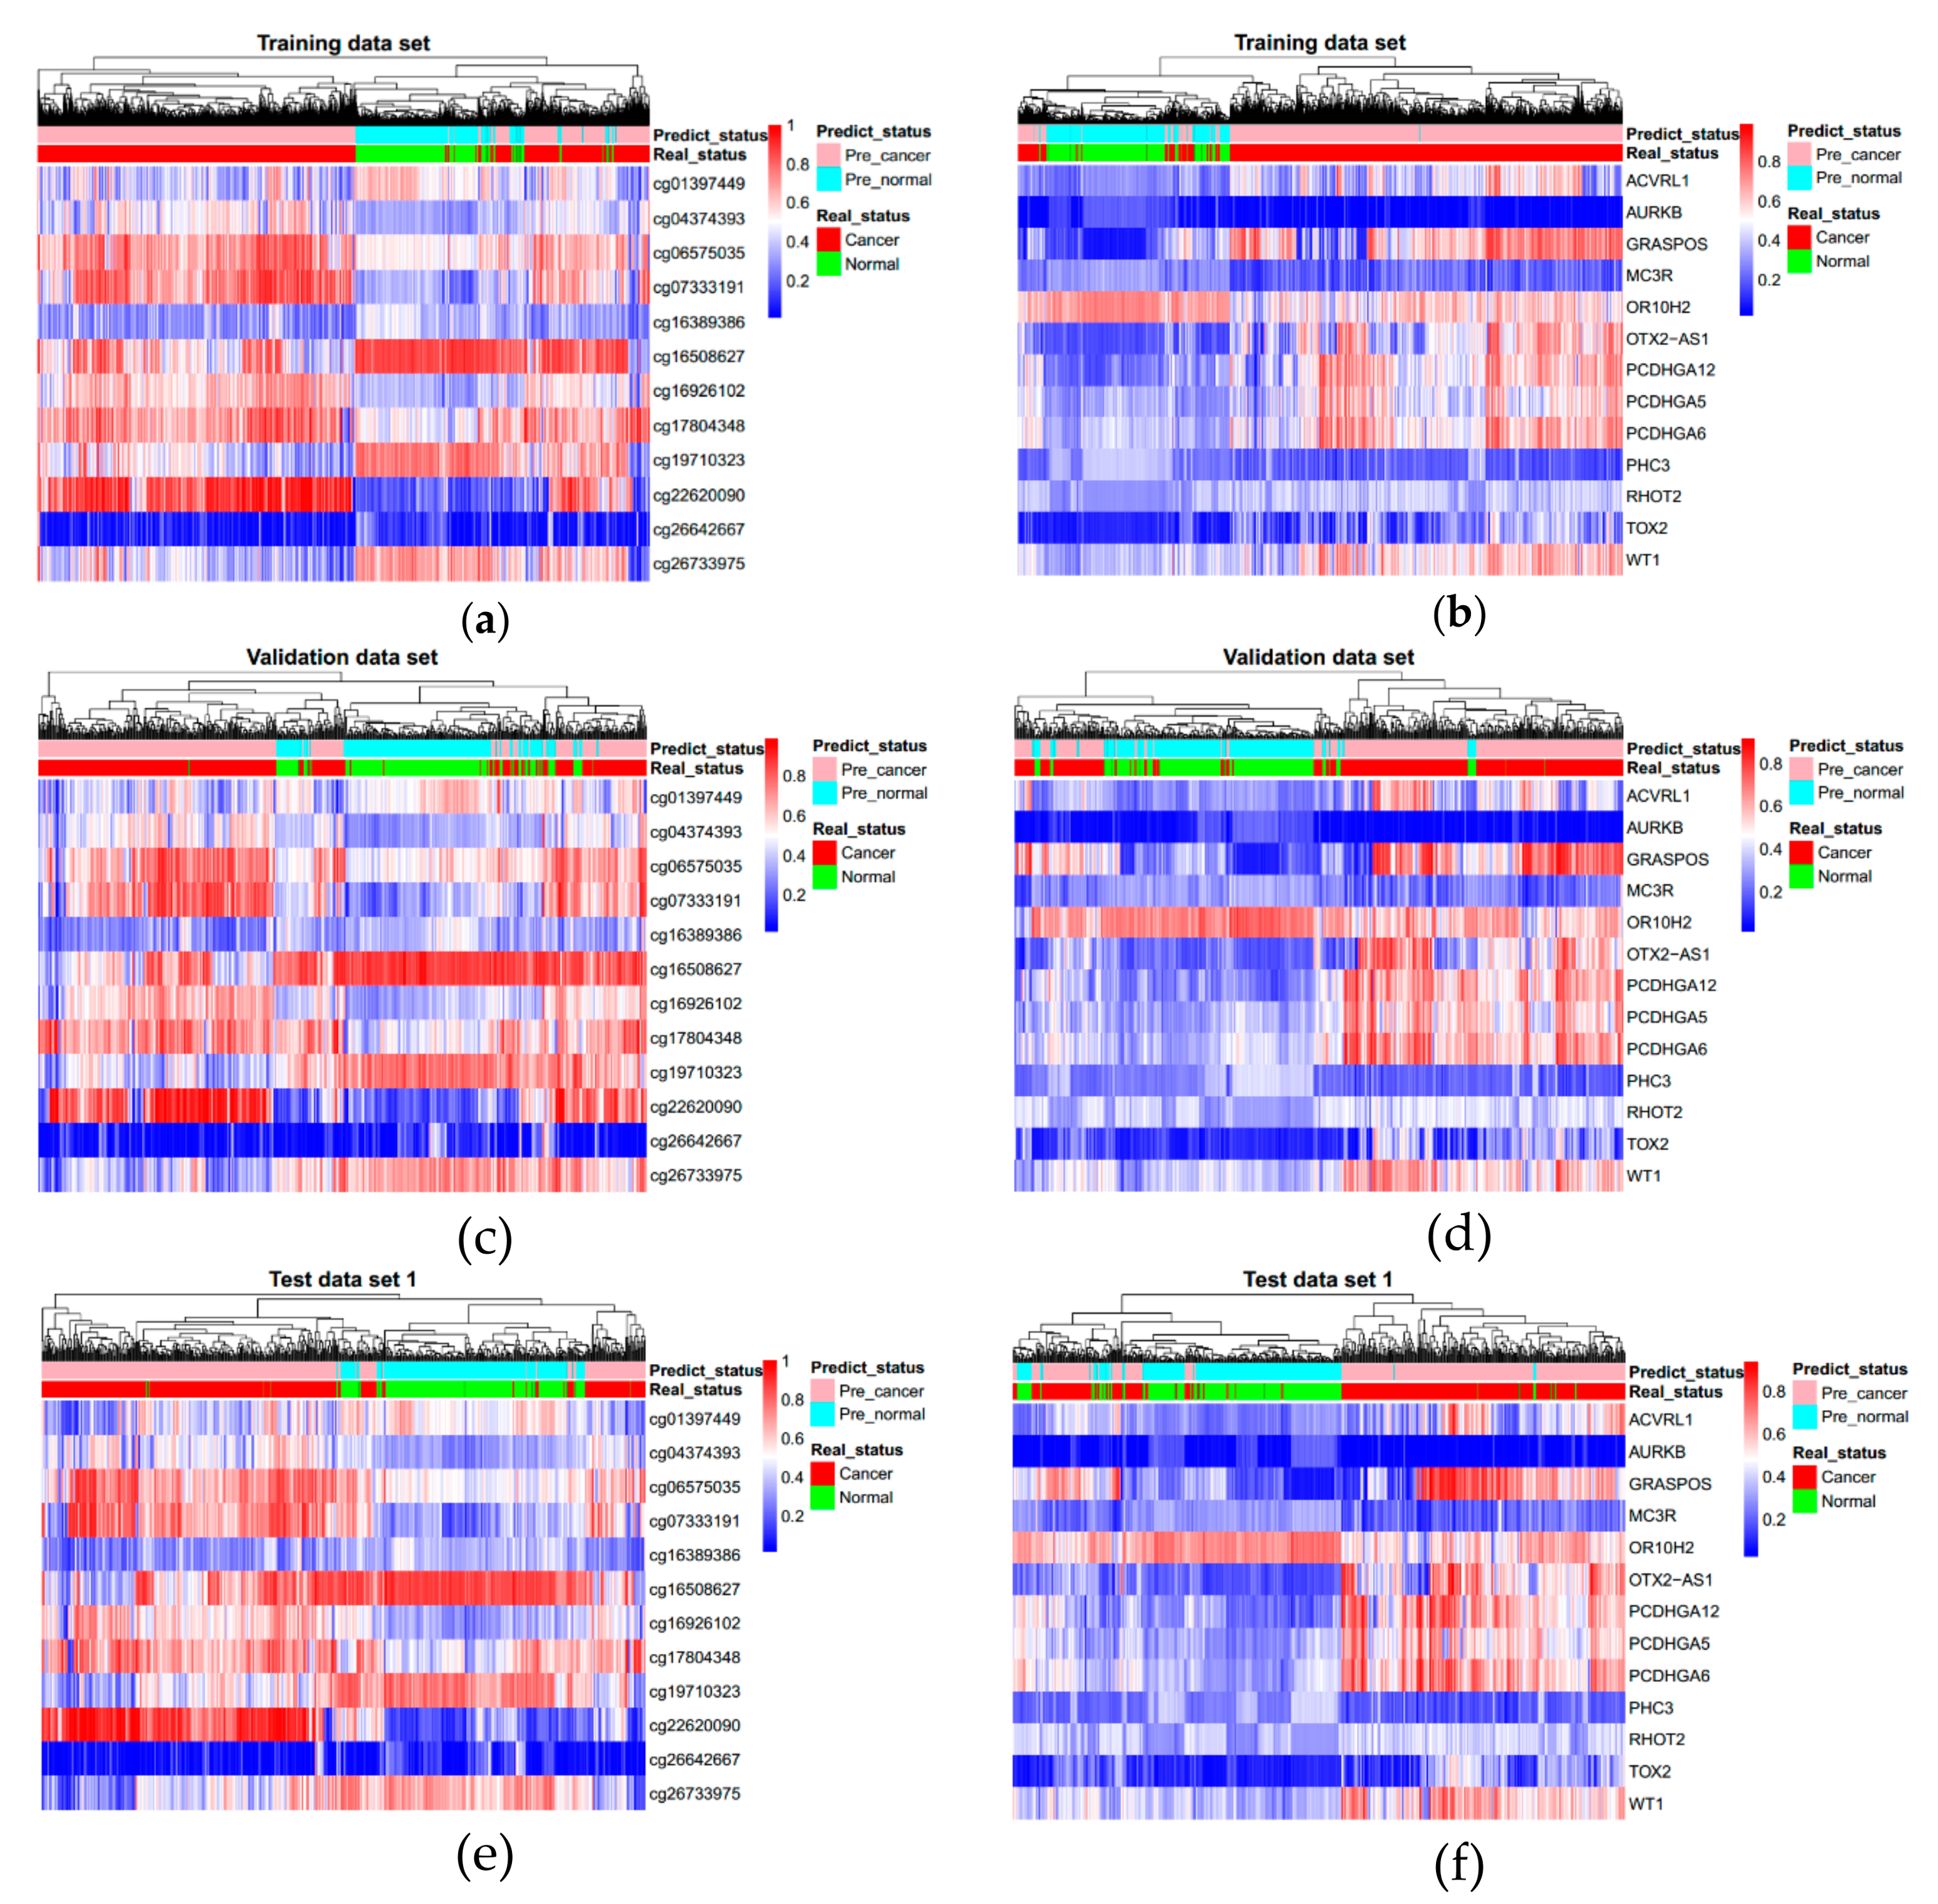
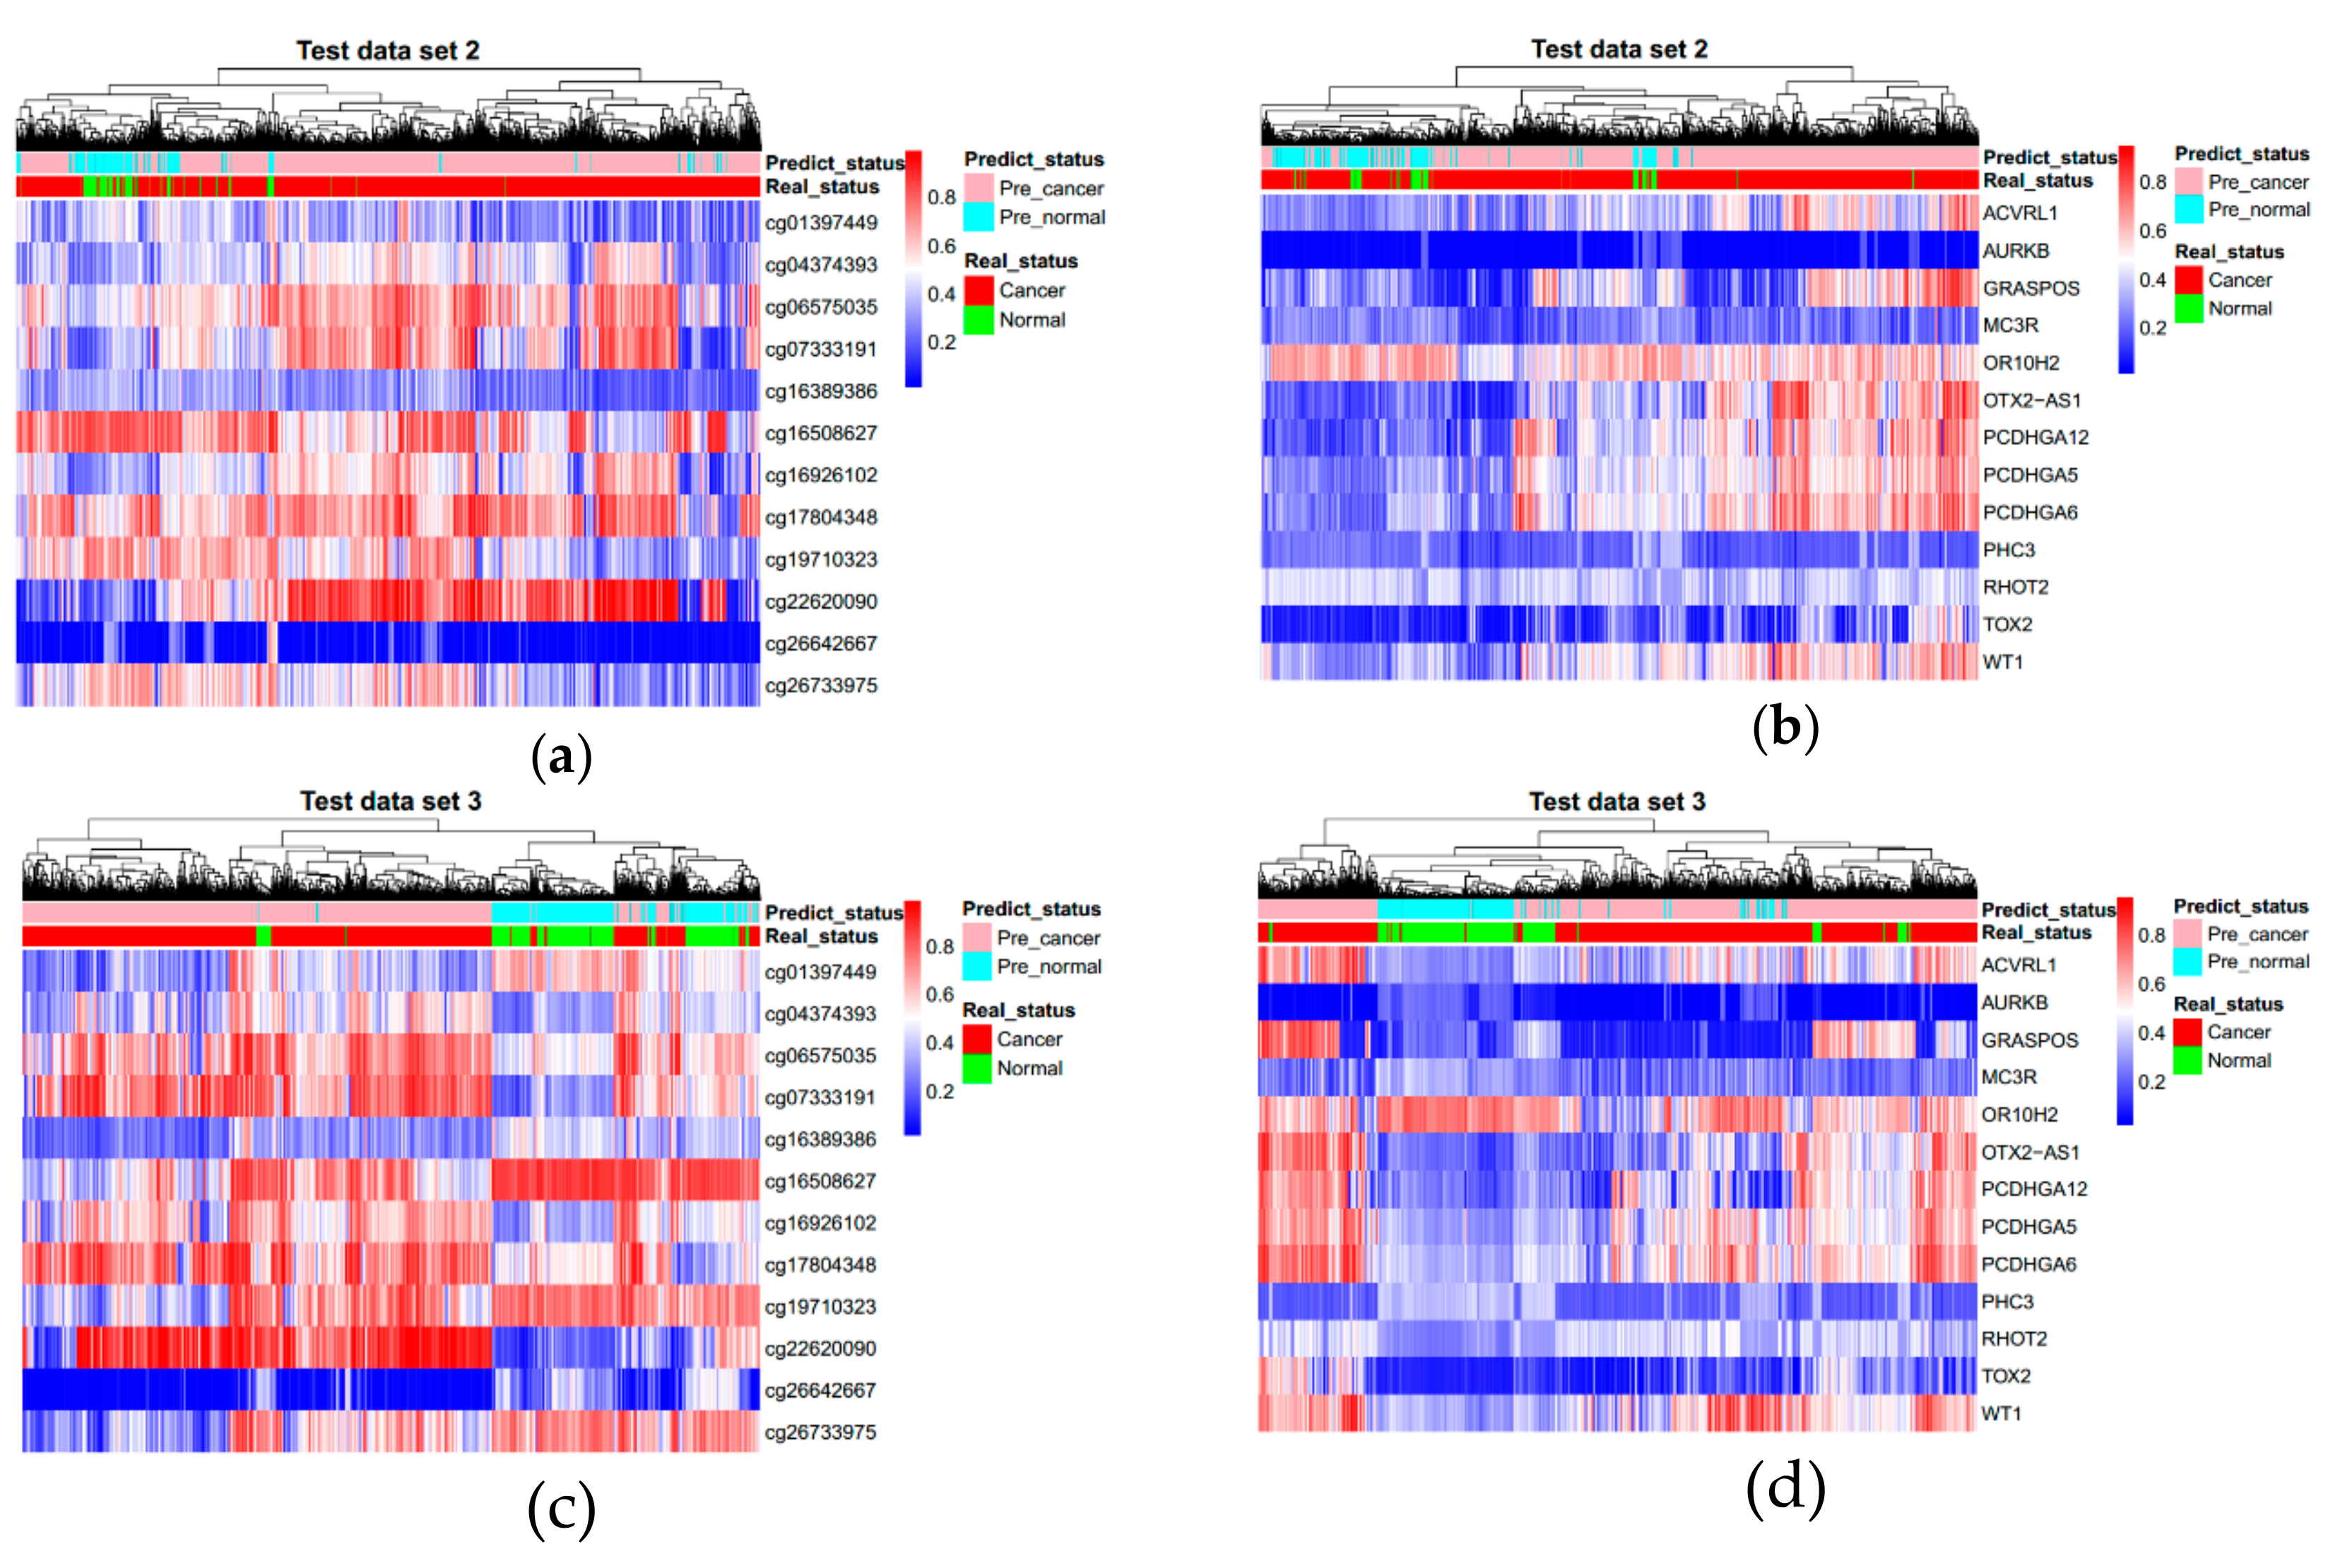
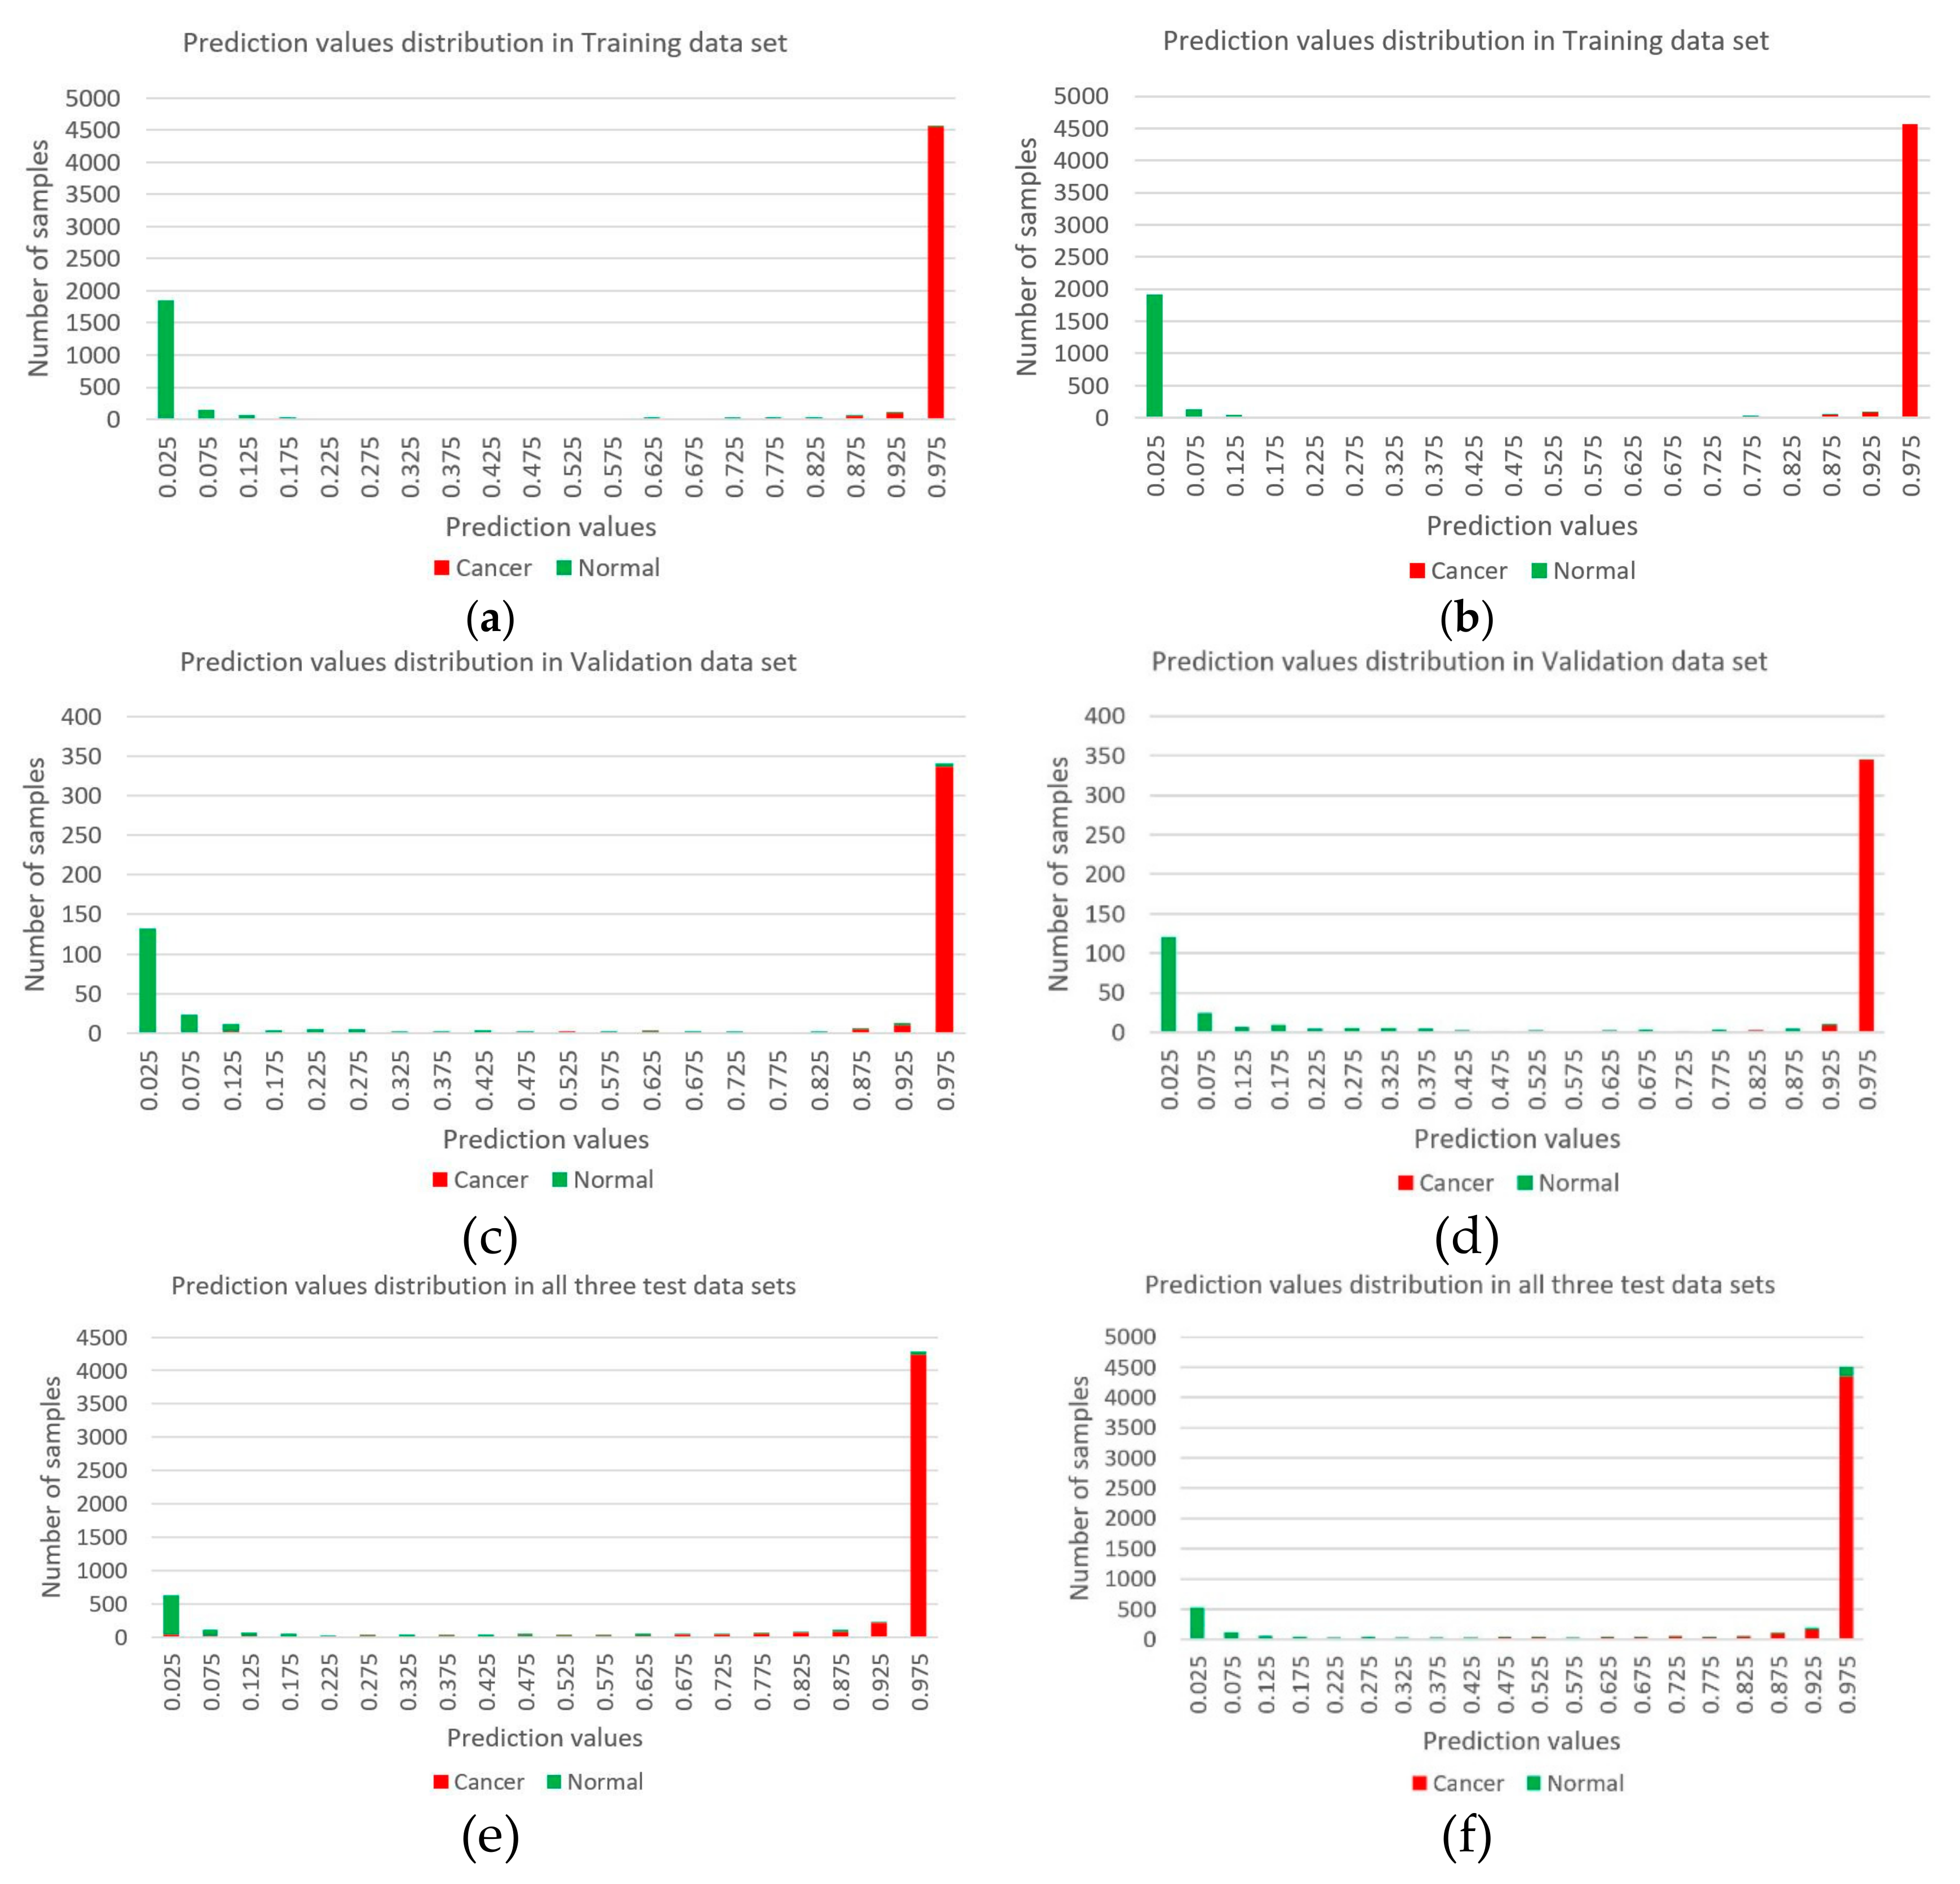
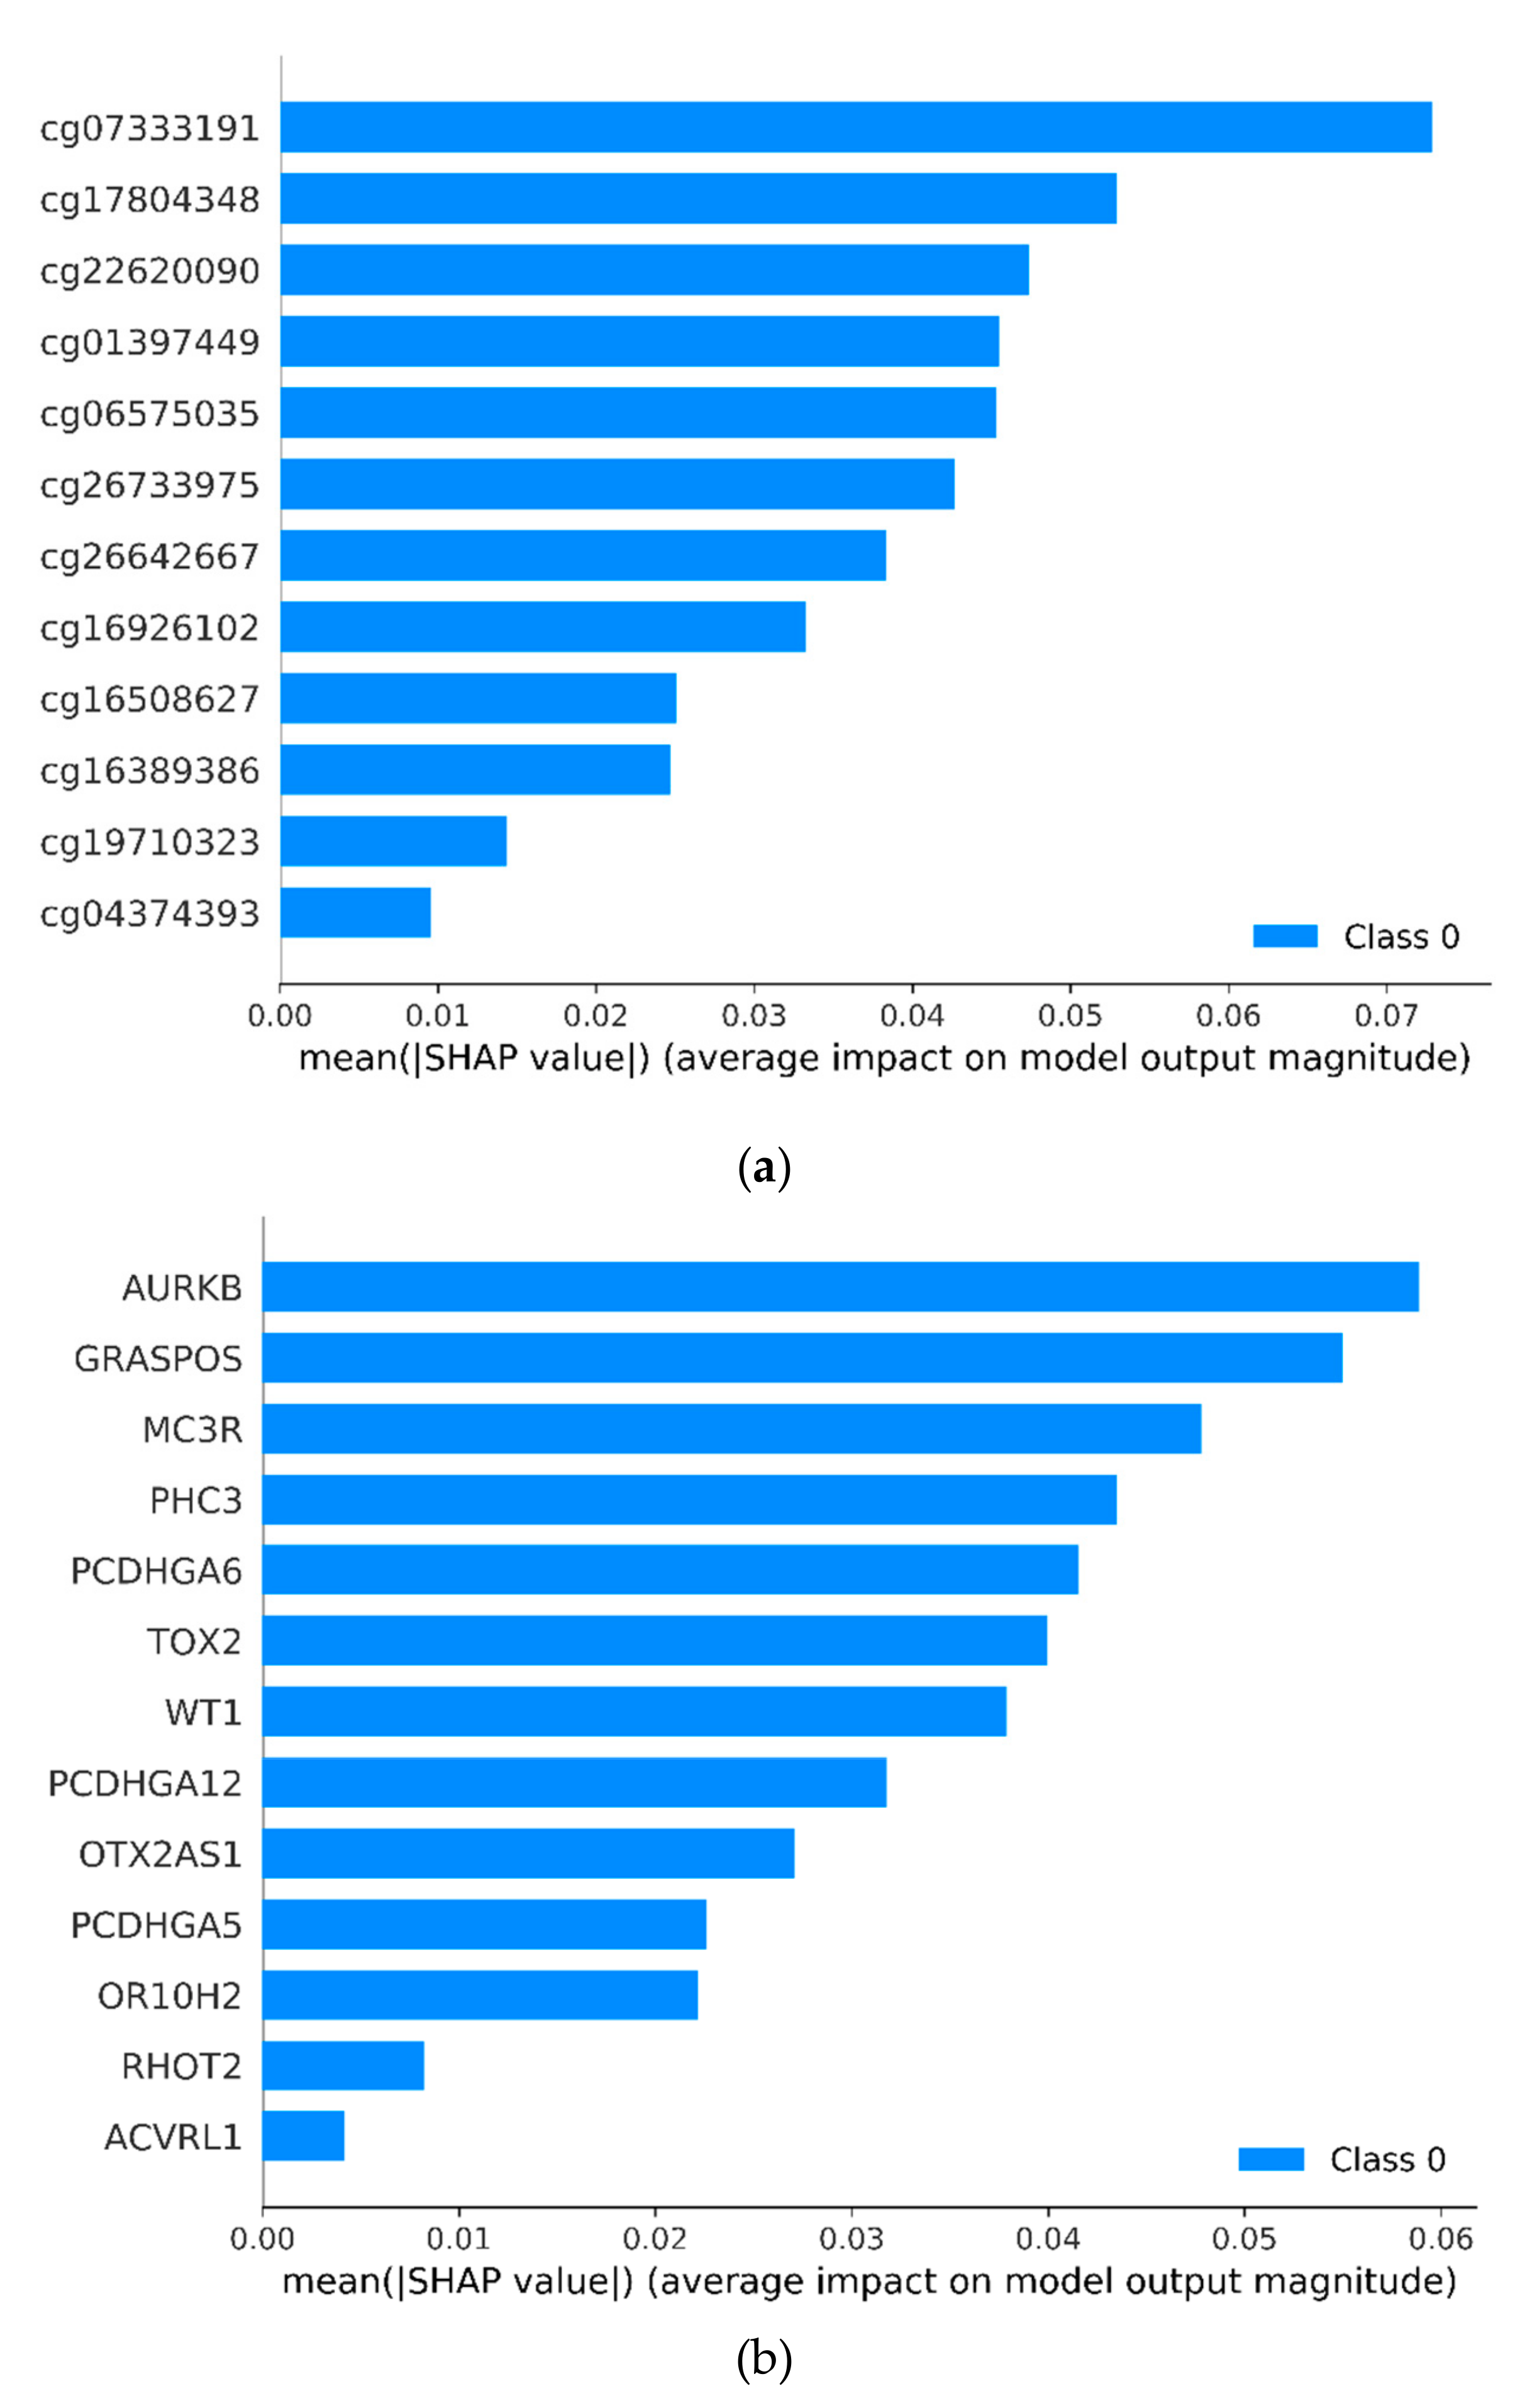
3.3. Evaluating Reliability of Markers and Diagnostic Prediction Models
4. Discussion
5. Conclusions
Supplementary Materials
Author Contributions
Funding
Acknowledgments
Conflicts of Interest
References
- Bird, A. Perceptions of epigenetics. Nature 2007, 447, 396–398. [Google Scholar] [CrossRef] [PubMed]
- Vaissière, T.; Sawan, C.; Herceg, Z. Epigenetic interplay between histone modifications and DNA methylation in gene silencing. Mutat. Res./Rev. Mutat. Res. 2008, 659, 40–48. [Google Scholar]
- Suzuki, M.M.; Bird, A. DNA methylation landscapes: Provocative insights from epigenomics. Nat. Rev. Genet. 2008, 9, 465–476. [Google Scholar] [CrossRef] [PubMed]
- Bird, A.P.; Wolffe, A.P. Methylation-induced repression—Belts, braces, and chromatin. Cell 1999, 99, 451–454. [Google Scholar] [CrossRef]
- Herman, J.G.; Baylin, S.B. Gene silencing in cancer in association with promoter hypermethylation. N. Engl. J. Med. 2003, 349, 2042–2054. [Google Scholar] [CrossRef] [PubMed]
- Baylin, S.B. DNA methylation and gene silencing in cancer. Nat. Rev. Clin. Oncol. 2005, 2, S4–S11. [Google Scholar] [CrossRef]
- Dong, Y.; Zhao, H.; Li, H.; Li, X.; Yang, S. DNA methylation as an early diagnostic marker of cancer. Biomed. Rep. 2014, 2, 326–330. [Google Scholar] [CrossRef]
- Chen, Y.; Li, J.; Yu, X.; Li, S.; Zhang, X.; Mo, Z.; Hu, Y. APC gene hypermethylation and prostate cancer: A systematic review and meta-analysis. Eur. J. Hum. Genet. 2013, 21, 929–935. [Google Scholar] [CrossRef]
- Rivera, A.L.; Pelloski, C.E.; Gilbert, M.R.; Colman, H.; De La Cruz, C.; Sulman, E.P.; Bekele, B.N.; Aldape, K.D. MGMT promoter methylation is predictive of response to radiotherapy and prognostic in the absence of adjuvant alkylating chemotherapy for glioblastoma. Neuro-Oncology 2009, 12, 116–121. [Google Scholar] [CrossRef]
- Xu, R.-H.; Wei, W.; Krawczyk, M.; Wang, W.; Luo, H.; Flagg, K.; Yi, S.; Shi, W.; Quan, Q.; Li, K. Circulating tumour DNA methylation markers for diagnosis and prognosis of hepatocellular carcinoma. Nat. Mater. 2017, 16, 1155–1161. [Google Scholar] [CrossRef]
- Mikeska, T.; Craig, J. DNA methylation biomarkers: Cancer and beyond. Genes 2014, 5, 821–864. [Google Scholar] [CrossRef] [PubMed]
- Weinstein, J.N.; Collisson, E.A.; Mills, G.B.; Shaw, K.R.M.; Ozenberger, B.A.; Ellrott, K.; Shmulevich, I.; Sander, C.; Stuart, J.M.; Cancer Genome Atlas Research Network. The cancer genome atlas pan-cancer analysis project. Nat. Genet. 2013, 45, 1113–1120. [Google Scholar] [CrossRef] [PubMed]
- Witte, T.; Plass, C.; Gerhauser, C. Pan-cancer patterns of DNA methylation. Genome Med. 2014, 6, 66. [Google Scholar] [CrossRef] [PubMed]
- Yang, X.; Gao, L.; Zhang, S. Comparative pan-cancer DNA methylation analysis reveals cancer common and specific patterns. Brief. Bioinform. 2016, 18, 761–773. [Google Scholar] [CrossRef]
- Vrba, L.; Futscher, B.W. A suite of DNA methylation markers that can detect most common human cancers. Epigenetics 2018, 13, 61–72. [Google Scholar] [CrossRef] [PubMed]
- Barrett, T.; Wilhite, S.E.; Ledoux, P.; Evangelista, C.; Kim, I.F.; Tomashevsky, M.; Marshall, K.A.; Phillippy, K.H.; Sherman, P.M.; Holko, M. NCBI GEO: Archive for functional genomics data sets—update. Nucleic Acids Res. 2012, 41, D991–D995. [Google Scholar] [CrossRef]
- Huang, W.-Y.; Hsu, S.-D.; Huang, H.-Y.; Sun, Y.-M.; Chou, C.-H.; Weng, S.-L.; Huang, H.-D. MethHC: A database of DNA methylation and gene expression in human cancer. Nucleic Acids Res. 2014, 43, D856–D861. [Google Scholar] [CrossRef] [PubMed]
- Pan, X.; Liu, B.; Wen, X.; Liu, Y.; Zhang, X.; Li, S. D-GPM: A deep learning method for gene promoter methylation inference. bioRxiv 2018. [Google Scholar] [CrossRef]
- Gentleman, R.; Carey, V.; Huber, W.; Irizarry, R.; Dudoit, S. Bioinformatics and Computational Biology Solutions Using R and Bioconductor; Springer Science & Business Media: New York, NY, USA, 2006. [Google Scholar]
- Benjamini, Y.; Hochberg, Y. Controlling the false discovery rate: A practical and powerful approach to multiple testing. J. R. Stat. Soc. Ser. B 1995, 57, 289–300. [Google Scholar] [CrossRef]
- Tibshirani, R. Regression shrinkage and selection via the lasso. J. R. Stat. Soc. Ser. B 1996, 58, 267–288. [Google Scholar] [CrossRef]
- Diaz-Uriarte, R. GeneSrF and varSelRF: A web-based tool and R package for gene selection and classification using random forest. BMC Bioinform. 2007, 8, 328. [Google Scholar] [CrossRef] [PubMed]
- Bergstra, J.; Bengio, Y. Random search for hyper-parameter optimization. J. Mach. Learn. Res. 2012, 13, 281–305. [Google Scholar]
- Abadi, M.; Barham, P.; Chen, J.; Chen, Z.; Davis, A.; Dean, J.; Devin, M.; Ghemawat, S.; Irving, G.; Isard, M. Tensorflow: A system for large-scale machine learning. In Proceedings of the 12th USENIX Symposium on Operating Systems Design and Implementation (OSDI ′16), Savannah, GA, USA, 2–4 November 2016; pp. 265–283. [Google Scholar]
- Matthews, B.W. Comparison of the predicted and observed secondary structure of T4 phage lysozyme. Biochim. Biophys. Acta (Bba)-Protein Struct. 1975, 405, 442–451. [Google Scholar] [CrossRef]
- Lundberg, S.M.; Lee, S.-I. A unified approach to interpreting model predictions. In Proceedings of the 31st Conference on Neural Information Processing Systems (NIPS 2017), Long Beach, CA, USA, 4–9 December 2017; pp. 4765–4774. [Google Scholar]
- Li, J.; Lenferink, A.E.; Deng, Y.; Collins, C.; Cui, Q.; Purisima, E.O.; O’Connor-McCourt, M.D.; Wang, E. Identification of high-quality cancer prognostic markers and metastasis network modules. Nat. Commun. 2010, 1, 34. [Google Scholar] [CrossRef] [PubMed]
- Lui, Y.Y.; Chik, K.-W.; Chiu, R.W.; Ho, C.-Y.; Lam, C.W.; Lo, Y.D. Predominant hematopoietic origin of cell-free DNA in plasma and serum after sex-mismatched bone marrow transplantation. Clin. Chem. 2002, 48, 421–427. [Google Scholar] [PubMed]
| Markers | Ref Gene | Coefficients | SE | z Value | p Value |
|---|---|---|---|---|---|
| 4.28017 | 0.12365 | 34.614 | <0.001 | ||
| cg01397449 | EXOC3L1 | −1.26195 | 0.0828 | −15.241 | <0.001 |
| cg04374393 | SOX14 | 0.44095 | 0.10759 | 4.098 | <0.001 |
| cg06575035 | PCDHGA1 | 1.0089 | 0.09321 | 10.823 | <0.001 |
| cg07333191 | Chr4:13 | 0.5435 | 0.11389 | 4.772 | <0.001 |
| cg16389386 | Chr7:154 | −0.38554 | 0.06408 | −6.016 | <0.001 |
| cg16508627 | HS3ST2 | −0.54732 | 0.11407 | −4.798 | <0.001 |
| cg16926102 | Chr10:23 | 0.8946 | 0.11951 | 7.486 | <0.001 |
| cg17804348 | TP73 | 1.09724 | 0.06442 | 17.033 | <0.001 |
| cg19710323 | Chr12:34 | −0.8628 | 0.10259 | −8.41 | <0.001 |
| cg22620090 | Chr6:104 | 0.36339 | 0.07759 | 4.683 | <0.001 |
| cg26642667 | SND1 | −0.85746 | 0.04911 | −17.461 | <0.001 |
| cg26733975 | RP11–760D2.1 | −0.97163 | 0.10248 | −9.481 | <0.001 |
| Markers | Coefficients | SE | z Value | p Value |
|---|---|---|---|---|
| 2.6472 | 0.5316 | 4.979 | <0.001 | |
| ACVRL1 | 5.5848 | 0.7523 | 7.423 | <0.001 |
| AURKB | −3.9969 | 1.2242 | −3.265 | 0.001 |
| GRASPOS | −1.0094 | 0.3599 | −2.805 | 0.005 |
| MC3R | −12.2853 | 0.858 | −14.319 | <0.001 |
| OR10H2 | −6.8254 | 0.6101 | −11.188 | <0.001 |
| OTX2-AS1 | 3.664 | 0.6136 | 5.972 | <0.001 |
| PCDHGA12 | 0.6188 | 0.5294 | 1.169 | 0.242 |
| PCDHGA5 | 1.8653 | 0.704 | 2.649 | 0.008 |
| PCDHGA6 | 1.0961 | 0.6552 | 1.673 | 0.094 |
| PHC3 | −12.865 | 0.9678 | −13.293 | <0.001 |
| RHOT2 | 11.3143 | 0.8959 | 12.628 | <0.001 |
| TOX2 | 3.039 | 0.8061 | 3.77 | <0.001 |
| WT1 | 4.5058 | 0.4796 | 9.394 | <0.001 |
| Marker | Data Set | Total | Cancer | Normal | Total Accuracy | MCC | ||||||
|---|---|---|---|---|---|---|---|---|---|---|---|---|
| Cancer Total | Predict Cancer | Predict Normal | Sensitivity | Normal Total | Predict Cancer | Predict Normal | Specificity | |||||
| CpG | Training | 7003 | 4827 | 4734 | 93 | 0.981 | 2176 | 11 | 2165 | 0.995 | 0.985 | 0.966 |
| Validation | 571 | 370 | 352 | 18 | 0.951 | 201 | 10 | 191 | 0.95 | 0.951 | 0.894 | |
| Test set 1 | 571 | 370 | 360 | 10 | 0.973 | 201 | 9 | 192 | 0.955 | 0.967 | 0.927 | |
| Test set 2 | 3309 | 3041 | 2795 | 246 | 0.919 | 268 | 39 | 229 | 0.854 | 0.914 | 0.602 | |
| Test set 3 | 2072 | 1532 | 1433 | 99 | 0.935 | 540 | 52 | 488 | 0.904 | 0.927 | 0.817 | |
| All three test sets | 5952 | 4943 | 4588 | 355 | 0.928 | 1009 | 100 | 909 | 0.901 | 0.924 | 0.761 | |
| Promoter | Training | 7003 | 4827 | 4676 | 151 | 0.969 | 2176 | 3 | 2173 | 0.999 | 0.978 | 0.951 |
| Validation | 571 | 370 | 354 | 16 | 0.957 | 201 | 5 | 196 | 0.975 | 0.963 | 0.921 | |
| Test set 1 | 571 | 370 | 353 | 17 | 0.954 | 201 | 8 | 193 | 0.96 | 0.956 | 0.906 | |
| Test set 2 | 3309 | 3041 | 2641 | 400 | 0.868 | 268 | 28 | 240 | 0.9 | 0.871 | 0.528 | |
| Test set 3 | 2072 | 1532 | 1443 | 89 | 0.942 | 540 | 155 | 385 | 0.713 | 0.882 | 0.684 | |
| All three test sets | 5952 | 4943 | 4437 | 506 | 0.898 | 1009 | 191 | 818 | 0.811 | 0.883 | 0.639 | |
| Data Set | Tissue Types | Total | Cancer | Normal | Total Accuracy | MCC | ||||||
|---|---|---|---|---|---|---|---|---|---|---|---|---|
| Cancer Total | Predict Cancer | Predict Normal | Sensitivity | Normal Total | Predict Cancer | Predict Normal | Specificity | |||||
| Training | Breast | 1122 | 1006 | 993 | 13 | 0.987 | 116 | 2 | 114 | 0.983 | 0.987 | 0.932 |
| Colorectal | 390 | 371 | 367 | 4 | 0.989 | 19 | 0 | 19 | 1 | 0.99 | 0.904 | |
| Kidney | 794 | 593 | 573 | 20 | 0.966 | 201 | 0 | 201 | 1 | 0.975 | 0.937 | |
| Leukocyte | 576 | 0 | 0 | 0 | - | 576 | 1 | 575 | 0.998 | 0.998 | 0 | |
| Liver | 442 | 366 | 355 | 11 | 0.97 | 76 | 0 | 76 | 1 | 0.975 | 0.92 | |
| Lung | 1155 | 857 | 839 | 18 | 0.979 | 298 | 2 | 296 | 0.993 | 0.983 | 0.956 | |
| Prostate | 529 | 491 | 476 | 15 | 0.969 | 38 | 0 | 38 | 1 | 0.972 | 0.834 | |
| Uterus | 432 | 416 | 415 | 1 | 0.998 | 16 | 0 | 16 | 1 | 0.998 | 0.969 | |
| Validation | Breast | 85 | 60 | 60 | 0 | 1 | 25 | 1 | 24 | 0.96 | 0.988 | 0.972 |
| Colorectal | 56 | 40 | 40 | 0 | 1 | 16 | 2 | 14 | 0.875 | 0.964 | 0.913 | |
| Kidney | 85 | 60 | 56 | 4 | 0.933 | 25 | 0 | 25 | 1 | 0.953 | 0.897 | |
| Leukocyte | 40 | 0 | 0 | 0 | - | 40 | 0 | 40 | 1 | 1 | 0 | |
| Liver | 60 | 40 | 40 | 0 | 1 | 20 | 0 | 20 | 1 | 1 | 1 | |
| Lung | 120 | 80 | 73 | 7 | 0.912 | 40 | 1 | 39 | 0.975 | 0.933 | 0.86 | |
| Prostate | 70 | 50 | 44 | 6 | 0.88 | 20 | 5 | 15 | 0.75 | 0.843 | 0.621 | |
| Uterus | 55 | 40 | 39 | 1 | 0.975 | 15 | 1 | 14 | 0.933 | 0.964 | 0.908 | |
| Test 1 | Breast | 85 | 60 | 58 | 2 | 0.967 | 25 | 1 | 24 | 0.96 | 0.965 | 0.916 |
| Colorectal | 56 | 40 | 40 | 0 | 1 | 16 | 1 | 15 | 0.938 | 0.982 | 0.956 | |
| Kidney | 85 | 60 | 58 | 2 | 0.967 | 25 | 0 | 25 | 1 | 0.976 | 0.946 | |
| Leukocyte | 40 | 0 | 0 | 0 | - | 40 | 0 | 40 | 1 | 1 | 0 | |
| Liver | 60 | 40 | 38 | 2 | 0.95 | 20 | 1 | 19 | 0.95 | 0.95 | 0.889 | |
| Lung | 120 | 80 | 80 | 0 | 1 | 40 | 0 | 40 | 1 | 1 | 1 | |
| Prostate | 70 | 50 | 46 | 4 | 0.92 | 20 | 5 | 15 | 0.75 | 0.871 | 0.681 | |
| Uterus | 55 | 40 | 40 | 0 | 1 | 15 | 1 | 14 | 0.933 | 0.982 | 0.954 | |
| Data Set | Tissue Types | Total | Cancer | Normal | Total Accuracy | MCC | ||||||
|---|---|---|---|---|---|---|---|---|---|---|---|---|
| Cancer Total | Predict Cancer | Predict Normal | Sensitivity | Normal Total | Predict Cancer | Predict Normal | Specificity | |||||
| Training | Breast | 1122 | 1006 | 984 | 22 | 0.978 | 116 | 1 | 115 | 0.991 | 0.98 | 0.902 |
| Colorectal | 390 | 371 | 370 | 1 | 0.997 | 19 | 0 | 19 | 1 | 0.997 | 0.973 | |
| Kidney | 794 | 593 | 545 | 48 | 0.919 | 201 | 0 | 201 | 1 | 0.94 | 0.861 | |
| Leukocyte | 576 | 0 | 0 | 0 | - | 576 | 0 | 576 | 1 | 1 | 0 | |
| Liver | 442 | 366 | 354 | 12 | 0.967 | 76 | 0 | 76 | 1 | 0.973 | 0.914 | |
| Lung | 1155 | 857 | 829 | 28 | 0.967 | 298 | 0 | 298 | 1 | 0.976 | 0.94 | |
| Prostate | 529 | 491 | 470 | 21 | 0.957 | 38 | 1 | 37 | 0.974 | 0.958 | 0.769 | |
| Uterus | 432 | 416 | 416 | 0 | 1 | 16 | 1 | 15 | 0.938 | 0.998 | 0.967 | |
| Validation | Breast | 85 | 60 | 59 | 1 | 0.983 | 25 | 0 | 25 | 1 | 0.988 | 0.972 |
| Colorectal | 56 | 40 | 40 | 0 | 1 | 16 | 0 | 16 | 1 | 1 | 1 | |
| Kidney | 85 | 60 | 57 | 3 | 0.95 | 25 | 0 | 25 | 1 | 0.965 | 0.921 | |
| Leukocyte | 40 | 0 | 0 | 0 | - | 40 | 0 | 40 | 1 | 1 | 0 | |
| Liver | 60 | 40 | 40 | 0 | 1 | 20 | 0 | 20 | 1 | 1 | 1 | |
| Lung | 120 | 80 | 70 | 10 | 0.875 | 40 | 0 | 40 | 1 | 0.917 | 0.837 | |
| Prostate | 70 | 50 | 48 | 2 | 0.96 | 20 | 3 | 17 | 0.85 | 0.929 | 0.823 | |
| Uterus | 55 | 40 | 40 | 0 | 1 | 15 | 2 | 13 | 0.867 | 0.964 | 0.909 | |
| Test set 1 | Breast | 85 | 60 | 57 | 3 | 0.95 | 25 | 0 | 25 | 1 | 0.965 | 0.921 |
| Colorectal | 56 | 40 | 40 | 0 | 1 | 16 | 0 | 16 | 1 | 1 | 1 | |
| Kidney | 85 | 60 | 56 | 4 | 0.933 | 25 | 0 | 25 | 1 | 0.953 | 0.897 | |
| Leukocyte | 40 | 0 | 0 | 0 | - | 40 | 0 | 40 | 1 | 1 | 0 | |
| Liver | 60 | 40 | 38 | 2 | 0.95 | 20 | 1 | 19 | 0.95 | 0.95 | 0.889 | |
| Lung | 120 | 80 | 77 | 3 | 0.963 | 40 | 0 | 40 | 1 | 0.975 | 0.946 | |
| Prostate | 70 | 50 | 45 | 5 | 0.9 | 20 | 5 | 15 | 0.75 | 0.857 | 0.65 | |
| Uterus | 55 | 40 | 40 | 0 | 1 | 15 | 2 | 13 | 0.867 | 0.964 | 0.909 | |
| Data Set | Tissue Types | Total | Cancer | Normal | Total Accuracy | MCC | ||||||
|---|---|---|---|---|---|---|---|---|---|---|---|---|
| Cancer Total | Predict Cancer | Predict Normal | Sensitivity | Normal Total | Predict Cancer | Predict Normal | Specificity | |||||
| Test data set 2 | Adrenal gland | 267 | 264 | 213 | 51 | 0.807 | 3 | 0 | 3 | 1 | 0.809 | 0.212 |
| Bile duct | 45 | 36 | 36 | 0 | 1 | 9 | 0 | 9 | 1 | 1 | 1 | |
| Bladder | 440 | 419 | 411 | 8 | 0.981 | 21 | 3 | 18 | 0.857 | 0.975 | 0.758 | |
| Esophagus | 202 | 186 | 185 | 1 | 0.995 | 16 | 5 | 11 | 0.688 | 0.97 | 0.779 | |
| Eyes | 80 | 80 | 74 | 6 | 0.925 | 0 | 0 | 0 | - | 0.925 | 0 | |
| Head and neck | 580 | 530 | 529 | 1 | 0.998 | 50 | 10 | 40 | 0.8 | 0.981 | 0.874 | |
| Lymph nodes | 51 | 48 | 46 | 2 | 0.958 | 3 | 0 | 3 | 1 | 0.961 | 0.758 | |
| Oral | 104 | 65 | 46 | 19 | 0.708 | 39 | 2 | 37 | 0.949 | 0.798 | 0.637 | |
| Ovary | 10 | 10 | 10 | 0 | 1 | 0 | 0 | 0 | - | 1 | 0 | |
| Pancreas | 391 | 352 | 265 | 87 | 0.753 | 39 | 3 | 36 | 0.923 | 0.77 | 0.436 | |
| Pleura | 87 | 87 | 81 | 6 | 0.931 | 0 | 0 | 0 | - | 0.931 | 0 | |
| Small bowel | 56 | 28 | 27 | 1 | 0.964 | 28 | 4 | 24 | 0.857 | 0.911 | 0.826 | |
| Soft tissue | 269 | 265 | 250 | 15 | 0.943 | 4 | 0 | 4 | 1 | 0.944 | 0.446 | |
| Testis | 156 | 156 | 135 | 21 | 0.865 | 0 | 0 | 0 | - | 0.865 | 0 | |
| Thyroid | 571 | 515 | 487 | 28 | 0.946 | 56 | 12 | 44 | 0.786 | 0.93 | 0.655 | |
| Test data set 3 | Bone marrow | 386 | 325 | 257 | 68 | 0.791 | 61 | 0 | 61 | 1 | 0.824 | 0.611 |
| Cervix | 356 | 315 | 311 | 4 | 0.987 | 41 | 1 | 40 | 0.976 | 0.986 | 0.934 | |
| Nasopharynx | 48 | 24 | 19 | 5 | 0.792 | 24 | 2 | 22 | 0.917 | 0.854 | 0.714 | |
| Skin | 694 | 473 | 466 | 7 | 0.985 | 221 | 1 | 220 | 0.995 | 0.988 | 0.974 | |
| Stomach | 588 | 395 | 380 | 15 | 0.962 | 193 | 48 | 145 | 0.751 | 0.893 | 0.753 | |
| Data Set | Tissue Types | Total | Cancer | Normal | Total Accuracy | MCC | ||||||
|---|---|---|---|---|---|---|---|---|---|---|---|---|
| Cancer Total | Predict Cancer | Predict Normal | Sensitivity | Normal Total | Predict Cancer | Predict Normal | Specificity | |||||
| Test data set 2 | Adrenal gland | 267 | 264 | 251 | 13 | 0.951 | 3 | 0 | 3 | 1 | 0.951 | 0.422 |
| Bile duct | 45 | 36 | 36 | 0 | 1 | 9 | 0 | 9 | 1 | 1 | 1 | |
| Bladder | 440 | 419 | 414 | 5 | 0.988 | 21 | 3 | 18 | 0.857 | 0.982 | 0.81 | |
| Esophagus | 202 | 186 | 186 | 0 | 1 | 16 | 7 | 9 | 0.562 | 0.965 | 0.736 | |
| Eyes | 80 | 80 | 74 | 6 | 0.925 | 0 | 0 | 0 | - | 0.925 | 0 | |
| Head and neck | 580 | 530 | 523 | 7 | 0.987 | 50 | 6 | 44 | 0.88 | 0.978 | 0.859 | |
| Lymph nodes | 51 | 48 | 48 | 0 | 1 | 3 | 3 | 0 | 0 | 0.941 | 0 | |
| Oral | 104 | 65 | 37 | 28 | 0.569 | 39 | 2 | 37 | 0.949 | 0.712 | 0.518 | |
| Ovary | 10 | 10 | 10 | 0 | 1 | 0 | 0 | 0 | - | 1 | 0 | |
| Pancreas | 391 | 352 | 297 | 55 | 0.844 | 39 | 3 | 36 | 0.923 | 0.852 | 0.544 | |
| Pleura | 87 | 87 | 82 | 5 | 0.943 | 0 | 0 | 0 | - | 0.943 | 0 | |
| Small bowel | 56 | 28 | 27 | 1 | 0.964 | 28 | 2 | 26 | 0.929 | 0.946 | 0.893 | |
| Soft tissue | 269 | 265 | 263 | 2 | 0.992 | 4 | 0 | 4 | 1 | 0.993 | 0.813 | |
| Testis | 156 | 156 | 134 | 22 | 0.859 | 0 | 0 | 0 | - | 0.859 | 0 | |
| Thyroid | 571 | 515 | 259 | 256 | 0.503 | 56 | 2 | 54 | 0.964 | 0.548 | 0.279 | |
| Test data set 3 | Bone marrow | 386 | 325 | 261 | 64 | 0.803 | 61 | 0 | 61 | 1 | 0.834 | 0.626 |
| Cervix | 356 | 315 | 310 | 5 | 0.984 | 41 | 0 | 41 | 1 | 0.986 | 0.937 | |
| Nasopharynx | 48 | 24 | 9 | 15 | 0.375 | 24 | 0 | 24 | 1 | 0.688 | 0.48 | |
| Skin | 694 | 473 | 470 | 3 | 0.994 | 221 | 1 | 220 | 0.995 | 0.994 | 0.987 | |
| Stomach | 588 | 395 | 393 | 2 | 0.995 | 193 | 154 | 39 | 0.202 | 0.735 | 0.363 | |
© 2019 by the authors. Licensee MDPI, Basel, Switzerland. This article is an open access article distributed under the terms and conditions of the Creative Commons Attribution (CC BY) license (http://creativecommons.org/licenses/by/4.0/).
Share and Cite
Liu, B.; Liu, Y.; Pan, X.; Li, M.; Yang, S.; Li, S.C. DNA Methylation Markers for Pan-Cancer Prediction by Deep Learning. Genes 2019, 10, 778. https://doi.org/10.3390/genes10100778
Liu B, Liu Y, Pan X, Li M, Yang S, Li SC. DNA Methylation Markers for Pan-Cancer Prediction by Deep Learning. Genes. 2019; 10(10):778. https://doi.org/10.3390/genes10100778
Chicago/Turabian StyleLiu, Biao, Yulu Liu, Xingxin Pan, Mengyao Li, Shuang Yang, and Shuai Cheng Li. 2019. "DNA Methylation Markers for Pan-Cancer Prediction by Deep Learning" Genes 10, no. 10: 778. https://doi.org/10.3390/genes10100778
APA StyleLiu, B., Liu, Y., Pan, X., Li, M., Yang, S., & Li, S. C. (2019). DNA Methylation Markers for Pan-Cancer Prediction by Deep Learning. Genes, 10(10), 778. https://doi.org/10.3390/genes10100778


