
Visual Cortex Transcranial Direct Current Stimulation for Proliferative Diabetic Retinopathy Patients: A Double-Blinded Randomized Exploratory Trial


Abstract
1. Introduction
2. Materials and Methods
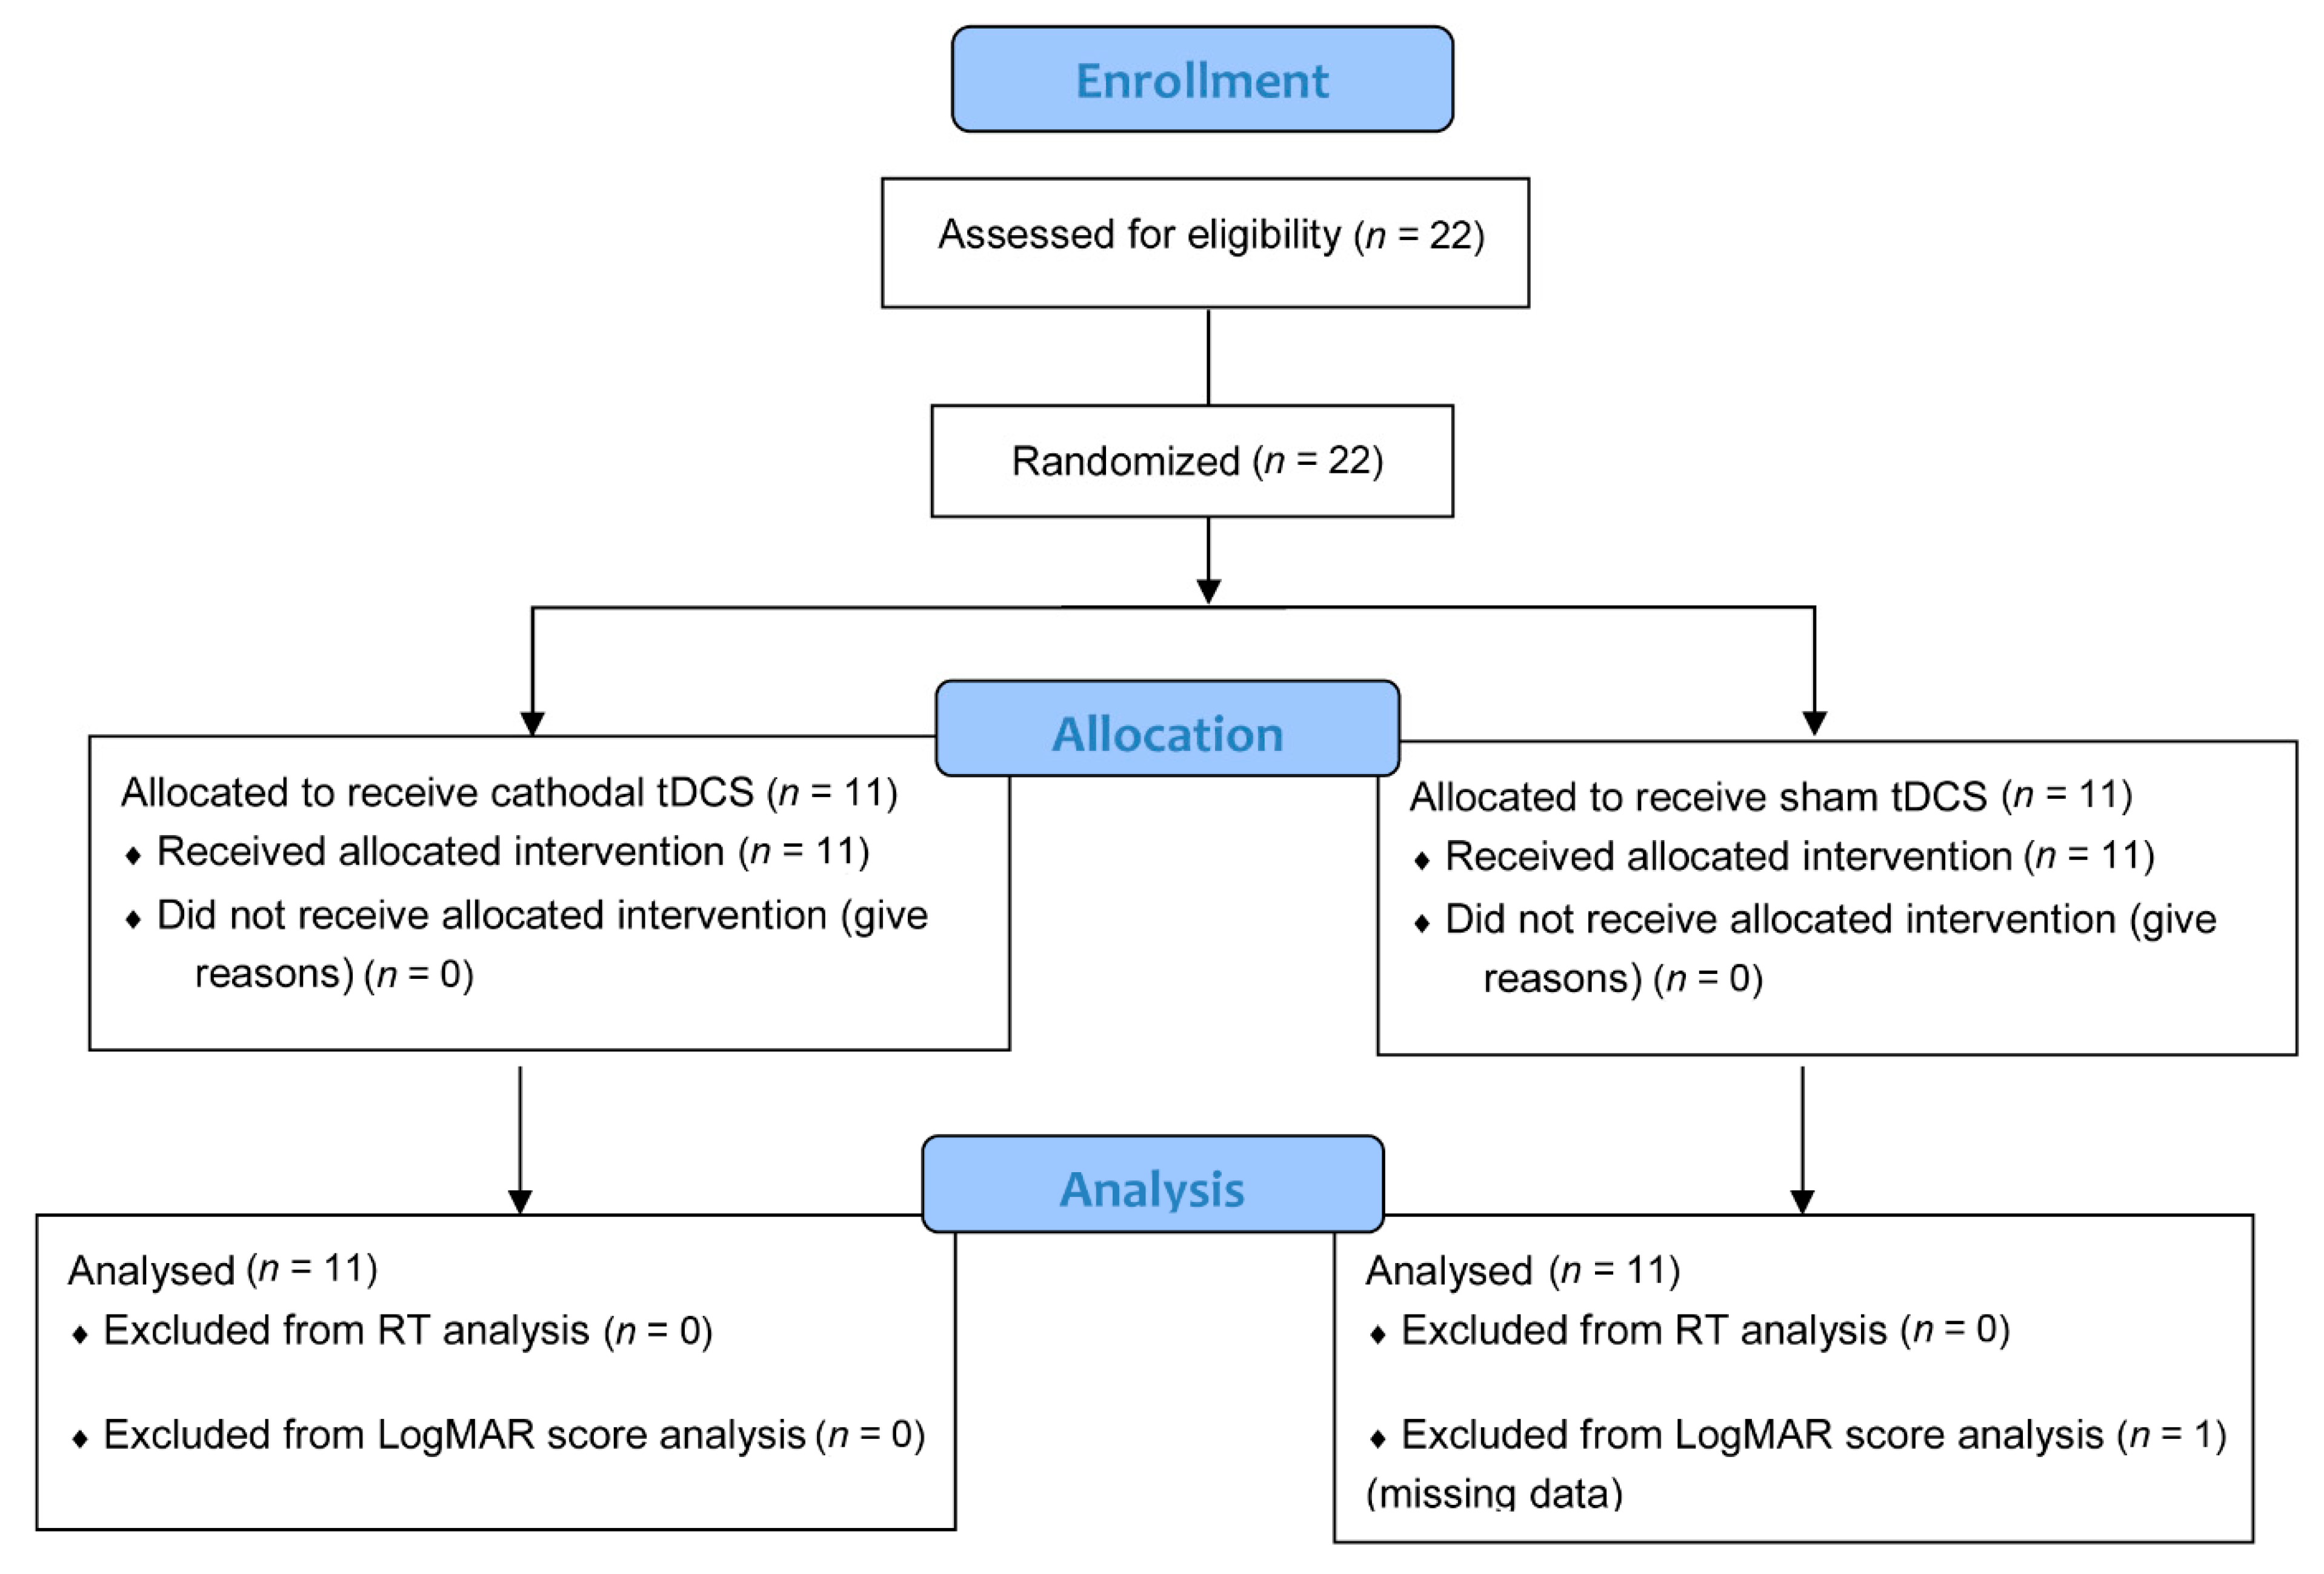
2.1. Participants
2.2. Experimental Design and Procedure
2.3. Transcranial Direct Current Stimulation (tDCS)
2.4. Visual Acuity Assessment
2.5. Numerical Discrimination Task
2.6. Statistical Analysis
3. Results
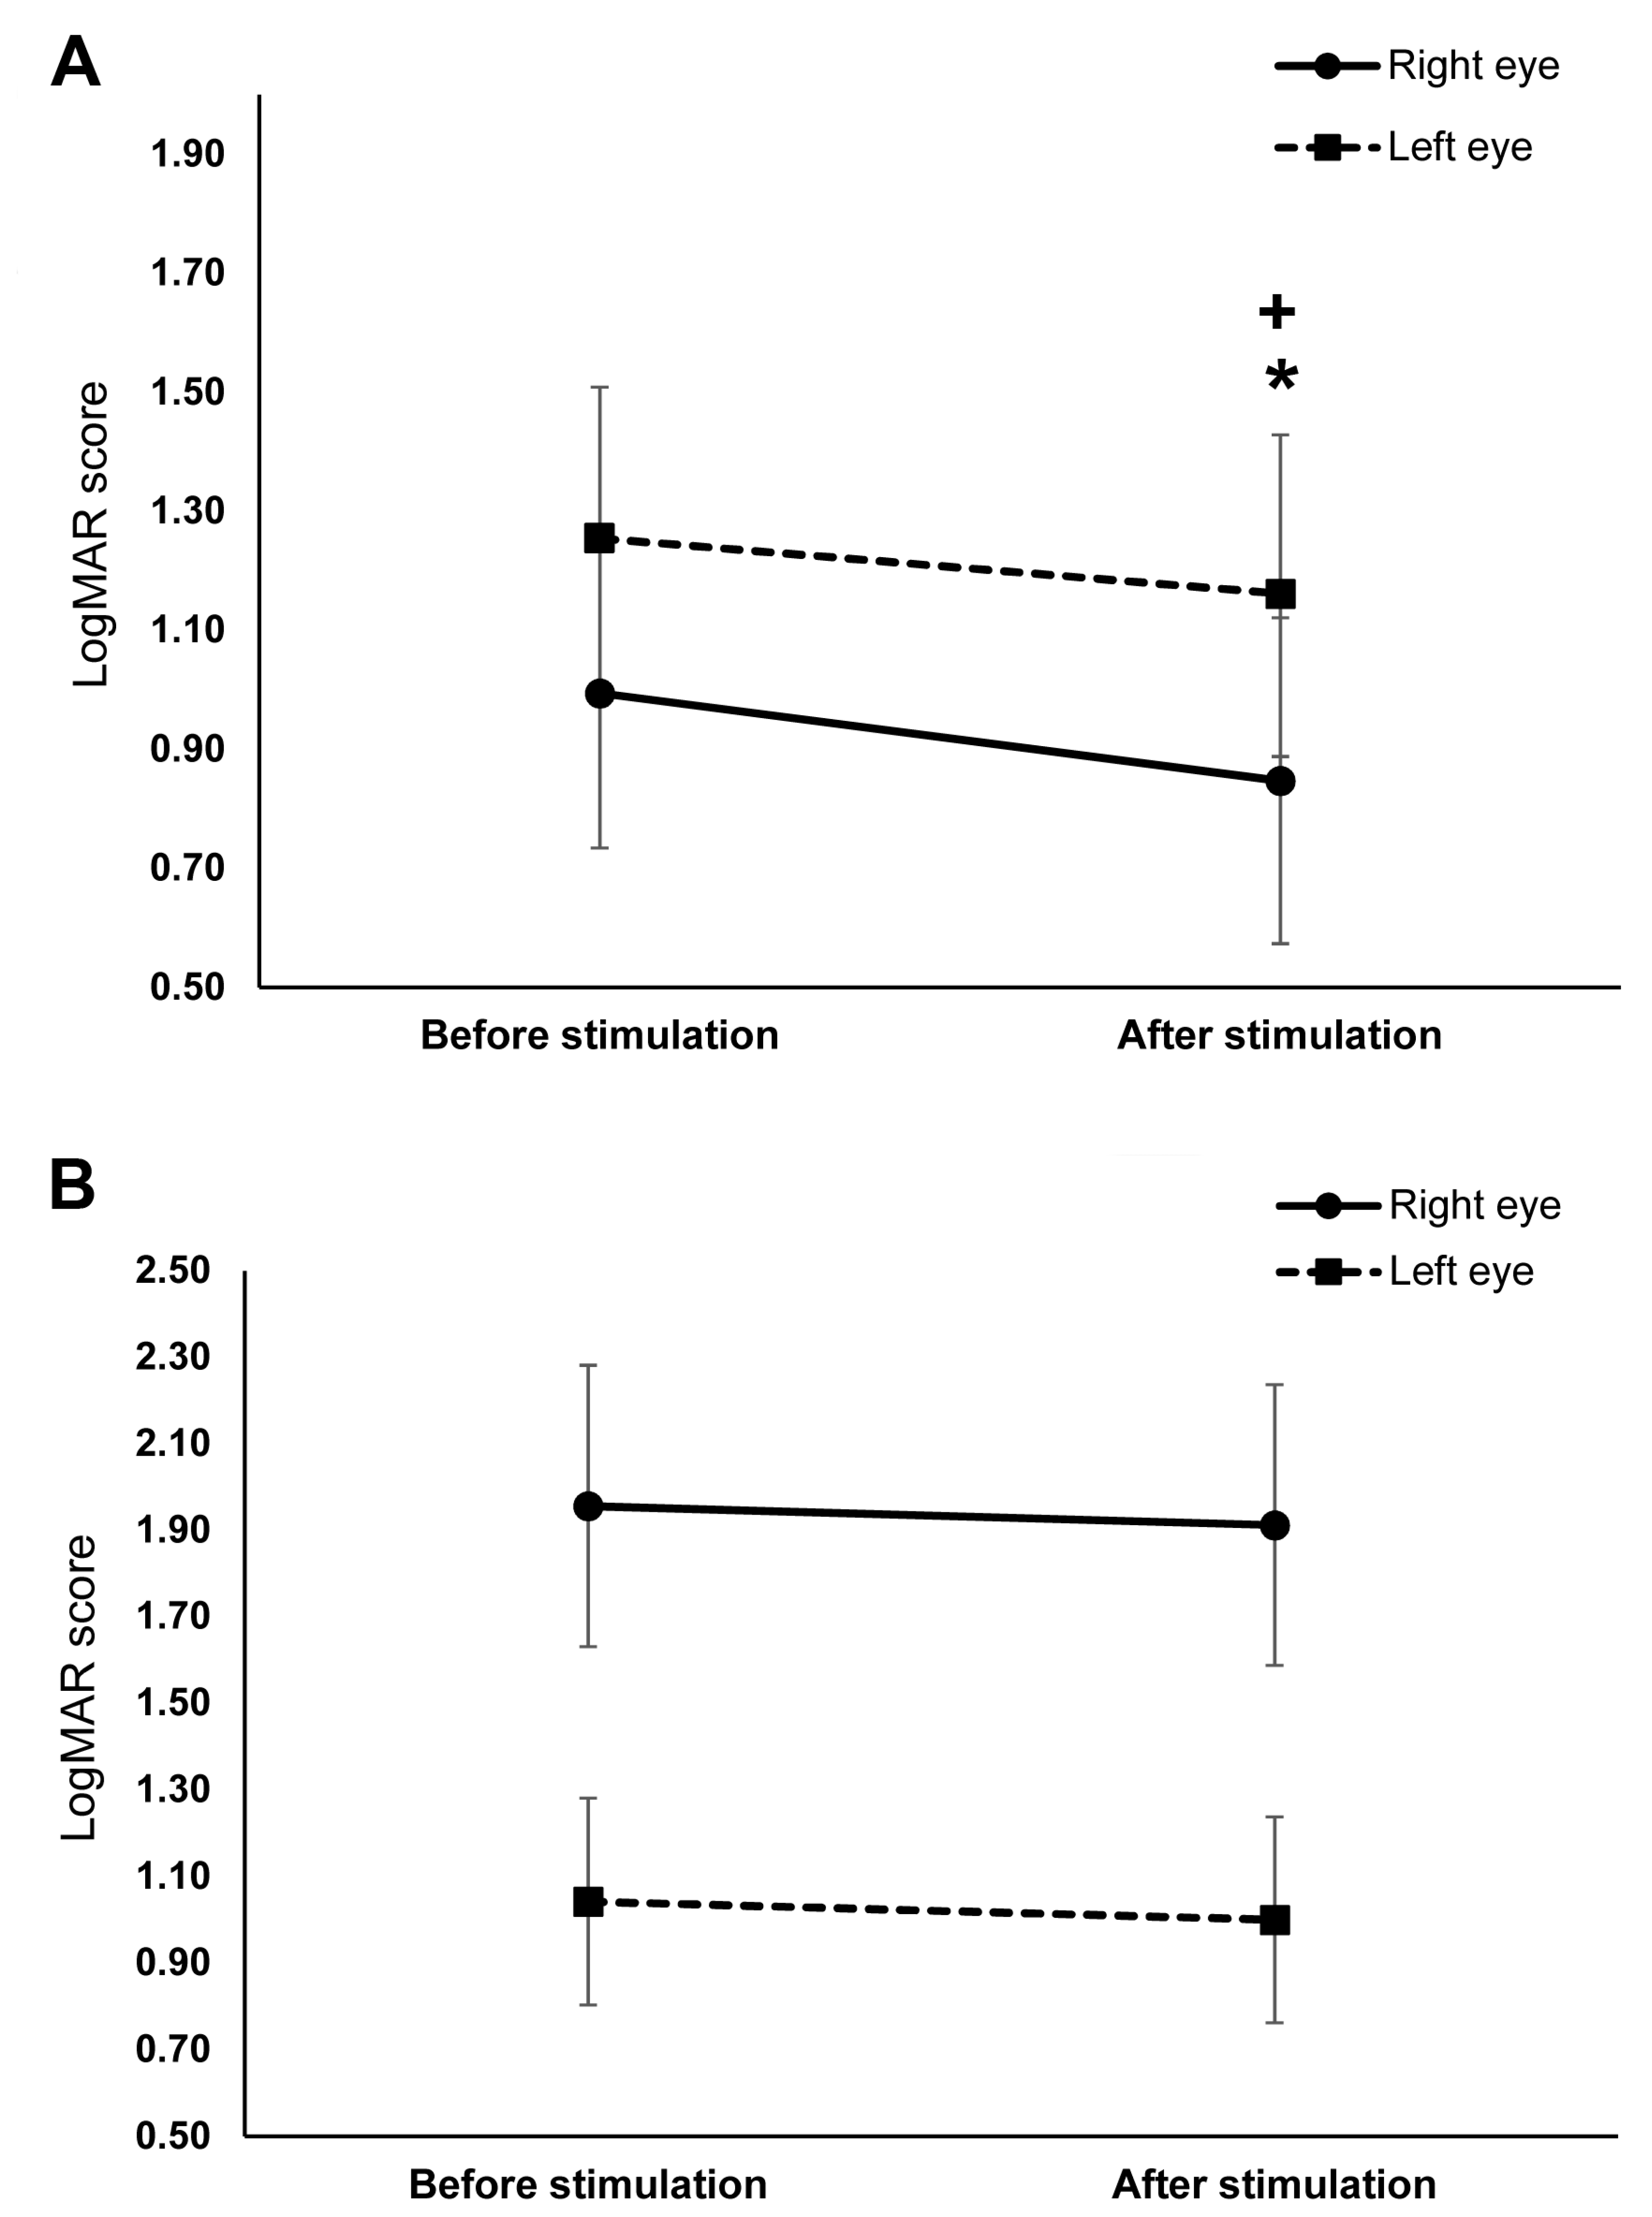
3.1. Visual Acuity
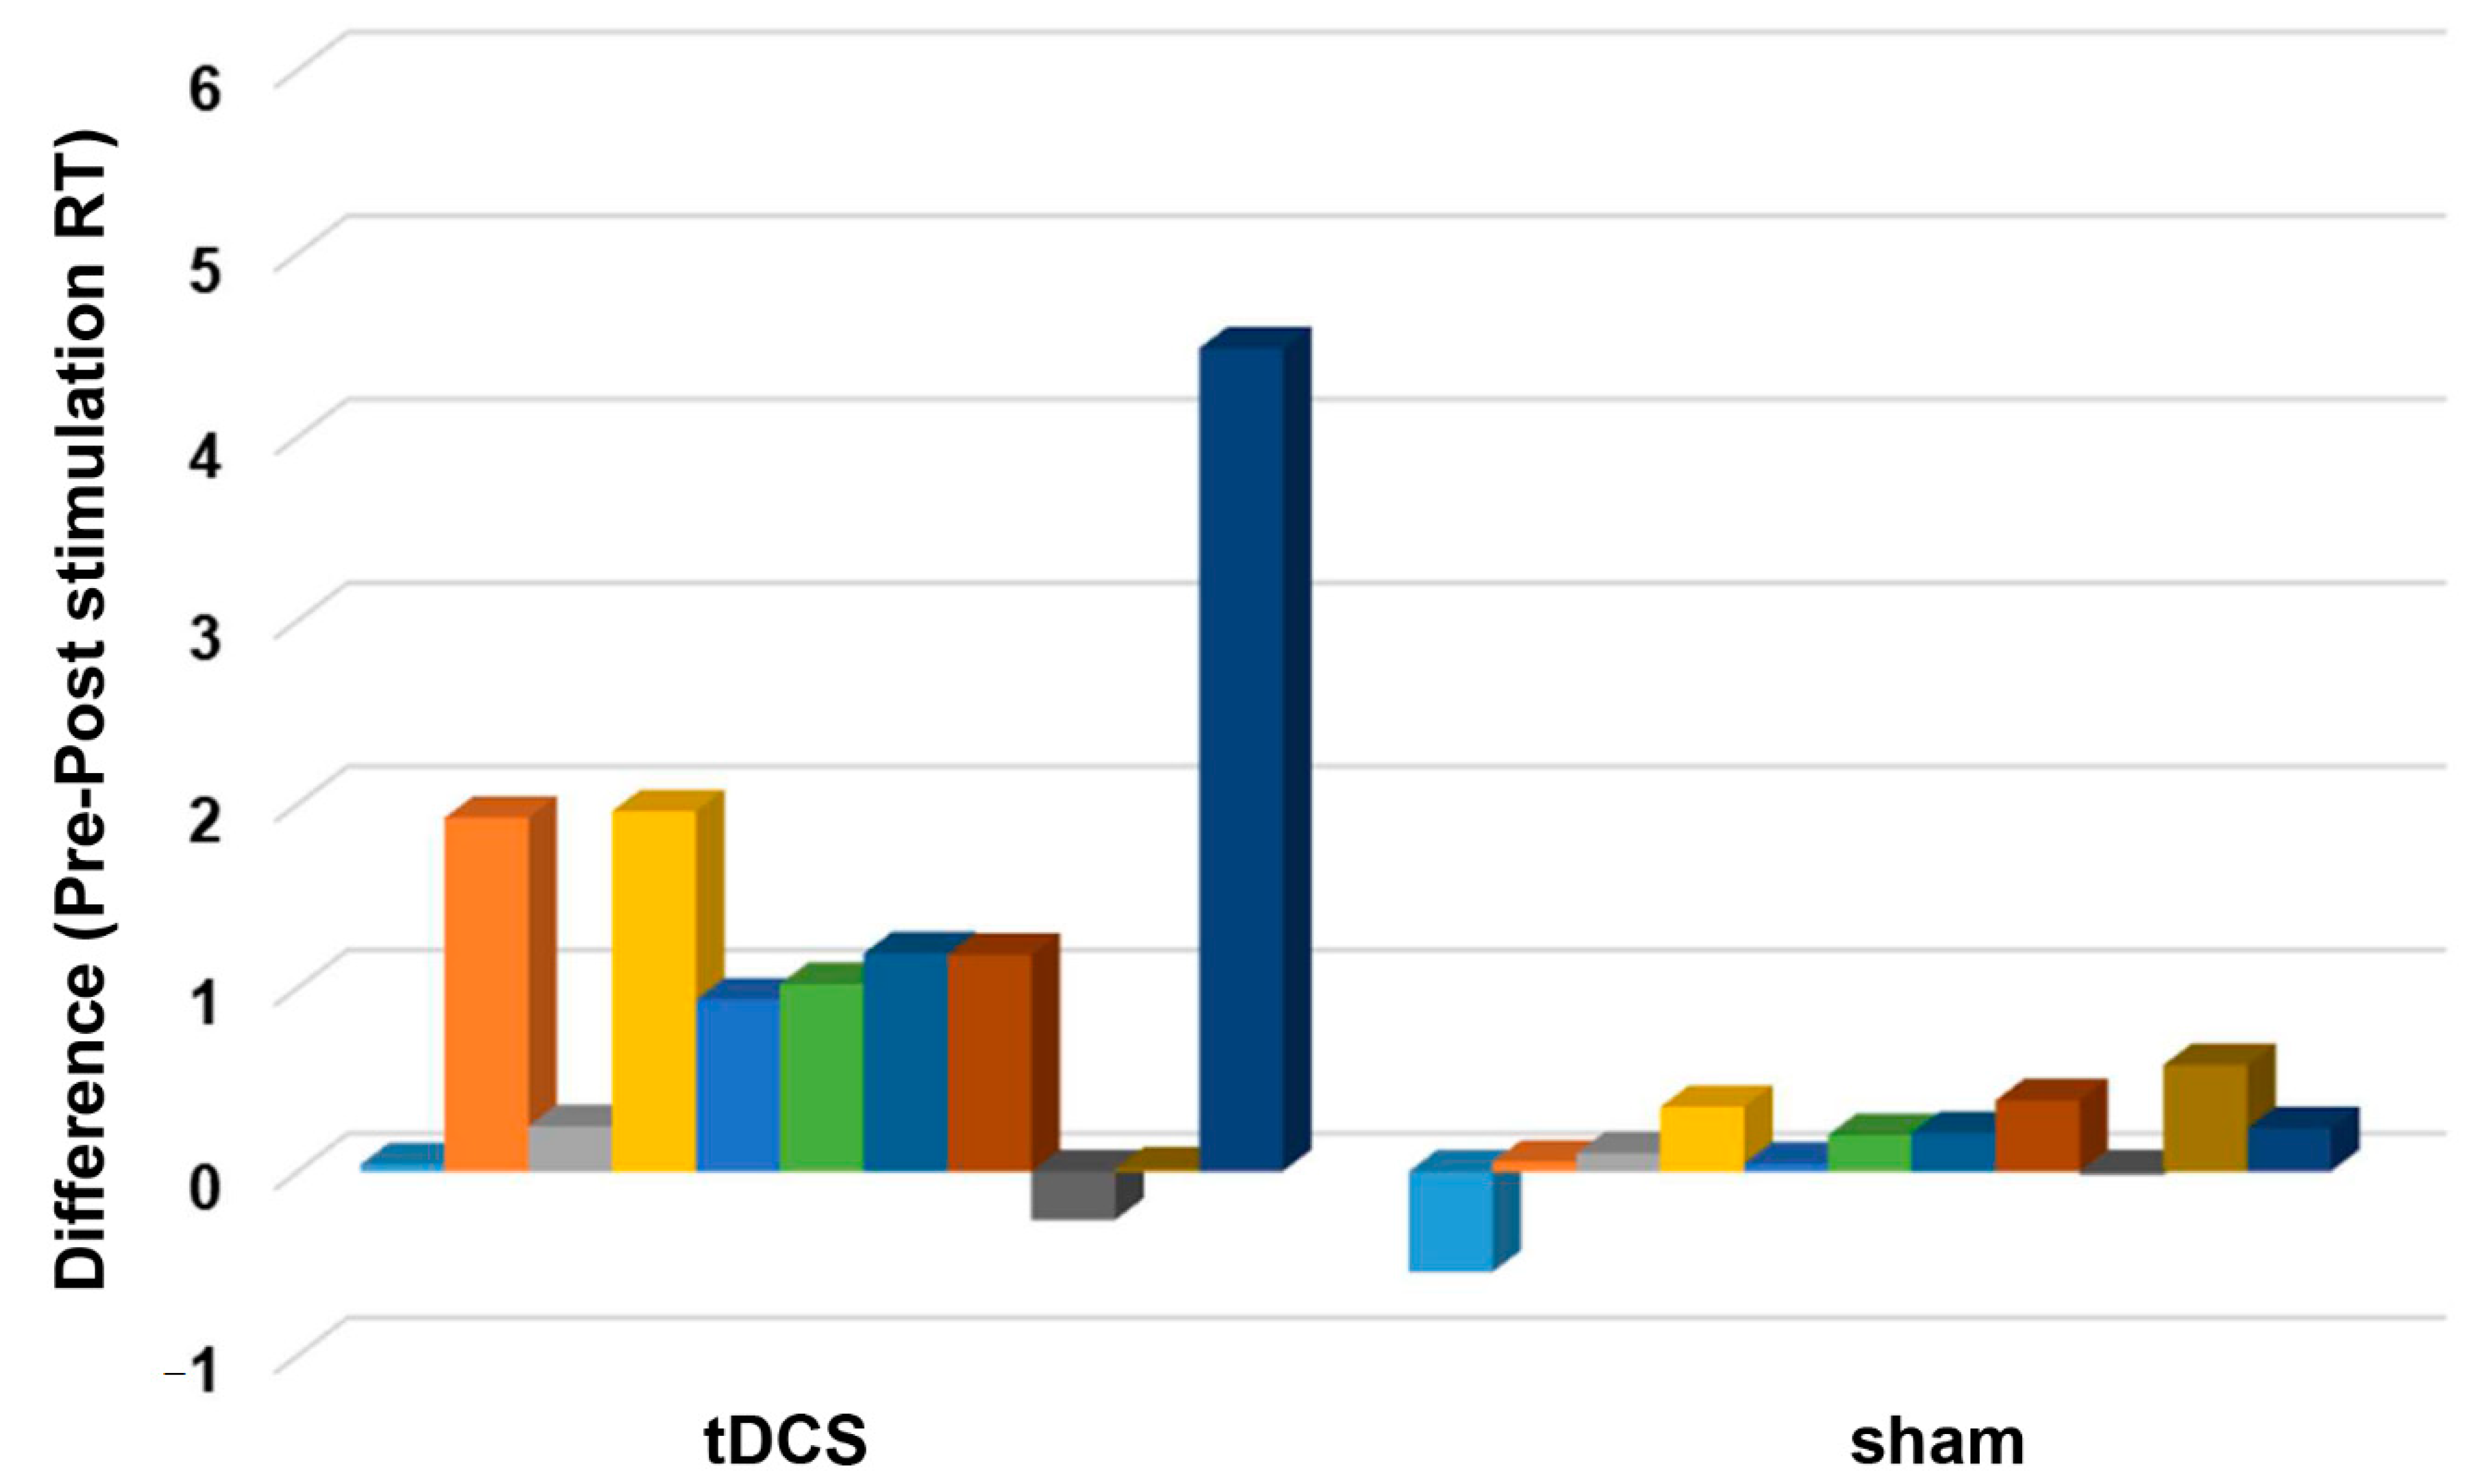
3.2. Number Acuity
4. Discussion
4.1. The Effect of Cathodal tDCS on Visual Acuity
4.2. The Effect of Cathodal tDCS on Number Acuity
4.3. Limitations
5. Conclusions
Supplementary Materials
Author Contributions
Funding
Institutional Review Board Statement
Informed Consent Statement
Data Availability Statement
Acknowledgments
Conflicts of Interest
References
- Wild, S.; Roglic, G.; Green, A.; Sicree, R.; King, H. Global Prevalence of Diabetes. Diabetes Care. 2004, 27, 1047–1053. [Google Scholar] [CrossRef]
- Mansour, S.E.; Browning, D.J.; Wong, K.; Flynn, H.W., Jr.; Bhavsar, A.R. The Evolving Treatment of Diabetic Retinopathy. Clin. Ophthalmol. 2020, 14, 653–678. [Google Scholar] [CrossRef]
- Wang, W.; Lo, A.C.Y. Diabetic Retinopathy: Pathophysiology and Treatments. Int. J. Mol. Sci. 2018, 19, 1816. [Google Scholar] [CrossRef]
- Sabel, B.A.; Thut, G.; Haueisen, J.; Henrich-Noack, P.; Herrmann, C.S.; Hunold, A.; Kammer, T.; Matteo, B.; Sergeeva, E.G.; Waleszczyk, W.; et al. Vision modulation, plasticity and restoration using non-invasive brain stimulation—An IFCN-sponsored review. Clin. Neurophysiol. 2020, 131, 887–911. [Google Scholar] [CrossRef] [PubMed]
- Stagg, C.J.; Nitsche, M.A. Physiological Basis of Transcranial Direct Current Stimulation. Neuroscience 2011, 17, 37–53. [Google Scholar] [CrossRef] [PubMed]
- Nitsche, M.A.; Cohen, L.G.; Wassermann, E.M.; Priori, A.; Lang, N.; Antal, A.; Paulus, W.; Hummel, F.; Boggio, P.S.; Fregni, F.; et al. Transcranial direct current stimulation: State of the art 2008. Brain Stimul. 2008, 1, 206–223. [Google Scholar] [CrossRef]
- Nitsche, M.A.; Paulus, W. Excitability changes induced in the human motor cortex by weak transcranial direct current stimulation. J. Physiol. 2000, 527, 633–639. [Google Scholar] [CrossRef] [PubMed]
- Antal, A.; Kincses, T.Z.; Nitsche, M.A.; Paulus, W. Manipulation of phosphene thresholds by transcranial direct current stimulation in man. Exp. Brain Res. 2003, 150, 375–378. [Google Scholar] [CrossRef]
- Antal, A.; Kincses, T.Z.; Nitsche, M.A.; Paulus, W. Modulation of moving phosphene thresholds by transcranial direct current stimulation of V1 in human. Neuropsychologia 2003, 41, 1802–1807. [Google Scholar] [CrossRef]
- Antal, A.; Kincses, Z.T.; Nitsche, M.; Bartfai, O.; Paulus, W. Excitability changes induced in the human primary visual cortex by transcranial direct current stimulation: Direct electrophyiological evidence. Investig. Ophthalmol. Vis. Sci. 2004, 45, 702–707. [Google Scholar] [CrossRef] [PubMed]
- Wunder, S.; Hunold, A.; Fiedler, P.; Schlegelmilch, F.; Schellhorn, K.; Haueisen, J. Novel bifunctional cap for simultaneous electroencephalography and transcranial electrical stimulation. Sci. Rep. 2018, 8, 7259. [Google Scholar] [CrossRef] [PubMed]
- Costa, T.L.; Nagy, B.V.; Barboni, M.T.S.; Boggio, P.S.; Ventura, D.F. Transcranial direct current stimulation modulates human color discrimination in a pathway-specific manner. Front. Psychiatry 2012, 3, 78. [Google Scholar] [CrossRef]
- Costa, T.L.; Gualtieri, M.; Barboni, M.T.S.; Katayama, R.K.; Boggio, P.S.; Ventura, D.F. Contrasting effects of transcranial direct current stimulation on central and peripheral visual fields. Exp. Brain Res. 2015, 233, 1391–1397. [Google Scholar] [CrossRef] [PubMed]
- Costa, T.L.; Lapenta, O.M.; Boggio, P.S.; Ventura, D.F. Transcranial direct current stimulation as a tool in the study of sensory-perceptual processing. Atten. Percept. Psychophys. 2015, 77, 1813–1840. [Google Scholar] [CrossRef] [PubMed]
- Spiegel, D.P.; Byblow, W.D.; Hess, R.F.; Thompson, B. Anodal Transcranial Direct Current Stimulation Transiently Improves Contrast Sensitivity and Normalises Visual Cortex Activation in Individuals With Amblyopia. Neurorehabil. Neural Repair 2013, 27, 760–769. [Google Scholar] [CrossRef]
- Ding, Z.; Li, J.; Spiegel, D.P.; Chen, Z.; Chan, L.; Luo, G.; Yuan, J.; Deng, D.; Yu, M.; Thompson, B. The effect of transcranial direct current stimulation on contrast sensitivity and visual evoked potential amplitude in adults with amblyopia. Sci. Rep. 2016, 6, 19280. [Google Scholar] [CrossRef]
- Bocci, T.; Nasini, F.; Caleo, M.; Restani, L.; Barloscio, D.; Ardolino, G.; Priori, A.; Maffei, L.; Nardi, M.; Sartucci, F. Unilateral Application of Cathodal tDCS Reduces Transcallosal Inhibition and Improves Visual Acuity in Amblyopic Patients. Front. Behav. Neurosci. 2018, 12, 109. [Google Scholar] [CrossRef]
- Gall, C.; Schmidt, S.; Schittkowski, M.P.; Antal, A.; Ambrus, G.G.; Paulus, W.; Dannhauer, M.; Michalik, R.; Mante, A.; Bola, M.; et al. Alternating Current Stimulation for Vision Restoration after Optic Nerve Damage: A Randomised Clinical Trial. PLoS ONE 2016, 11, e0156134. [Google Scholar] [CrossRef]
- Pelli, D.G.; Levi, D.M.; Chung, S.T.L. Using visual noise to characterize amblyopic letter identification. J. Vis. 2004, 4, 6. [Google Scholar] [CrossRef]
- McAnany, J.J.; Alexander, K.R.; Genead, M.A.; Fishman, G.A. Equivalent Intrinsic Noise, Sampling Efficiency, and Contrast Sensitivity in Patients With Retinitis Pigmentosa. Investig. Opthalmol. Vis. Sci. 2013, 54, 3857. [Google Scholar] [CrossRef]
- McAnany, J.J.; Park, J.C. Reduced Contrast Sensitivity is Associated With Elevated Equivalent Intrinsic Noise in Type 2 Diabetics Who Have Mild or No Retinopathy. Investig. Opthalmol. Vis. Sci. 2018, 59, 2652. [Google Scholar] [CrossRef]
- Yu, Y.; Lan, D.-Y.; Tang, L.-Y.; Su, T.; Li, B.; Jiang, N.; Liang, R.-B.; Ge, Q.-M.; Li, Q.-Y.; Shao, Y. Intrinsic functional connectivity alterations of the primary visual cortex in patients with proliferative diabetic retinopathy: A seed-based resting-state fMRI study. Ther. Adv. Endocrinol. Metab. 2020, 11, 204201882096029. [Google Scholar] [CrossRef]
- Cappelletti, M.; Gessaroli, E.; Hithersay, R.; Mitolo, M.; Didino, D.; Kanai, R.; Kadosh, R.C.; Walsh, V. Transfer of Cognitive Training across Magnitude Dimensions Achieved with Concurrent Brain Stimulation of the Parietal Lobe. J. Neurosci. 2013, 33, 14899–14907. [Google Scholar] [CrossRef]
- Halberda, J.; Mazzocco, M.M.M.; Feigenson, L. Individual differences in non-verbal number acuity correlate with maths achievement. Nature 2008, 455, 665–668. [Google Scholar] [CrossRef] [PubMed]
- Dehaene, S.; Piazza, M.; Pinel, P.; Cohen, L. Three Parietal Circuits for Number Processing. Cogn. Neuropsychol. 2003, 20, 487–506. [Google Scholar] [CrossRef] [PubMed]
- Collins, E.; Park, J.; Behrmann, M. Numerosity representation is encoded in human subcortex. Proc. Natl. Acad. Sci. USA 2017, 114, E2806–E2815. [Google Scholar] [CrossRef]
- Fornaciai, M.; Brannon, E.M.; Woldorff, M.G.; Park, J. Numerosity processing in early visual cortex. Neuroimage 2017, 157, 429–438. [Google Scholar] [CrossRef]
- Guillaume, M.; Mejias, S.; Rossion, B.; Dzhelyova, M.; Schiltz, C. A rapid, objective and implicit measure of visual quantity discrimination. Neuropsychologia 2018, 111, 180–189. [Google Scholar] [CrossRef] [PubMed]
- DeWind, N.K.; Park, J.; Woldorff, M.G.; Brannon, E.M. Numerical encoding in early visual cortex. Cortex 2019, 114, 76–89. [Google Scholar] [CrossRef]
- van Rinsveld, A.; Guillaume, M.; Kohler, P.J.; Schiltz, C.; Gevers, W.; Content, A. The neural signature of numerosity by separating numerical and continuous magnitude extraction in visual cortex with frequency-tagged EEG. Proc. Natl. Acad. Sci. USA 2020, 117, 5726–5732. [Google Scholar] [CrossRef] [PubMed]
- Matsumoto, H.; Ugawa, Y. Adverse events of tDCS and tACS: A review. Clin. Neurophysiol. Pract. 2017, 2, 19–25. [Google Scholar] [CrossRef]
- Lange, C.; Feltgen, N.; Junker, B.; Schulze-Bonsel, K.; Bach, M. Resolving the clinical acuity categories “hand motion” and “counting fingers” using the Freiburg Visual Acuity Test (FrACT). Graefe’s Arch. Clin. Exp. Ophthalmol. 2009, 247, 137–142. [Google Scholar] [CrossRef] [PubMed]
- Foxe, J.; Simpson, G. Flow of activation from V1 to frontal cortex in humans. Exp. Brain Res. 2002, 142, 139–150. [Google Scholar] [CrossRef] [PubMed]
- Reinhart, R.M.G.; Zhu, J.; Park, S.; Woodman, G.F. Medial–Frontal Stimulation Enhances Learning in Schizophrenia by Restoring Prediction Error Signaling. J. Neurosci. 2015, 35, 12232–12240. [Google Scholar] [CrossRef]
- Antal, A.; Paulus, W. Transcranial Direct Current Stimulation and Visual Perception. Perception 2008, 37, 367–374. [Google Scholar] [CrossRef] [PubMed]
- Reinhart, R.M.G.; Xiao, W.; McClenahan, L.J.; Woodman, G.F. Electrical Stimulation of Visual Cortex Can Immediately Improve Spatial Vision. Curr. Biol. 2016, 26, 1867–1872. [Google Scholar] [CrossRef]
- Bonder, T.; Gopher, D.; Yeshurun, Y. The Joint Effects of Spatial Cueing and Transcranial Direct Current Stimulation on Visual Acuity. Front. Psychol. 2018, 9, 159. [Google Scholar] [CrossRef] [PubMed]
- Salthouse, T.A. Speed of behavior and its implications for cognition. In Handbook of the Psychology of Aging; Birren, J.E., Schaie, K.W., Eds.; Van Nostrand Reinhold: New York, NY, USA, 1985. [Google Scholar]
- Koulakov, A.; Chklovskii, D. Orientation Preference Patterns in Mammalian Visual Cortex: A Wire Length Minimisation Approach. Neuron 2001, 29, 519–527. [Google Scholar] [CrossRef]
- Sasaki, Y.; Watanabe, T. The primary visual cortex fills in color. Proc. Natl. Acad. Sci. USA 2004, 101, 18251–18256. [Google Scholar] [CrossRef] [PubMed]
- Seymour, K.; Clifford, C.W.G.; Logothetis, N.K.; Bartels, A. Coding and Binding of Color and Form in Visual Cortex. Cereb. Cortex. 2009, 20, 1946–1954. [Google Scholar] [CrossRef]
- Chan, J.S.; Newell, F.N. Behavioral evidence for task-dependent “what” versus “where” processing within and across modalities. Percept. Psychophys. 2008, 70, 36–49. [Google Scholar] [CrossRef]
- Murd, C.; Moisa, M.; Grueschow, M.; Polania, R.; Ruff, C.C. Causal contributions of human frontal eye fields to distinct aspects of decision formation. Sci. Rep. 2020, 10, 7317. [Google Scholar] [CrossRef] [PubMed]
- Anobile, G.; Tomaiuolo, F.; Campana, S.; Cicchini, G.M. Three-systems for visual numerosity: A single case study. Neuropsychologia 2020, 136, 107259. [Google Scholar] [CrossRef]
- Pomè, A.; Anobile, G.; Cicchini, G.M.; Scabia, A.; Burr, D.C. Higher attentional costs for numerosity estimation at high densities. Atten. Percept. Psychophys. 2019, 81, 2604–2611. [Google Scholar] [CrossRef] [PubMed]
- Nonnekes, J.; Arrogi, A.; Munneke, M.A.M.; van Asseldonk, E.H.F.; Nijhuis, L.B.O.; Geurts, A.C.; Weerdesteyn, V. Subcortical Structures in Humans Can Be Facilitated by Transcranial Direct Current Stimulation. PLoS ONE 2014, 9, e107731. [Google Scholar] [CrossRef]
- AMapp, P.; Ono, H.; Barbeito, R. What does the dominant eye dominate? A brief and somewhat contentious review. Percept. Psychophys. 2003, 65, 310–317. [Google Scholar] [CrossRef]


| Gender | Age | DM Duration (Years) | Comorbid Conditions | Medications | |
|---|---|---|---|---|---|
| tDCS group | |||||
| 1 | M | 42 | 18 | Diabetic nephropathy | Insulin |
| 2 | F | 65 | 10 | Diabetic nephropathy | Insulin |
| 3 | F | 54 | 5 | Insulin, Gliclazide, Keto-analogs + essential amino acids | |
| 4 | M | 60 | 5 | Hypertension | Metformin, Simvastatin, Amlodipine |
| 5 | F | 71 | 10 | Hypertension | Gliclazide, Pioglitazone, Losartan, Rosuvastatin |
| 6 | M | 56 | 22 | Metformin, Pioglitazone | |
| 7 | F | 59 | 8 | Hypertension | Insulin, Linagliptin, Aspirin, Amlodipine, Losartan |
| 8 | M | 69 | 5 | Hypertension | Metformin, Losartan |
| 9 | F | 63 | 15 | Hypertension | Metformin, Gliclazide, Amlodipine, Vitamins B-complex |
| 10 | M | 53 | 7 | Cardiac disease | Gliclazide, Aspirin, Losartan, Amlodipine |
| 11 | M | 43 | 20 | Hypertension | Metformin, Amlodipine, Ferrous sulfate |
| Sham group | |||||
| 1 | M | 35 | 14 | Metformin, Atorvastatin | |
| 2 | M | 41 | 15 | Insulin | |
| 3 | M | 48 | 25 | Hypertension, asthma, diabetic nephropathy | Amlodipine, Valsartan, Calcium carbonate, Ferrous sulfate + Vitamin B-complex + folate |
| 4 | F | 59 | 10 | Metformin, Aspirin, Simvastatin | |
| 5 | M | 63 | 5 | Prostatic hyperplasia, hypertension | Telmisartan, Glimepiride, Finasteride, Keto-analogs + essential amino acids |
| 6 | F | 59 | 15 | Hypertension | Insulin, Empagliflozin |
| 7 | M | 46 | 10 | Metformin | |
| 8 | F | 35 | 10 | Cardiac disease, hypertension | Furosemide, Insulin, Warfarin, Carvedilol, Valsartan, Teneligliptin, Spironolactone, Rosuvastatin, Vitamin B12, Linagliptin, Keto-analogs |
| 9 | M | 76 | 22 | Hypertension | Losartan, Amlodipine, Insulin |
| 10 | M | 55 | 10 | Hypertension | Metformin |
| 11 | F | 63 | 10 | Insulin |
| Numerator df | Denominator df | F-Value | p-Value | ηρ2 | |
|---|---|---|---|---|---|
| LogMAR score | |||||
| Stimulation | 1 | 19 | 2.19 | 0.104 | 0.133 |
| Time | 1 | 19 | 14.97 | 0.001 * | 0.441 |
| Eye | 1 | 19 | 0.51 | 0.482 | 0.026 |
| Time × stimulation | 1 | 19 | 8.92 | 0.008 * | 0.319 |
| Time × eye | 1 | 19 | 1.13 | 0.301 | 0.056 |
| Eye × stimulation | 1 | 19 | 4.83 | 0.041 * | 0.203 |
| Stimulation × time × eye | 1 | 19 | 1.56 | 0.227 | 0.076 |
| Accuracy rate | |||||
| Stimulation | 1 | 20 | 0.53 | 0.821 | 0.003 |
| Time | 1 | 20 | 0.18 | 0.677 | 0.009 |
| Time × stimulation | 1 | 20 | 0.12 | 0.732 | 0.006 |
Publisher’s Note: MDPI stays neutral with regard to jurisdictional claims in published maps and institutional affiliations. |
© 2021 by the authors. Licensee MDPI, Basel, Switzerland. This article is an open access article distributed under the terms and conditions of the Creative Commons Attribution (CC BY) license (http://creativecommons.org/licenses/by/4.0/).
Share and Cite
de Venecia, A.B.F., III; Fresnoza, S.M. Visual Cortex Transcranial Direct Current Stimulation for Proliferative Diabetic Retinopathy Patients: A Double-Blinded Randomized Exploratory Trial. Brain Sci. 2021, 11, 270. https://doi.org/10.3390/brainsci11020270
de Venecia ABF III, Fresnoza SM. Visual Cortex Transcranial Direct Current Stimulation for Proliferative Diabetic Retinopathy Patients: A Double-Blinded Randomized Exploratory Trial. Brain Sciences. 2021; 11(2):270. https://doi.org/10.3390/brainsci11020270
Chicago/Turabian Stylede Venecia, Angelito Braulio F., III, and Shane M. Fresnoza. 2021. "Visual Cortex Transcranial Direct Current Stimulation for Proliferative Diabetic Retinopathy Patients: A Double-Blinded Randomized Exploratory Trial" Brain Sciences 11, no. 2: 270. https://doi.org/10.3390/brainsci11020270
APA Stylede Venecia, A. B. F., III, & Fresnoza, S. M. (2021). Visual Cortex Transcranial Direct Current Stimulation for Proliferative Diabetic Retinopathy Patients: A Double-Blinded Randomized Exploratory Trial. Brain Sciences, 11(2), 270. https://doi.org/10.3390/brainsci11020270