

Detection of Remaining Feed in the Feed Troughs of Flat-Fed Meat Ducks Based on the RGB-D Sensor and YOLO V8

Simple Summary
Abstract
1. Introduction
2. Materials and Methods
2.1. Data Source
2.1.1. Experimental Materials
2.1.2. Platform Description
2.2. Detection of Remaining Feed
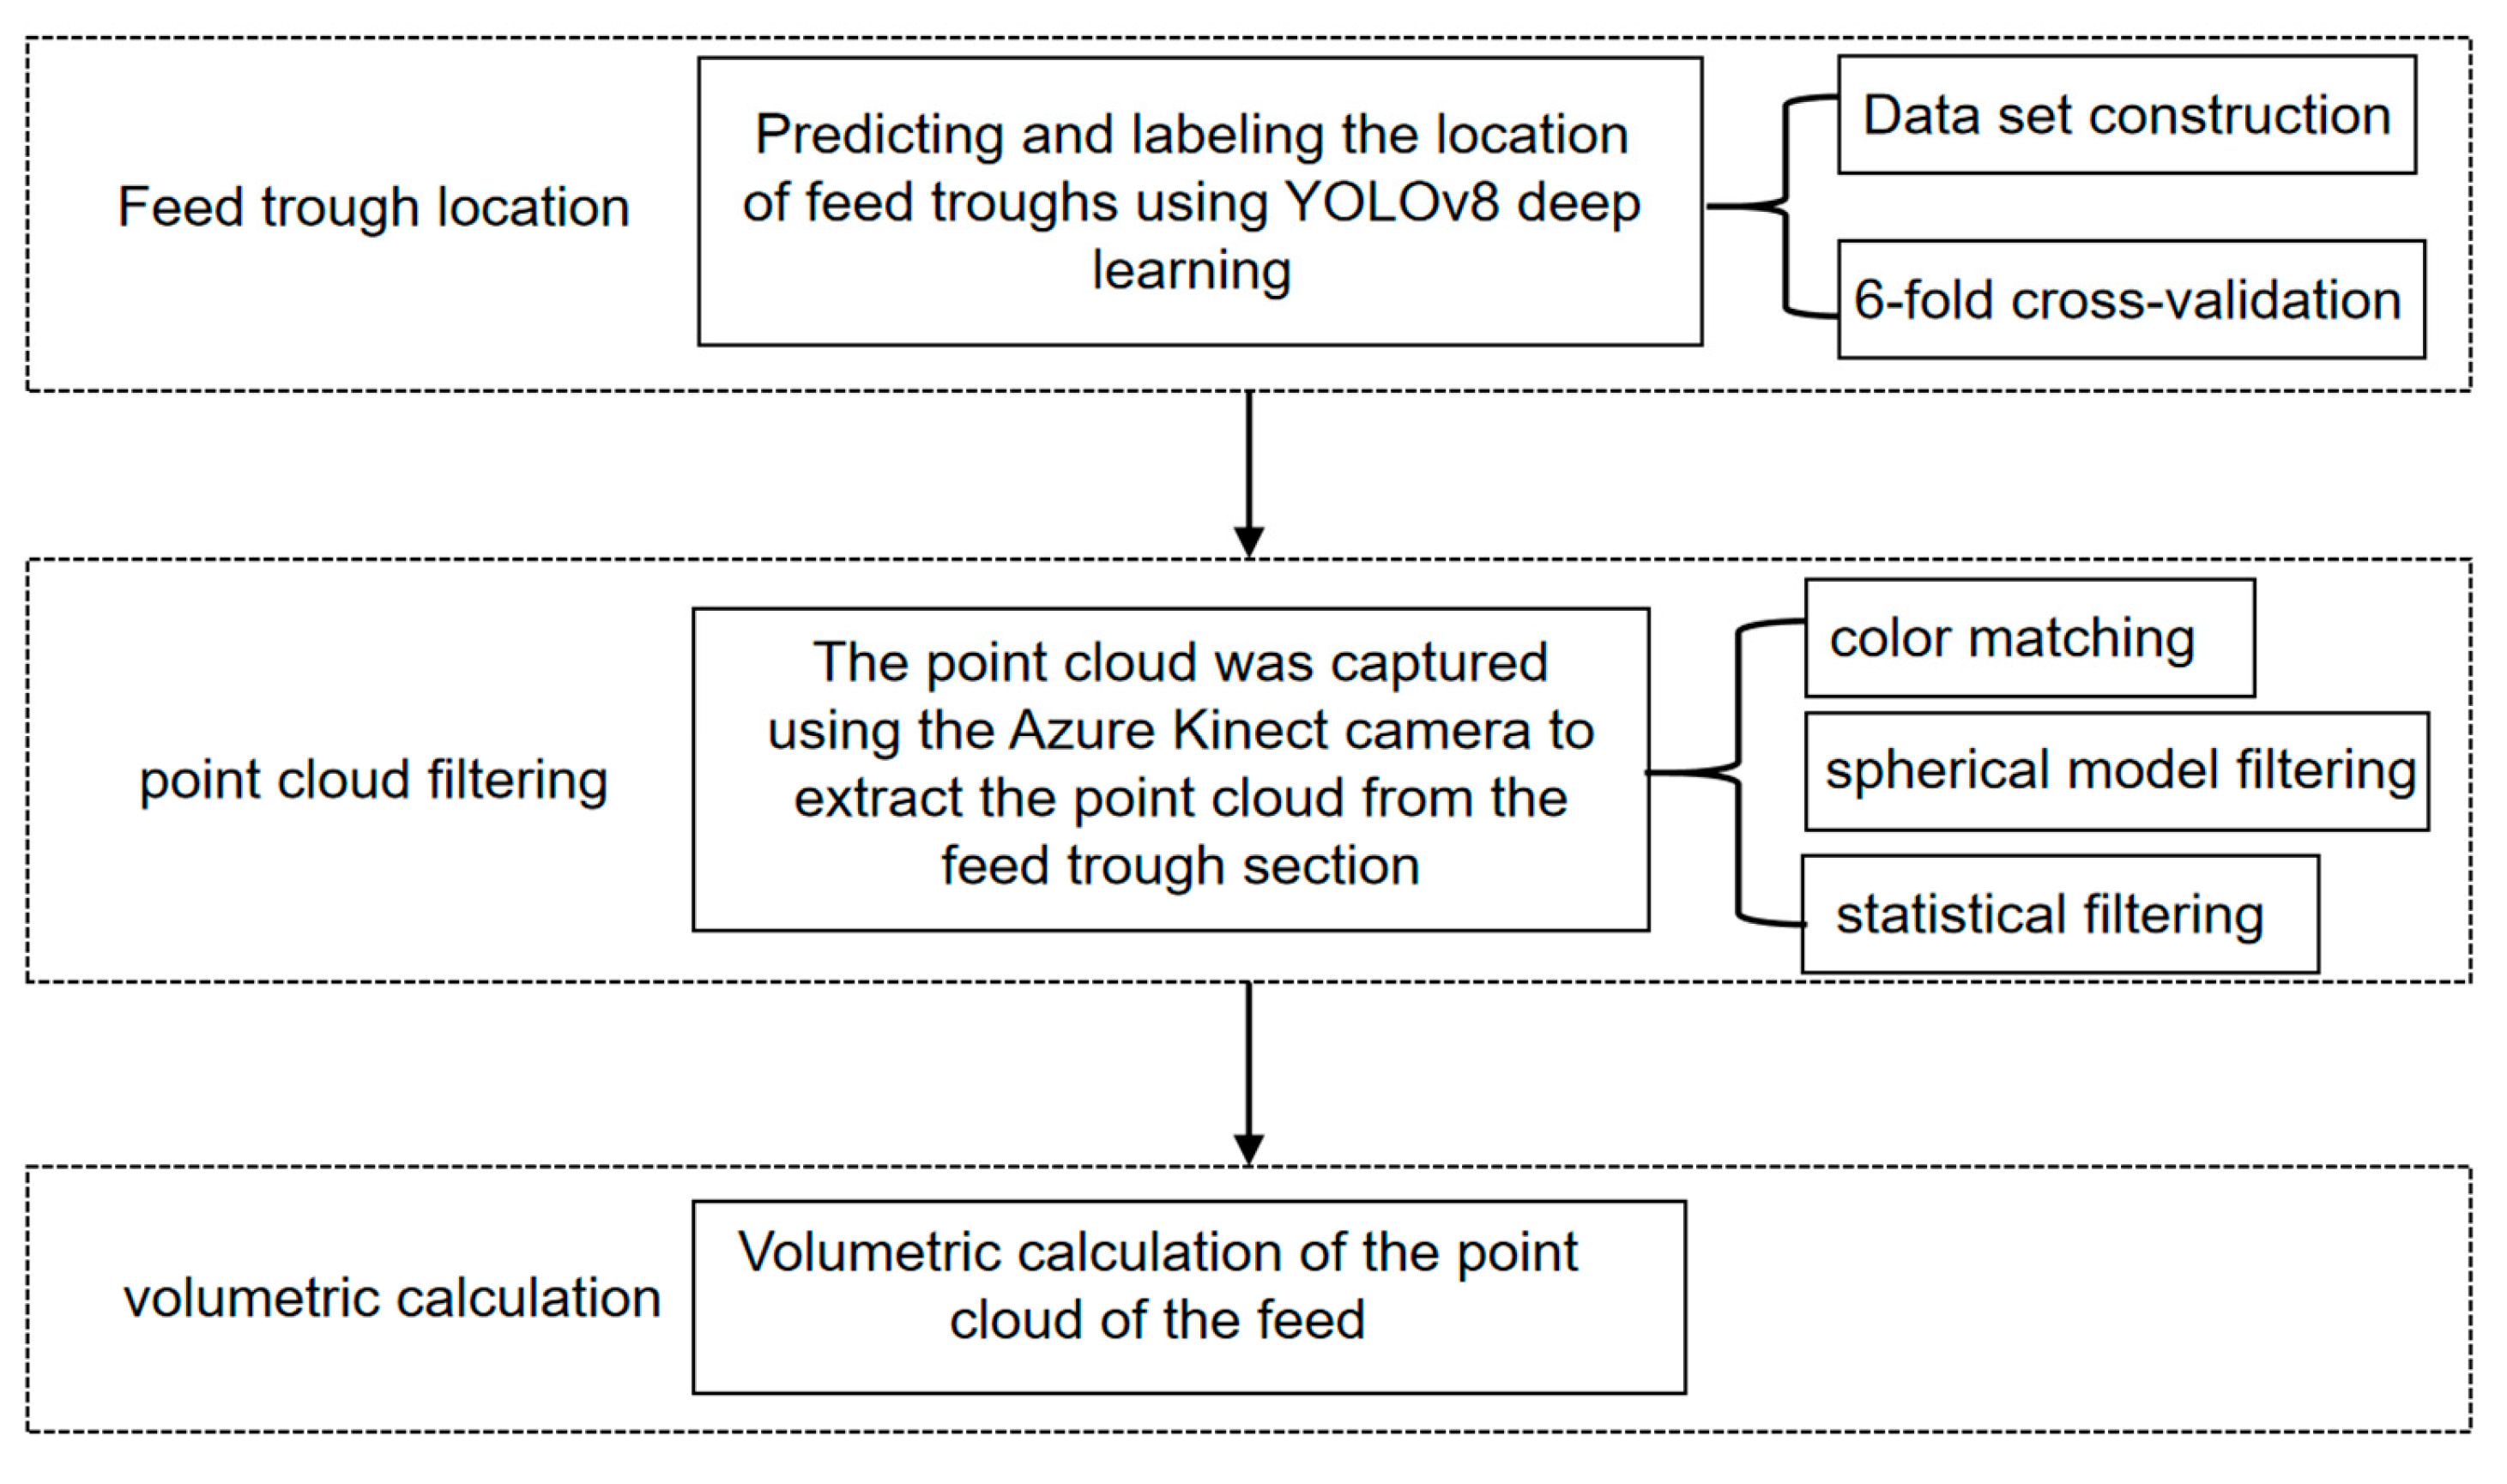
- (1)
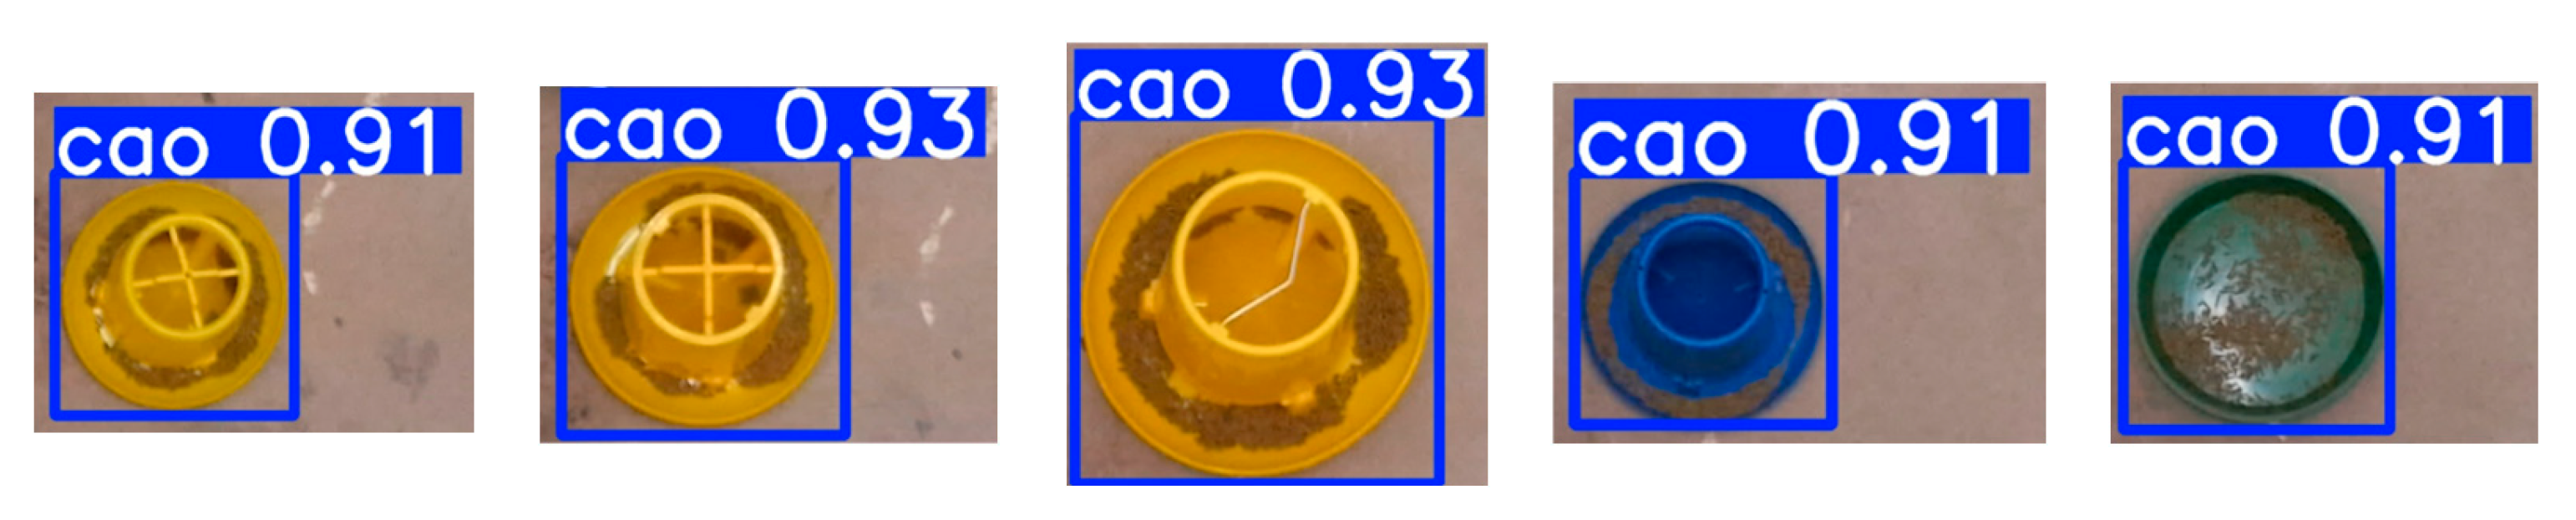
- The feed trough location was determined using the Azure Kinect’s color-image module. A comprehensive feed trough dataset was constructed and trained using the YOLOv8 model, incorporating 6-fold cross-validation to ensure optimal model selection and performance validation.
- (2)
- Point cloud processing was performed through multiple filtering stages. The depth camera of Azure Kinect aligned the color images with raw depth point cloud data to determine the feed troughs’ center-of-mass coordinates. A spherical model filtering approach was then applied for feed trough segmentation, followed by statistical filtering to eliminate outlier points. The unification of the coordinate system was achieved by aligning the center of the processed point cloud’s bounding box with the coordinate origin.
- (3)
- Feed volume calculation was achieved by comparing the point cloud data of the feed trough containing feed with corresponding reference models from a pre-established trough library. This comparison enabled the isolation of feed-specific point cloud data, from which the precise volume of feed was calculated.
2.3. Feed Trough Location
2.3.1. Dataset Construction
2.3.2. Data Annotation
2.3.3. Classification of the Dataset
2.3.4. YOLOv8 Target Detection
2.3.5. YOLOv8 Training Parameters and Evaluation Indicators
2.4. Point Cloud Filtering
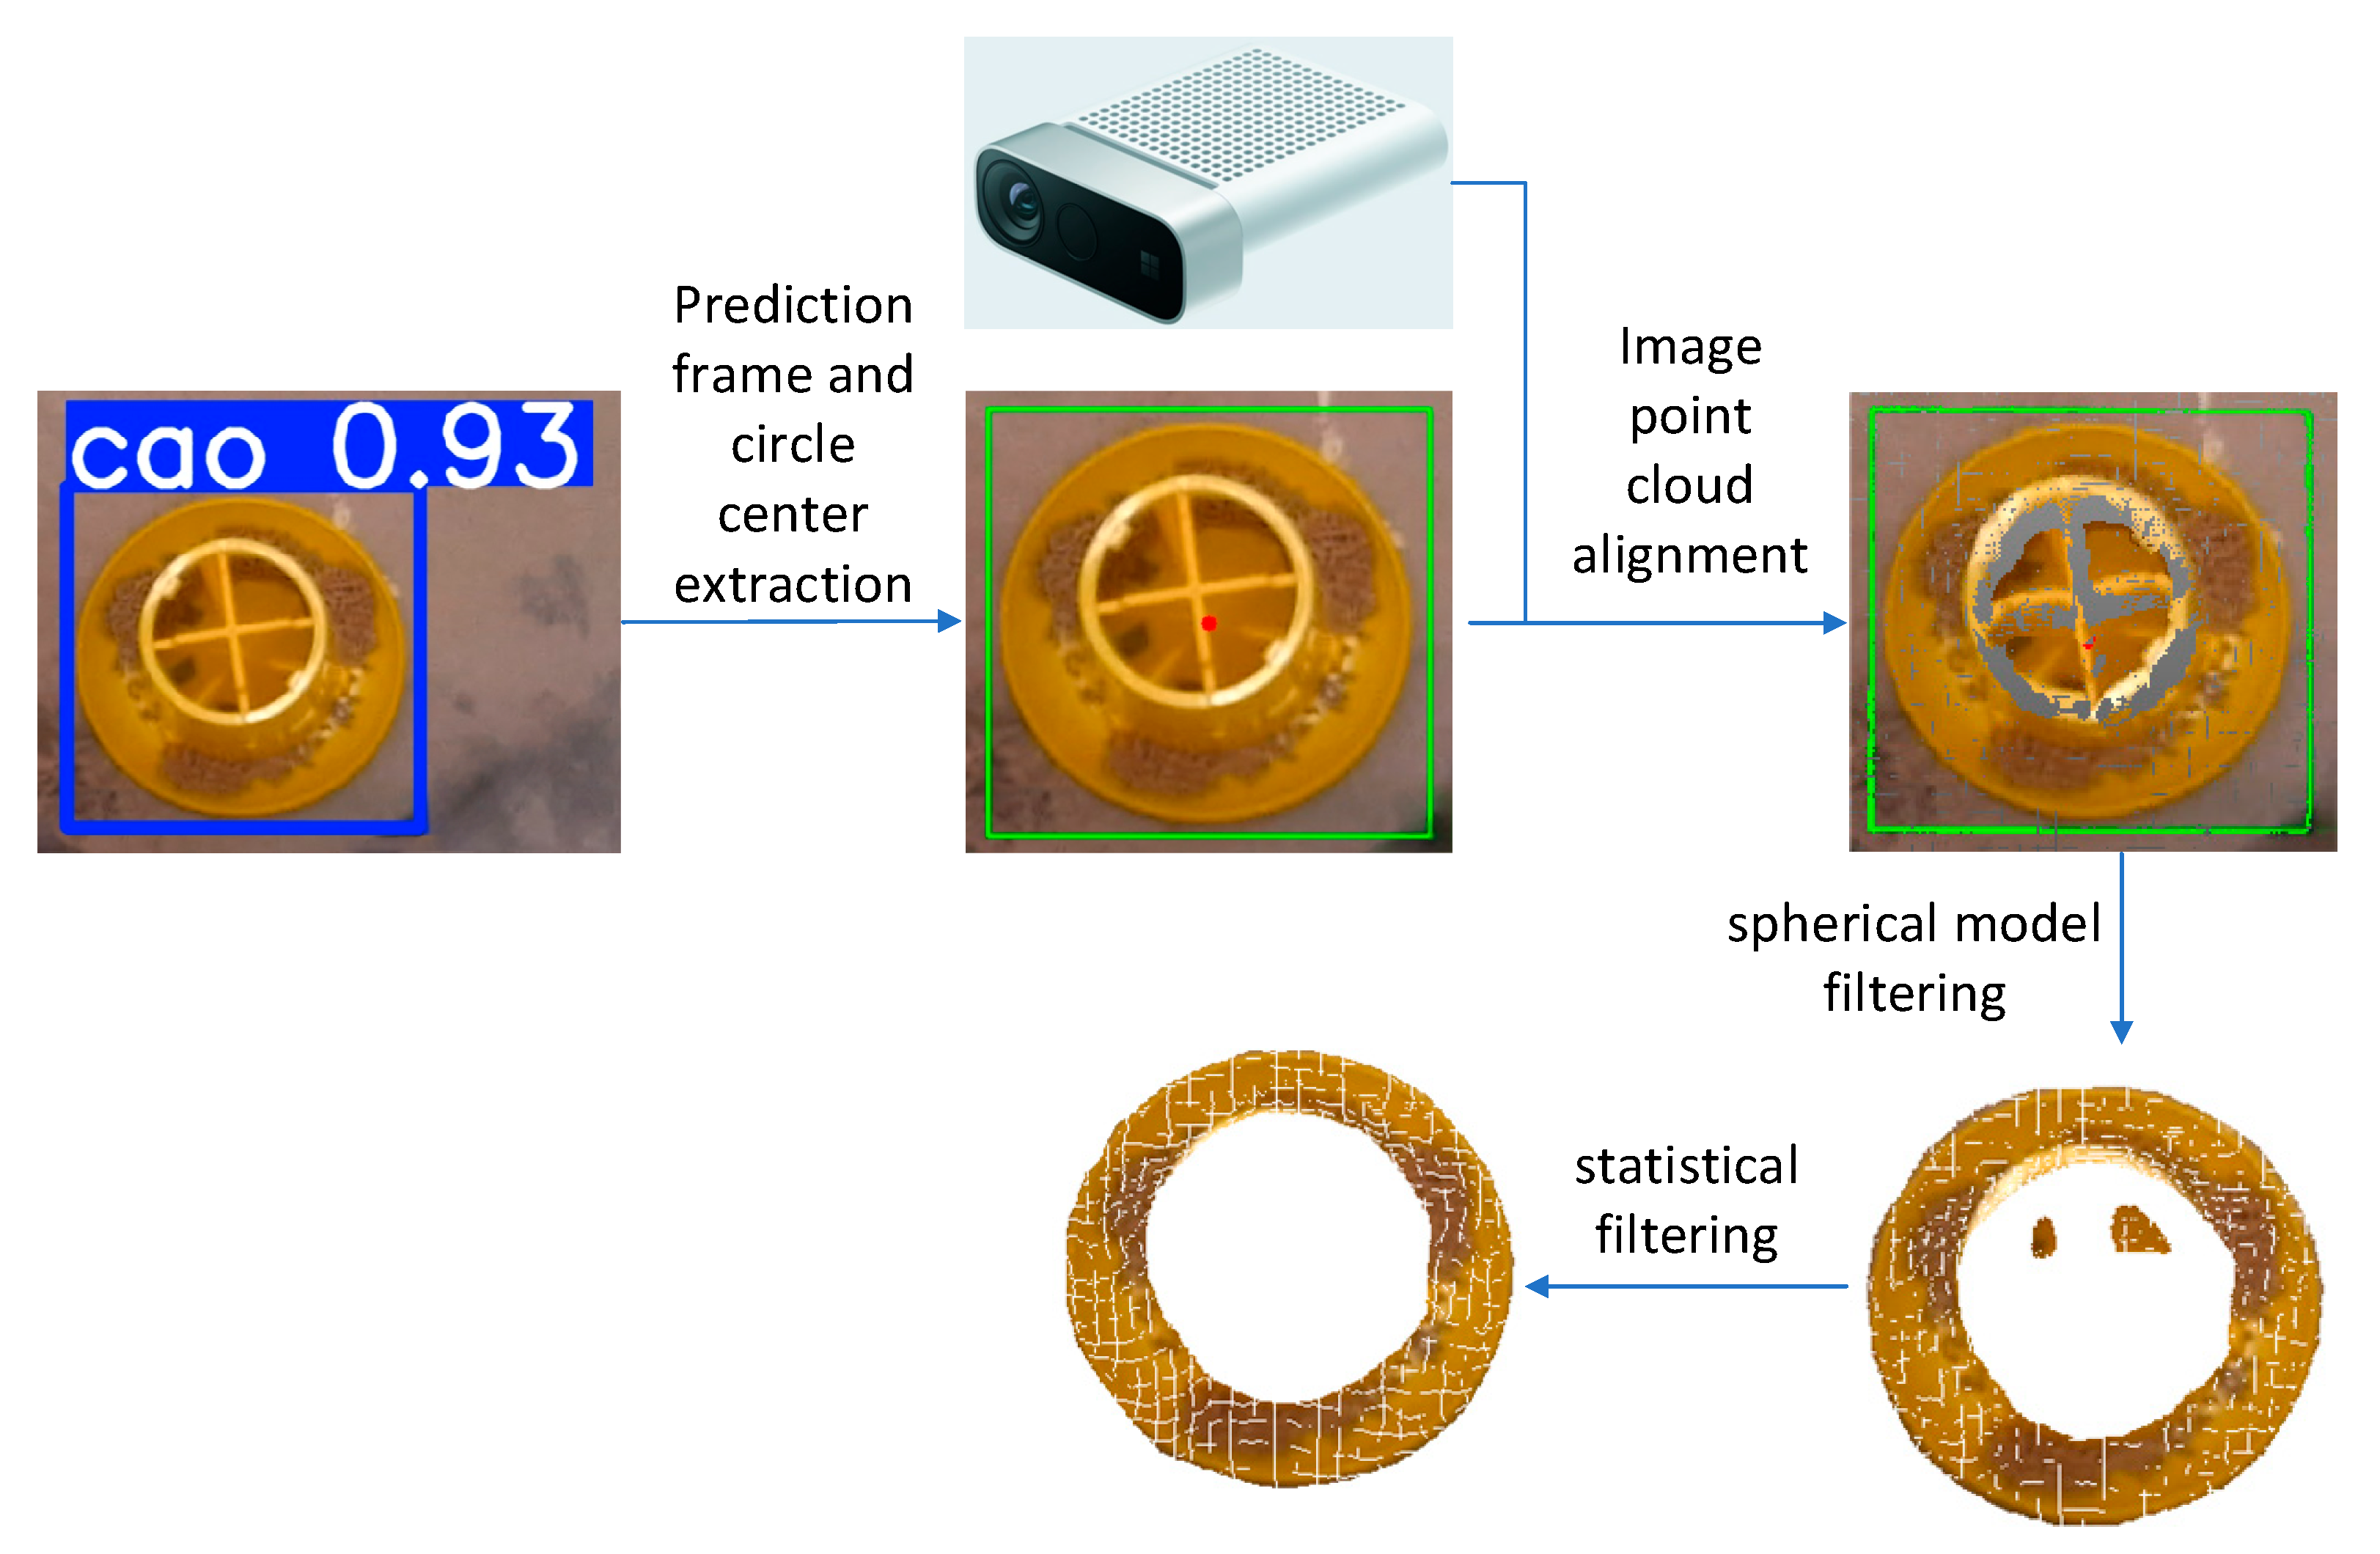
- The optimal Model 5 was employed for prediction, generating images with prediction boxes. These boxes were extracted and annotated in green, followed by centroid extraction from the green prediction boxes, which were then marked in red.
- The predicted color images were registered with the collected point cloud through the Azure Kinect camera, enabling the visualization of the processed green boxes and red centroids on the point cloud. Cloud Compare software was utilized to examine the point cloud coordinates and locate the corresponding coordinates of the red centroids.
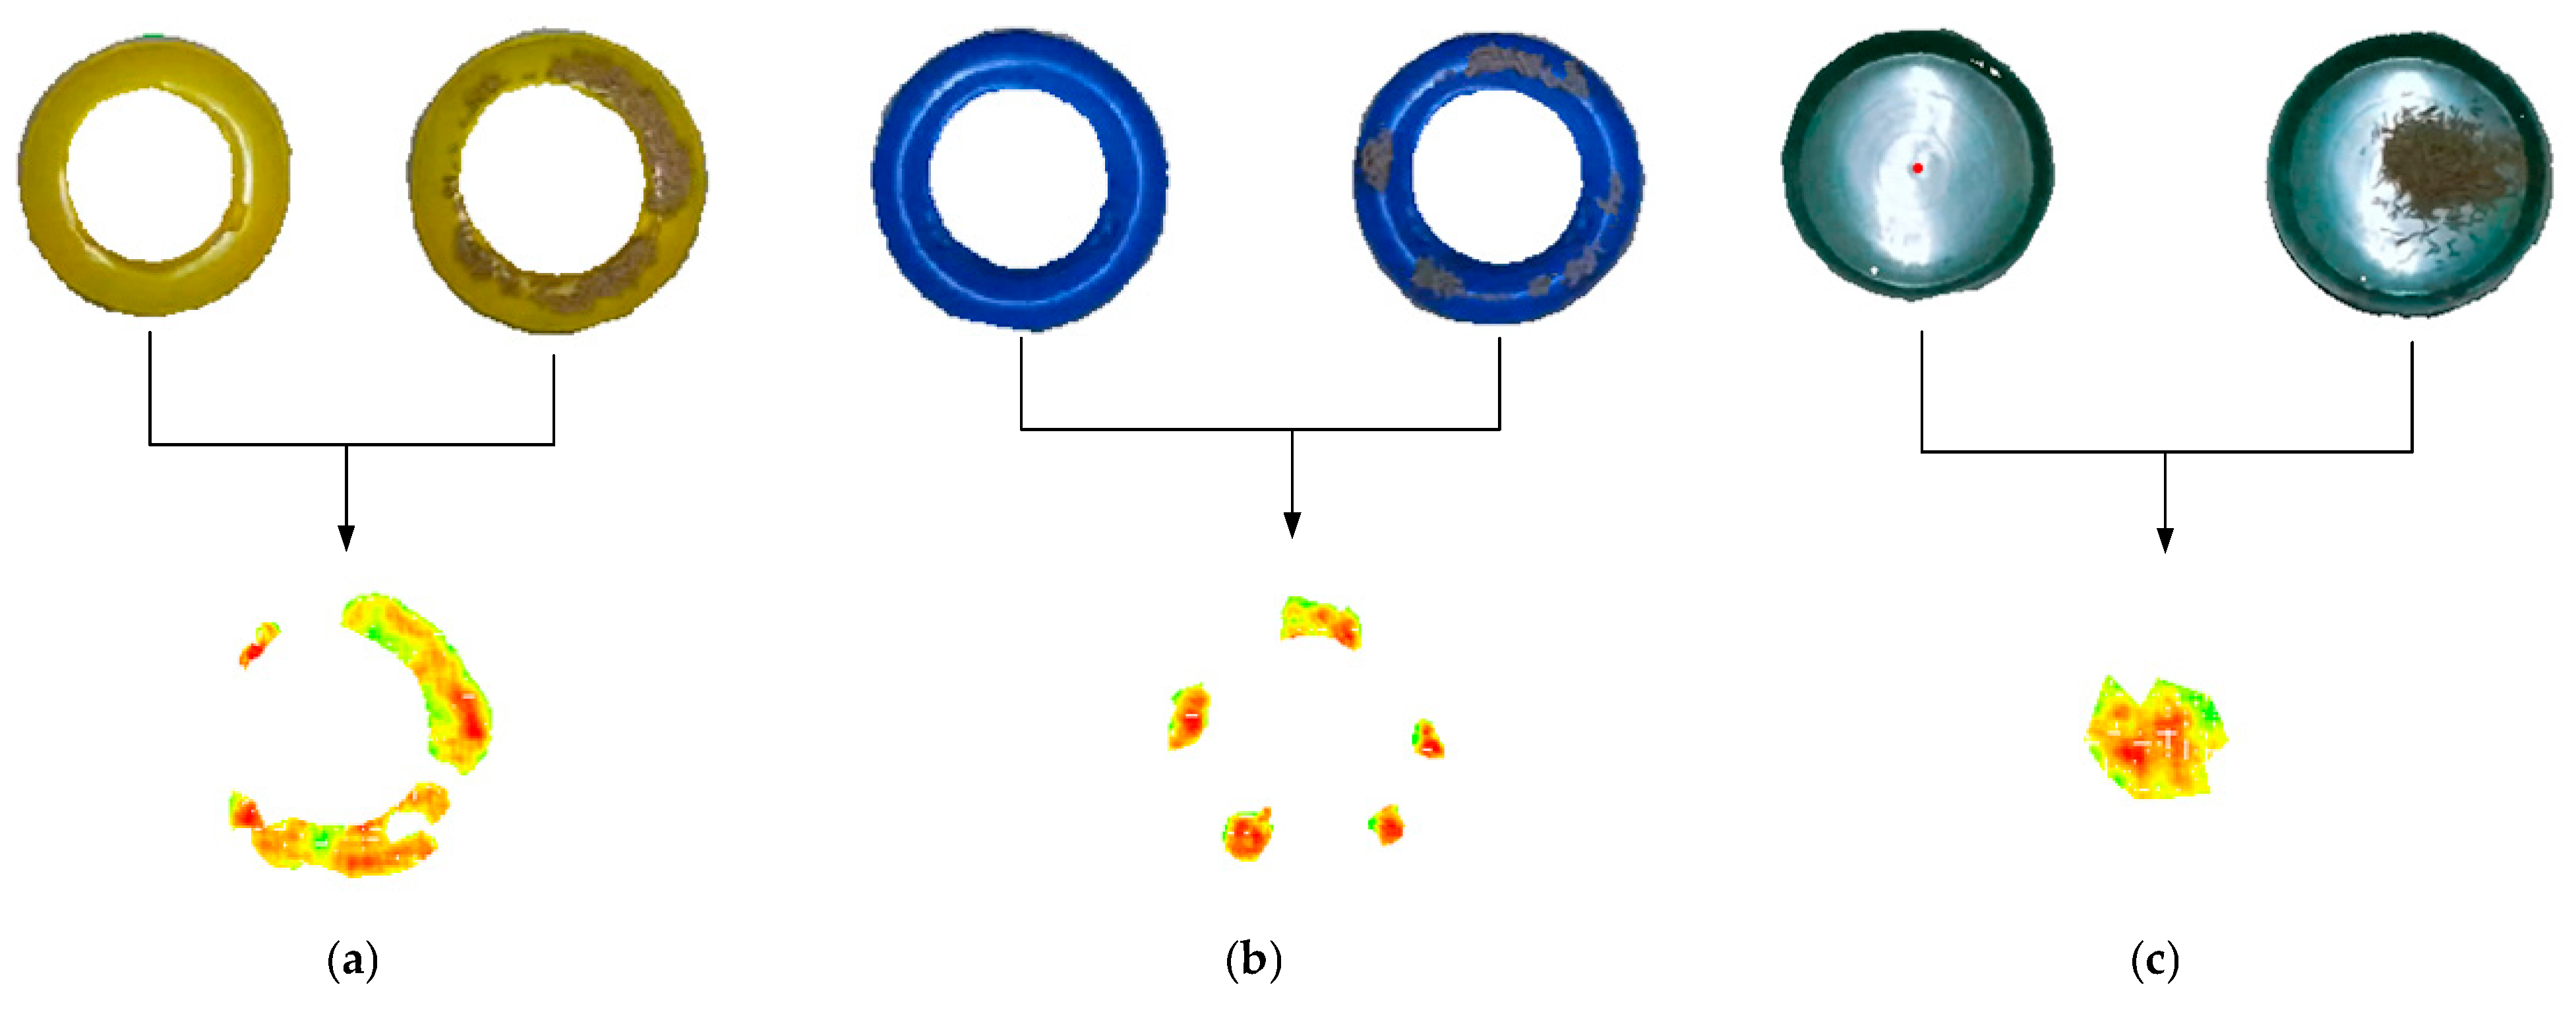
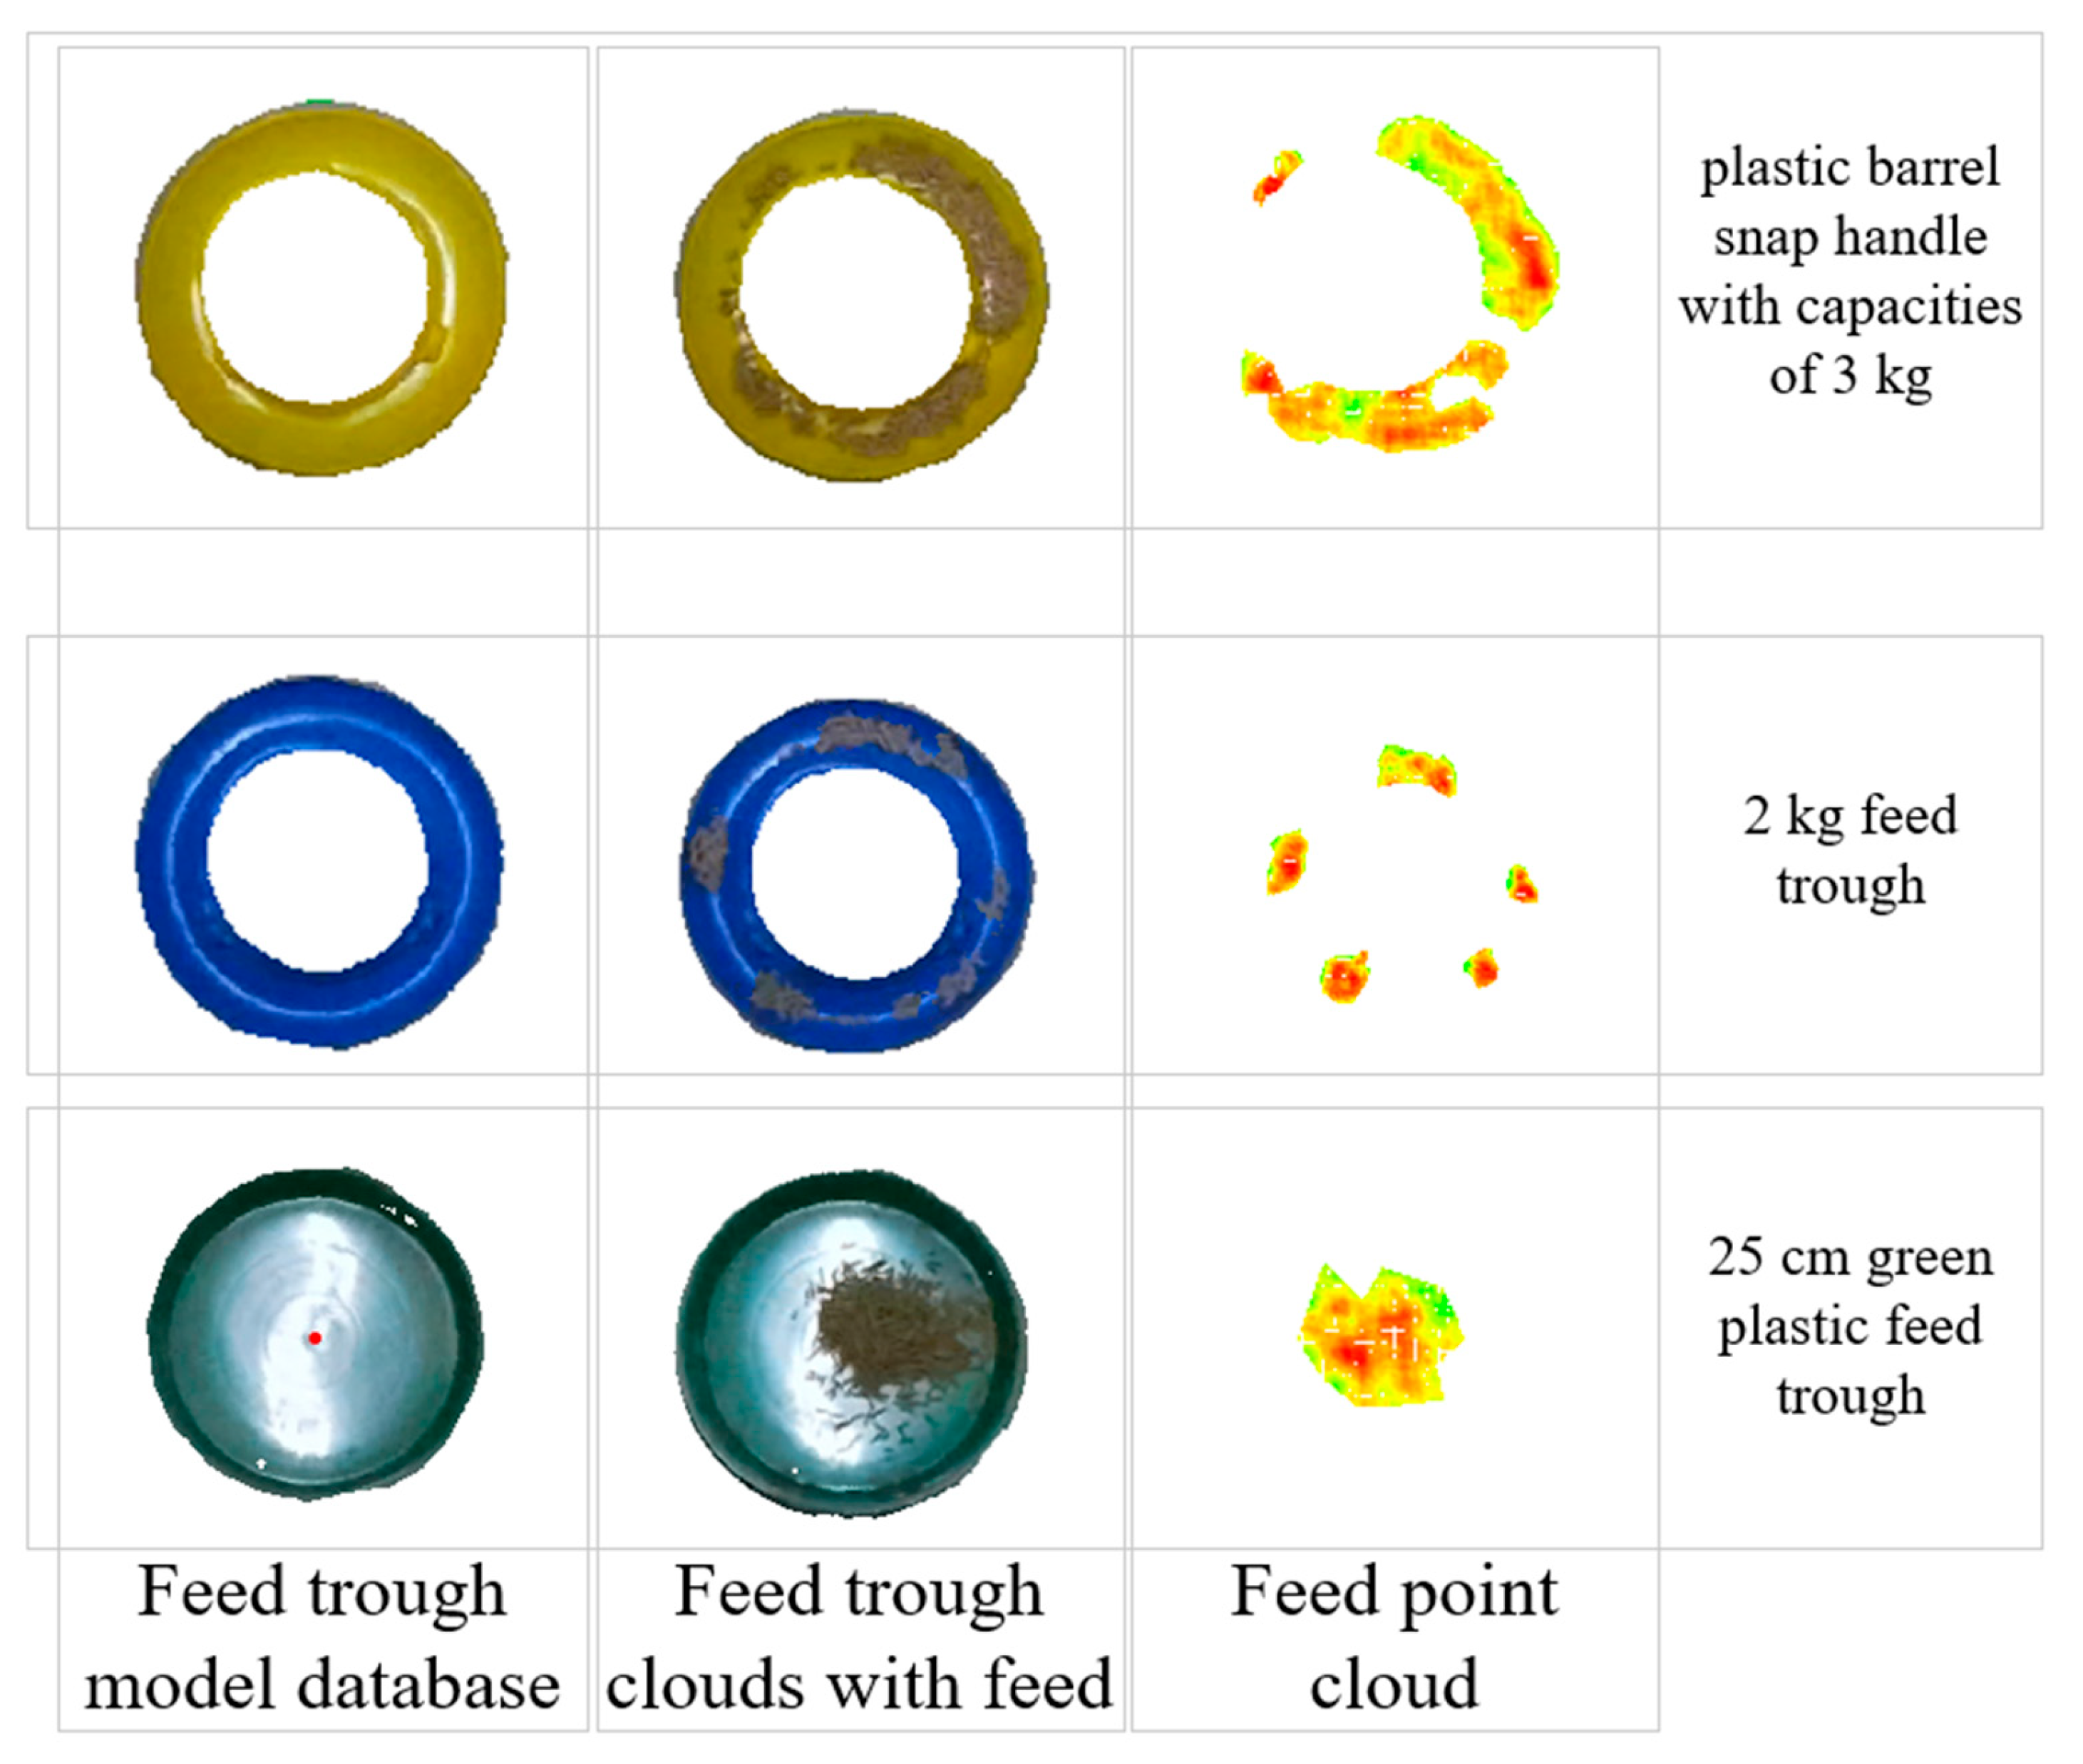
- Given the characteristics of feed troughs and the complex duck husbandry setting, this study implemented a sphere model filtering approach to segment the feed trough point cloud from the environmental point cloud. The process began by using the previously obtained centroid coordinates as sphere centers. Appropriate parameters were then selected from a pre-established feed trough model database, and the feed trough point cloud was segmented using sphere model filtering. The feed trough model database contains five preset models with corresponding parameters. For the 3 kg and 4 kg plastic-barrel snap handles, the sphere centers are located at the top of the feed trough point cloud. For the 10 kg iron-barrel snap handle, the sphere center is positioned 0.09 m above ground level. The 2 kg feed trough’s sphere center is situated 0.045 m above ground level, while the 25 cm green, plastic feed trough’s sphere center is located at the bottom center. Unlike the 25 cm green, plastic feed trough, which accommodates feed throughout its entire volume, other troughs only allow feed placement in their circular peripheral regions. To address this, threshold judgments were incorporated into the sphere model, retaining only point clouds within the defined threshold regions. The sphere model radii and threshold parameters are detailed in Table 4. Notably, the diameter values refer to the actual bottom diameter of the feed trough, not the sphere model diameter. For the 25 cm, green plastic feed trough, the sphere model diameter was calculated as (0.073 + 0.073) × 2 = 0.292 m. For other troughs, the threshold was set to half the actual circular ring width, with radii derived using the Pythagorean theorem based on sphere center height and the actual radius minus the threshold.
- The segmented point cloud still contained outliers, which were removed using statistical outlier removal filtering—a method that eliminates points with abnormal neighborhood distances based on Gaussian distribution statistics. Considering the point cloud density and filtering effectiveness, this study set the number of neighboring points (k-nearest neighbors, k = 1000) and the standard deviation multiplier (σ-multiplier = 1.0), ensuring high-quality point cloud data for subsequent processing.
- According to Fernández-Sarría [30], among the five methods, including convex hull, convex hull by slices of 5 cm height in the XY plane, triangulation by XY flat sections, and voxel modeling, the voxel modeling method exhibited the highest goodness of fit, with an R2 value of 0.731 for the relationship between crown volume and residual biomass. Therefore, the method used in this paper to handle volume was voxelized modeling. Considering the spatial correspondence (i.e., the degree of one-to-one structural alignment) between the upper and lower layers of voxels and the need for adequate voxel density to capture fine spatial details, voxels with a size of 2 mm × 2 mm × 2 mm were selected for volume calculation. However, voxelized volume calculation requires that the two point clouds be unified in the same coordinate system. The solution adopted in this study is to extract the bounding box of the point cloud after statistical filtering and align the center of the bounding box to the origin.
2.5. Volumetric Calculation
3. Results
3.1. The Positioning Result of the Feed Troughs
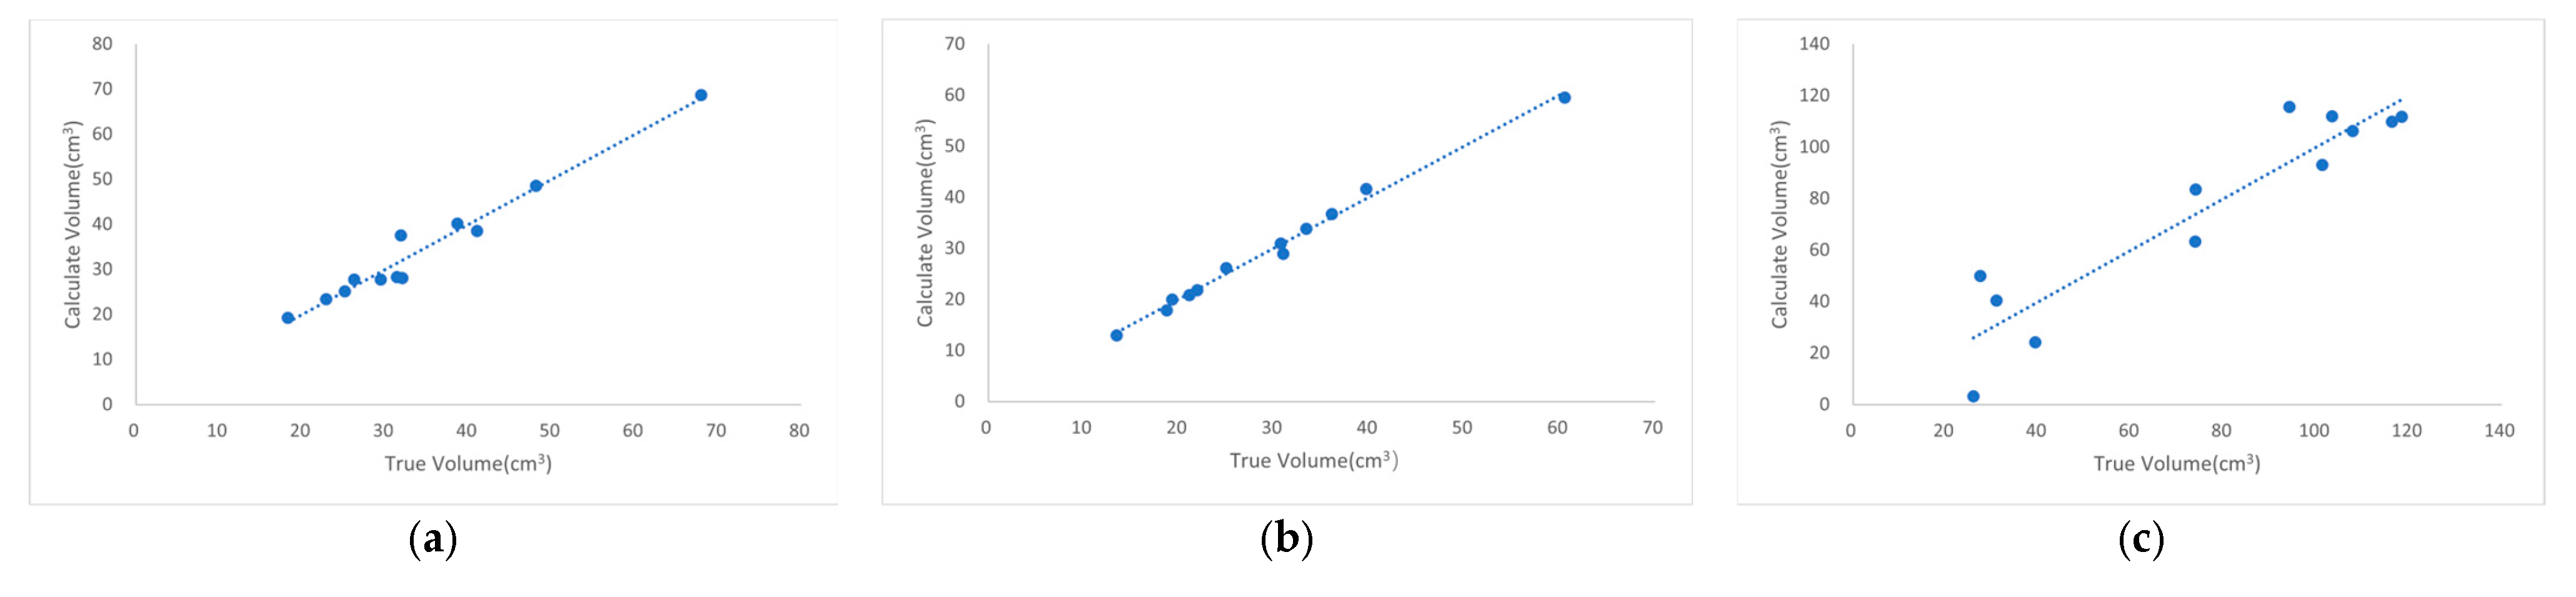
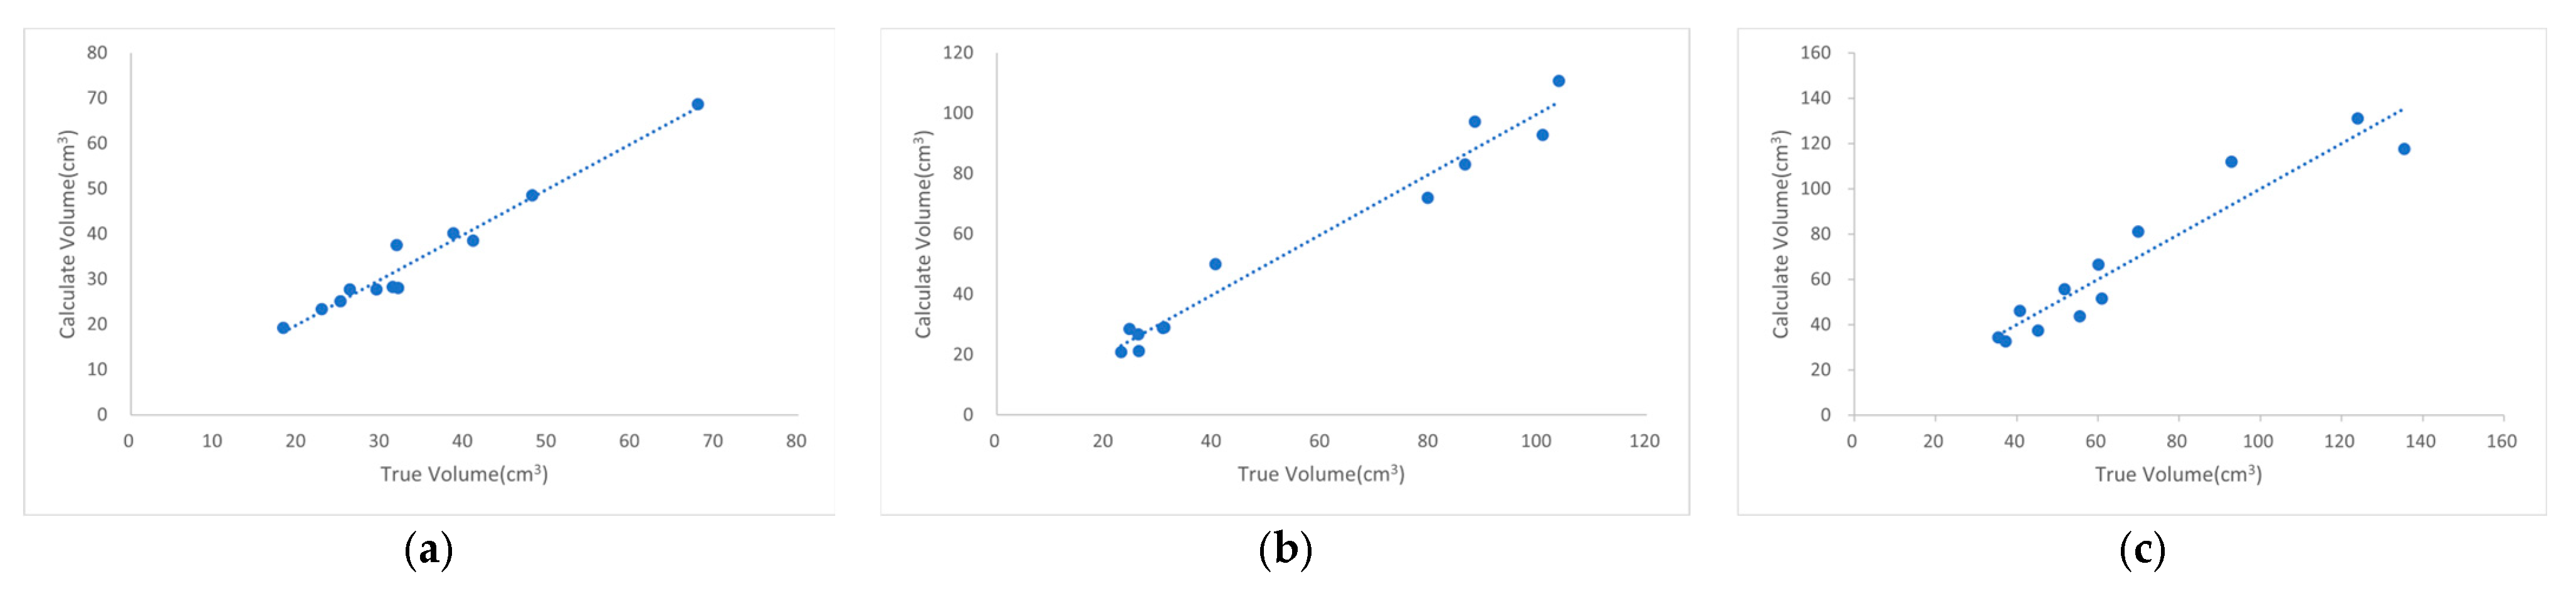
3.2. Detection Results for Different Types of Feeding Troughs
3.3. Detection Results of Feeding Troughs with Different Diameters
3.4. Detection Results of Feed Particles with Different Particle Sizes
4. Discussion
5. Conclusions
Author Contributions
Funding
Institutional Review Board Statement
Informed Consent Statement
Data Availability Statement
Conflicts of Interest
References
- Food and Agriculture Organization of the United Nations. Visualization of Fresh or Chilled Duck Meat Production Data (2018–2023). Available online: https://www.fao.org/faostat/zh/#data/QCL/visualize (accessed on 15 April 2025).
- Tian, W.; Cheng, X.; Zhang, Y.; Lin, H. Detect material volume by fusing heterogeneous camera target detection and depth estimation information. AIP Adv. 2025, 15, 015132. [Google Scholar] [CrossRef]
- Vacca, G. UAV Photogrammetry for Volume Calculations. A Case Study of an Open Sand Quarry. In Proceedings of the Computational Science and Its Applications-ICCSA 2022 Workshops, Malaga, Spain, 4–7 July 2022; pp. 505–518. [Google Scholar]
- Liu, Y.; Yue, S.; Li, B.; Wang, G.; Liu, M.; Zhang, J.; Shangguan, L. Fast and intelligent measurement of concrete aggregate volume based on monocular vision mapping. J. Real-Time Image Process. 2023, 20, 101. [Google Scholar] [CrossRef]
- Dahl, C.; Rolfes, I.; Vogt, M. A two-dimensional radar simulator for level measurement of bulk material in silos. In Proceedings of the 2015 German Microwave Conference, Dresden, Germany, 16–18 March 2015; pp. 221–224. [Google Scholar]
- Wang, H.; Zhao, C. Design and Implementation of a Residue Detection Device for Pig Feeding Trough Based on STM32. Shanxi Electron. Technol. 2020, 1, 32–35. [Google Scholar] [CrossRef]
- Shuai, Y. Design and Experiment of a Self-Locking Precision Feeding System for Small Group Gestating Sows. Master’s Thesis, Huazhong Agricultural University, Hubei, China, 1 June 2023. [Google Scholar]
- Rumphorst, T.; Scheu, T.; Koch, C.; Sundrum, A. Inter- and Intra-Individual Variation in the Behavior of Feed Intake on Nutrient Availability in Early Lactating Dairy Cows. Animals 2022, 12, 37. [Google Scholar] [CrossRef]
- Davison, C.; Michie, C.; Tachtatzis, C.; Andonovic, I.; Bowen, J.; Duthie, C.-A. Feed Conversion Ratio (FCR) and Performance Group Estimation Based on Predicted Feed Intake for the Optimisation of Beef Production. Sensors 2023, 23, 4621. [Google Scholar] [CrossRef]
- Gates, R.S.; Xin, H. Extracting poultry behaviour from time-series weigh scale records. Comput. Electron. Agric. 2008, 62, 8–14. [Google Scholar] [CrossRef]
- Hu, P.; Dai, X.; Zhao, R.; Wang, H.; Ma, Y.; Munteanu, A. Point2PartVolume: Human Body Volume Estimation From a Single Depth Image. IEEE Trans. Instrum. Meas. 2023, 72, 5502812. [Google Scholar] [CrossRef]
- Lo, F.P.W.; Sun, Y.; Qiu, J.; Lo, B.P.L. Point2Volume: A Vision-Based Dietary Assessment Approach Using View Synthesis. IEEE Trans. Ind. Inform. 2020, 16, 577–586. [Google Scholar] [CrossRef]
- Bezen, R.; Edan, Y.; Halachmi, I. Computer vision system for measuring individual cow feed intake using RGB-D camera and deep learning algorithms. Comput. Electron. Agric. 2020, 172, 105345. [Google Scholar] [CrossRef]
- Saar, M.; Edan, Y.; Godo, A.; Lepar, J.; Parmet, Y.; Halachmi, I. A machine vision system to predict individual cow feed intake of different feeds in a cowshed. Animals 2022, 16, 100432. [Google Scholar] [CrossRef]
- Shelley, A.N.; Lau, D.L.; Stone, A.E.; Bewley, J.M. Short communication: Measuring feed volume and weight by machine vision. J. Dairy Sci. 2016, 99, 386–391. [Google Scholar] [CrossRef] [PubMed]
- Peng, C.; Cao, S.; Li, S.; Bai, T.; Zhao, Z.; Sun, W. Automated Measurement of Cattle Dimensions Using Improved Keypoint Detection Combined with Unilateral Depth Imaging. Animals 2024, 14, 2453. [Google Scholar] [CrossRef] [PubMed]
- Molina, A.A.; Huang, Y.; Zhu, Z. Comparing Bulk Volume Measurements between Surveying GPS and UAS-Mounted LIDAR. In Computing in Civil Engineering 2023; American Society of Civil Engineers (ASCE): New York, NY, USA, 2023; pp. 308–316. [Google Scholar]
- Cui, Z. Research on the Volume Measurement Method of Bulk Material Piles Based on Point Cloud Segmentation of Deep Learning. Master’s Thesis, Shandong University, Jinan, China, 25 May 2022. [Google Scholar]
- Yin, Y. Research on the Rapid Volume Measurement Method of Material Piles Based on RGB-D Depth Camera. Master’s Thesis, Hunan University, Changsha, China, 16 May 2022. [Google Scholar]
- Guevara, J.; Arevalo-Ramirez, T.; Yandun, F.; Torres-Torriti, M.; Cheein, F.A. Point cloud-based estimation of effective payload volume for earthmoving loaders. Autom. Constr. 2020, 117, 103207. [Google Scholar] [CrossRef]
- Bellandi, P.; Docchio, F.; Sansoni, G. Roboscan. A combined 2D and 3D vision system for improved speed and flexibility in pick-and-place operation. Int. J. Adv. Manuf. Technol. 2013, 69, 1873–1886. [Google Scholar] [CrossRef]
- Ni, X.; Li, C.; Jiang, H.; Takeda, F. Three-dimensional photogrammetry with deep learning instance segmentation to extract berry fruit harvestability traits. ISPRS J. Photogramm. Remote Sens. 2021, 171, 297–309. [Google Scholar] [CrossRef]
- Sari, Y.A.; Gofuku, A. Measuring food volume from RGB-Depth image with point cloud conversion method using geometrical approach and robust ellipsoid fitting algorithm. J. Food Eng. 2023, 358, 111656. [Google Scholar] [CrossRef]
- Rogers, M.Z. Volume Measurement of Biological Materials in Livestock or Vehicular Settings Using Computer Vision. Ph.D. Thesis, Purdue University, West Lafayette, IN, USA, 2022. [Google Scholar]
- Tuan, N.M.; Hau, Q.V.; Chin, S.; Park, S. In-situ concrete slump test incorporating deep learning and stereo vision. Autom. Constr. 2021, 121, 103432. [Google Scholar] [CrossRef]
- Moreno, H.; Rueda-Ayala, V.; Ribeiro, A.; Bengochea-Guevara, J.; Lopez, J.; Peteinatos, G.; Valero, C.; Andújar, D. Evaluation of Vineyard Cropping Systems Using On-Board RGB-Depth Perception. Sensors 2020, 20, 6912. [Google Scholar] [CrossRef] [PubMed]
- Neupane, C.; Koirala, A.; Wang, Z.; Walsh, K.B. Evaluation of Depth Cameras for Use in Fruit Localization and Sizing: Finding a Successor to Kinect v2. Agronomy 2021, 11, 1780. [Google Scholar] [CrossRef]
- Orbbec. Femto Bolt Hardware Specifications. Available online: https://www.orbbec.com/documentation/femto-bolt-hardware-specifications/ (accessed on 25 April 2025).
- Jocher, G.; Chaurasia, A.; Qiu, J. Ultralytics YOLOv8, 8.0.0; Ultralytics LLC: Los Angeles, CA, USA, 2023. [Google Scholar]
- Fernández-Sarría, A.; Velázquez-Martí, B.; Sajdak, M.; Martínez, L.; Estornell, J. Residual biomass calculation from individual tree architecture using terrestrial laser scanner and ground-level measurements. Comput. Electron. Agric. 2013, 93, 90–97. [Google Scholar] [CrossRef]
- Hacking, C.; Poona, N.; Manzan, N.; Poblete-Echeverría, C. Investigating 2-D and 3-D Proximal Remote Sensing Techniques for Vineyard Yield Estimation. Sensors 2019, 19, 3652. [Google Scholar] [CrossRef] [PubMed]


| Feed Type | Length (mm) | Diameter (mm) | Mass (g) | Density (kg/m3) |
|---|---|---|---|---|
| 548 | 5.95 ± 3.36 | 2.20 ± 0.06 | 0.05 ± 0.02 | 1164.22 ± 231.88 |
| 549L | 7.42 ± 1.43 | 3.63 ± 0.11 | 0.08 ± 0.02 | 1118.47 ± 176.57 |
| 544 | 10.36 ± 1.38 | 4.83 ± 0.10 | 0.23 ± 0.04 | 1193.78 ± 89.23 |
| Large-duck feed | 15.08 ± 4.53 | 4.24 ± 0.20 | 0.25 ± 0.09 | 1167.68 ± 110.15 |
| Parameter | Numeric Value |
|---|---|
| Training batches | 6 |
| Iterations | 100 |
| Image size | 640 × 640 |
| Initial learning rate | 0.01 |
| Momentum of learning step | 0.937 |
| Model Number | Precision | Recall | mAP0.5 | mAP0.5−0.95 |
|---|---|---|---|---|
| 1 * | 0.980 | 0.982 | 0.987 | 0.871 |
| 2 * | 0.976 | 0.959 | 0.983 | 0.871 |
| 3 * | 0.983 | 0.982 | 0.985 | 0.866 |
| 4 * | 0.951 | 0.960 | 0.980 | 0.862 |
| 5 * | 0.979 | 0.972 | 0.989 | 0.887 |
| 6 * | 0.972 | 0.956 | 0.984 | 0.856 |
| Feed Trough Type | Diameter (m) | Height (m) | Sphere Model Radius (m) | Sphere Model Threshold (m) |
|---|---|---|---|---|
| Plastic-barrel snap handle with a capacity of 3 kg | 0.25 | 0.125 | 0.162 | 0.025 |
| Plastic-barrel snap handle with a capacity of 4 kg | 0.27 | 0.180 | 0.215 | 0.028 |
| Iron-barrel snap handle with a capacity of 10 kg | 0.38 | 0.295 | 0.175 | 0.040 |
| 2 kg feed trough | 0.25 | 0.165 | 0.110 | 0.025 |
| 25 cm green, plastic feed trough | 0.25 | 0.055 | 0.073 | 0.073 |
| Feed Trough Type | Correction Coefficient | R2 | Train RMSE (cm3) | Predict RMSE (cm3) |
|---|---|---|---|---|
| Plastic-barrel snap handle with a capacity of 3 kg | 3.22 | 0.964 | 2.46 | 8.37 |
| 2 kg feed trough | 2.56 | 0.993 | 1.03 | 3.47 |
| 25 cm green, plastic feed trough | 1.74 | 0.866 | 13.65 | 16.53 |
| The Diameter of the Feed Trough (m) | Correction Coefficient | R2 | Train RMSE (cm3) | Predict RMSE (cm3) |
|---|---|---|---|---|
| 0.25 | 3.22 | 0.964 | 2.46 | 8.37 |
| 0.27 | 2.10 | 0.968 | 5.82 | 17.18 |
| 0.38 | 4.17 | 0.906 | 10.24 | 25.62 |
| Categories of Feed Particles | Particle Diameter (mm) | Correction Coefficient | R2 | Train RMSE (cm3) | Predict RMSE (cm3) |
|---|---|---|---|---|---|
| 548 | 2.20 | 1.08 | 0.911 | 8.52 | 8.42 |
| 549L | 3.63 | 1.77 | 0.927 | 4.55 | 11.97 |
| 544 | 4.83 | 1.43 | 0.903 | 6.43 | 11.63 |
Disclaimer/Publisher’s Note: The statements, opinions and data contained in all publications are solely those of the individual author(s) and contributor(s) and not of MDPI and/or the editor(s). MDPI and/or the editor(s) disclaim responsibility for any injury to people or property resulting from any ideas, methods, instructions or products referred to in the content. |
© 2025 by the authors. Licensee MDPI, Basel, Switzerland. This article is an open access article distributed under the terms and conditions of the Creative Commons Attribution (CC BY) license (https://creativecommons.org/licenses/by/4.0/).
Share and Cite
Tan, X.; Yuan, J.; Ying, S.; Wang, J. Detection of Remaining Feed in the Feed Troughs of Flat-Fed Meat Ducks Based on the RGB-D Sensor and YOLO V8. Animals 2025, 15, 1440. https://doi.org/10.3390/ani15101440
Tan X, Yuan J, Ying S, Wang J. Detection of Remaining Feed in the Feed Troughs of Flat-Fed Meat Ducks Based on the RGB-D Sensor and YOLO V8. Animals. 2025; 15(10):1440. https://doi.org/10.3390/ani15101440
Chicago/Turabian StyleTan, Xueliang, Junjie Yuan, Shijia Ying, and Jizhang Wang. 2025. "Detection of Remaining Feed in the Feed Troughs of Flat-Fed Meat Ducks Based on the RGB-D Sensor and YOLO V8" Animals 15, no. 10: 1440. https://doi.org/10.3390/ani15101440
APA StyleTan, X., Yuan, J., Ying, S., & Wang, J. (2025). Detection of Remaining Feed in the Feed Troughs of Flat-Fed Meat Ducks Based on the RGB-D Sensor and YOLO V8. Animals, 15(10), 1440. https://doi.org/10.3390/ani15101440