Article

Soil Properties and Bacterial Communities Associated with the Rhizosphere of the Common Bean after Using Brachiaria brizantha as a Service Crop: A 10-Year Field Experiment

by
Carla L. Abán
1,2,
Giovanni Larama
3,4,
Antonella Ducci
1,2,
Jorgelina Huidobro
2,
Michel Abanto
4,
Silvina Vargas-Gil
5,* and
Carolina Pérez-Brandan
1,2,*
1
Consejo Nacional de Investigaciones Científicas y Técnicas (CONICET) CCT-Salta, J.M. Leguizamón 366, Salta 4400, Salta, Argentina
2
Instituto Nacional de Tecnología Agropecuaria (INTA)—Estación Experimental Agropecuaria Salta, Ruta Nacional 68, Km 172, Cerrillos C.P. 4403, Salta, Argentina
3
Agriaquaculture Nutritional Genomic Center, CGNA, Las Heras 350, Temuco C.P. 4781158, Chile
4
Genomics and Bioinformatics Unit, Scientific and Technological Bioresource Nucleus (BIOREN), Universidad de La Frontera, Casilla 54-D, Francisco Salazar 01145, Temuco 4811230, Chile
5
Instituto de Patología Vegetal (IPAVE)-Unidad de Fitopatología y Modelización Agrícola (UFYMA), CIAP, INTA, Camino 60 Cuadras, Km 5.5, Córdoba C.P. 5119, Córdoba, Argentina
*
Authors to whom correspondence should be addressed.
Sustainability 2023, 15(1), 488; https://doi.org/10.3390/su15010488
Submission received: 14 October 2022 / Revised: 23 November 2022 / Accepted: 14 December 2022 / Published: 28 December 2022
(This article belongs to the Special Issue Soil Microbiomes in the Light of Sustainable Agriculture)

Abstract

:
Intensive agricultural farming practices, such as monoculture, require long bare fallow periods and the overuse of agrochemicals, which compromise soil health over time. Increasing plant diversity in agroecosystems with service crops represents a promising alternative to achieving sustainability goals. However, how specific cover crop species influence the abundance and structure of soil bacterial communities remains to be solved. In this study, we assessed the effects of B. brizantha in two different agricultural cycles for 10 years in a common bean monoculture system in the northwestern region of Argentina (NWA) by measuring chemical, physical, and microbiological parameters in the rhizosphere, as well as by screening the rhizobiome using 16S rRNA sequencing. The ten-year inclusion of B. brizantha had a positive impact on properties in the rhizosphere compared to the common bean monoculture. The bacterial beta-diversity was different among treatments, but not the alpha-diversity. The most abundant phyla were Actinobacteria, Proteobacteria, Acidobacteria, Chloroflexi and Myxococcota. The predicted functions related to chemoheterotrophy and aerobic chemoheterotrophy were increased under B. brizantha treatments compared to the bean monoculture. The inclusion of the pasture B. brizantha contributed to restoring soil health and minimizing soil degradation.

1. Introduction

The common bean (Phaseolus vulgaris L.) is a major grain legume consumed worldwide, and is an inexpensive and significant source of protein, complex carbohydrates, fibers, vitamins and minerals, especially in South America, Africa, and Asia [1]. In the last decades, Argentina has been one of the top five major exporters of the common bean, and exports up to 95% of its production. Common beans are grown mainly in the northwestern region of Argentina (NWA), principally in the Salta province. For several decades, the traditional common bean management system consisted of monoculture with intensive agricultural practices (monoculture, conventional tillage, plowing, excessive pesticides application) focused on crop productivity and economic yields, which in turn caused progressive soil degradation, yield decline, and quality deterioration. Although no-tillage has been included in recent years as a sustainable agricultural method to increase soil productivity, the monoculture has provided a low replacement of carbon, total nitrogen, and associated nutrients to the soil, as well as an altered and/or diminished physical-chemical quality with consequent effects that include a reduction in diversity and microbial activity and an increased incidence of diseases caused by soil-borne fungi [2,3,4].
In the last decades, the idea that agroecosystems should be managed more like natural ecosystems has grown considerably, because intensive farming, which involves soil degradation, the overuse of agrochemicals, the loss of biodiversity, and greenhouse gasses emissions, affects climate change and human health [5,6]. In this context, the inclusion of service crops, also known as cover crops, has been proposed to improve soil health to thereby contribute to sustainable food production and preservation of the long-term sustainability of the agricultural system [7,8,9]. The use of service crops is an agronomic conservationist practice that aims to reduce soil erosion by replacing bare fallows, which provides a great amount of crop residues. In addition, service crops reduce the presence of weeds, promote nutrient cycling, carbon sequestration, biological activity, and crop yield as a result of agroecosystem diversification [10]. In general, the systematic use of service crops leads to a lower need for the application of chemical products, such as fungicides and nitrogenous fertilizers [11,12,13]. Several studies have addressed the benefits of service crops, which are particularly useful to increase SOC storage, nitrogen, and micronutrients [14,15,16,17], and also improve other soil physical properties, such as aggregate stability, water infiltration and retention, and bulk density [18,19,20]. Among the numerous service crops species, Brachiaria brizantha is a widely distributed African native grass and a valuable fodder crop in the tropics that is well adapted to soil fertility restrictions and management systems. This forage grass provides an abundant and highly nutritious volume of plant and root residues that increases carbon supply, favors the activity and diversity of soil microorganisms [3], enhances nitrogen use efficiency, and subsequently minimizes greenhouse gas emissions [21,22]. Previous studies have reported the benefits of Brachiaria brizantha on some chemical, physical and biochemical soil parameters in a degraded common bean monoculture system in northwest Argentina. [3,19]. However, the effect of service crops like B. brizantha on the abundance and composition of rhizosphere microbial communities still remains poorly understood.
Soil microbial communities and their associations with plants have been intensively studied over the past several years, due to growing evidence that these communities can affect the development, productivity, and resilience of crops [23,24,25]. The rhizosphere soil is the narrow zone of soil where complex interactions occur between plant roots and their resident microorganisms (rhizobiome) [26,27]. The rhizobiome plays a critical role in plant health and growth by providing key functions involved in nutrient acquisition, growth factor production, tolerance to biotic and abiotic stress, and protection against pathogen infection [24,28,29,30]. Edaphic factors and plant genotype are the main drivers that shape the composition and metabolic activities of the rhizobiome [26,31,32]. The rhizobiome can be altered by different agronomic practices, such as tillage, agrochemical applications, crop rotation, and the inclusion of service crops, which thus influence the plant–soil interactions [33]. A better understanding of how the applied agricultural management practices affect soil microbiota in determined edapho-climatic contexts is needed in order to promote sustainable agriculture [34,35] and to develop strategies for enhancing soil health and plant productivity.
The objective of this study was to analyze how B. brizantha, as a service crop, affected the rhizosphere soil’s chemical, physical, and microbiological parameters in the subsequent cash crop (the common bean). First, the rhizosphere samples were collected to determine the characteristics of the common bean rhizosphere. Then, we extracted the DNA from the rhizosphere of the common bean to study the abundances of bacteria and fungi using quantitative PCR (qPCR). Furthermore, we assessed the bacterial composition of the common bean rhizobiome using amplicon sequencing of the 16S r RNA gene. We hypothesized that (i) the use of service crops, specifically B. brizantha, would contribute to improve the chemical, physical, and biological fertility of the soil by favoring an enrichment of the rhizobiome that would promote plant performance, and (ii) the inclusion of B. brizantha as a long-term cover crop would increase the abundance and change the diversity of microbial groups.

2. Materials and Methods

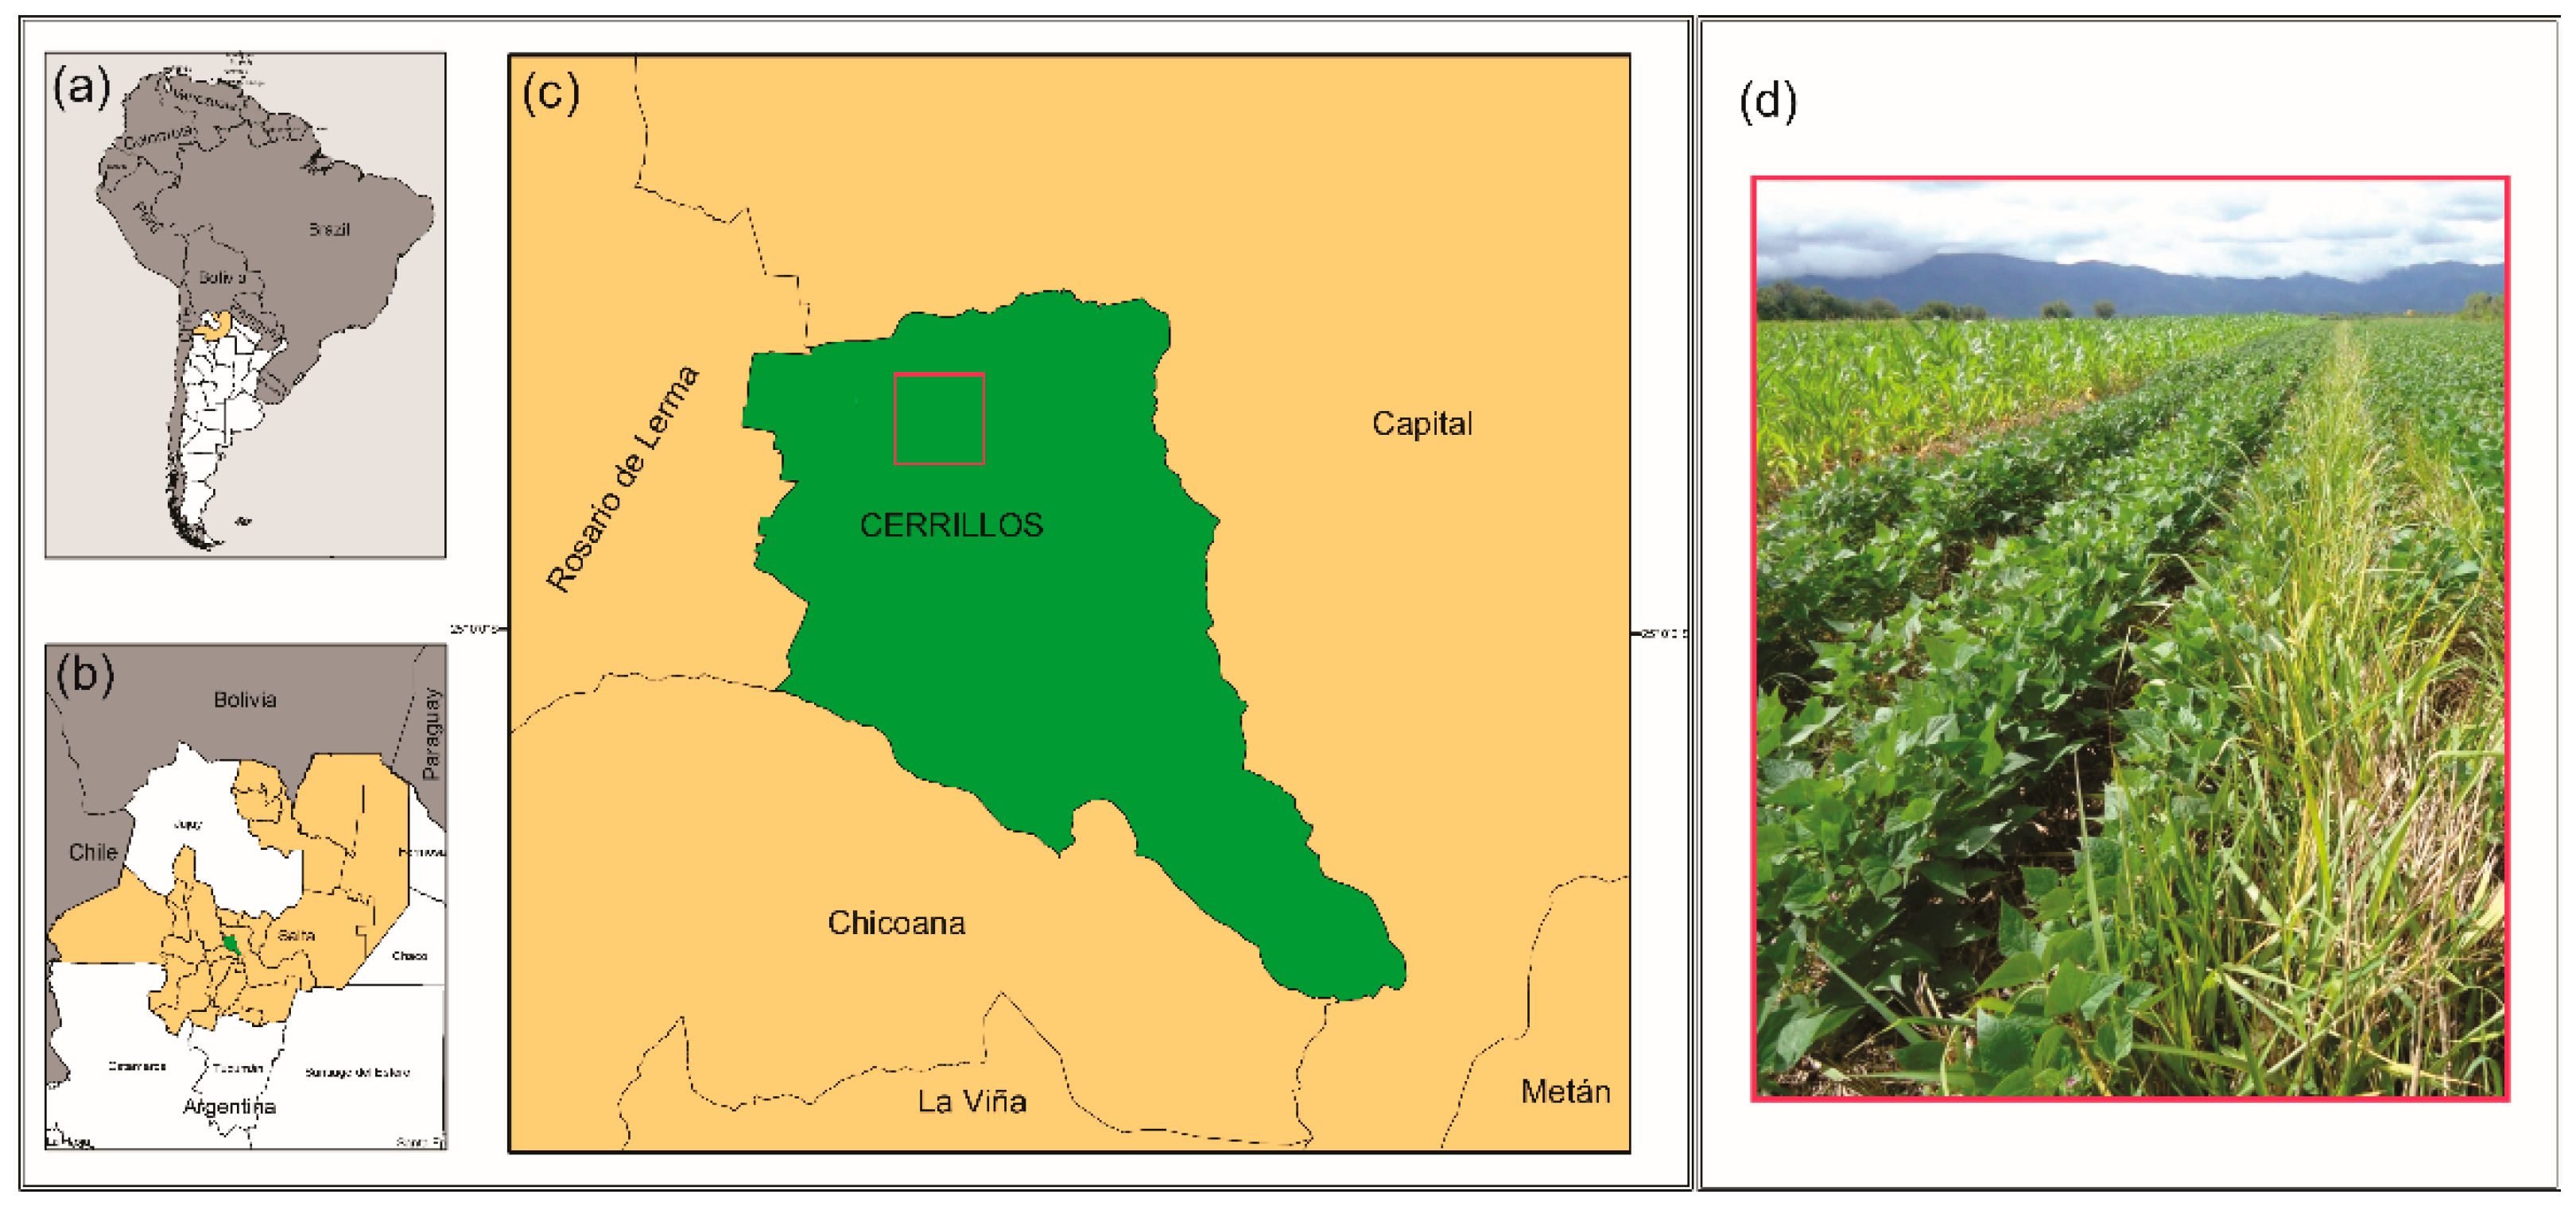
2.1. Field Experiment

A field trial was established in 2009 at the Salta Agricultural Experimental Station of the National Agricultural Technology Institute (EEA-INTA) in Cerrillos, Salta, Argentina (S 24°53′52.84″; W 65°27′59.11″, 1420 m.a.s.l.; Figure 1). The soil type of the region is predominantly loam with 1.31% organic matter (32% sand, 44% silt, 24% clay), Ustocrepte Udico (USDA Soil Taxonomy) soil, Cerrillos series with A, AC, and C horizons. The climate is subtropical serrano with an average temperature of 23 °C in the summer and 15 °C in the winter [36], and the mean annual precipitation is 900 mm, which occurs mainly during spring–summer, with a prolonged dry season in the winter. Before the establishment of the trial, the site was cropped under intensive monoculture for more than 50 years, with long periods of fall–winter fallow.
The experimental design was carried out in randomized complete blocks with three replicates. The treatments were: one crop cycle of B. brizantha (B1: B. brizantha/common bean); two consecutive crop cycles of B. brizantha (B2: B. brizantha/B. brizantha/common bean); and a common bean monoculture without a service crop (BM: fallow/common bean). Each replicate consisted of independent plots (experimental units) measuring 15 m wide by 50 m long, at a distance of 2.5 m from one another. Regarding treatment B1, B. brizantha was sown in the spring (in September) by seed drill (a sowing machine) at a distance of 0.26 m between rows. Then, at the end of November until flowering, the service crop was killed with glyphosate (48% i.a., 3 L ha-1). In B2, the grass B. brizantha was sown during the spring (in September) and allowed to grow until it naturally dried in the autumn of the following year. Then, during the spring of the following year, the grass B. brizantha was sown for the second consecutive time and followed the same drying process explained previously for B1. During the service crop period, no fertilizers, pesticides, or other agrochemicals were applied to service crops treatments (B1, B2). In the case of BM, long periods of fall–winter fallow were maintained. In January, at the beginning of the rainy season, the common bean was planted in the plots corresponding to B1, B2, and BM with seed drill at a distance of 0.52 m to result in 28 rows, so no ploughing was done during the experiment. During the crop cycle, the common bean was managed using recommended production practices, including pesticide applications (Dimethoate 40% p/v EC (Perfekthion®, BASF, Mexico, Mexico) at a dose of 300 mL ha−1 and 2-metaxicarbamoil-bencimidazol (Carbendazim® 50, Nufarm, Buenos Aires, Argentina)). In the plots where the common bean was sown (B1, B2, and BM) pesticide applications were made twice during the crop cycle. The first application was made 30 days after planting and the second 15 days after the first application if the environmental conditions favored the development of diseases. No chemical fertilizers were used during the growth of the common bean crop. Weeds were controlled using the pre-emergent herbicides Pivot® H BASF (imazethapyr 10.59%) and Dual Gold® (S-Metolachlor: 96%p/v Syngenta at a dose of 400 mL ha−1 and 500 mL ha−1, respectively). Thirty days after sowing, herbicide was applied (Flex® fomesafen: 25% p/v Syngenta) at a dose of 500 mL ha−1.

2.2. Rhizosphere Soil Sampling and Sample Preparation

In 2019, 10 years after starting the field trial, rhizosphere soil samples, defined as soil loosely adhered to the roots, were collected from the common bean, which was at the phenological stage of flowering (R5). For each replicate, composite rhizosphere soil samples were collected from 10 common bean plants that were extracted by digging around the plant with a shovel, to a depth of 10 cm. Then, plants were shaken to sample the soil loosely adhering to the roots, placed in polyethylene bags, and processed immediately. These composite samples were sieved (2 mm) to remove roots and small stones, homogenized, and divided into three parts: the first subsample was air dried at 20 ± 2 °C/24 h and stored for chemical and physical analysis; the second subsample was stored at 4 °C for measuring microbial activities and microbial biomass; and the third subsample (10 g) was stored at −20 °C for later DNA extraction and subsequent molecular analysis.

2.3. Rhizosphere Soil Chemical and Physical Analyses

Soil organic carbon (SOC) content was determined by the Walkley and Black method [37]. Total nitrogen (N) was determined by the micro-Kjeldahl method [38], and extractable phosphorus (eP) was quantified by the Bray and Kurtz method [39]. Soil bulk density (BD) was measured by the core method described by Blake and Hartge [40], using cores that were 3 cm in diameter, 10 cm in length, and 70.65 cm3 in volume. Aggregate stability (AS) was estimated by following the method of micro-sieves (1–2 mm), according to Corvalán et al. [41]. The water holding capacity (WHC) was determined gravimetrically, and the soil pH and electrical conductivity (EC) were measured potentiometrically in a 1:2.5 soil/water suspension.

2.4. Rhizosphere Soil Microbial Biomass and Respiration

The concentrations of microbial biomass carbon (MBC) and microbial biomass nitrogen (MBN) were determined based on the chloroform fumigation–inoculation method [42,43]. Microbial respiration (MR) was determined as potentially mineralizable C (CO2–C respiration) according to Alef [44]. Briefly, the amount of CO2 released was measured from rhizosphere soil samples (20 g) that were previously treated with chloroform, de-fumigated, inoculated with non-fumigated rhizosphere soil (1 g), and incubated with 0.2 M of NaOH at 28 °C for 10 days in the dark. Non-fumigated rhizosphere soil samples were incubated at the same time. The released CO2 was measured using 0.2 N of HCl. Control treatments (tubes with non-fumigated rhizosphere soil, that is, soils without chloroform) were included for the quantification of C in soil microbial biomass and for microbial respiration (without rhizosphere soil, only bottles with 15 mL of 0.1 N of NaOH).

2.5. Rhizosphere Soil Enzymatic Activities

General microbial activity was assessed by the hydrolysis of fluorescein diacetate activity (FDA) derived from extracellular and membrane enzymes (esterase, protease, and lipase) involved in this reaction, which followed the modified method of Adam and Duncan [45]. Dehydrogenase activity (DHA) was determined according to García et al. [46], which reflects the total range of the oxidative activity of soil microorganisms. The activity of acid phosphatase (AP) was determined using the procedure of Tabatabai and Bremner [38].

2.6. Rhizosphere Soil DNA Extraction

Total rhizosphere soil DNA was extracted using the PowerSoil® DNA Isolation kit (MoBIO, USA) according to the manufacturer’s instructions. DNA yield and quality were measured using a DeNovix DS-11 spectrophotometer (DeNovix, Wilmington, DE, United States). DNA samples were stored at −20 °C.

2.7. Quantification of Bacterial and Fungal Genes

The bacterial 16S rRNA gene copy numbers, as well as the fungal 18S rRNA gene copy numbers, were amplified from rhizosphere DNA by (qPCR) with primers 338F/534R [47] and SSU 1536/Fu 1851 [48], respectively, which followed the protocol by Liu et al. [49]. For each sample, three independent PCR reactions were performed in a Line-Gene 9600 and by fluorometric monitoring with SYBR Green PCR Master Mix (Mezcla Real®, Biodynamics). The qPCR amplifications were performed in 25 µL reactions containing 10 ng of DNA, 0.2 μM of each primer, and 12.5 μL of premix SYBR Green PCR Master Mix (Mezcla Real®, Biodynamics). Standard curves were generated using triplicate 10-fold dilutions of plasmid DNA. For the bacterial 16S rRNA gene, standards were between 2.07 × 10² to 2.07 × 10⁸ copies, the slope was −3.502 with an amplification efficiency of 93%, and the R2 value was 0.998. For the fungal 18S rRNA gene, standards were between 4.60 × 10² to 4.60 × 10⁸ copies, the slope was −3.345 with an amplification efficiency of 99%, and the R2 value was 0.995. The melt curve and 1.5% agarose gel electrophoresis were used to confirm the specificity of the PCR products (Table S1).

2.8. High Throughput Sequencing of 16S rRNA Gene Amplicons and Bioinformatic Analysis

Extracted DNA was sent to Novogene Inc. (Beijing, China) for library preparation and amplicon sequencing in a NovaSeq 6000 platform for 250 cycles in paired-end mode. The 16S rRNA V3–V4 gene regions were amplified using primers 341F (5′-CCTAYGGGRBGCASCAG-3′) and 806R (5′-GGACTACNNGGGTATCTAAT-3′) with barcodes attached (Table S1; [50]). The quality of the resulting reads was analyzed using QIIME2 [51] built-in applications and was used to train an error correction model using DADA2 to obtain the amplicon sequence variants (ASV) [52]. The taxonomic assignment of the ASV was performed using a pre-trained Naïve Bayes classifier of the V3–V4 region of 16S gene deposited in the SILVA138 database. The phylogenetic relationship between ASV was obtained by constructing a phylogenetic tree using the FastTree algorithm [53] based on a masked alignment constructed with MAFFT [54].

2.9. Statistical and Bioinformatic Analyses

The chemical, physical, and microbiological parameters were analyzed by analysis of variance (ANOVA) using InfoStat Professional v2017 [55]. The assumptions of the ANOVA of normality, homogeneity of variances, and independence of errors were tested using the Shapiro–Wilk test and visual inspection of residuals. When confirming a statistically significant p value, the LSD Fisher test (p < 0.05) was used for comparison.
For the bioinformatics analysis, the samples were rarified at a sampling depth of 56,325 amplicons for the measurements of alpha diversity (Shannon’s diversity index and Faith’s phylogenetic diversity), richness (observed ASV), and evenness (Pielou’s evenness) using QIIME2, and the statistical significance among treatments was tested using the Kruskal–Wallis test. The beta diversity was explored using a principal component analysis (PCA) of Aitchison distances computed from raw abundances. The statistical determination of differences between treatments was evaluated by permutational multivariate analysis of variance (PERMANOVA) with 999 random permutations using the adonis function from the vegan package contained in the R environment. The differences at the taxon level were assessed using a Zero-Inflated Gaussian Mixture Model (ZIGMM) using the metagenomeSeq R package [56] on cumulative sum scaling (CSS) normalized abundances. The functional potentials of the microbial communities were analyzed using functional annotation of the prokaryotic taxa (FAPROTAX) [57] by following the prescribed guidelines. A PCA was carried out in order to determine the structure and relationship between physicochemical and biological properties using the R package “stats”. The relationships between soil parameters were determined by Pearson’s correlation (r) using the R package “corrplot” version 0.84 [58], with the statistical significance set at p ≤ 0.01. Then, a redundancy analysis (RDA) was performed to identify the relationship among bacterial families with some physicochemical and biological properties parameters using the rda function from the vegan R package.

3. Results

3.1. Effect of the Inclusion of B. brizantha Service Crop on Soil Chemical and Physical Parameters

Soil chemical and physical properties were changed by the inclusion of different cycles of B. brizantha after 10 years of starting the field assay (Table 1). The soil organic carbon (SOC) and organic matter (OM) content in the B2 (B. brizantha/B. brizantha/common bean) and B1 (B. brizantha/common bean) was significantly increased (p < 0.01) after 10 years, and was 44% and 25% higher than the common bean monoculture (BM), respectively. The Total N followed the same dynamics as the SOC, and was 33% and 22% significantly higher (p < 0.01) in the B2 and B1, respectively, than the BM. A slight decrease in C/N ratios was observed under the BM. Regarding extractable phosphorus (eP), no significant differences were registered between treatments.
The inclusion of service crops significantly improved physical parameters in the rhizosphere of the common bean (p < 0.01). The bulk density (BD) decreased in the service crop treatments compared to the BM (p < 0.01). By contrast, the aggregate stability (AS) was 239% and 151% higher in the B2 and B1 treatments, respectively, when compared to the BM (p < 0.01). Likewise, the WHC increased in the service crop treatments, and was higher in B1 (17%) and B2 (12%) than in BM. The pH was similar among all treatments (p > 0.05). Finally, the highest values of EC were observed in both service crop treatments, with the highest recorded in B1 (140%), followed by B2 (37%).

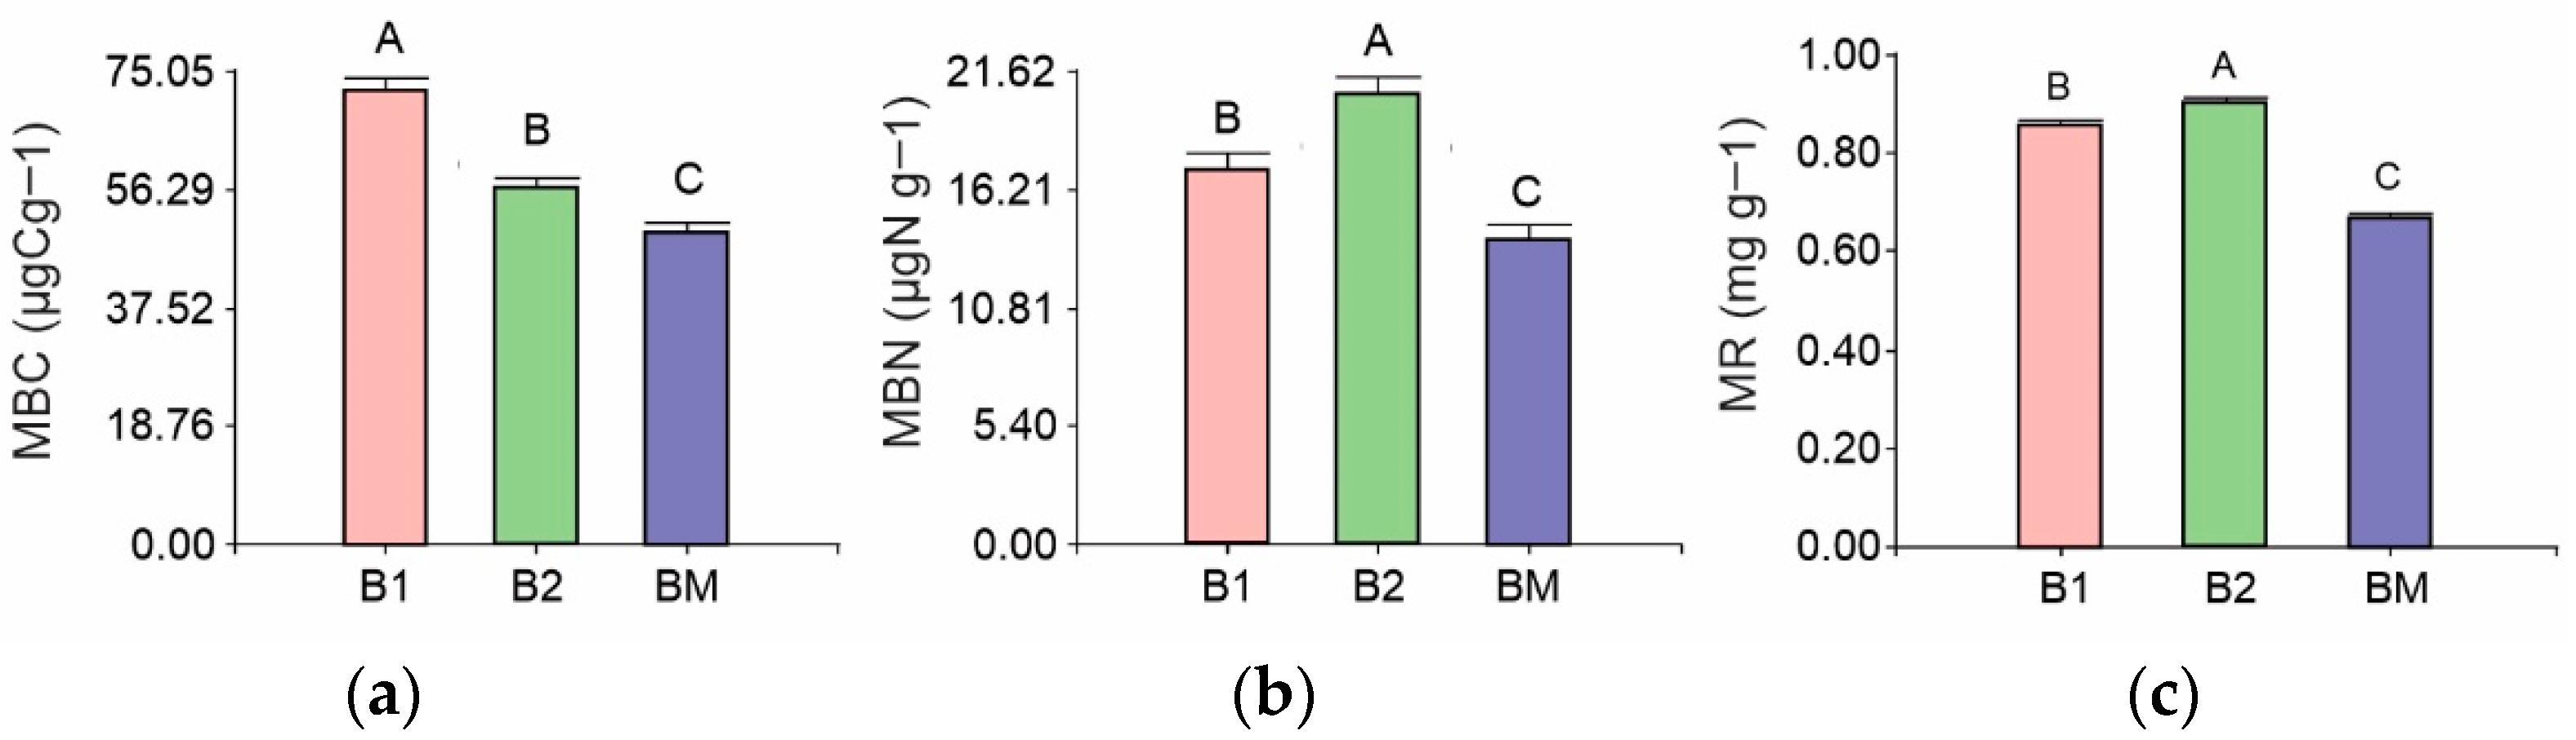
3.2. Rhizosphere Soil Microbial Biomass and Respiration

The inclusion of B. brizantha during the fallow period had significant and positive effects on the common bean rhizobiome biomass (Figure 2). The MBC was significantly increased when compared to the BM, with the highest values found for the B1 (46%), followed by B2 (14%) (Figure 2a). The MBN also increased with the inclusion of service crops, but the highest values were observed in the B2 (42% higher than the BM), followed by the B1 (22% higher than the BM) and the BM (Figure 2b). Likewise, the MR increased significantly in the B2, followed by the B1, with their values being 35% and 29% higher than the BM, respectively (Figure 2c).

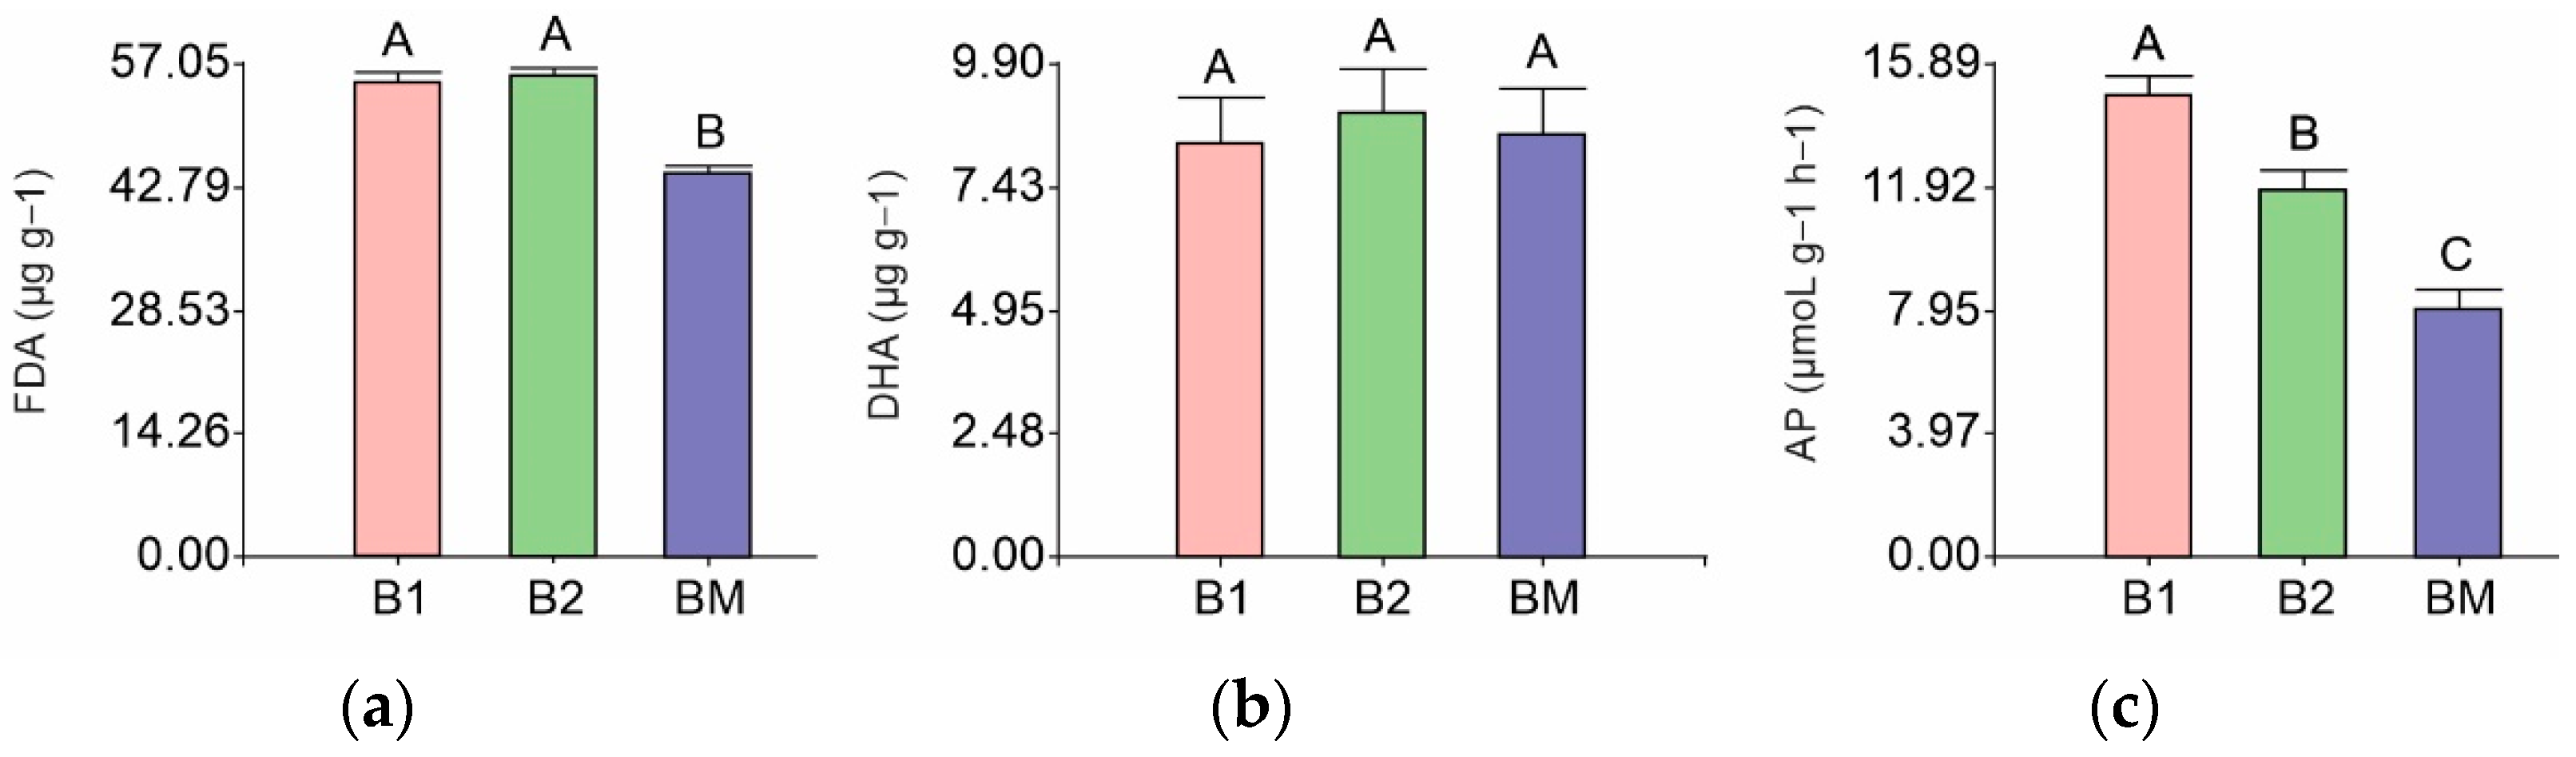
3.3. Rhizosphere Soil Enzyme Activities

The inclusion of B. brizantha in different agricultural cycles for 10 years had a significant effect on enzyme activities (Figure 3). The FDA of both service crop treatments (B1 and B2) was 10% higher than the BM (Figure 3a). Regarding DHA activity, no significant differences were found between treatments and the control BM (Figure 3b). The AP activity increase significantly in the service crops, and the highest values were observed in the B1 treatment, which was 86% higher than the BM, while B2 was 48% higher than the BM (Figure 3c).

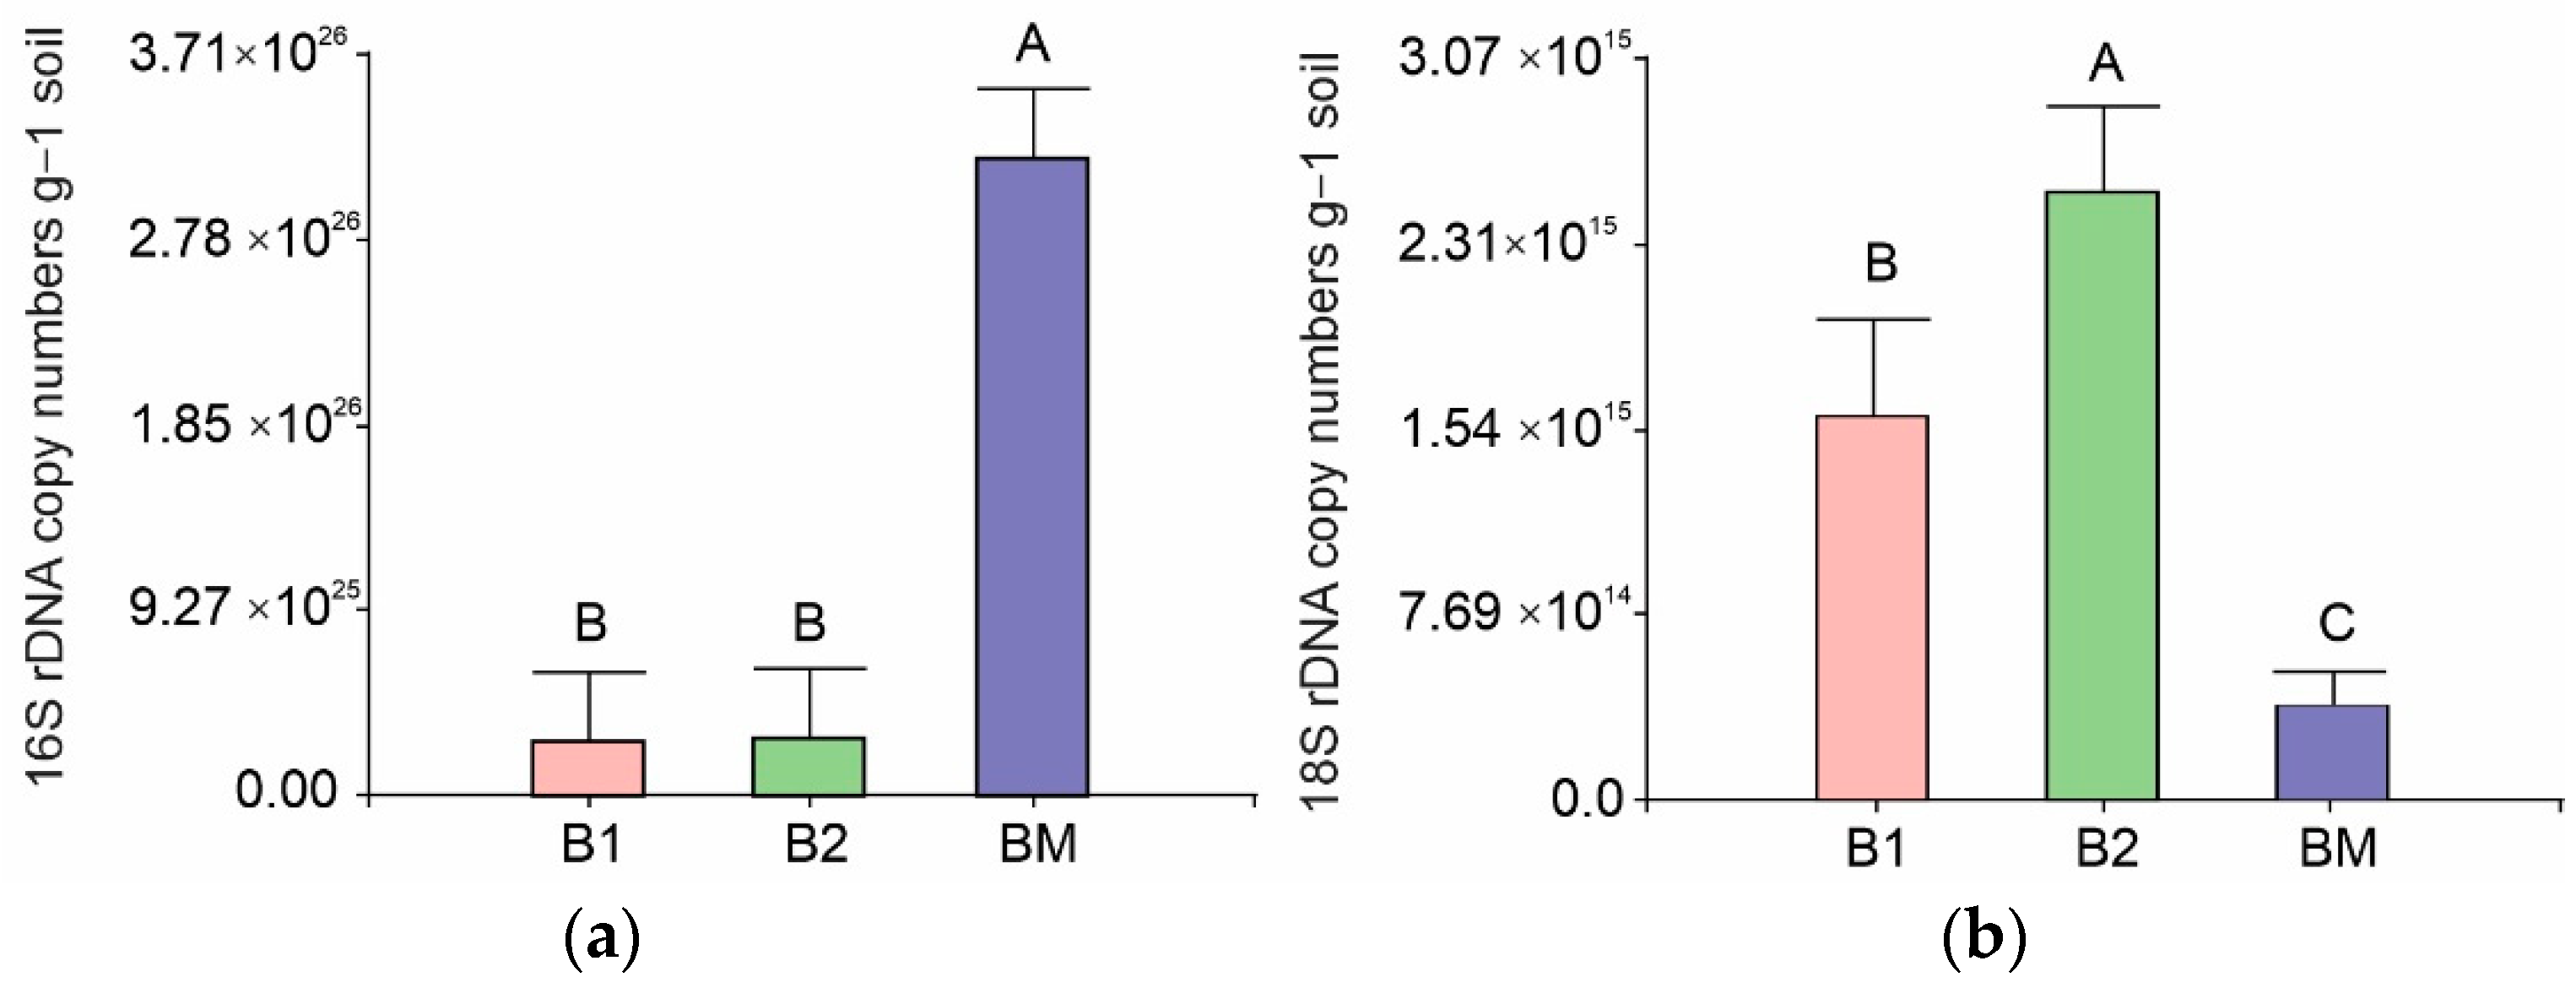
3.4. Bacterial and Fungal Abundance Via qPCR

The bacterial and fungal abundance of the common bean rhizobiome were affected by the inclusion of B. brizantha (Figure 4). The mean values of bacterial abundance were similar among the different cycles of B. brizantha, at 2.98 × 1025 (B1) and 3.22 × 1025 (B2) copy numbers per gram of soil, but were significantly lower than the BM (2.90 × 1026) (Figure 4a). The number of rDNA copies of fungal 18S showed the opposite trend to bacterial 16S rDNA. The mean values of fungal abundance were significantly different among the different cycles of B. brizantha, at 1.59 × 10¹⁵ (B1) and 2.47 × 10¹⁵ (B2) copy numbers per gram of soil, but were significantly higher than the BM (4.27x10¹⁴ copy numbers per gram of soil) (Figure 4b).

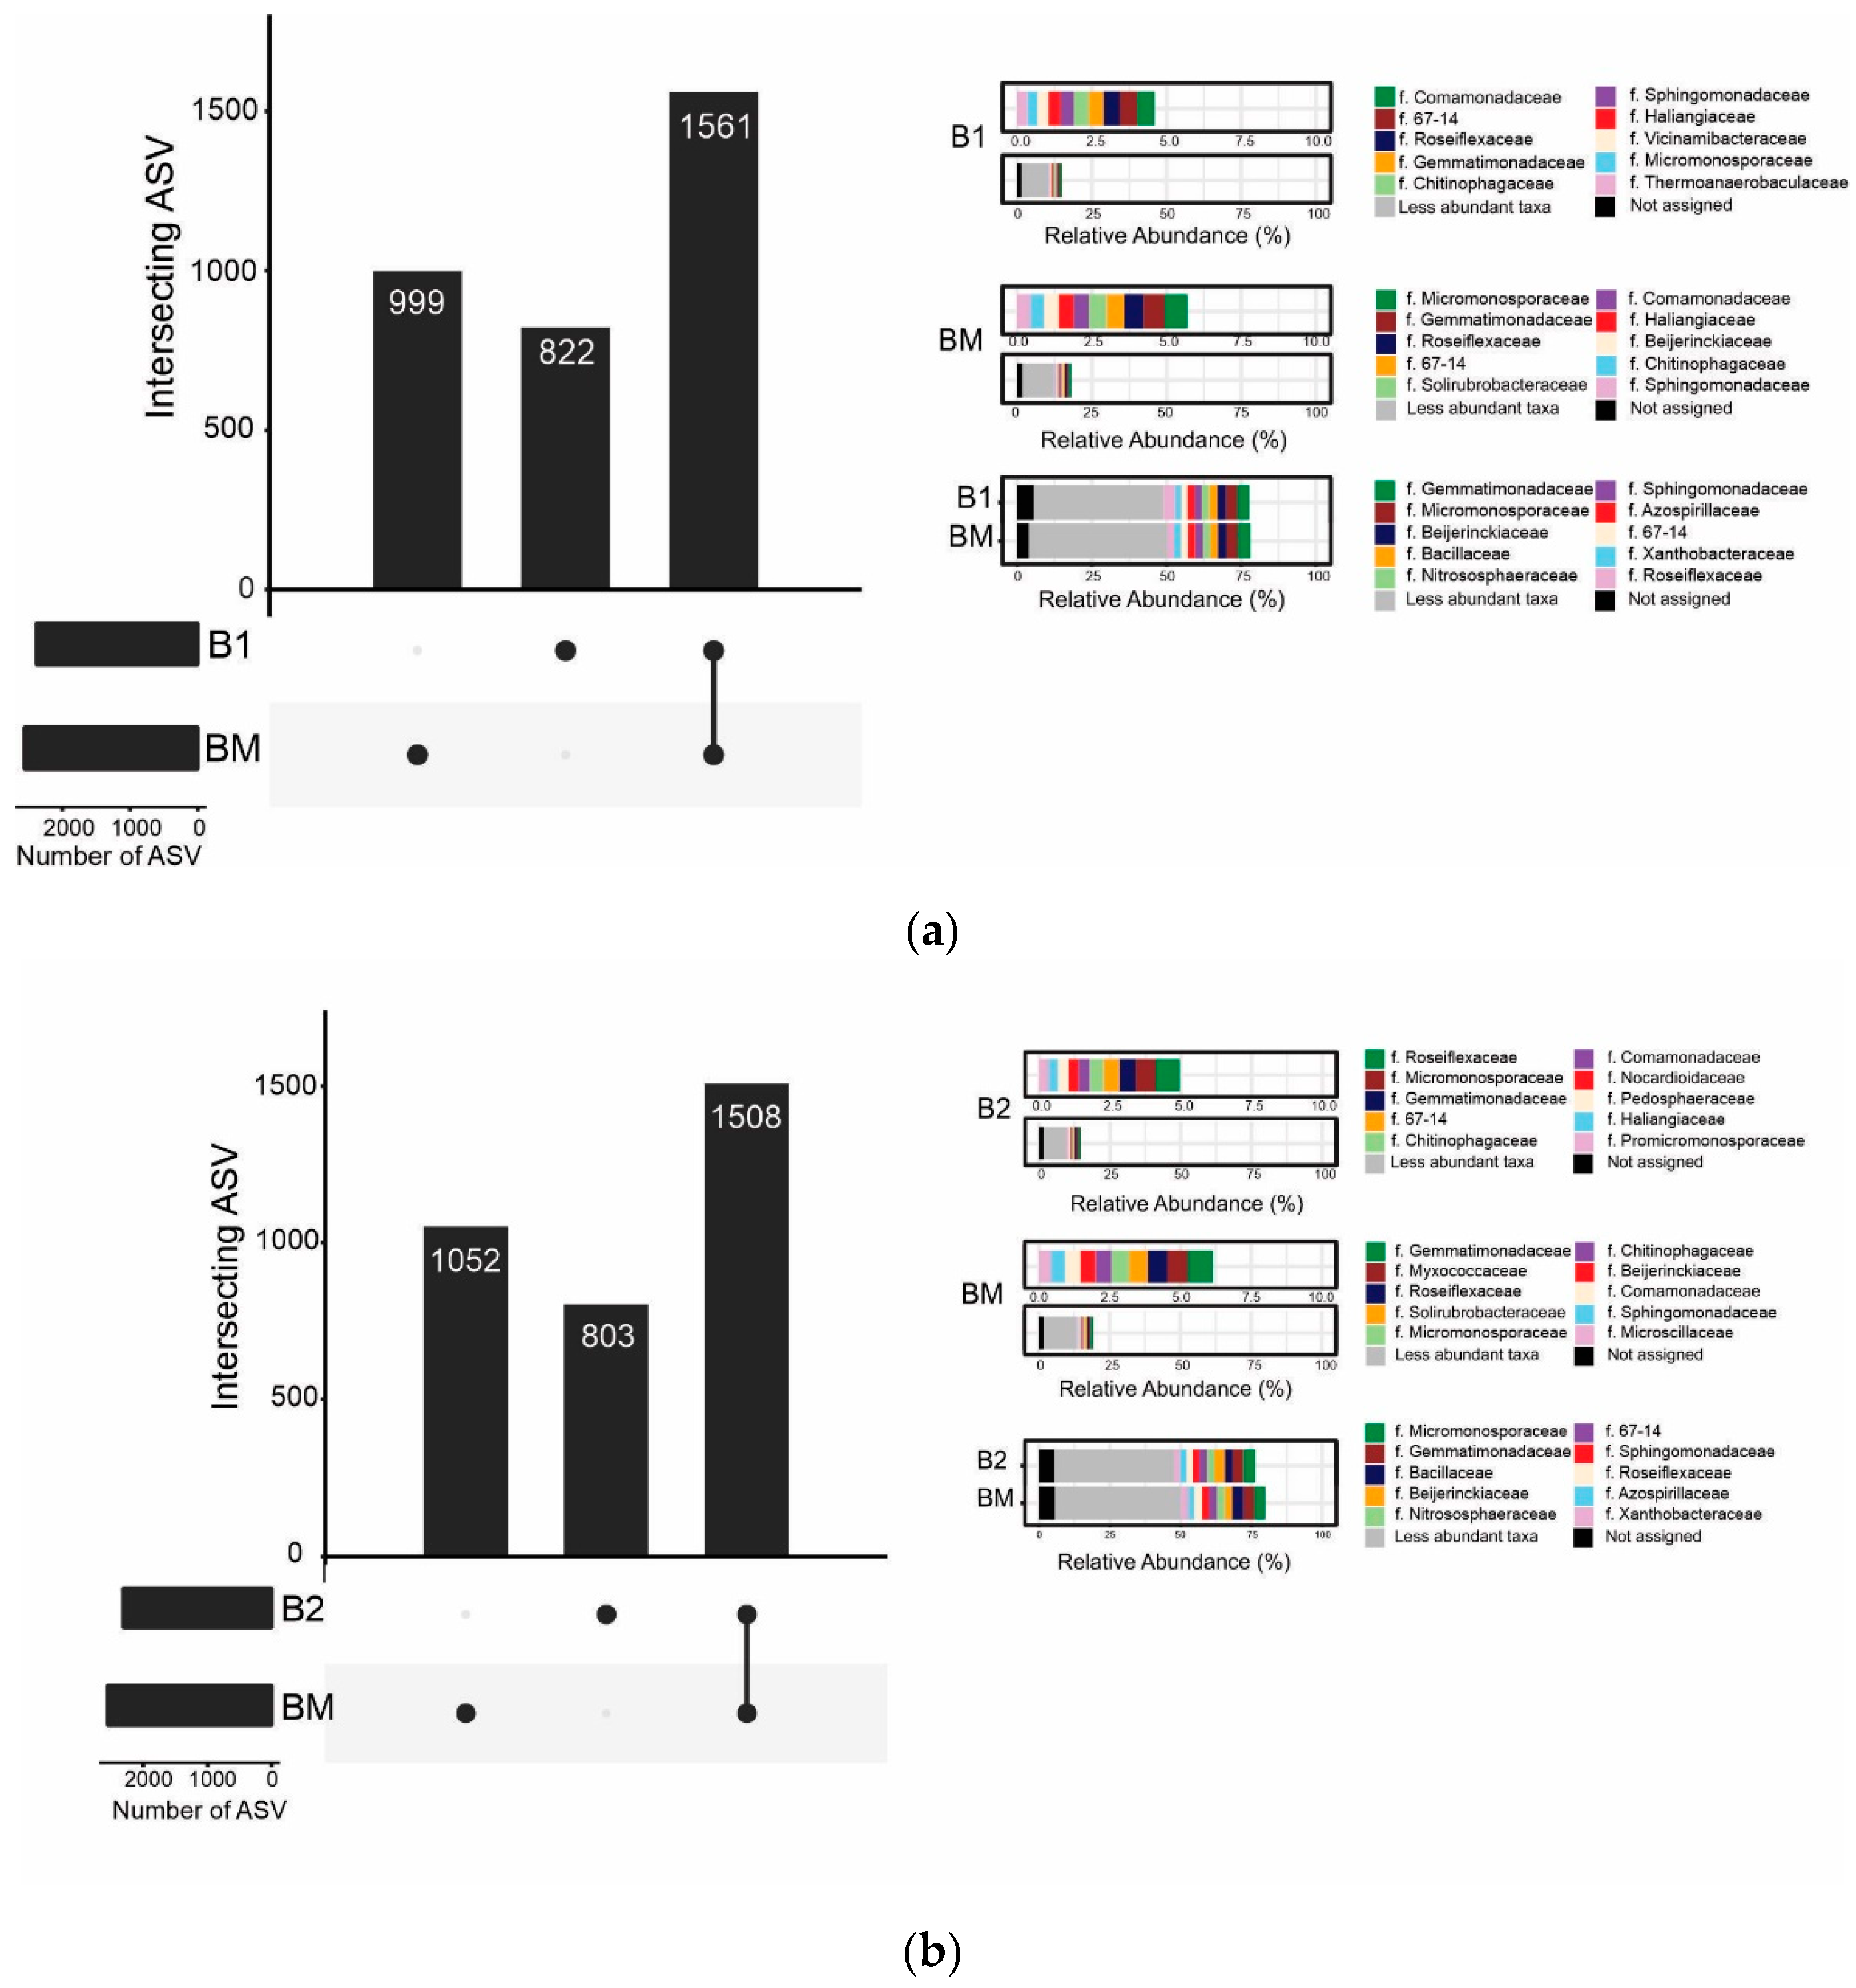
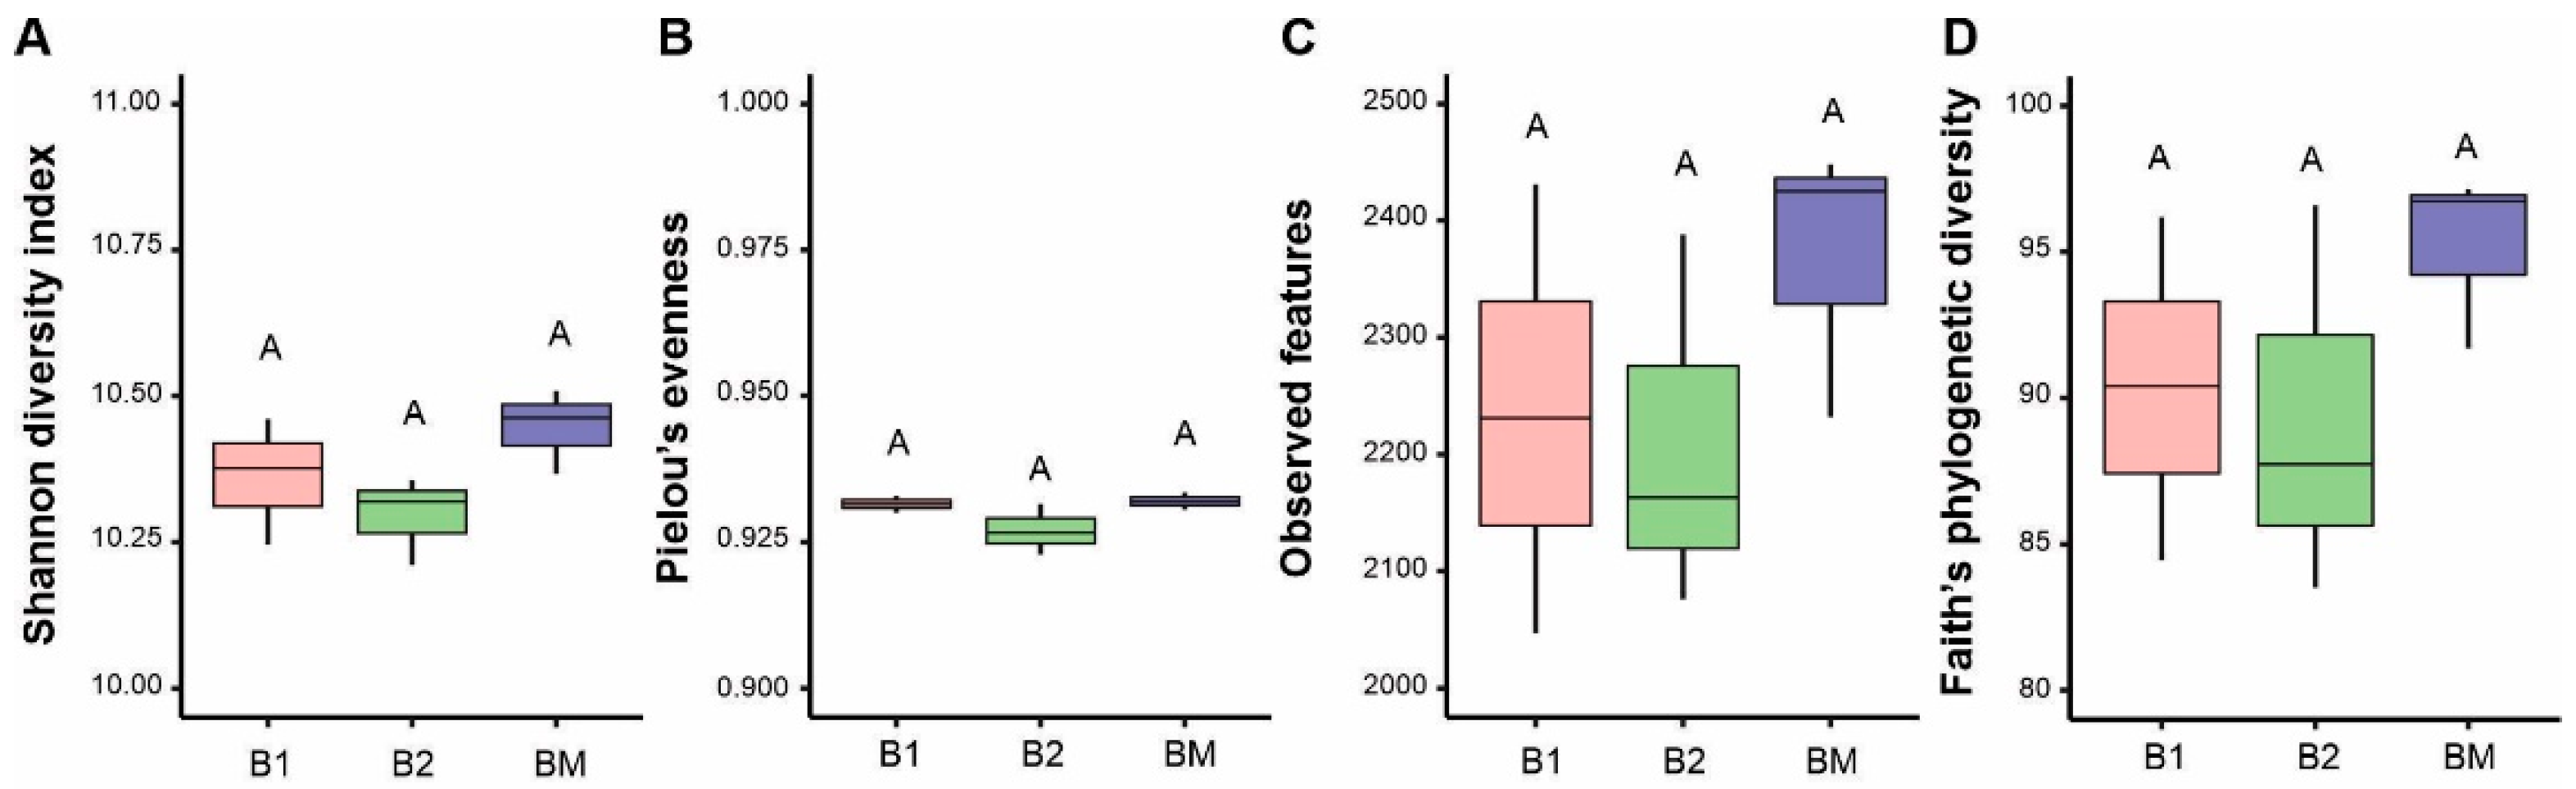
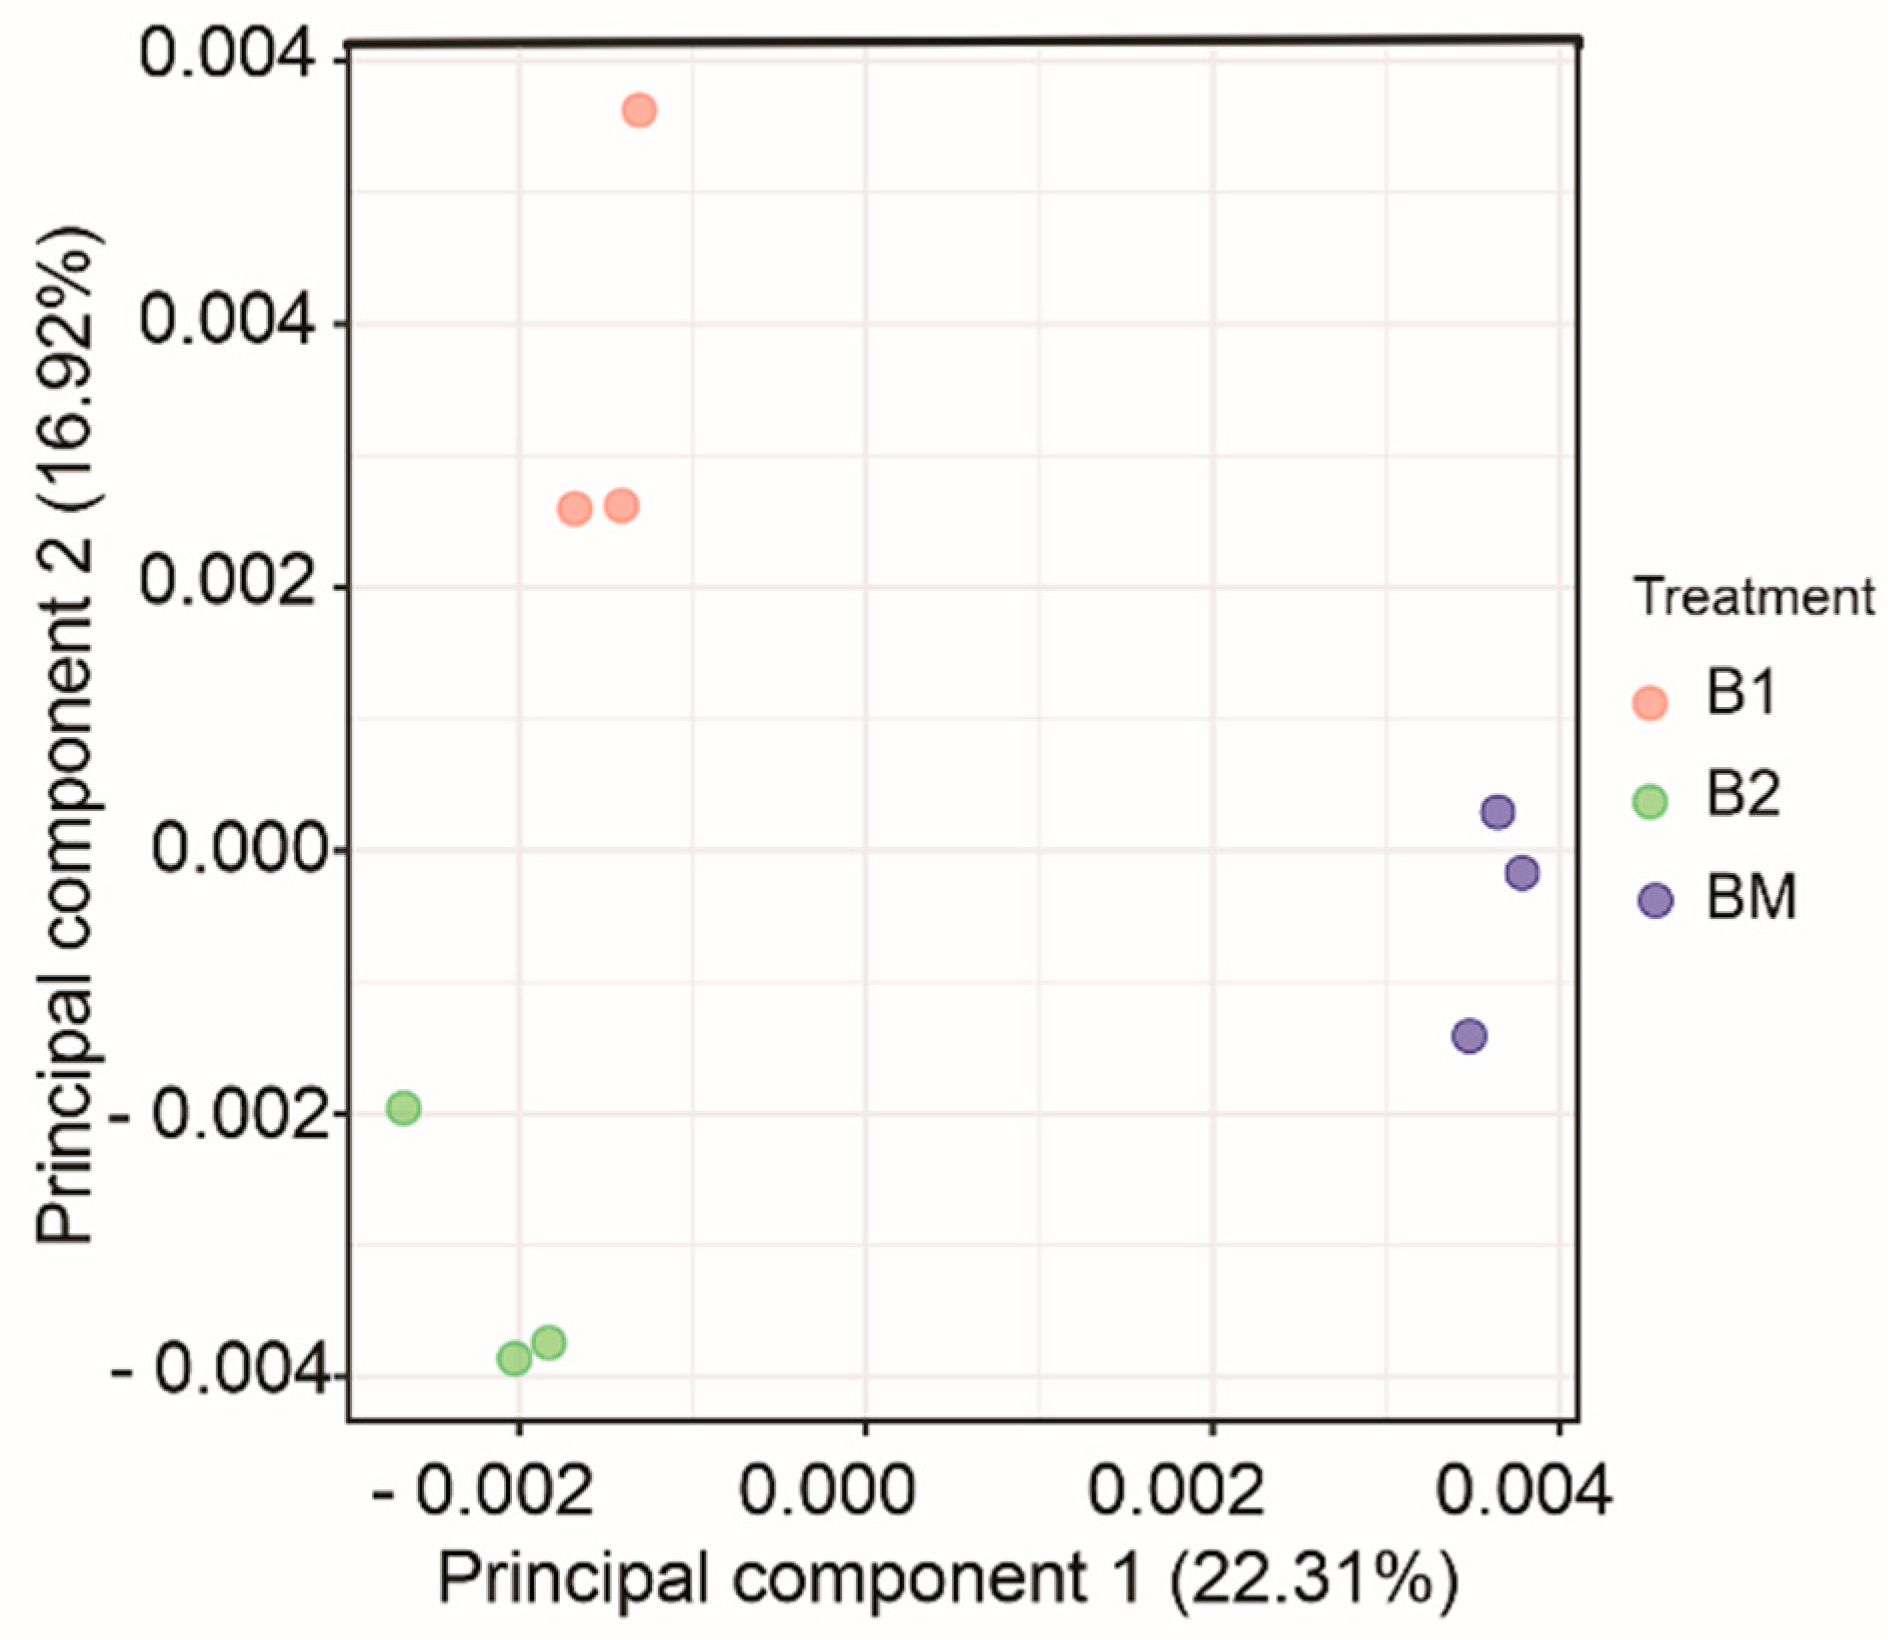
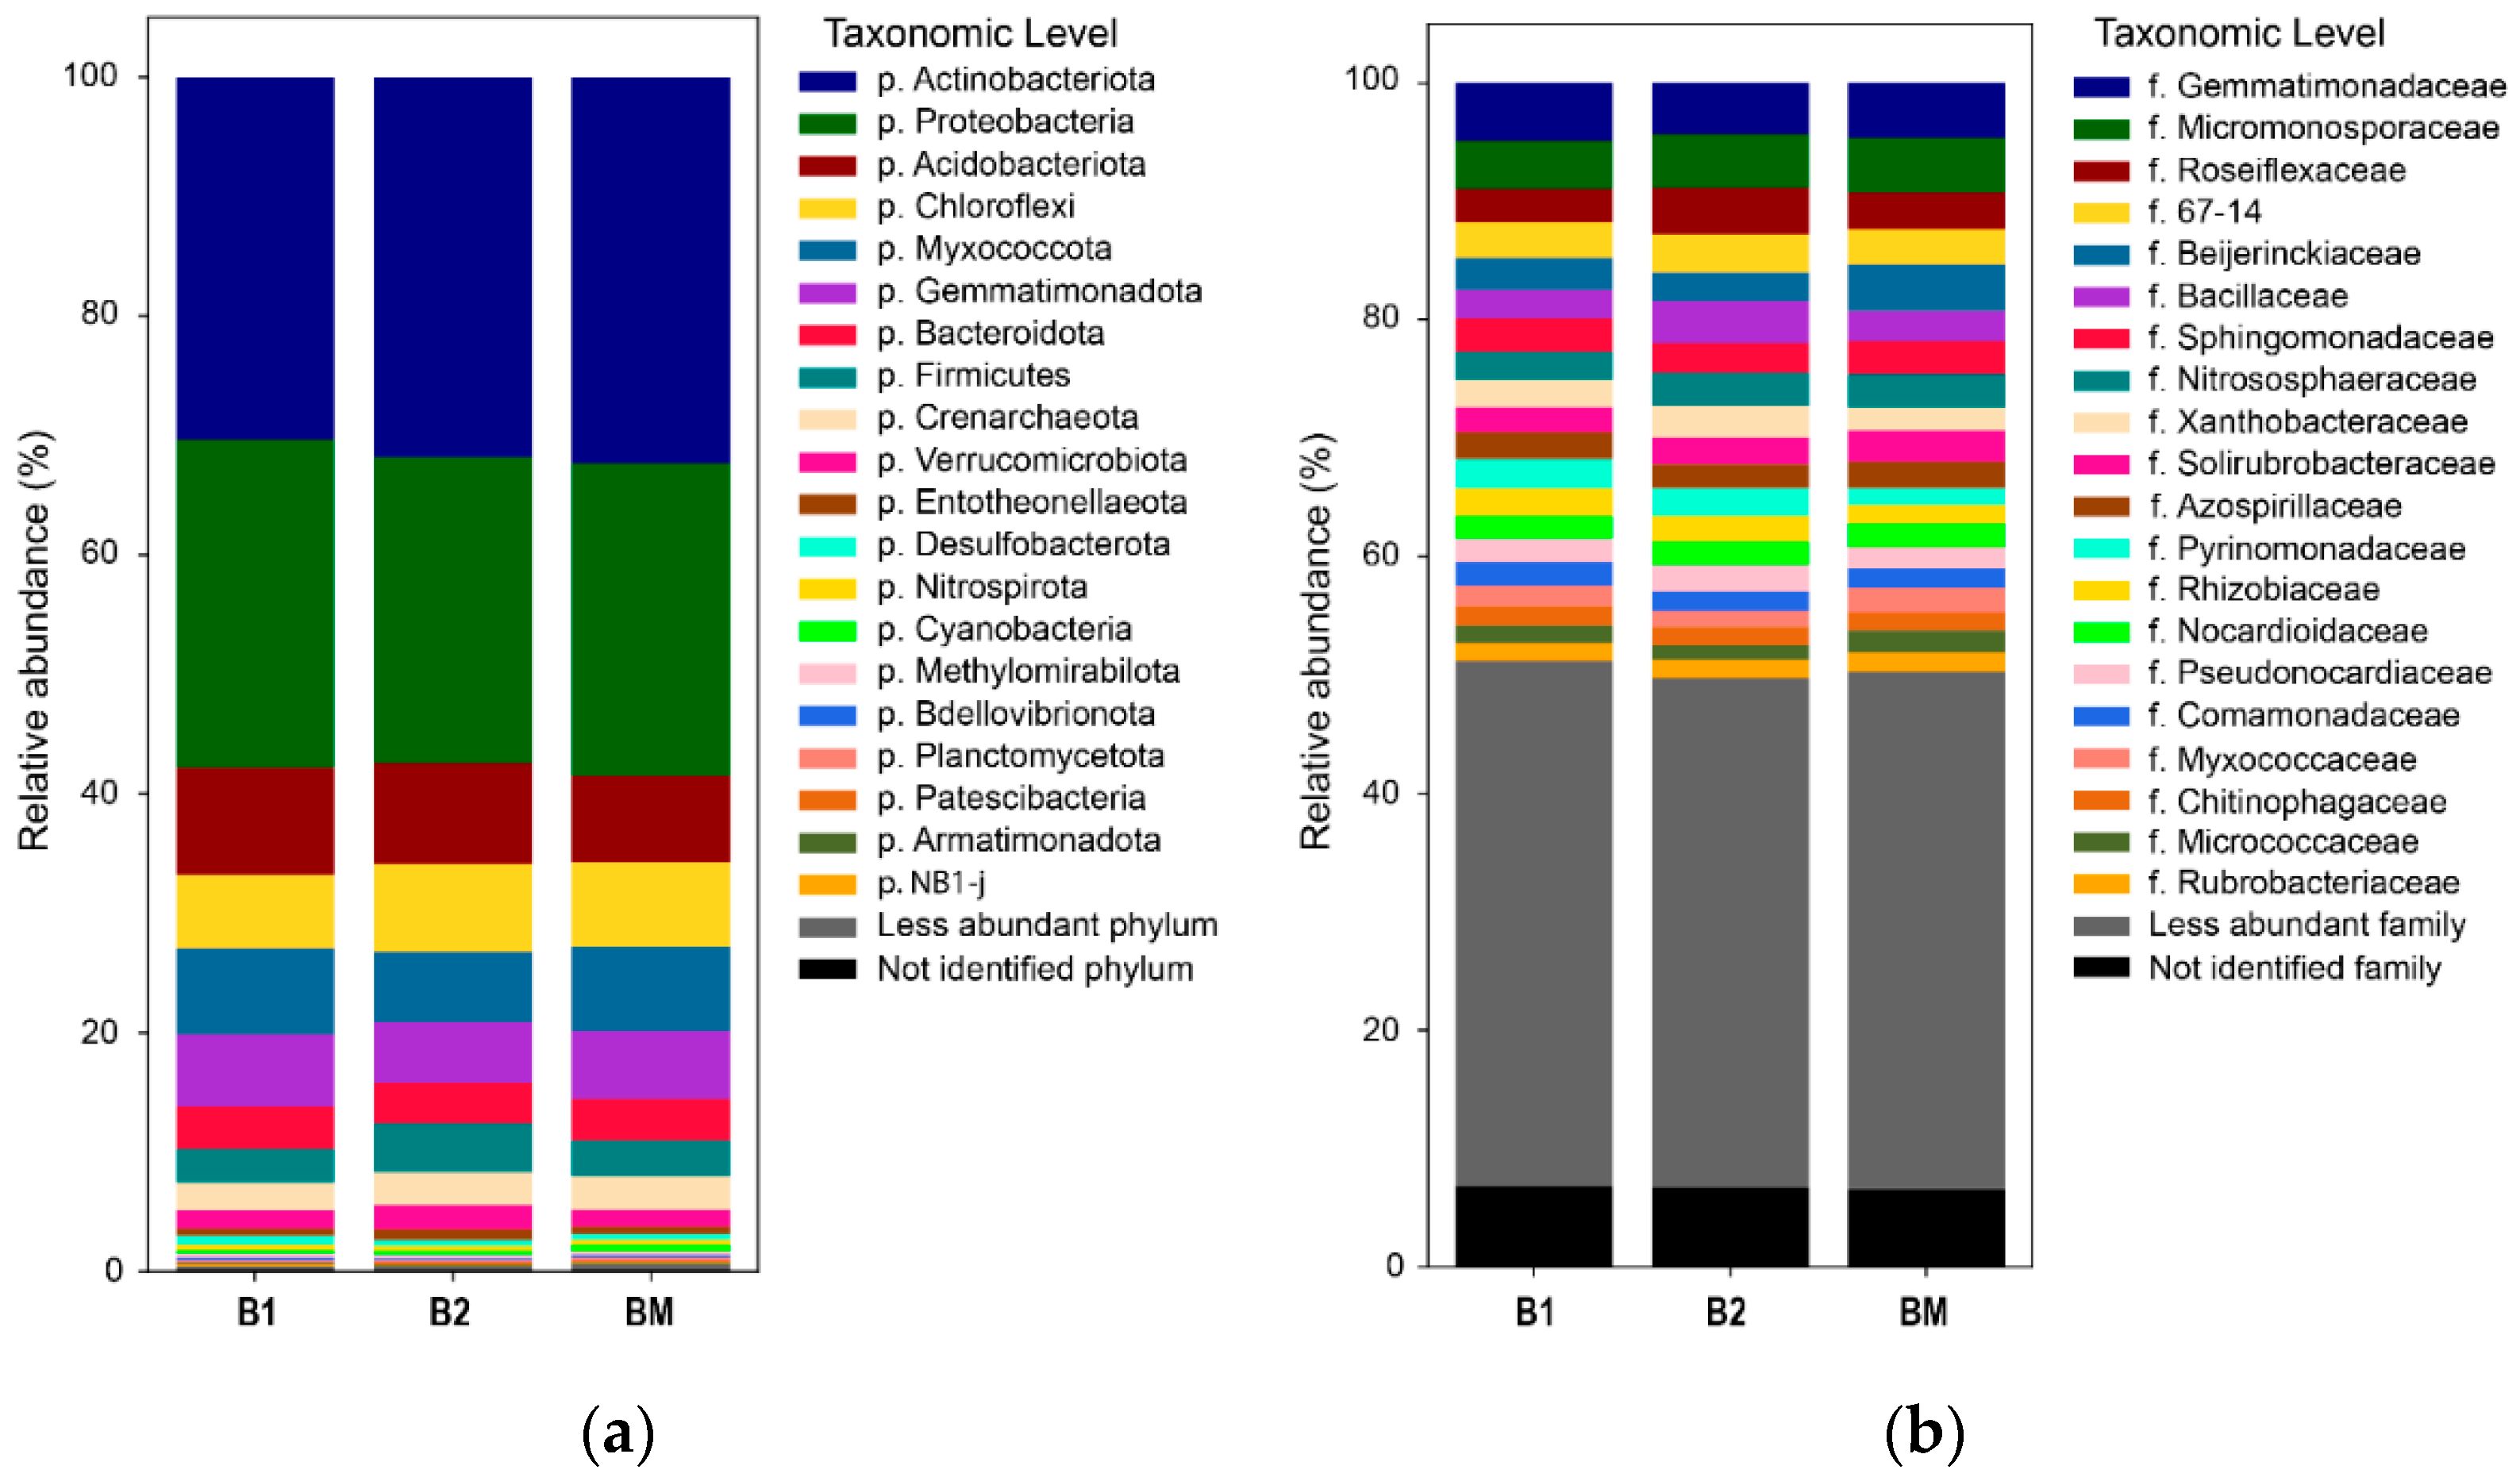
3.5. Bacterial Community Structure and Composition: Abundance and Diversity

We analyzed the influence of B. brizantha as a service crop on the common bean rhizosphere bacterial community using Illumina sequencing. The sequencing run produced a total of 1,546,670 raw reads across nine input libraries. After the quality filtering step, a total of 722,422 sequences were retained, and ranged from 65,603 to 97,005, with an average of 80,269 (Table S2). Regarding bacterial diversity, the Kruskal–Wallis test did not show significant differences between treatments in the following measures: Shannon diversity (H = 4.3556, p = 0.1133), Pielou´s evenness (H = 3.4667, p = 0.1767), observed features (H = 2.4889, p = 0.2881), nor Faith´s phylogenetic diversity (H = 3.2889, p = 0.1931) (Figure 5).
These results indicated that no obvious difference in alpha diversity was noted in the common bean rhizobiome with or without service crop treatments. However, visual observation of the boxplot shows that most alpha diversity parameters between the B1 and B2 treatments tended to be similar among them, but lower than the BM.
The beta diversity of the bacterial community in the common bean rhizosphere was tested using PERMANOVA on an Aitchison distance matrix constructed based on raw ASV count, and it showed significant differences among the treatments (p value = 0.004, F = 1.8648, r2 = 0.3833), which explained 39.23% of the observed variation. Bacterial communities were also visualized in a PCA (Figure 6). Three replicates usually clustered closely, underscoring the reproducibility of the bacterial community profiles. Rhizosphere soil samples from the service crop treatments (B1 and B2) were clearly separated from the common bean monoculture without service crop treatment (BM) by principal component 1 (PC1), which represented 22.31% of the total variation (Figure 6). The rhizosphere-associated bacterial microbiota of B1 and B2 were more homogeneous to each other according to PC1 (22.31%), but were clearly separated by PC2, which represented 16.92% of the total variation (Figure 6).
The composition of the bacterial communities at the phylum level was similar among the different treatments. Based on the analysis of the top 20 most abundant bacterial phyla, the dominant phyla in the common bean rhizosphere included Actinobacteria (30.34~32.36%) and Proteobacteria (25.60~27.48%), followed by Acidobacteriota (7.28~9.02%), Chloroflexi (6.12~7.35%), Myxococcota (5.89~7.21%), and other less abundant phyla (Figure 7a, Table S3). The common bean bacterial rhizobiomes under treatments with B. brizantha showed slight but higher relative abundances of Acidobacteriota and Verrumicrobiota when compared to the BM (Figure 7a, Table S3). In particular, in the B1, relative abundances of Proteobacteria and Acidobacteriota were 1.36% and 1.74% higher than the BM, respectively (Table S3). In the B2, the relative abundances of Acidobacteriota, Firmicutes, Verrumicrobiota and Entotheonellaeota were 1.17%, 1.09%, 0.59% and 0.3% higher than the BM, respectively (Table S3).
At the family level, the results were also similar among treatments, and showed the same representative groups with similar abundances. Gemmatimonadaceae and Micromonosporaceae were the most abundant families, with over 4% relative abundance in the three treatments (Figure 7b; Table S4). In particular, the relative abundance of Pyrinomonadaceae in the B1 and B2 were 1.1% and 0.95% higher than the BM, respectively. The Rhizobiaceae in the B1 and B2 were 0.7% and 0.58% higher than the BM, respectively. The relative abundances of Xanthobacteraceae were also higher in the B1 (0.35%) and B2 (0.67%) than in the BM (Figure 7b; Table S4).
At the genus level, higher abundances of Bacillus, RB41, Allorhizobium-Neorhizobium-Pararhizobium-Rhizobium, Unknown Nitrososphaeraceae, Streptomyces, Unknown Vicinamibacteraceae, and Bradyrhizobium were observed in the treatments with B. brizantha when compared to the BM (Figure S1; Table S5). The BM showed higher abundances of Microvirga and Sphingomonas.
The number and distribution of ASVs among the different service crop treatments are shown in the UpSet plots (Figure 8). When comparing B1 vs BM, the results showed that the number of ASVs shared between B1 vs BM represented 46% of all ASVs (1561/3382 ASV), while the BM presented 30% (999) of the unique ASV and the B1 presented 24% (822) (Figure 8a). In the same trend, the comparison between B2 vs BM showed that the number of ASV shared among B2 vs BM represented 45% (1508) of the total ASVs (3363), while the BM presented 31% (1052) of unique ASVs, and the B2 presented 24% (803) (Figure 8b).

3.6. Predicted Functions of the Bacterial Community

The FAPROTAX analysis was performed to predict the functions of the rhizosphere soil bacterial community (Figure S2). In the current database, the FAPROTAX database comprises 8312 members belonging to 92 groups. In this study, a total of 42 functional groups were obtained, and the top two dominant functional groups were chemoheterotrophy and aerobic chemoheterotrophy, with a relative abundance range of 86.76–88.01% and 84.62–85.93%, respectively (Figure S2). Other functional groups included fermentation (8.62–9.90%), nitrate reduction (7–7.36%), aerobic ammonia oxidation (4.21–5.79%), and nitrification (4.21–5.79%), among others. In particular, treatments with B. brizantha tended to increase functional groups related to chemoheterotrophy, aerobic chemoheterotrophy, and photoheterotrophy. Treatment B1 tended to also increase nitrate respiration and nitrogen respiration when compared to the BM. Moreover, both Brachiaria treatments tended to have lower values of nitrification and aerobic ammonia oxidation when compared to the bean monoculture. In general, the rest of the functional groups did not show a clear patron between B. brizantha treatments, with some functions being increased in the B1, but not in the B2, and vice versa, when compared to the bean monoculture.

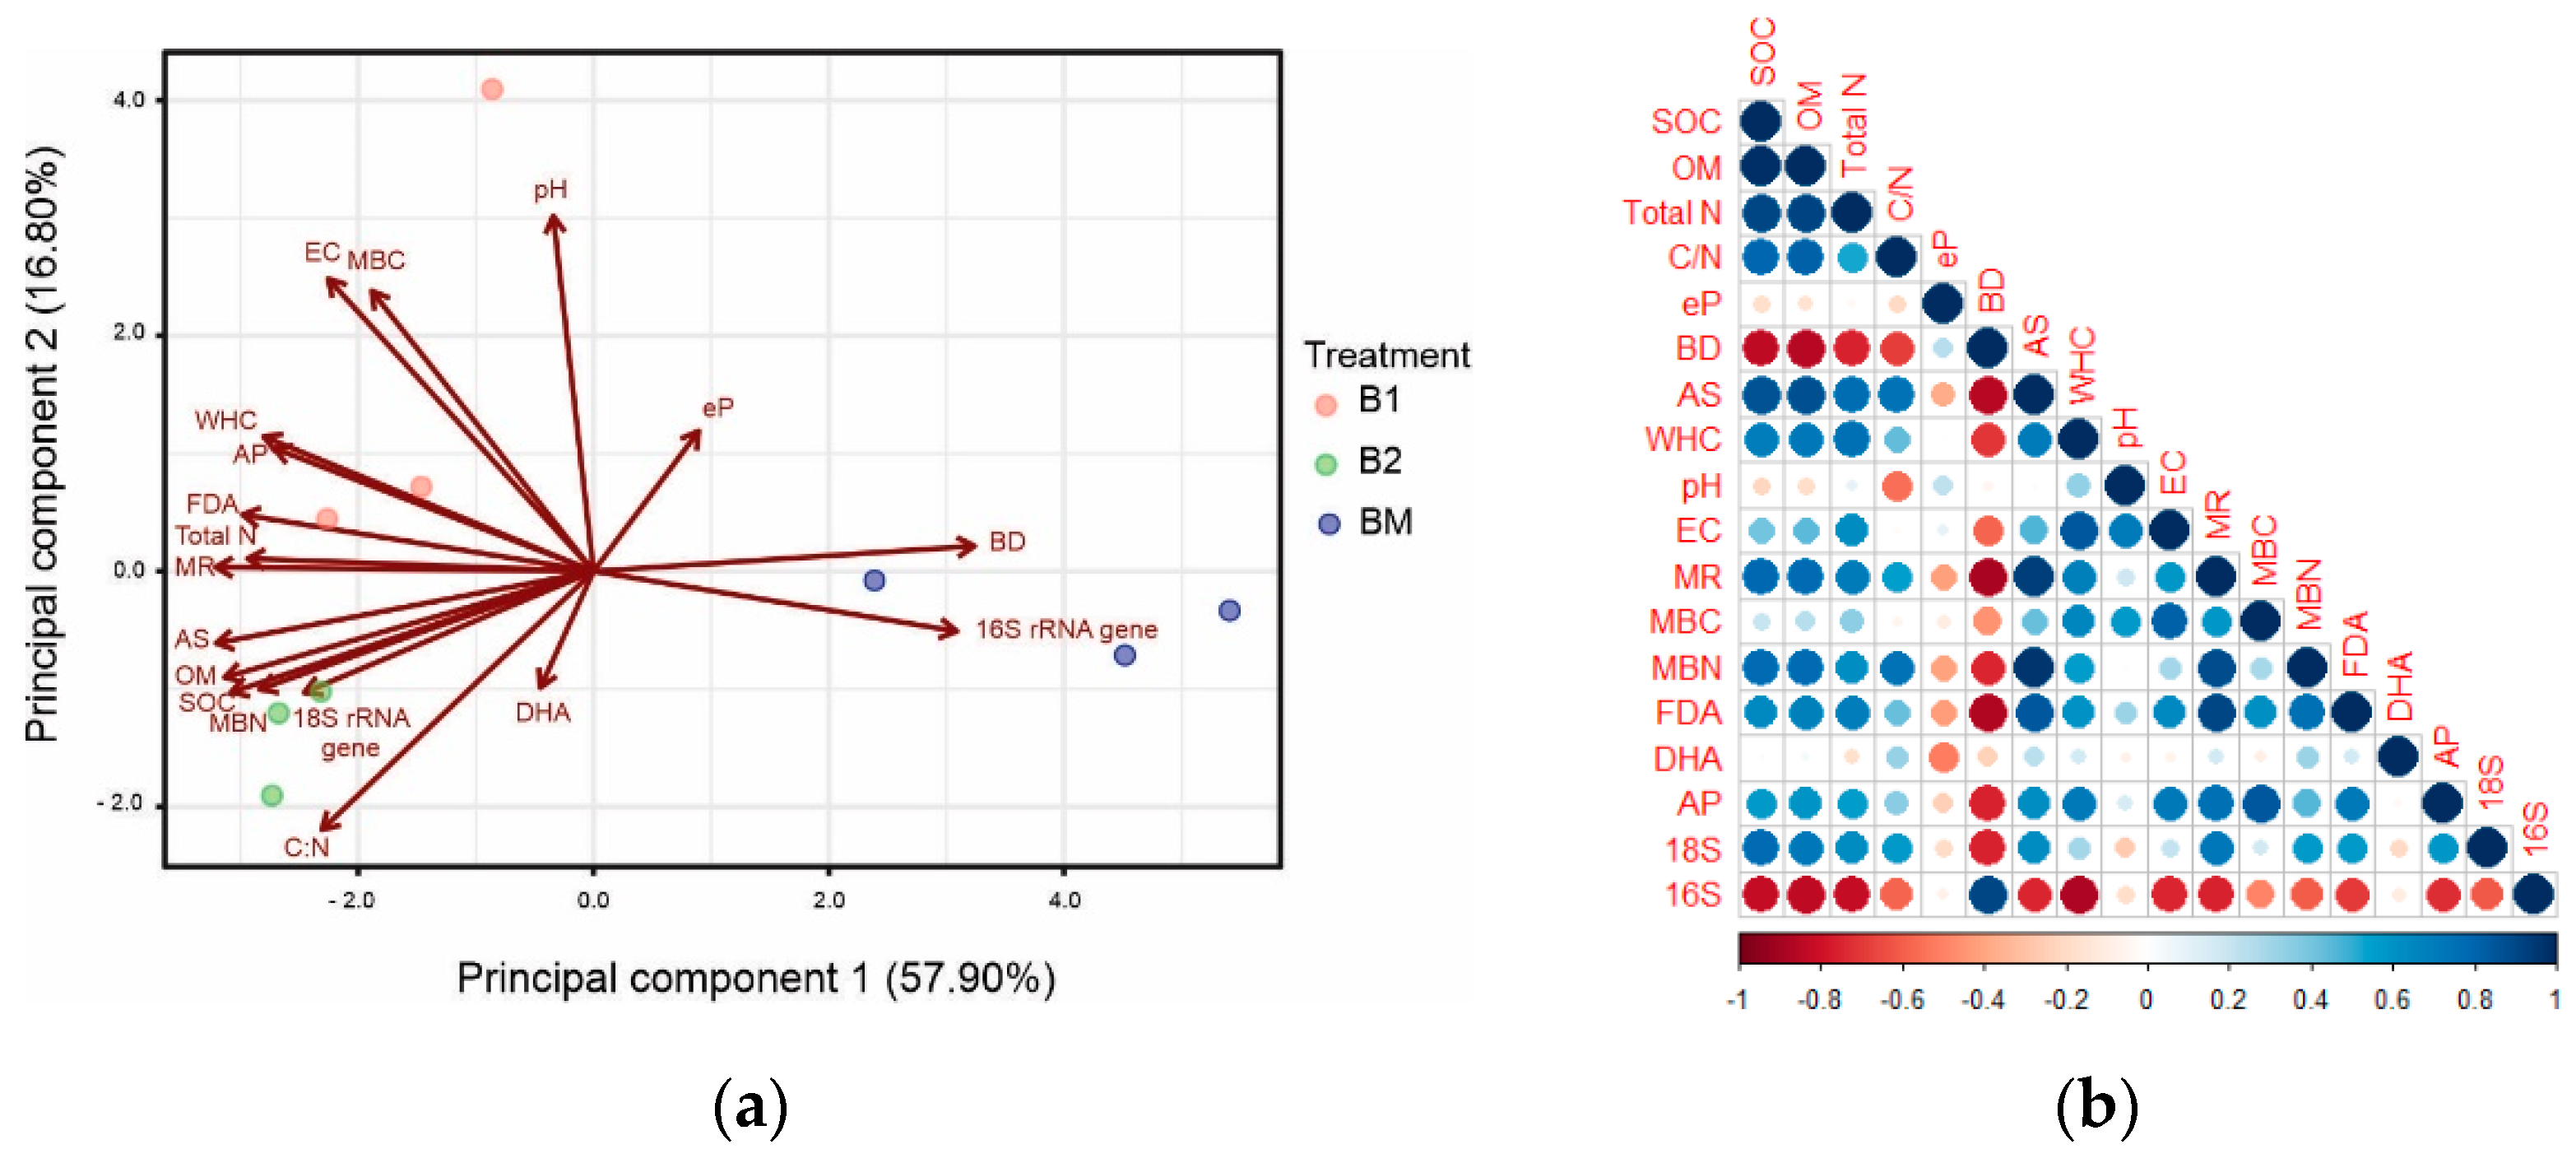
3.7. Variation in Rhizosphere Soil Properties under Different Service Crop Treatments

The PCA revealed a clear distinction between the service crops (B1 and B2) and the common bean monoculture (BM) (Figure 9a). PCA explained 74.7% of the total variance (PC1 and PC2 explained about 57.90% and 16.80%, respectively). Based on the PC1, the B1 and B2 treatments showed a clear differentiation from the common bean monoculture. Most chemical (SOC, OM, Total N, C:N), physical (AS, EC, pH, WHC), and biological (MBC, AP, FDA, MR, MBN, 18S rRNA gene) variables influenced the separation between B1 and B2 treatments from the BM. In contrast, the common bean monoculture was associated with BD and 16S rRNA gene. The PCA2 separated treatment B2 from treatment B1, with B1 being allocated more positively than B2. The PCA showed clear relationships between variables, which were tested through a correlation analysis (Figure 9b). A significant positive correlation (p ≤ 0.01) between the MR, MBC, MBN, FDA, AP, and 18S rRNA gene with SOC, OM, Total N, and AS was observed, while BD presented significant negative correlations (p ≥ 0.01) with these chemical and biological parameters. In addition, the 16S rRNA gene (determined by qPCR) presented a significant negative correlation with most of the variables used in this study (Figure 9b).

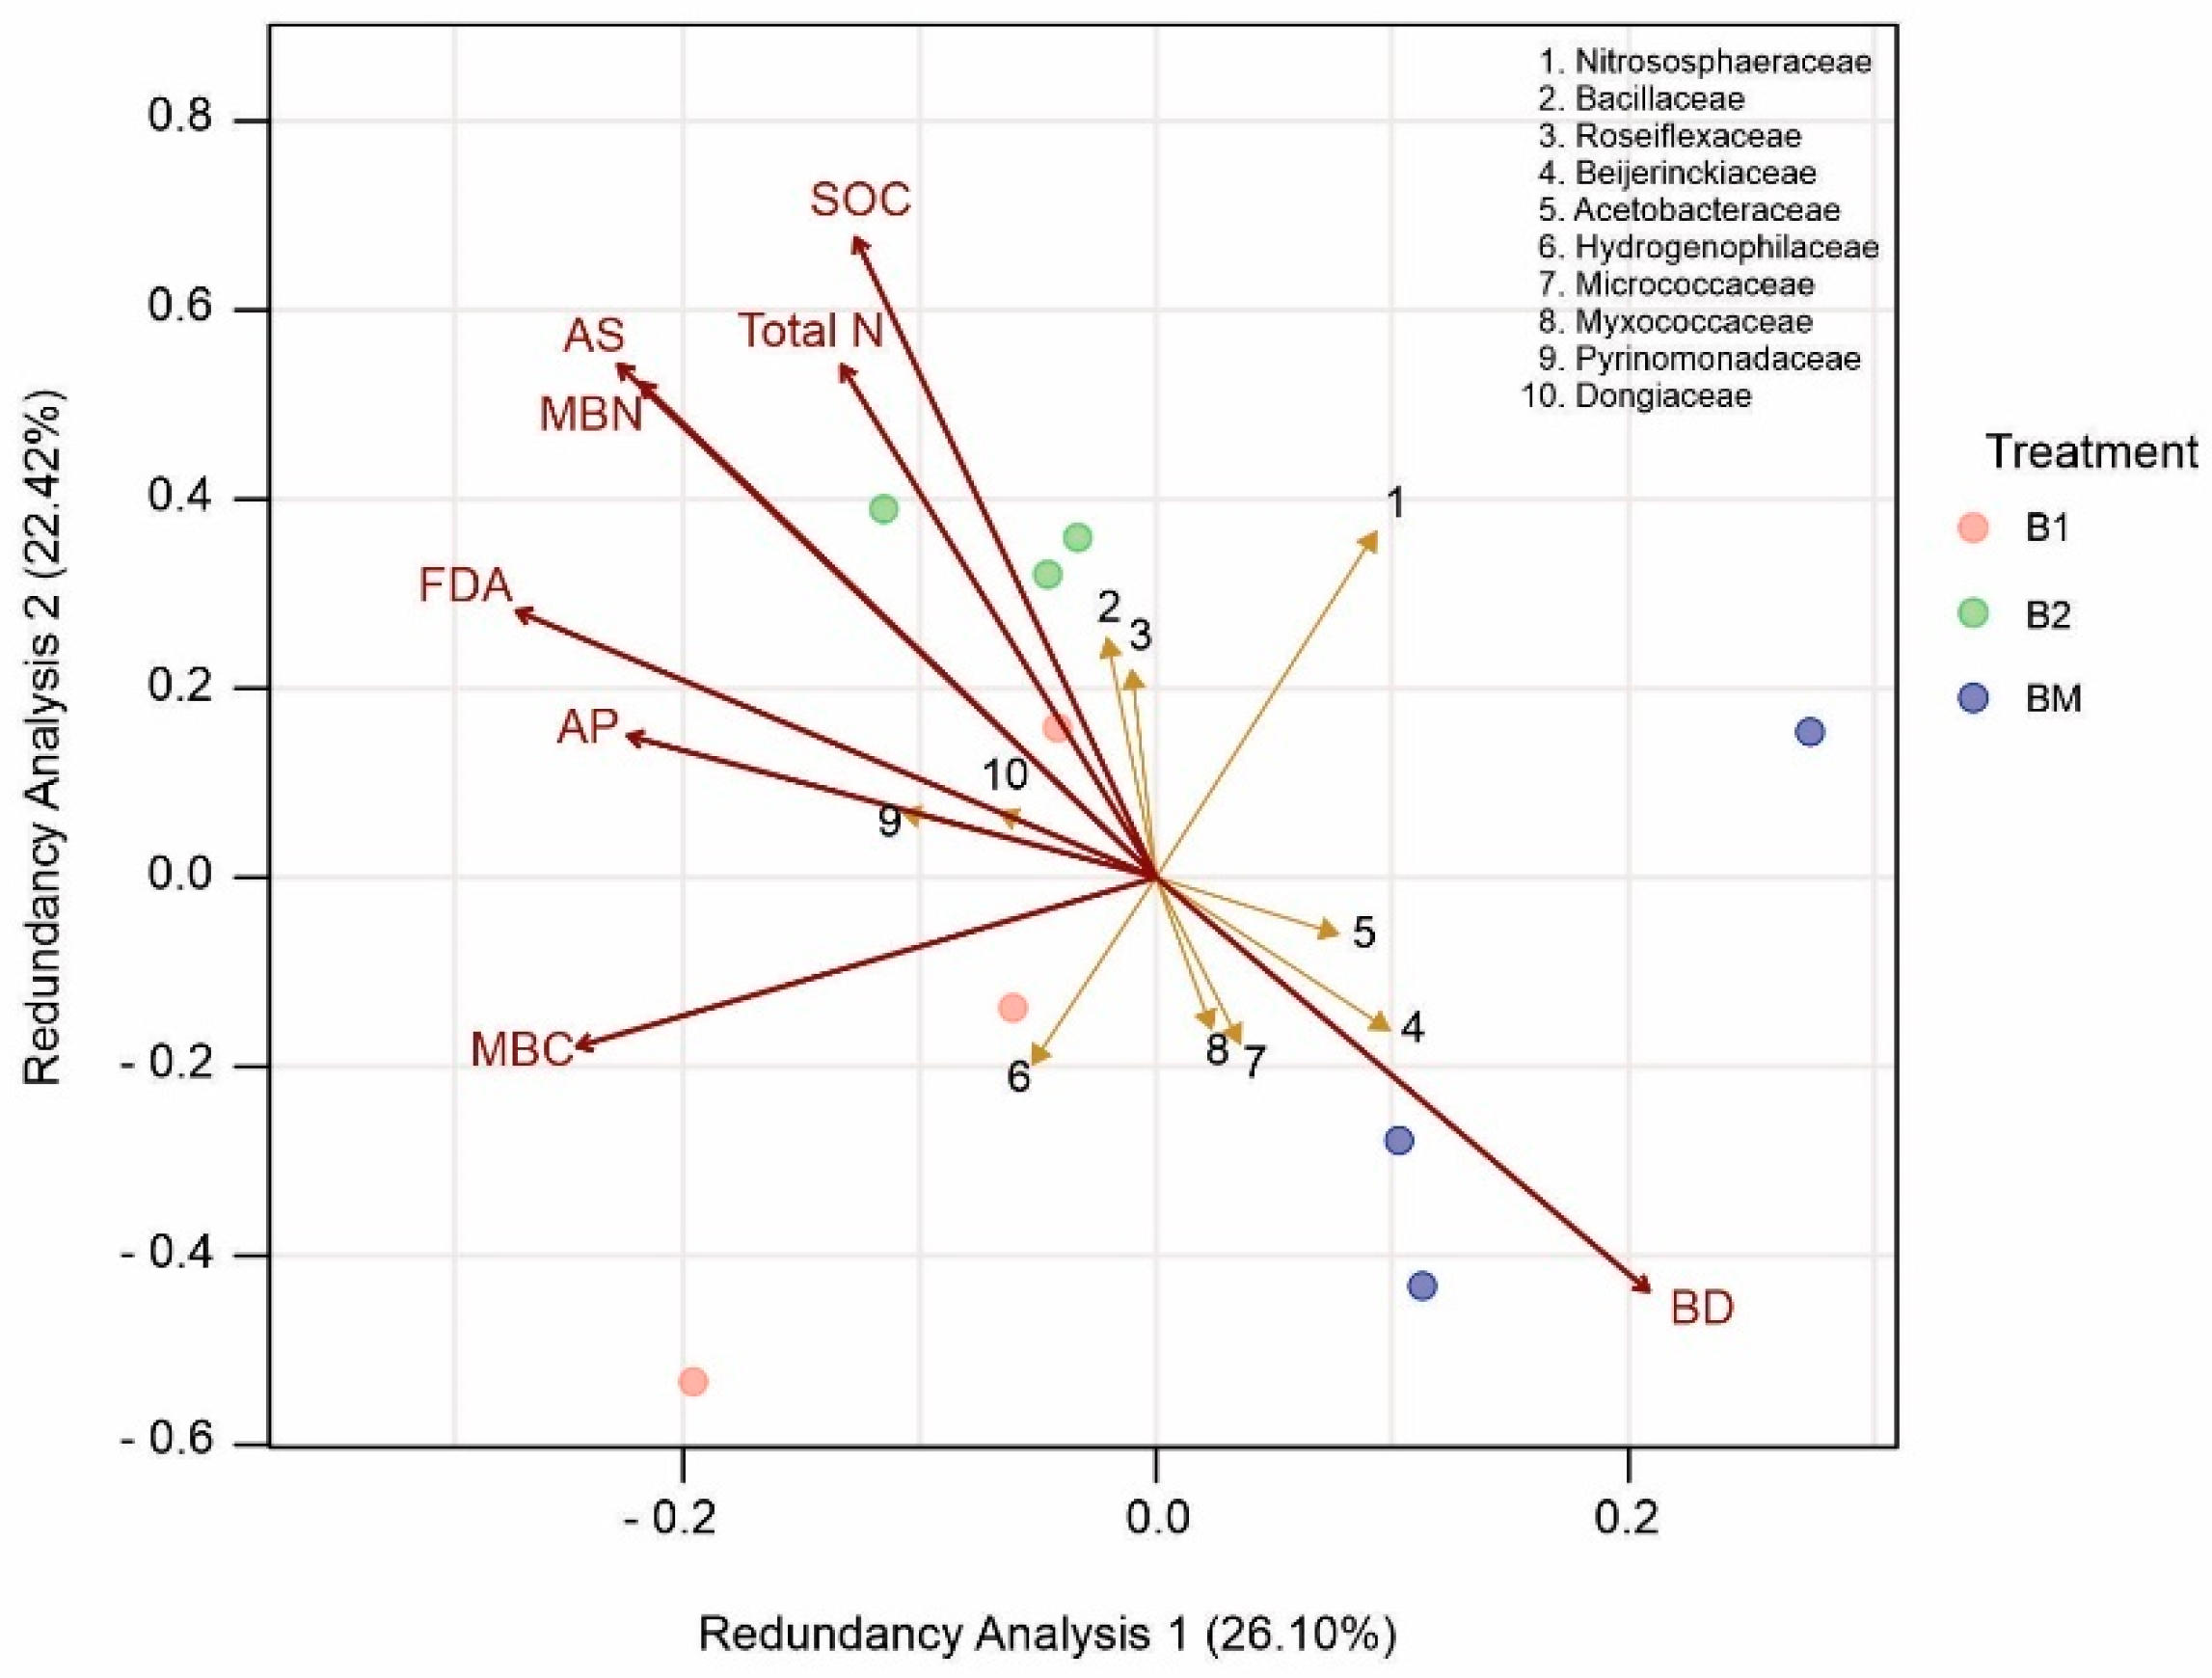
3.8. Relationships among Rhizosphere Soil Properties and Bacterial Communities

The redundancy analysis (RDA) was used to explore the relationship among rhizosphere soil bacterial communities at the family level with eight explanatory soil variables (Figure 10). The RDA explained 48.52% (RDA1 and RDA2 explained about 26.10% and 22.42%, respectively) of total variance, and revealed a clear distinction between service crops treatments (B1 and B2) and the common bean monoculture (BM) (Figure 10). The RDA confirmed that service crop treatments B1 and B2 were positively associated with most chemical (SOC, Total N), physical (AS), and biological (MBC, MBN, AP, FDA) properties, and these were associated with Bacillaceae, Roseiflexaceae, Pyrinomonadaceae, Dongiaceae, and Hydrogenophilaceae. In contrast, the common bean monoculture was separated from most soil parameters, except BD, and the bacterial families associated with the BM were Beijerinckiaceae, Acetobacteraceae, Micrococcaceae, and Myxococcaceae. The second axis RDA2 showed that B2 was separated from B1 and BM, but B1 was not clearly separated from BM.

4. Discussion

4.1. Effects of B. brizantha on Rhizosphere Soil Chemical and Physical Properties

Several changes occurred to the chemical and physical rhizosphere soil properties after 10 years of integrating B. brizantha as aservice crop during fallow periods into degraded soil from continuous common bean monocultures. The SOC and OM content increased significantly with the service crops, but in particular after two cycles of B. brizantha (B2), the SOC and OM increased in the common bean rhizosphere by nearly 50% more than in the B1. In agreement with shorter-term previous studies, the same difference in SOC between B1 and B2 was observed in the same field trial after six years of service crops [19], which suggests that the same tendency was maintained over time, and longer periods of inputs of root biomass and crop residues might have enhanced the microbial activity transforming residues to stable soil carbon [59]. Furthermore, the higher abundance of bacterial and fungal communities by qPCR and the high levels of MBC and MBN in the service crop treatments are indicative of higher microbial biomass residues, which are a significant source of SOM [60]. Recent studies have demonstrated that microbial residues account for the chemistry, stability, and abundance of SOM [60,61], which hence contribute to the long-term viability of agricultural lands, in particular for carbon dynamics [62].
Interestingly, when comparing the SOC stocks at the beginning of the field trial reported in our previous study [19], the SOC content in B1 (B12010 = 0.90) increased by 38% after 10 years (B12019 = 1.24; Table 1). Moreover, in B2, the SOC content (B22010 = 0.94) increased by 51% after 10 years (B12019 = 1.24; Table 1). The SOC of the common bean monoculture (BM2010 = 0.86) also increased, and was 15% higher after 10 years (BM2019 = 0.99; Table 1), which was probably due to the fact that the monoculture treatment was carried out with no-till, and originally the soil where the field trial was performed had a history of monoculture with intensive tillage. The carbon of the monoculture also increased slightly after ten years, and accumulated carbon at much lower rates, which indicates that this effect was probably due to the increase of carbon stocks by itself, even without cover crops or other agricultural practices [14]. Another explanation would be that the substitution of natural successional vegetation by monocultures would thus lead to lower net carbon releases than Brachiaria treatments, unless this vegetation was managed in a very short fallow rotation. In fact, it is known that natural fallowing could also provide a substantial increase in C and N stocks for several decades. Regarding the Total N, the inclusion of B. brizantha had a positive effect, even when considering that it is a fodder plant with a high nitrogen demand [3]. Therefore, B. brizantha would be a suitable service crop to maintain and increase the nitrogen content in fields with soil degradation in a subtropical region, and would also contribute to establishing the conditions for N2 fixation by the common bean. In agreement with previous studies [3,19], the inclusion of B. brizantha did not negatively impact the content of eP, despite the high demand for phosphorus in the tropical forage of B. brizantha [63,64].
An important indicator of land degradation is soil aggregate stability that conditions soil fertility [65]. Previous studies have reported the interrelationships among soil biota, microbial communities, microbial biomass, organic matter, carbon stocks, and soil aggregate stability [66,67,68]. In this study, the inclusion of B. brizantha had a strong effect on AS; for example, B1 increased AS by 144% compared to BM, while B2 increased AS by 239% after ten years. Furthermore, in both service crop treatments, lower values of bulk density were observed compared to the monoculture. The PCA analysis revealed that the BD was strongly associated with the common bean monoculture, while the AS was positively correlated with the Brachiaria treatments [19]. These results are in line with expectations that service crops improve soil aggregation, due to slower aggregate turnover caused by less physical soil disturbance, which is consistent with the higher AS values obtained in treatments with Brachiaria. Service crops included during fallow periods provide a continuous addition of root biomass, root exudates, and crop residues that are returned to the soil, to increase organic matter and nutrient cycling, which in turn contributes to soil aggregate stability and C sequestration [69,70]. Therefore, the presence of B. brizantha as a diversified crop benefits the storage of C and N in the soil by increasing the stability of the soil aggregates. In this sense, microorganisms have a crucial role in the stabilization of soil aggregates by the precipitation of extracellular polysaccharides and the creation of hemic materials that lead to polyvalent metal–organic matter complexes [71,72]. Therefore, using high-residue inputs to maintain and enhance C sequestration is vital to mitigate soil degradation [73,74].

4.2. Effects of B. brizantha on Soil Microbial Activity

In response to the inclusion of cover crops residues, the rhizosphere soil microbial enzymatic activities (FDA and AP) significantly increased after 10 years in comparison to the common bean mono-cropping, except for DHA activity, as previously reported [3,19]. The AP activity was significantly higher in B2 than in B1, which suggests that two continuous cycles of B. brizantha were metabolically more active than the common bean monoculture, and made a greater amount of phosphate compounds available for the subsequent crop [19,20]. The FDA hydrolysis has been reported as a great indicator of total microbial activity, since FDA serves as a substrate for different classes of enzymes, such as lipases, proteases, and esterases [75]. In addition, a positive correlation was observed between FDA hydrolysis and SOM and Total N, which suggested that the increased substrate availability was crucial to maximize the efficiency of soil nutrient cycling by the microbial activity. This is in agreement with previous studies conducted by our work group that showed that service crops primarily impact microbial functions [3,20,76]. In fact, bare fallow as observed in soil under mono-cropping results in a distinct agroecosystem with a lower microbial C assimilation efficiency and a higher number of negative interactions between soil microbial biomass and bacterial taxa, which impacts soil functions and, consequently, reduces the potential to support high crop yield. In agreement with our results, previous studies have reported that the profile of soil enzymatic activities adapted faster to the change in agricultural practices than the prokaryotic community structure [77].
Microbial biomass carbon and nitrogen, together with microbial respiration, have been used for soil monitoring [78]. In this research, the MBC, MBN, and MR increased significantly with the inclusion of B. brizantha during fallow periods, which was probably due to a more continuous C input into the system when compared to the monoculture without a service crop. The decomposition of crop residues and root exudates provides abundant and readily accessible substrates for microbial growth. Previous studies have shown that microbial communities rapidly respond to C sequestration and N mineralization by modifying microbial biomass and enhancing soil microbial activity [79]. These results suggest that the inclusion of B. brizantha led to an improved microbiological habitat and may have large impacts on ecosystemic dynamics.

4.3. Effects of B. brizantha on Bacterial Community Structure, Abundance, and Diversity

To our knowledge, our study is the first field-based experiment to evaluate the effects of B. brizantha as a service crop during fallow periods for 10 consecutive years on the bacterial rhizobiome of the subsequent crop (Phaseolus vulgaris L.). In general, the most abundant bacterial communities across all our samples were Actinobacteria and Proteobacteria, which represented >58% of the sequences. Previous studies have reported these dominant phyla in the common bean [80], lima bean [81] and in other leguminous plants, such as soybean [82]. Actinobacteria and Proteobacteria play major roles in the cycling of organic matter and nutrient cycling, which may respond to more organic matter input after the inclusion of service crops. The phylum Actinobacteria comprises important plant-associated spore-forming bacteria, and their interactions with plants include roles in biocontrol and growth promotion. Some members of the phylum Proteobacteria are plant growth-promoting rhizobacteria that cooperate with plants and enhance plant nutrition, stress tolerance, or health. Taken together, these results reveal that the benefits of introducing B. brizantha as a service crop during fallow periods include an increased abundance of bacterial groups that may contribute to plant growth promotion. Thus, these processes could potentially contribute to increasing crop yield [83]. In addition, a relatively high abundance of Acidobacteriota, Chloroflexi, Myxococcota, Gemmatimonadota and Bacteroidota was also observed, which are dominant phyla typically found in soils around the world [84]. Other phyla commonly observed in soils were also encountered in this study, such as Firmicutes, Crenarchaeota and Verrucomicrobiota. Unlike the common bean monoculture without service crops, the abundance of Acidobacteriota and Verrumicrobiota was increased in the treatments with B. brizantha, which was probably due to the higher levels of SOC, SOM, and Total N present in these treatments, which suggests that B. brizantha residue inputs favored the selection of different phyla involved in N fixation and C cycling. Likewise, previous studies have reported high levels of Acidobacteria and Verrumicrobia in treatments with cover crops in comparison with bare fallows [85]. Members of the phylum Acidobacteria and Proteobacteria were the most distributed in all soil layers, and several analyses have revealed that these bacterial groups can be a good biological indicator of land-use change [85], since these phyla are related to the modulation of critical biogeochemical cycles, plant growth promotion, SOM decomposition, and denitrification, which thus enhance carbon stability [86,87,88]. In fact, our results show a positive shift in the levels of Acidobacteria from common bean mono-cropping to Brachiaria treatments. The results also highlight that, during land-use change, these bacterial groups can adapt together in soil to share ecological niches, and can further play an essential role in changes in soil environmental factors, including soil physicochemical properties. Interestingly, the genera RB41 increased in both treatments with B. brizantha compared to the common bean monoculture. Previous studies have suggested that RB41 could be a possible microbial indicator taxon of conventional tillage systems [77]. However, in our study, all treatments were performed under no-tillage practices, which suggests that RB41 might not be responder OTUs to no-till or tillage in our site of study. Further research increasing the number of samples and analyzing different climate zones would be required to confirm this suggestion. The inclusion of B. brizantha also increased other beneficial bacterial communities at genera levels, such as Allorhizobium-Neorhizobium-Pararhizobium-Rhizobium, Nitrososphaeraceae, Streptomyces, Bacillus, and Bradyrhizobium, some of which are potential plant growth promotion bacteria, N2 fixers, and key players in ammonia oxidation [89].
Analysis of the bacterial rhizobiome revealed that the community did not significantly change with respect to richness, alpha diversity, and evenness among all treatments. It is well known that plant species and soil type shape the diversity and composition of the microbial communities in rhizosphere soil through root exudates [31,90]. Taking into account that all rhizosphere samples in this study were taken from the same plant species (Phaseolus vulgaris L.), the crop presence was likely one of the main driving factors behind the observed bacterial rhizobiome, and probably resulted in a similar microbiota diversity among all samples. Even so, we have observed small shifts at all taxonomic levels that show the influence of the incorporation of service crops, although they were not enough to produce significant differences in the analysis of alpha diversity indices. Previous studies have suggested that, in rhizocompartments, the microbial community diversity is lower compared to the bulk soil, due to the recruitment of specific microorganisms by root exudates [91,92], which confirms that the host plant was the most important driver behind the assembly of root-associated communities. Furthermore, the loosely bound soil sampled in this study may have had a role in minimizing the detectable impacts of the service crop treatments’ plant-driven effects, which are more evident in the tightly-bound rhizosphere [93]. However, loosely bound communities tend to be more stable than those tightly bound to the roots [94], and are more robust to change. Further research is needed in order to confirm the distribution pattern.
The beta diversity analysis through the principal component analysis showed that the bacterial rhizobiome of the three treatments was significantly different from each other with good separation between treatments, which suggests that different service crop rotations might be a good method for manipulating the rhizosphere microbiome [95]. A core microbiome was established between the B. brizantha treatments and the common bean monoculture, and this was constituted by Actinobacteria, Bacteroidetes, and Proteobacteria, which were abundant in all samples as previously observed in other species [96,97]. Nevertheless, there was a high percentage of ASVs shared among B1 and B2 with the bean monoculture, which suggests a greater homogeneity of soil bacterial taxa among distant locations. Nevertheless, unique ASVs were observed for each treatment, and although they were found in low abundance, they represented nearly 20% of the different sequences. We assume that, through the inclusion of B. brizantha during the fallow periods in our mid-term experiment, root-derived C was enough to increase microbial biomass and microbial activity, but not community diversity in the soil loosely adhered to the roots. Further studies including rhizosphere soil (attached soil to the roots) and bulk soil are needed to better understand the mechanisms that determine the bacterial structure in the subsequent crop, which will allow for the targeted manipulation of plant/microbe interactions to establish and optimize beneficial plant–microbe associations.
Previous research has shown that relative abundances do not necessarily follow the same pattern as the estimated quantitative abundance [98]. The quantification approach with real-time quantitative PCR (qPCR) provides complementary information that helps to better understand the microbial communities in environmental samples [98,99]. In this study, the absolute gene copy numbers of fungi (18S rRNA) increased significantly in service crop treatments compared to the bean monoculture, while gene copy numbers of bacterial (16S rRNA) significantly decreased compared to the bean monoculture, which resulted in a high F/B ratio [43], which is commonly associated with an improvement in soil health [100]. In agricultural practices with shifts toward a fungal dominance in the microbial community, the conversion rate of nutrients and energy is relatively slow, which is conducive to enhancing soil carbon and nitrogen sequestration [101,102], which results in more sustainable agroecosystems with low impacts on the environment. It is likely that the higher plant species diversity in the service crops treatments caused a higher F:B ratio of the microbial community, due to ecological complementarity effects, such as a higher and more diverse supply of resources for microorganisms than in common bean monocropping. In a previous 6 year study of our research group, the effect of the inclusion of B. brizantha did not show significant differences in both fungal and bacterial communities abundance values, although a tendency in the monoculture treatment to decrease fungal biomass and to increase bacterial biomass was informed, which suggested that bacteria were more resistant than fungus to changes in soil environment [3]. Other authors were also unable to differentiate different cover crop treatments with monocultures using real-time quantitative PCR (qPCR) in shorter-term field assays [103,104]. These results suggest that variations in absolute abundances might be reflected in longer-term field assays of degraded agricultural soils.

4.4. Predicted Functions of the Bacterial Community

The functional annotation of 16S rRNA genes using FAPROTAX analysis showed that the predicted functions related to chemoheterotrophy and aerobic chemoheterotrophy were increased in the B1 and B2 treatments compared to the bean monoculture. These functional groups were related to the soil carbon cycle process [105], and since B. brizantha increases the carbon input through crop residues and root exudates, it probably enriched microorganisms that increased nutrient availability to the cash crop through the microbial decomposition of soil organic matter [106,107,108]. In this study, changes in soil carbon pools may have been the main driving factor in soil bacterial functional structure when grasses were included in the crop rotation. Regarding functions related to the nitrogen cycle, we observed that nitrate reduction, nitrate respiration, and nitrogen respiration tended to be higher under one crop cycle of B. brizantha than in the monoculture. In addition, the functional groups related to nitrification and aerobic ammonia oxidation decayed under B. brizantha treatments compared to the common bean monoculture. Nitrification and ammonia oxidation are key processes in the global nitrogen cycle that result in losses of nitrogen by leaching and denitrification, which potentially originate several environmental and health problems [109,110]. Previous studies have reported that Brachiaria spp. pastures have the capacity to inhibit biological nitrification through a plant-controlled mechanism by which nitrification inhibitors are produced and delivered by roots to soil-nitrifier sites [111], thus conserving and using N more efficiently to result in low-nitrifying and low N2O-emitting agronomic production systems, which benefit both agriculture and the environment. In general, the rest of the functional groups did not show a clear pattern between B. brizantha treatments, with some functions being increased under B1, but not in B2, and vice versa, compared to the bean monoculture. Further studies are needed to confirm the variation in microbial functions through metagenomics and transcriptomics.

5. Conclusions

We conclude that the ten-year inclusion of the tropical grass B. brizantha as a service crop during the fallow period in a degraded monoculture system had a strong impact on the chemical, physical, and microbiological properties of the rhizosphere soil of the subsequent cash crop (common bean). However, in this study, the inclusion of B. brizantha affected beta but not alpha diversity, which suggests a probable adaptation of bacterial soil microbes to long-period agronomic management without compromising the alpha diversity values. Among Brachiaria treatments, we suggest the implementation of two consecutive cycles of B. brizantha, particularly in cases where soil is more degraded. Still, one crop cycle would also be a suitable management practice to restore and improve soil health in cases where the field producer is unable to perform two continuous crop cycles of B. brizantha in their fields. Service crops´ inclusion contributes to restoring soil health and constitutes an alternative for rehabilitating degraded agroecosystems in these specific conditions.

Supplementary Materials

The following supporting information can be downloaded at: https://www.mdpi.com/article/10.3390/su15010488/s1, Table S1. Primer sets used for qPCR and amplicon metagenomic sequencing used in this study. Table S2. Trimming summary showing the number of initial reads, reads that pass quality control, reads after denoising step, number of sequences after merging them by their 3’, and the resulting non-chimeric sequences. B1 = B. brizantha/common bean; B2 = B. brizantha/B. brizantha/common bean; BM = common bean monoculture. Table S3. Mean relative abundance of the 20 most abundant bacterial phyla in the three rhizospheric samples: B1 = B. brizantha/common bean; B2 = B. brizantha/B. brizantha/common bean; BM = common bean monoculture. Table S4. Mean relative abundance of the 20 most abundant bacterial families in the three rhizospheric samples: B1 = B. brizantha/common bean; B2 = B. brizantha/B. brizantha/common bean; BM = common bean monoculture. Table S5. Mean relative abundance of the 20 most abundant bacterial genera in the three rhizospheric samples: B1 = B. brizantha/common bean; B2 = B. brizantha/B. brizantha/common bean; BM = common bean monoculture. Figure S1. Average of relative abundance at genera taxonomic levels in the total bacterial community associated with the common bean rhizosphere under different service crop treatments: B1 = B. brizantha/common bean; B2 = B. brizantha/B. brizantha/common bean; BM = common bean monoculture (control). Relative abundances are based on the proportional frequencies of the ASV that could be classified at the genera levels, and are related to the total ASV identified in the samples. Figure S2. Functional groups of bacteria based on FAPROTAX database. B1 = B. brizantha/common bean; B2 = B. brizantha/B. brizantha/common bean; BM = common bean monoculture.

Author Contributions

Conceptualization, C.P.-B., S.V.-G. and C.L.A.; methodology, C.P.-B., C.L.A., A.D., J.H. and G.L.; software, C.L.A., G.L. and M.A.; formal analysis, C.L.A., C.P.-B. and G.L.; writing—original draft preparation, C.L.A. and C.P.-B.; writing—review and editing, C.P.-B., S.V.-G., C.L.A. and G.L.; project administration, C.P.-B. and S.V.-G.; funding acquisition, C.P.-B. and S.V.-G. All authors have read and agreed to the published version of the manuscript.

Funding

This research was funded by the National Institute of Agricultural Technology (INTA) (No. PD I 037), FONCyT—PICT 2019-00896 and the National Scientific and Technical Research Council (CONICET).

Institutional Review Board Statement

Not applicable.

Informed Consent Statement

Not applicable.

Data Availability Statement

The sequences obtained in this study were submitted to the sequence read archive under the accession code PRJNA890179.

Acknowledgments

We thank the members of the Soil, Water and Fertilizer Laboratory (LabSAF)—EEA INTA Salta, especially Marcos David Alvarez, for their help in soil sampling and processing. The authors gratefully acknowledge Laura Vale for her valuable contributions. The authors are thankful for the supercomputing infrastructure of Soroban (SATREPS MACH—JPM/JSA1705) at the Center of Modeling and Scientific Computing at University of the Frontier.

Conflicts of Interest

The authors declare no conflict of interest.

References

  1. Broughton, W.J.; Hernández, G.; Blair, M.; Beebe, S.; Gepts, P.; Vanderleyden, J. Beans (Phaseolus spp.)—Model Food Legumes. Plant Soil 2003, 252, 55–128. [Google Scholar] [CrossRef] [Green Version]
  2. Vargas Gil, S.; Pastor, S.; March, G.J. Quantitative Isolation of Biocontrol Agents Trichoderma Spp., Gliocladium spp. and Actinomycetes from Soil with Culture Media. Microbiol. Res. 2009, 164, 196–205. [Google Scholar] [CrossRef] [PubMed]
  3. Perez Brandan, C.; Chavarría, D.; Huidobro, J.; Meriles, J.M.; Perez Brandan, C.; Vargas Gil, S. Influence of a Tropical Grass (Brachiaria Brizantha Cv. Mulato) as Cover Crop on Soil Biochemical Properties in a Degraded Agricultural Soil. Eur. J. Soil Biol. 2017, 83, 84–90. [Google Scholar] [CrossRef]
  4. Pérez-Brandán, C.; Huidobro, J.; Grümberg, B.; Scandiani, M.M.; Luque, A.G.; Meriles, J.M.; Vargas-Gil, S. Soybean Fungal Soil-Borne Diseases: A Parameter for Measuring the Effect of Agricultural Intensification on Soil Health. Can. J. Microbiol. 2014, 60, 73–84. [Google Scholar] [CrossRef] [PubMed]
  5. Malézieux, E. Designing Cropping Systems from Nature. Agron. Sustain. Dev. 2012, 32, 15–29. [Google Scholar] [CrossRef] [Green Version]
  6. Pulleman, M.M.; de Boer, W.; Giller, K.E.; Kuyper, T.W. Soil Biodiversity and Nature-Mimicry in Agriculture; the Power of Metaphor? Outlook Agric. 2022, 51, 75–90. [Google Scholar] [CrossRef]
  7. Kaye, J.P.; Quemada, M. Using Cover Crops to Mitigate and Adapt to Climate Change. A Review. Agron. Sustain. Dev. 2017, 37, 4. [Google Scholar] [CrossRef] [Green Version]
  8. Sharma, P.; Singh, A.; Kahlon, C.S.; Brar, A.S.; Grover, K.K.; Dia, M.; Steiner, R.L. The Role of Cover Crops towards Sustainable Soil Health and Agriculture—A Review Paper. Am. J. Plant Sci. 2018, 9, 1935–1951. [Google Scholar] [CrossRef] [Green Version]
  9. Ogilvie, C.M.; Deen, W.; Martin, R.C. Service Crop Management to Maximize Crop Water Supply and Improve Agroecosystem Resilience: A Review. J. Soil Water Conserv. 2019, 74, 389–404. [Google Scholar] [CrossRef]
  10. Tiemann, L.K.; Grandy, A.S.; Atkinson, E.E.; Marin-Spiotta, E.; Mcdaniel, M.D. Crop Rotational Diversity Enhances Belowground Communities and Functions in an Agroecosystem. Ecol. Lett. 2015, 18, 761–771. [Google Scholar] [CrossRef]
  11. Steenwerth, K.; Belina, K.M. Cover Crops and Cultivation: Impacts on Soil N Dynamics and Microbiological Function in a Mediterranean Vineyard Agroecosystem. Appl. Soil Ecol. 2008, 40, 370–380. [Google Scholar] [CrossRef]
  12. Poeplau, C.; Don, A. Agriculture, Ecosystems and Environment Carbon Sequestration in Agricultural Soils via Cultivation of Cover Crops—A Meta-Analysis. Agric. Ecosyst. Environ. 2015, 200, 33–41. [Google Scholar] [CrossRef]
  13. Schipanski, M.E.; Barbercheck, M.; Douglas, M.R.; Finney, D.M.; Haider, K.; Kaye, J.P.; Kemanian, A.R.; Mortensen, D.A.; Ryan, M.R.; Tooker, J.; et al. A Framework for Evaluating Ecosystem Services Provided by Cover Crops in Agroecosystems. Agric. Syst. 2014, 125, 12–22. [Google Scholar] [CrossRef]
  14. Mazzoncini, M.; Sapkota, T.B.; Bàrberi, P.; Antichi, D.; Risaliti, R. Long-Term Effect of Tillage, Nitrogen Fertilization and Cover Crops on Soil Organic Carbon and Total Nitrogen Content. Soil Tillage Res. 2011, 114, 165–174. [Google Scholar] [CrossRef]
  15. Moukanni, N.; Brewer, K.M.; Gaudin, A.C.M.; O’Geen, A.T. Optimizing Carbon Sequestration Through Cover Cropping in Mediterranean Agroecosystems: Synthesis of Mechanisms and Implications for Management. Front. Agron. 2022, 4, 844166. [Google Scholar] [CrossRef]
  16. Chahal, I.; Vyn, R.J.; Mayers, D.; Van Eerd, L.L. Cumulative Impact of Cover Crops on Soil Carbon Sequestration and Profitability in a Temperate Humid Climate. Sci. Rep. 2020, 10, 13381. [Google Scholar] [CrossRef]
  17. Seitz, D.; Fischer, L.M.; Dechow, R.; Wiesmeier, M.; Don, A. The Potential of Cover Crops to Increase Soil Organic Carbon Storage in German Croplands. Plant Soil 2022. [Google Scholar] [CrossRef]
  18. Castiglioni, M.G.; Kraemer, F.B. Short-Term Effect of Cover Crops on Aggregate Stability Assessed by Two Techniques. Cienc. del Suelo 2019, 37, 298–314. [Google Scholar]
  19. Abán, C.L.; Verdenelli, R.; Gil, S.V.; Huidobro, D.J.; Meriles, J.M.; Brandan, C.P. Service Crops Improve a Degraded Monoculture System by Changing Common Bean Rhizospheric Soil Microbiota and Reducing Soil-Borne Fungal Diseases. FEMS Microbiol. Ecol. 2021, 97, fiaa258. [Google Scholar] [CrossRef]
  20. Chavarría, D.N.; Verdenelli, R.A.; Muñoz, E.J.; Conforto, C.; Restovich, S.B.; Andriulo, A.E.; Meriles, J.M.; Vargas-Gil, S. Soil Microbial Functionality in Response to the Inclusion of Cover Crop Mixtures in Agricultural Systems. Spanish J. Agric. Res. 2016, 14, e0304. [Google Scholar] [CrossRef] [Green Version]
  21. Arango, J.; Moreta, D.; Núñez, J.; Hartmann, K.; Domínguez, M.; Ishitani, M.; Miles, J.; Subbarao, G.; Peters, M.; Rao, I. Developing Methods to Evaluate Phenotypic Variability in Biological Nitrification Inhibition (BNI) Capacity of Brachiaria Grasses. Trop. Grassl.-Forrajes Trop. 2014, 2, 6–8. [Google Scholar] [CrossRef]
  22. Moreta, D.E.; Arango, J.; Sotelo, M.; Vergara, D.; Rincón, A.; Ishitani, M.; Castro, A.; Miles, J.; Peters, M.; Tohme, J.; et al. Biological Nitrification Inhibition (BNI) in Brachiaria Pastures: A Novel Strategy to Improve Eco-Efficiency of Crop-Livestock Systems and to Mitigate Climate Change. Trop. Grassl.-Forrajes Trop. 2014, 2, 88–91. [Google Scholar] [CrossRef]
  23. Berg, G.; Zachow, C.; Müller, H.; Philipps, J.; Tilcher, R. Next-Generation Bio-Products Sowing the Seeds of Success for Sustainable Agriculture. Agronomy 2013, 3, 648–656. [Google Scholar] [CrossRef]
  24. Bulgarelli, D.; Schlaeppi, K.; Spaepen, S.; Van Themaat, E.V.L.; Schulze-Lefert, P. Structure and Functions of the Bacterial Microbiota of Plants. Annu. Rev. Plant Biol. 2013, 64, 807–838. [Google Scholar] [CrossRef] [PubMed] [Green Version]
  25. Mendes, L.W.; Kuramae, E.E.; Navarrete, A.A.; Van Veen, J.A.; Tsai, S.M. Taxonomical and Functional Microbial Community Selection in Soybean Rhizosphere. ISME J. 2014, 8, 1577–1587. [Google Scholar] [CrossRef] [Green Version]
  26. Philippot, L.; Raaijmakers, J.M.; Lemanceau, P.; Van Der Putten, W.H. Going Back to the Roots: The Microbial Ecology of the Rhizosphere. Nat. Rev. Microbiol. 2013, 11, 789–799. [Google Scholar] [CrossRef] [PubMed]
  27. Jones, D.L.; Hinsinger, P. The Rhizosphere: Complex by Design. Plant Soil 2008, 312, 1–6. [Google Scholar] [CrossRef]
  28. Mendes, R.; Kruijt, M.; De Bruijn, I.; Dekkers, E.; Van Der Voort, M.; Schneider, J.H.M.; Piceno, Y.M.; DeSantis, T.Z.; Andersen, G.L.; Bakker, P.A.H.M.; et al. Deciphering the Rhizosphere Microbiome for Disease-Suppressive Bacteria. Science 2011, 332, 1097–1100. [Google Scholar] [CrossRef]
  29. Berendsen, R.L.; Pieterse, C.M.J.; Bakker, P.A.H.M. The Rhizosphere Microbiome and Plant Health. Trends Plant Sci. 2012, 17, 478–486. [Google Scholar] [CrossRef]
  30. Olanrewaju, O.S.; Babalola, O.O. The Rhizosphere Microbial Complex in Plant Health: A Review of Interaction Dynamics. J. Integr. Agric. 2022, 21, 2168–2182. [Google Scholar] [CrossRef]
  31. Berg, G.; Smalla, K. Plant Species and Soil Type Cooperatively Shape the Structure and Function of Microbial Communities in the Rhizosphere. FEMS Microbiol. Ecol. 2009, 68, 1–13. [Google Scholar] [CrossRef] [PubMed]
  32. Lebeis, S.L.; Paredes, S.H.; Lundberg, D.S.; Breakfield, N.; Gehring, J.; McDonald, M.; Malfatti, S.; Del Rio, T.G.; Jones, C.D.; Tringe, S.G.; et al. Salicylic Acid Modulates Colonization of the Root Microbiome by Specific Bacterial Taxa. Science 2015, 349, 860–864. [Google Scholar] [CrossRef] [PubMed] [Green Version]
  33. Delitte, M.; Caulier, S.; Bragard, C.; Desoignies, N. Plant Microbiota Beyond Farming Practices: A Review. Front. Sustain. Food Syst. 2021, 5, 624203. [Google Scholar] [CrossRef]
  34. Vargas Gil, S.; Meriles, J.; Conforto, C.; Basanta, M.; Radl, V.; Hagn, A.; Schloter, M.; March, G.J. Response of Soil Microbial Communities to Different Management Practices in Surface Soils of a Soybean Agroecosystem in Argentina. Eur. J. Soil Biol. 2011, 47, 55–60. [Google Scholar] [CrossRef]
  35. Nurulita, Y.; Adetutu, E.M.; Gunawan, H.; Zul, D.; Ball, A.S. Restoration of Tropical Peat Soils: The Application of Soil Microbiology for Monitoring the Success of the Restoration Process. Agric. Ecosyst. Environ. 2016, 216, 293–303. [Google Scholar] [CrossRef]
  36. Volante, J.N.; Paruelo, J.M. Is Forest or Ecological Transition Taking Place? Evidence for the Semiarid Chaco in Argentina. J. Arid Environ. 2015, 123, 21–30. [Google Scholar] [CrossRef] [Green Version]
  37. Walkley, A.; Black, I.A. An Examination of the Degtjareff Method for Determining Soil Organic Matter, and a Proposed Modification of the Chromic Acid Titration Method. Soil Sci. 1934, 37, 29–38. [Google Scholar] [CrossRef]
  38. Tabatabai, M.A.; Bremner, J.M. Use of P-Nitrophenyl Phosphate for Assay of Soil Phosphatase Activity. Soil Biol. Biochem. 1969, 1, 301–307. [Google Scholar] [CrossRef]
  39. Bray, R.H.; Kurtz, L.T. Determination of Total, Organic, and Available Forms of Phosphorus in Soils. Soil Sci. 1945, 59, 39–45. [Google Scholar] [CrossRef]
  40. Blake, G.; Hartge, K. Bulk Density; Soil Science Society of America Press: Madison, WI, USA, 1986. [Google Scholar]
  41. Corvalan, E.; Franzoni, A.; Huidobro, J. Microsieves Method to Estimate Soil Aggregate Stability 1−2 mm. In Proceedings of the 14th Soil Science Congress, Mar del Plata, Argentina, 14 April 2000. [Google Scholar]
  42. Vance, E.D.; Brookes, P.C.; Jenkinson, D.S. An Extraction Method for Measuring Soil Microbial Biomass C. Soil Biol. Biochem. 1987, 19, 703–707. [Google Scholar] [CrossRef]
  43. Brookes, P.C.; Joergensen, R.G. Microbial Biomass Measurements by Fumigation-Extraction. In Microbiological Methods for Assessing Soil Quality; CABI: Wallingford, UK, 2005; pp. 77–83. [Google Scholar]
  44. Alef, K. Soil Respiration. In Methods in Applied Soil Microbiology and Biochemistry; Alef, K., Nannipieri, P., Eds.; Academic Press: London, UK, 1995; pp. 214–219. [Google Scholar]
  45. Adam, G.; Duncan, H. Development of a Sensitive and Rapid Method for the Measurement of Total Microbial Activity Using Fluorescein Diacetate (FDA) in a Range of Soils. Soil Biol. Biochem. 2001, 33, 943–951. [Google Scholar] [CrossRef]
  46. García, C.; Hernandez, T.; Costa, F. Potential Use of Dehydrogenase Activity as an Index of Microbial Activity in Degraded Soils. Commun. Soil Sci. Plant Anal. 1997, 28, 123–134. [Google Scholar] [CrossRef]
  47. Fierer, N.; Jackson, J.A.; Vilgalys, R.; Jackson, B.; Fierer, N.; Jackson, J.A.; Vilgalys, R.; Jackson, R.B. Assessment of Soil Microbial Community Structure by Use of Taxon-Specific Quantitative PCR Assays. Appl. Environ. Microbiol. 2005, 71, 4117–4120. [Google Scholar] [CrossRef] [PubMed] [Green Version]
  48. May, L.A.; Smiley, B.; Schmidt, M.G. Comparative Denaturing Gradient Gel Electrophoresis Analysis of Fungal Communities Associated with Whole Plant Corn Silage. Can. J. Microbiol. 2001, 47, 829–841. [Google Scholar] [CrossRef]
  49. Liu, M.; Klemens, E.; Zhang, B.; Holzhauer, S.I.J.; Li, Z.P.; Zhang, T.L.; Rauch, S. Effect of Intensive Inorganic Fertilizer Application on Microbial Properties in a Paddy Soil of Subtropical China. Agric. Sci. China 2011, 10, 1758–1764. [Google Scholar] [CrossRef]
  50. Yu, Y.; Lee, C.; Kim, J.; Hwang, S. Group-Specific Primer and Probe Sets to Detect Methanogenic Communities Using Quantitative Real-Time Polymerase Chain Reaction. Biotechnol. Bioeng. 2005, 89, 670–679. [Google Scholar] [CrossRef]
  51. Kuczynski, J.; Stombaugh, J.; Walters, W.A.; González, A.; Caporaso, J.G.; Knight, R. Using QIIME to Analyze 16S RRNA Gene Sequences from Microbial Communities. Curr. Protoc. Microbiol. 2012, 27, 1E–5. [Google Scholar] [CrossRef] [Green Version]
  52. Callahan, B.J.; McMurdie, P.J.; Rosen, M.J.; Han, A.W.; Johnson, A.J.A.; Holmes, S.P. DADA2: High-Resolution Sample Inference from Illumina Amplicon Data. Nat. Methods 2016, 13, 581–583. [Google Scholar] [CrossRef] [Green Version]
  53. Price, M.N.; Dehal, P.S.; Arkin, A.P. FastTree 2—Approximately Maximum-Likelihood Trees for Large Alignments. PLoS ONE 2010, 5, e9490. [Google Scholar] [CrossRef]
  54. Katoh, K.; Standley, D.M. MAFFT Multiple Sequence Alignment Software Version 7: Improvements in Performance and Usability. Mol. Biol. Evol. 2013, 30, 772–780. [Google Scholar] [CrossRef] [Green Version]
  55. Di Rienzo, J.A.; Casanoves, F.; Balzarini, M.; Gonzalez, L.; Tablada, M.; Robledo, C.W. InfoStat Versión 2017. Grupo InfoStat, FCA, Universidad Nacional de Córdoba, Argentina. 2017. Available online: http://www.infostat.com.ar (accessed on 13 October 2022).
  56. Paulson, J.N.; Colin Stine, O.; Bravo, H.C.; Pop, M. Differential Abundance Analysis for Microbial Marker-Gene Surveys. Nat. Methods 2013, 10, 1200–1202. [Google Scholar] [CrossRef] [PubMed]
  57. Louca, S.; Parfrey, L.W.; Doebeli, M. Decoupling Function and Taxonomy in the Global Ocean Microbiome. Science 2016, 353, 1272–1277. [Google Scholar] [CrossRef] [PubMed]
  58. Wei, M.T.; Simko, V.; Levy, M.; Xie, Y.; Jin, Y.; Zemla, J. Package ‘Corrplot. ’ Statistician 2012, 56, 316–324. [Google Scholar]
  59. Frasier, I.; Noellemeyer, E.; Figuerola, E.; Erijman, L.; Permingeat, H.; Quiroga, A. High Quality Residues from Cover Crops Favor Changes in Microbial Community and Enhance C and N Sequestration. Glob. Ecol. Conserv. 2016, 6, 242–256. [Google Scholar] [CrossRef]
  60. Miltner, A.; Bombach, P.; Schmidt-Brücken, B.; Kästner, M. SOM Genesis: Microbial Biomass as a Significant Source. Biogeochemistry 2012, 111, 41–55. [Google Scholar] [CrossRef]
  61. Kallenbach, C.M.; Frey, S.D.; Grandy, A.S. Direct Evidence for Microbial-Derived Soil Organic Matter Formation and Its Ecophysiological Controls. Nat. Commun. 2016, 7, 13630. [Google Scholar] [CrossRef] [Green Version]
  62. Hartmann, M.; Frey, B.; Mayer, J.; Mäder, P.; Widmer, F. Distinct Soil Microbial Diversity under Long-Term Organic and Conventional Farming. ISME J. 2015, 9, 1177–1194. [Google Scholar] [CrossRef] [Green Version]
  63. Bonfim, E.M.S.; Freire, F.J.; Santos, M.V.F.; Silva, T.J.A.; Freire, M.B.G.S. Soil and Plant Phosphorus Critical Levels for Brachiaria Brizantha Related to Physical and Chemical Characteristics of Soils in the State of Pernambuco, Brazil. Rev. Bras. Cienc. do Solo 2004, 28, 281–288. [Google Scholar] [CrossRef] [Green Version]
  64. Martins, L.E.C.; Monteiro, F.A.; Pedreira, B.C. Metabolic Change, Tillering and Root System of Brachiaria Brizantha in Response To Phosphorus and Zinc Nutrition. J. Plant Nutr. 2014, 37, 509–519. [Google Scholar] [CrossRef]
  65. Ai, C.; Liang, G.; Sun, J.; Wang, X.; Zhou, W. Responses of Extracellular Enzyme Activities and Microbial Community in Both the Rhizosphere and Bulk Soil to Long-Term Fertilization Practices in a Fluvo-Aquic Soil. Geoderma 2012, 173–174, 330–338. [Google Scholar] [CrossRef]
  66. Garcia-Franco, N.; Martínez-Mena, M.; Goberna, M.; Albaladejo, J. Changes in Soil Aggregation and Microbial Community Structure Control Carbon Sequestration after Afforestation of Semiarid Shrublands. Soil Biol. Biochem. 2015, 87, 110–121. [Google Scholar] [CrossRef]
  67. Rillig, M.C.; Muller, L.A.H.; Lehmann, A. Soil Aggregates as Massively Concurrent Evolutionary Incubators. ISME J. 2017, 11, 1943–1948. [Google Scholar] [CrossRef]
  68. Blanco-Canqui, H.; Lal, R. Mechanisms of Carbon Sequestration in Soil Aggregates. CRC Crit. Rev. Plant Sci. 2004, 23, 481–504. [Google Scholar] [CrossRef]
  69. Villasica, L.J.; Lina, S.; Asio, V. Aggregate Stability Affects Carbon Sequestration Potential of Different Tropical Soils. Ann. Trop. Res. 2018, 40, 71–88. [Google Scholar] [CrossRef]
  70. Liu, M.; Han, G.; Zhang, Q. Effects of Soil Aggregate Stability on Soil Organic Carbon and Nitrogen under Land Use Change in an Erodible Region in Southwest China. Int. J. Environ. Res. Public Health 2019, 16, 3809. [Google Scholar] [CrossRef] [Green Version]
  71. Hashim, Z.E.; Alzubaidi, L.A.; Al-Madhhachi, A.T. The Influence of Microbiology on Soil Aggregation Stability. IOP Conf. Ser. Mater. Sci. Eng. 2020, 870, 012110. [Google Scholar] [CrossRef]
  72. Lehmann, A.; Zheng, W.; Rillig, M.C. Soil Biota Contributions to Soil Aggregation. Nat. Ecol. Evol. 2017, 1, 1828–1835. [Google Scholar] [CrossRef] [Green Version]
  73. García-González, I.; Hontoria, C.; Gabriel, J.L.; Alonso-Ayuso, M.; Quemada, M. Cover Crops to Mitigate Soil Degradation and Enhance Soil Functionality in Irrigated Land. Geoderma 2018, 322, 81–88. [Google Scholar] [CrossRef]
  74. Lehman, R.M.; Acosta-Martinez, V.; Buyer, J.S.; Cambardella, C.A.; Collins, H.P.; Ducey, T.F.; Halvorson, J.J.; Jin, V.L.; Johnson, J.M.F.; Kremer, R.J.; et al. Soil Biology for Resilient, Healthy Soil. J. Soil Water Conserv. 2015, 70, 12A–18A. [Google Scholar] [CrossRef]
  75. Schnurer, J.; Rosswall, T. Fluorescein Diacetate Hydrolysis as a Measure of Total Microbial Activity in Soil and Litter. Appl. Environ. Microbiol. 1982, 43, 1256–1261. [Google Scholar] [CrossRef] [Green Version]
  76. Abán, C.L.; Pérez Brandan, C.; Verdenelli, R.; Huidobro, J.; Meriles, J.M.; Vargas Gil, S. Changes in Microbial and Physicochemical Properties under Cover Crop Inclusion in a Degraded Common Bean Monoculture System. Eur. J. Soil Biol. 2021, 107, 103365. [Google Scholar] [CrossRef]
  77. Gabbarini, L.A.; Figuerola, E.; Frene, J.P.; Robledo, N.B.; Ibarbalz, F.M.; Babin, D.; Smalla, K.; Erijman, L.; Wall, L.G. Impacts of Switching Tillage to No-Tillage and Vice Versa on Soil Structure, Enzyme Activities and Prokaryotic Community Profiles in Argentinean Semi-Arid Soils. FEMS Microbiol. Ecol. 2021, 97, fiab025. [Google Scholar] [CrossRef] [PubMed]
  78. Schloter, M.; Nannipieri, P.; Sørensen, S.J.; van Elsas, J.D. Microbial Indicators for Soil Quality. Biol. Fertil. Soils 2018, 54, 1–10. [Google Scholar] [CrossRef] [Green Version]
  79. Acosta-Martínez, V.; Acosta-Mercado, D.; Sotomayor-Ramírez, D.; Cruz-Rodríguez, L. Microbial Communities and Enzymatic Activities under Different Management in Semiarid Soils. Appl. Soil Ecol. 2008, 38, 249–260. [Google Scholar] [CrossRef]
  80. Mendes, L.W.; Raaijmakers, J.M.; De Hollander, M.; Mendes, R.; Tsai, S.M. Influence of Resistance Breeding in Common Bean on Rhizosphere Microbiome Composition and Function. ISME J. 2018, 12, 212–224. [Google Scholar] [CrossRef] [Green Version]
  81. Sousa, R.M.S.; Mendes, L.W.; Antunes, J.E.L.; Oliveira, L.M.D.S.; Sousa, A.M.D.C.B.; Gomes, R.L.F.; Lopes, A.C.D.A.; Araújo, F.F.; Melo, V.M.M.; Araujo, A.S.F. Diversity and Structure of Bacterial Community in Rhizosphere of Lima Bean. Appl. Soil Ecol. 2020, 150, 103490. [Google Scholar] [CrossRef]
  82. Sugiyama, A.; Ueda, Y.; Zushi, T.; Takase, H.; Yazaki, K. Changes in the Bacterial Community of Soybean Rhizospheres during Growth in the Field. PLoS ONE 2014, 9, e100709. [Google Scholar] [CrossRef] [Green Version]
  83. Palaniyandi, S.A.; Yang, S.H.; Zhang, L.; Suh, J.W. Effects of Actinobacteria on Plant Disease Suppression and Growth Promotion. Appl. Microbiol. Biotechnol. 2013, 97, 9621–9636. [Google Scholar] [CrossRef]
  84. Delgado-Baquerizo, M.; Oliverio, A.M.; Brewer, T.E.; Benavent-González, A.; Eldridge, D.J.; Bardgett, R.D.; Maestre, F.T.; Singh, B.K.; Fierer, N. A Global Atlas of the Dominant Bacteria Found in Soil. Science 2018, 359, 320–325. [Google Scholar] [CrossRef] [Green Version]
  85. Hu, Y.; Chen, M.; Yang, Z.; Cong, M.; Zhu, X.; Jia, H. Soil Microbial Community Response to Nitrogen Application on a Swamp Meadow in the Arid Region of Central Asia. Front. Microbiol. 2022, 12, 4126. [Google Scholar] [CrossRef]
  86. Garland, G.; Edlinger, A.; Banerjee, S.; Degrune, F.; García-Palacios, P.; Pescador, D.S.; Herzog, C.; Romdhane, S.; Saghai, A.; Spor, A.; et al. Crop Cover Is More Important than Rotational Diversity for Soil Multifunctionality and Cereal Yields in European Cropping Systems. Nat. Food 2021, 2, 28–37. [Google Scholar] [CrossRef]
  87. Banerjee, S.; Schlaeppi, K.; Heijden, M.G.A. Keystone Taxa as Drivers of Microbiome Structure and Functioning. Nat. Rev. Microbiol. 2018, 16, 567–576. [Google Scholar] [CrossRef] [PubMed]
  88. Kalam, S.; Basu, A.; Ahmad, I.; Sayyed, R.Z.; El-Enshasy, H.A.; Dailin, D.J.; Suriani, N.L. Recent Understanding of Soil Acidobacteria and Their Ecological Significance: A Critical Review. Front. Microbiol. 2020, 11, 580024. [Google Scholar] [CrossRef] [PubMed]
  89. Kumar, A.; Prakash, A.; Johri, B.N. Bacteria in Agrobiology: Crop Ecosystems. In Bacteria in Agrobiology: Crop Ecosystems; Maheshwari, D., Ed.; Springer: Berlin/Heidelberg, Germany, 2011; pp. 37–59. [Google Scholar] [CrossRef]
  90. Fierer, N. Embracing the Unknown: Disentangling the Complexities of the Soil Microbiome. Nat. Rev. Microbiol. 2017, 15, 579–590. [Google Scholar] [CrossRef] [PubMed]
  91. Wang, L.; Rengel, Z.; Zhang, K.; Jin, K.; Lyu, Y.; Zhang, L.; Cheng, L.; Zhang, F.; Shen, J. Ensuring Future Food Security and Resource Sustainability: Insights into the Rhizosphere. iScience 2022, 25, 104168. [Google Scholar] [CrossRef] [PubMed]
  92. Attia, S.; Russel, J.; Mortensen, M.S.; Madsen, J.S.; Sørensen, S.J. Unexpected Diversity among Small-Scale Sample Replicates of Defined Plant Root Compartments. ISME J. 2022, 16, 997–1003. [Google Scholar] [CrossRef]
  93. Kawasaki, A.; Donn, S.; Ryan, P.R.; Mathesius, U.; Devilla, R.; Jones, A.; Watt, M. Microbiome and Exudates of the Root and Rhizosphere of Brachypodium Distachyon, a Model for Wheat. PLoS ONE 2016, 11, e0164533. [Google Scholar] [CrossRef] [Green Version]
  94. Donn, S.; Kirkegaard, J.A.; Perera, G.; Richardson, A.E.; Watt, M. Evolution of Bacterial Communities in the Wheat Crop Rhizosphere. Environ. Microbiol. 2015, 17, 610–621. [Google Scholar] [CrossRef]
  95. Chamberlain, L.A.; Bolton, M.L.; Cox, M.S.; Suen, G.; Conley, S.P.; Ané, J.M. Crop Rotation, but Not Cover Crops, Influenced Soil Bacterial Community Composition in a Corn-Soybean System in Southern Wisconsin. Appl. Soil Ecol. 2020, 154, 103603. [Google Scholar] [CrossRef]
  96. Bulgarelli, D.; Rott, M.; Schlaeppi, K.; Ver Loren van Themaat, E.; Ahmadinejad, N.; Assenza, F.; Rauf, P.; Huettel, B.; Reinhardt, R.; Schmelzer, E.; et al. Revealing Structure and Assembly Cues for Arabidopsis Root-Inhabiting Bacterial Microbiota. Nature 2012, 488, 91–95. [Google Scholar] [CrossRef]
  97. Lundberg, D.S.; Lebeis, S.L.; Paredes, S.H.; Yourstone, S.; Gehring, J.; Malfatti, S.; Tremblay, J.; Engelbrektson, A.; Kunin, V.; Del Rio, T.G.; et al. Defining the Core Arabidopsis Thaliana Root Microbiome. Nature 2012, 488, 86–90. [Google Scholar] [CrossRef] [PubMed]
  98. Azarbad, H.; Tremblay, J.; Bainard, L.D.; Yergeau, E. Relative and Quantitative Rhizosphere Microbiome Profiling Results in Distinct Abundance Patterns. Front. Microbiol. 2022, 12, 4054. [Google Scholar] [CrossRef] [PubMed]
  99. Jian, C.; Luukkonen, P.; Yki-Järvinen, H.; Salonen, A.; Korpela, K. Quantitative PCR Provides a Simple and Accessible Method for Quantitative Microbiota Profiling. PLoS ONE 2020, 15, e0227285. [Google Scholar] [CrossRef] [Green Version]
  100. Maul, J.E.; Buyer, J.S.; Lehman, R.M.; Culman, S.; Blackwood, C.B.; Roberts, D.P.; Zasada, I.A.; Teasdale, J.R. Microbial Community Structure and Abundance in the Rhizosphere and Bulk Soil of a Tomato Cropping System That Includes Cover Crops. Appl. Soil Ecol. 2014, 77, 42–50. [Google Scholar] [CrossRef]
  101. Strickland, M.S.; Rousk, J. Considering Fungal: Bacterial Dominance in Soils—Methods, Controls, and Ecosystem Implications. Soil Biol. Biochem. 2010, 42, 1385–1395. [Google Scholar] [CrossRef]
  102. de Vries, F.T.; Hoffland, E.; van Eekeren, N.; Brussaard, L.; Bloem, J. Fungal/Bacterial Ratios in Grasslands with Contrasting Nitrogen Management. Soil Biol. Biochem. 2006, 38, 2092–2103. [Google Scholar] [CrossRef] [Green Version]
  103. Chavarría, D.N.; Verdenelli, R.A.; Serri, D.L.; Restovich, S.B.; Andriulo, A.E.; Meriles, J.M.; Vargas-Gil, S. Effect of Cover Crops on Microbial Community Structure and Related Enzyme Activities and Macronutrient Availability. Eur. J. Soil Biol. 2016, 76, 74–82. [Google Scholar] [CrossRef]
  104. Serri, D.L.; Pérez-Brandan, C.; Meriles, J.M.; Salvagiotti, F.; Bacigaluppo, S.; Malmantile, A.; Vargas-Gil, S. Development of a Soil Quality Index for Sequences with Different Levels of Land Occupation Using Soil Chemical, Physical and Microbiological Properties. Appl. Soil Ecol. 2022, 180, 104621. [Google Scholar] [CrossRef]
  105. Liang, S.; Deng, J.; Jiang, Y.; Wu, S.; Zhou, Y.; Zhu, W. Functional Distribution of Bacterial Community under Different Land Use Patterns Based on Faprotax Function Prediction. Polish J. Environ. Stud. 2020, 29, 1245–1261. [Google Scholar] [CrossRef]
  106. Liu, L.; Sun, F.; Zhao, H.; Mi, H.; He, S.; Chen, Y.; Liu, Y.; Lan, H.; Zhang, M.; Wang, Z. Compositional Changes of Sedimentary Microbes in the Yangtze River Estuary and Their Roles in the Biochemical Cycle. Sci. Total Environ. 2021, 760, 143383. [Google Scholar] [CrossRef]
  107. Mohapatra, B.; Saha, A.; Chowdhury, A.N.; Kar, A.; Kazy, S.K.; Sar, P. Geochemical, Metagenomic, and Physiological Characterization of the Multifaceted Interaction between Microbiome of an Arsenic Contaminated Groundwater and Aquifer Sediment. J. Hazard. Mater. 2021, 412, 125099. [Google Scholar] [CrossRef] [PubMed]
  108. Kuzyakov, Y.; Blagodatskaya, E. Microbial Hotspots and Hot Moments in Soil: Concept & Review. Soil Biol. Biochem. 2015, 83, 184–199. [Google Scholar] [CrossRef]
  109. Galloway, J.N.; Townsend, A.R.; Erisman, J.W.; Bekunda, M.; Cai, Z.; Freney, J.R.; Martinelli, L.A.; Seitzinger, S.P.; Sutton, M.A. Transformation of the Nitrogen Cycle. Science 2008, 320, 889–892. [Google Scholar] [CrossRef] [PubMed] [Green Version]
  110. Leininger, S.; Urich, T.; Schloter, M.; Schwark, L.; Qi, J.; Nicol, G.W.; Prosser, J.I.; Schuster, S.C.; Schleper, C. Archaea Predominate among Ammonia-Oxidizing Prokaryotes in Soils. Nature 2006, 442, 806–809. [Google Scholar] [CrossRef]
  111. Subbarao, G.V.; Nakahara, K.; Hurtado, M.P.; Ono, H.; Moreta, D.E.; Salcedo, A.F.; Yoshihashi, A.T.; Ishikawa, T.; Ishitani, M.; Ohnishi-Kameyama, M.; et al. Evidence for Biological Nitrification Inhibition in Brachiaria Pastures. Proc. Natl. Acad. Sci. USA 2009, 106, 17302–17307. [Google Scholar] [CrossRef]
Figure 1. Map showing the location of the field experiment in northwestern Argentina. (a) Map of South America highlighting the location of Argentina (white) and Salta province (yellow); (b) Map of northwestern Argentina showing Salta province (yellow) and Cerrillos location (green); (c) Map of Cerrillos (green), and the red square represents the field study site; (d) Common bean crop.
Sustainability 15 00488 g001
Figure 2. Mean values of microbial biomass carbon (MBC) (a), microbial biomass nitrogen (MBN) (b), and microbial respiration (MR) (c), measured under different service crop treatments: B1 = B. brizantha/common bean; B2 = B. brizantha/B. brizantha/common bean; BM = common bean monoculture (control). Different letters indicate values that are significantly different (p ≤ 0.05). Error bars indicate standard error.
Sustainability 15 00488 g002
Figure 3. Mean values of fluorescein diacetate (FDA) hydrolysis (a), dehydrogenase activity (DHA) (b) and acid phosphatase (AP) activity (c), measured under different service crop treatments: B1 = B. brizantha/common bean; B2 = B. brizantha/B. brizantha/common bean; BM = common bean monoculture (control). Different letters indicate values that are significantly different (p ≤ 0.05). Error bars indicate standard error.
Sustainability 15 00488 g003
Figure 4. Quantitative results of bacteria 16S rRNA gene (a) and fungal 18S rRNA gene (b), measured under different service crop treatments: B1 = B. brizantha/common bean; B2 = B. brizantha/B. brizantha/common bean; BM = common bean monoculture (control). Different letters indicate values that are significantly different (p ≤ 0.05). Error bars indicate standard error.
Sustainability 15 00488 g004
Figure 5. Analysis of alpha-diversity indices: Shannon (A) Pielou´s (B), observed OTU´s (C), Faiths´s phylogenetic diversity (D), measured under different service crop treatments: B1 = B. brizantha/common bean; B2 = B. brizantha/B. brizantha/common bean; BM = common bean monoculture (control).
Sustainability 15 00488 g005
Figure 6. Principal component analysis of bacterial communities based on the Aitchison distances. B1 = B. brizantha/common bean; B2 = B. brizantha/B. brizantha/common bean; BM = common bean monoculture (control).
Sustainability 15 00488 g006
Figure 7. Average of relative abundance at phyla (a) and family (b) taxonomic levels in the total bacterial community associated with common bean rhizosphere under different service crop treatments: B1 = B. brizantha/common bean; B2 = B. brizantha/B. brizantha/common bean; BM = common bean monoculture (control). Relative abundances are based on the proportional frequencies the ASV that could be classified at the phylum and family levels, related to the total ASV identified in the samples.
Sustainability 15 00488 g007
Figure 8. (a) UpSet plot showing comparison of ASVs shared between treatments B1 and BM. In the left panel, the circles indicate their presence in the group, and bars at the top indicate the number of shared ASV types. The bottom figure shows the number of reads for each sample of ASV in each group. The right panel shows the relative abundance of the ASVs in B1, BM, and between B1 and BM. (b) UpSet plot showing comparison of ASVs shared between treatments B2 and BM. In the left panel, the circles indicate their presence in the group, and bars at the top indicate the number of shared ASV types. The bottom figure shows the number of reads for each sample of ASV in each group. The right panel shows the relative abundance of the ASVs in B2, BM, and between B2 and BM. B1 = B. brizantha/common bean; B2 = B. brizantha/B. brizantha/common bean; BM = common bean monoculture.
Sustainability 15 00488 g008
Figure 9. (a) Principal component analysis (PCA) based on the rhizosphere soil’s chemical, physical and biological parameters under different service crop treatments: B1 = B. brizantha/common bean; B2 = B. brizantha/B. brizantha/common bean; BM = common bean monoculture (control). Circles of the same color represent each replicate of each treatment. Dark red vectors represent the parameters used to build the PCA. (b) Triangular heatmap showing the pairwise Pearson’s correlation among chemical, physical and microbiological parameters. Blue and red colors indicate positive and negative correlations, respectively. The color intensity and the circle size are proportional to the correlation coefficients, with bigger circles representing higher correlations. Only the significant correlations (p value ≥ 0.01) are shown, with blank squares denoting insignificant correlations (p value < 0.01). Abbreviations: SOC, soil organic carbon; OM, organic matter, Total N, total nitrogen; C/N, Carbon nitrogen ratio; eP, extractable phosphorus; BD, Bulk density; AS, Soil aggregate stability; WHC, Water holding capacity; EC, Electrical conductivity; MR, microbial respiration; MBC, microbial biomass carbon; MBN, microbial biomass nitrogen; FDA, fluorescein diacetate hydrolysis; DHA, dehydrogenase activity; AP, acid phosphatase; 18S, 18S rRNA gene for fungal communities by qPCR; 16S, 16S rRNA gene for bacterial communities by qPCR.
Sustainability 15 00488 g009
Figure 10. Redundancy analysis (RDA) of the relationship between the relative abundance of bacterial family and physicochemical and biological soil parameters under different service crop treatments: B1 = B. brizantha/common bean; B2 = B. brizantha/B. brizantha/common bean; BM = common bean monoculture (control). Circles of the same color represent each replicate of each treatment. Dark red vectors represent the parameters used to build the PCA. Dark yellow vectors represent the top ten most informative bacterial families. Abbreviations: SOC, soil organic carbon; TN, total nitrogen; BD, Bulk density; AS, Soil aggregate stability; MBC, microbial biomass carbon; MBN, microbial biomass nitrogen; FDA, fluorescein diacetate hydrolysis; AP, acid phosphatase.
Sustainability 15 00488 g010
Table 1. Rhizosphere soil chemical and physical parameters for different service crop treatments: B1 = B. brizantha/common bean; B2 = B. brizantha/B. brizantha/common bean; BM = fallow/common bean monoculture (control). In each row, different lower-case letters indicate significant differences (p ≤ 0.05) between treatments.
B1B2BM
Chemical parameters
SOC (%) a1.24 ± 0.12 ab1.42 ± 0.04 a0.99 ± 0.18 b
OM (%) b2.13 ± 0.2 ab2.44 ± 0.07 a1.7 ± 0.32 b
Total N (%) c0.11 ± 0 ab0.12 ± 0.01 a0.09 ± 0.02 b
C/N d11 ± 1 ab12 ± 0 a10.67 ± 0.58 b
eP (p.p.m.) e22 ± 1.73 a20.33 ± 5.03 a23.33 ± 3.79 a
Physical parameters
Bulk density1.42 ± 0.04 b1.36 ± 0.07 b1.66 ± 0.11 a
Agregate stability36.99 ± 8.17 b50 ± 1.93 a14.75 ± 1.47 c
WHC (%) f32.67 ± 1.53 a31.33 ± 1.15 ab28 ± 2.65 b
pH7.07 ± 0.38 a6.83 ± 0.06 a7.07 ± 0.06 a
EC (mmhos/cm) g0.65 ± 0.23 a0.37 ± 0.02 ab0.27 ± 0.08 b
a SOC: Soil organic carbon. b OM: Organic matter. c Total N: Total nitrogen. d C/N: Carbon nitrogen ratio. e eP: Extractable phosphorus. f WHC: Water holding capacity. g EC: Electrical conductivity.
Disclaimer/Publisher’s Note: The statements, opinions and data contained in all publications are solely those of the individual author(s) and contributor(s) and not of MDPI and/or the editor(s). MDPI and/or the editor(s) disclaim responsibility for any injury to people or property resulting from any ideas, methods, instructions or products referred to in the content.

