Article

Risk Factors and Prediction of the Probability of Wildfire Occurrence in the China–Mongolia–Russia Cross-Border Area

1
Research Institute of Ecological Conservation and Restoration, Chinese Academy of Forestry, Beijing 100091, China
2
Research Institute of Desertification Studies, Chinese Academy of Forestry, Beijing 100091, China
3
State Key Laboratory of Resources and Environmental Information System, Institute of Geographical Sciences and Natural Resources Research, Chinese Academy of Sciences, Beijing 100101, China
4
School of Forestry and Wildlife Science, Auburn University, Auburn, AL 36830, USA
*
Author to whom correspondence should be addressed.
Remote Sens. 2023, 15(1), 42; https://doi.org/10.3390/rs15010042
Submission received: 17 October 2022 / Revised: 6 December 2022 / Accepted: 19 December 2022 / Published: 22 December 2022
(This article belongs to the Section Ecological Remote Sensing)

Abstract

:
Wildfire is essential in altering land ecosystems’ structures, processes, and functions. As a critical disturbance in the China–Mongolia–Russia cross-border area, it is vital to understand the potential drivers of wildfires and predict where wildfires are more likely to occur. This study assessed factors affecting wildfire using the Random Forest (RF) model. No single factor played a decisive role in the incidence of wildfires. However, the climatic variables were most critical, dominating the occurrence of wildfires. The probability of wildfire occurrence was simulated and predicted using the Adaptive Network-based Fuzzy Inference System (ANFIS). The particle swarm optimization (PSO) model and genetic algorithm (GA) were used to optimize the ANFIS model. The hybrid ANFIS models performed better than single ANFIS for the training and validation datasets. The hybrid ANFIS models, such as PSO-ANFIS and GA-ANFIS, overcome the over-fitting problem of the single ANFIS model at the learning stage of the wildfire pattern. The high classification accuracy and good model performance suggest that PSO-ANFIS can be used to predict the probability of wildfire occurrence. The probability map illustrates that high-risk areas are mainly distributed in the northeast part of the study area, especially the grassland and forest area of Dornod Province of Mongolia, Buryatia, and Chita state of Russia, and the northeast part of Inner Mongolia, China. The findings can be used as reliable estimates of the relative likelihood of wildfire hazards for wildfire management in the region covered or vicinity.

1. Introduction

Wildfire, as a critical driver for many natural landscapes and the delivery of ecosystem services, is also one of the most severe natural disasters [1]. Influenced by global warming, the intensity and frequency of wildfires and their impacts have increased at an alarming rate worldwide in past decades [2,3]. Wildfire may lead to disruptive changes to the ecological environment, loss of the natural resource, the increasing cost of extinguishing and preventing, and even endangering human lives and property [4,5,6]. There is a great need for an improved understanding of interactions and feedback that control wildfires and their underlying spatial patterns in different environmental settings [7].
Wildfire was affected by both natural and anthropogenic factors. Studies have found climate change as a critical factor causing the upward trend of wildfires [8]. The severe drought induced by global warming may lead to more severe and frequent wildfires [9]. Topography is another factor that may serve as a barrier between ecological regions to prevent the spreading of wildfires or facilitate it [10]. In addition, as a significant disturbance, human activities also affect the occurrence of wildfires. In many cases, human activities often negatively impact the occurrence of wildfires, further changing the temporal and spatial extent of wildfires [11]. It was challenging to accurately predict and control the occurrence of wildfires in a region influenced by both natural and anthropogenic disturbances.
Since the 1980s, regression models have been used to analyze and predict wildfires and associated factors [12,13,14,15,16]. However, regression models have suffered limitations in predicting wildfires due to the multiscale, complex, and nonlinear processes of wildfires [17,18,19,20]. Therefore, new methods with higher precision and accuracy are needed to predict the occurrence of wildfires.
In recent decades, machine learning has become possible in wildfire risk assessment with the development of artificial intelligence [21]. Many machine learning methods, such as adaptive neuro-fuzzy interface systems (ANFIS) [22], artificial neural networks (ANN) [23,24], support vector machines (SVM) [25], random forests (RF) [18,25], classification and regression tree (CART) [26], genetic algorithms (GA) [27,28], and firefly algorithm (FA) [27], etc., have been used to predict the occurrence of wildfire with improved performances. The machine learning method can aggregate all wildfire risk factors and employ them in a more complex analysis, which may significantly improve wildfires’ prediction accuracy and precision [21].
A simulation of wildfire occurrence in the Chaharmahal-Bakhtiari province of Iran found that the alternative decision tree (ADT) has a good prediction effect [26]. A study evaluating the wildfire risk factors in Fujian province, China using the random forest (RF) and logistic regression methods showed that RF has better prediction ability [29]. In Brazil’s Federal District, the artificial neural network (ANN) offered a better accuracy in predicting wildfire vulnerability when evaluating exclusively non-burned areas [23]. However, these wildfire predictions with a single method often lacked robustness, which may cause disparate results due to the small changes in the model parameters or data. Hybrid artificial intelligence is being employed to optimize the existing single models [20,22]. Some recent studies have shown that the hybrid method of ANFIS with PSO was more robust for wildfire prediction than the previously favored methods [20,22].
The probability assessment model is often combined with GIS to draw probability map. The evaluation method based on remote sensing will analyze the historical wildfire area, and use AHP analysis method [30] or Maxent method [31] to evaluate the weight of various impact factors. According to the weight of the influence factors, probability map of wildfire risk is drawn. However, accuracy of the wildfire risk probability map produced from this method is limited, and the demand to resolution of remote sensing is high. Especially for the area with small research scope, it is difficult to obtain high resolution data. The method of combined machine learning and GIS to produce wildfire probability map improve this problem. Firstly, the data of historical fire points and non-fire points are extracted, and then the wildfire risk probability is predicted using machine learning. Finally, the predicted results are visualized by map interpolation method. At the same time, this prediction method of wildfire risk probability is applicable to both large research areas and small research areas. On large scale, Sharma et al. [32] employed various machine learning method to produce the wildfire risk probability map of India. Shmuel and Heifetz [33] used Random Forest model and XGBoost model to predict the wildfire risk probability in global scale. Through the combination of aperture radar and depth learning, Nur’s wildfire risk probability map of Plumas National Forest reflected the prediction ability of machine learning method on wildfire risk probability in a small scale [34].
Using hybrid models to simulate wildfire occurrences is still relatively rare. Published studies are mostly limited to small geographical areas. In this study, take China–Mongolia–Russia cross-border area as study area (Figure 1), adopting burned area data from MODIS as sample dataset after the data had been pretreatment. At the same time, 17 potential factors were selected as environmental variables. RF was used to selected 14 factors from potential factors, and then calculated wildfire risk rate by hybrid ANFIS model (Figure 2). The main contributions of this study were:
  • Estimating the probability of wildfire occurrence as a function of biophysical and human-related drivers.
  • Assessing the relative importance of each driver.
  • Analyze the performance of the ANFIS model with GA and PSO for wildfire modeling in the China–Mongolia–Russia cross-border area.
  • This study explores the applicability of hybrid modeling in predicting wildfire occurrence and the probability of wildfire risk assessment for a sizeable spatial domain that crosses three countries.

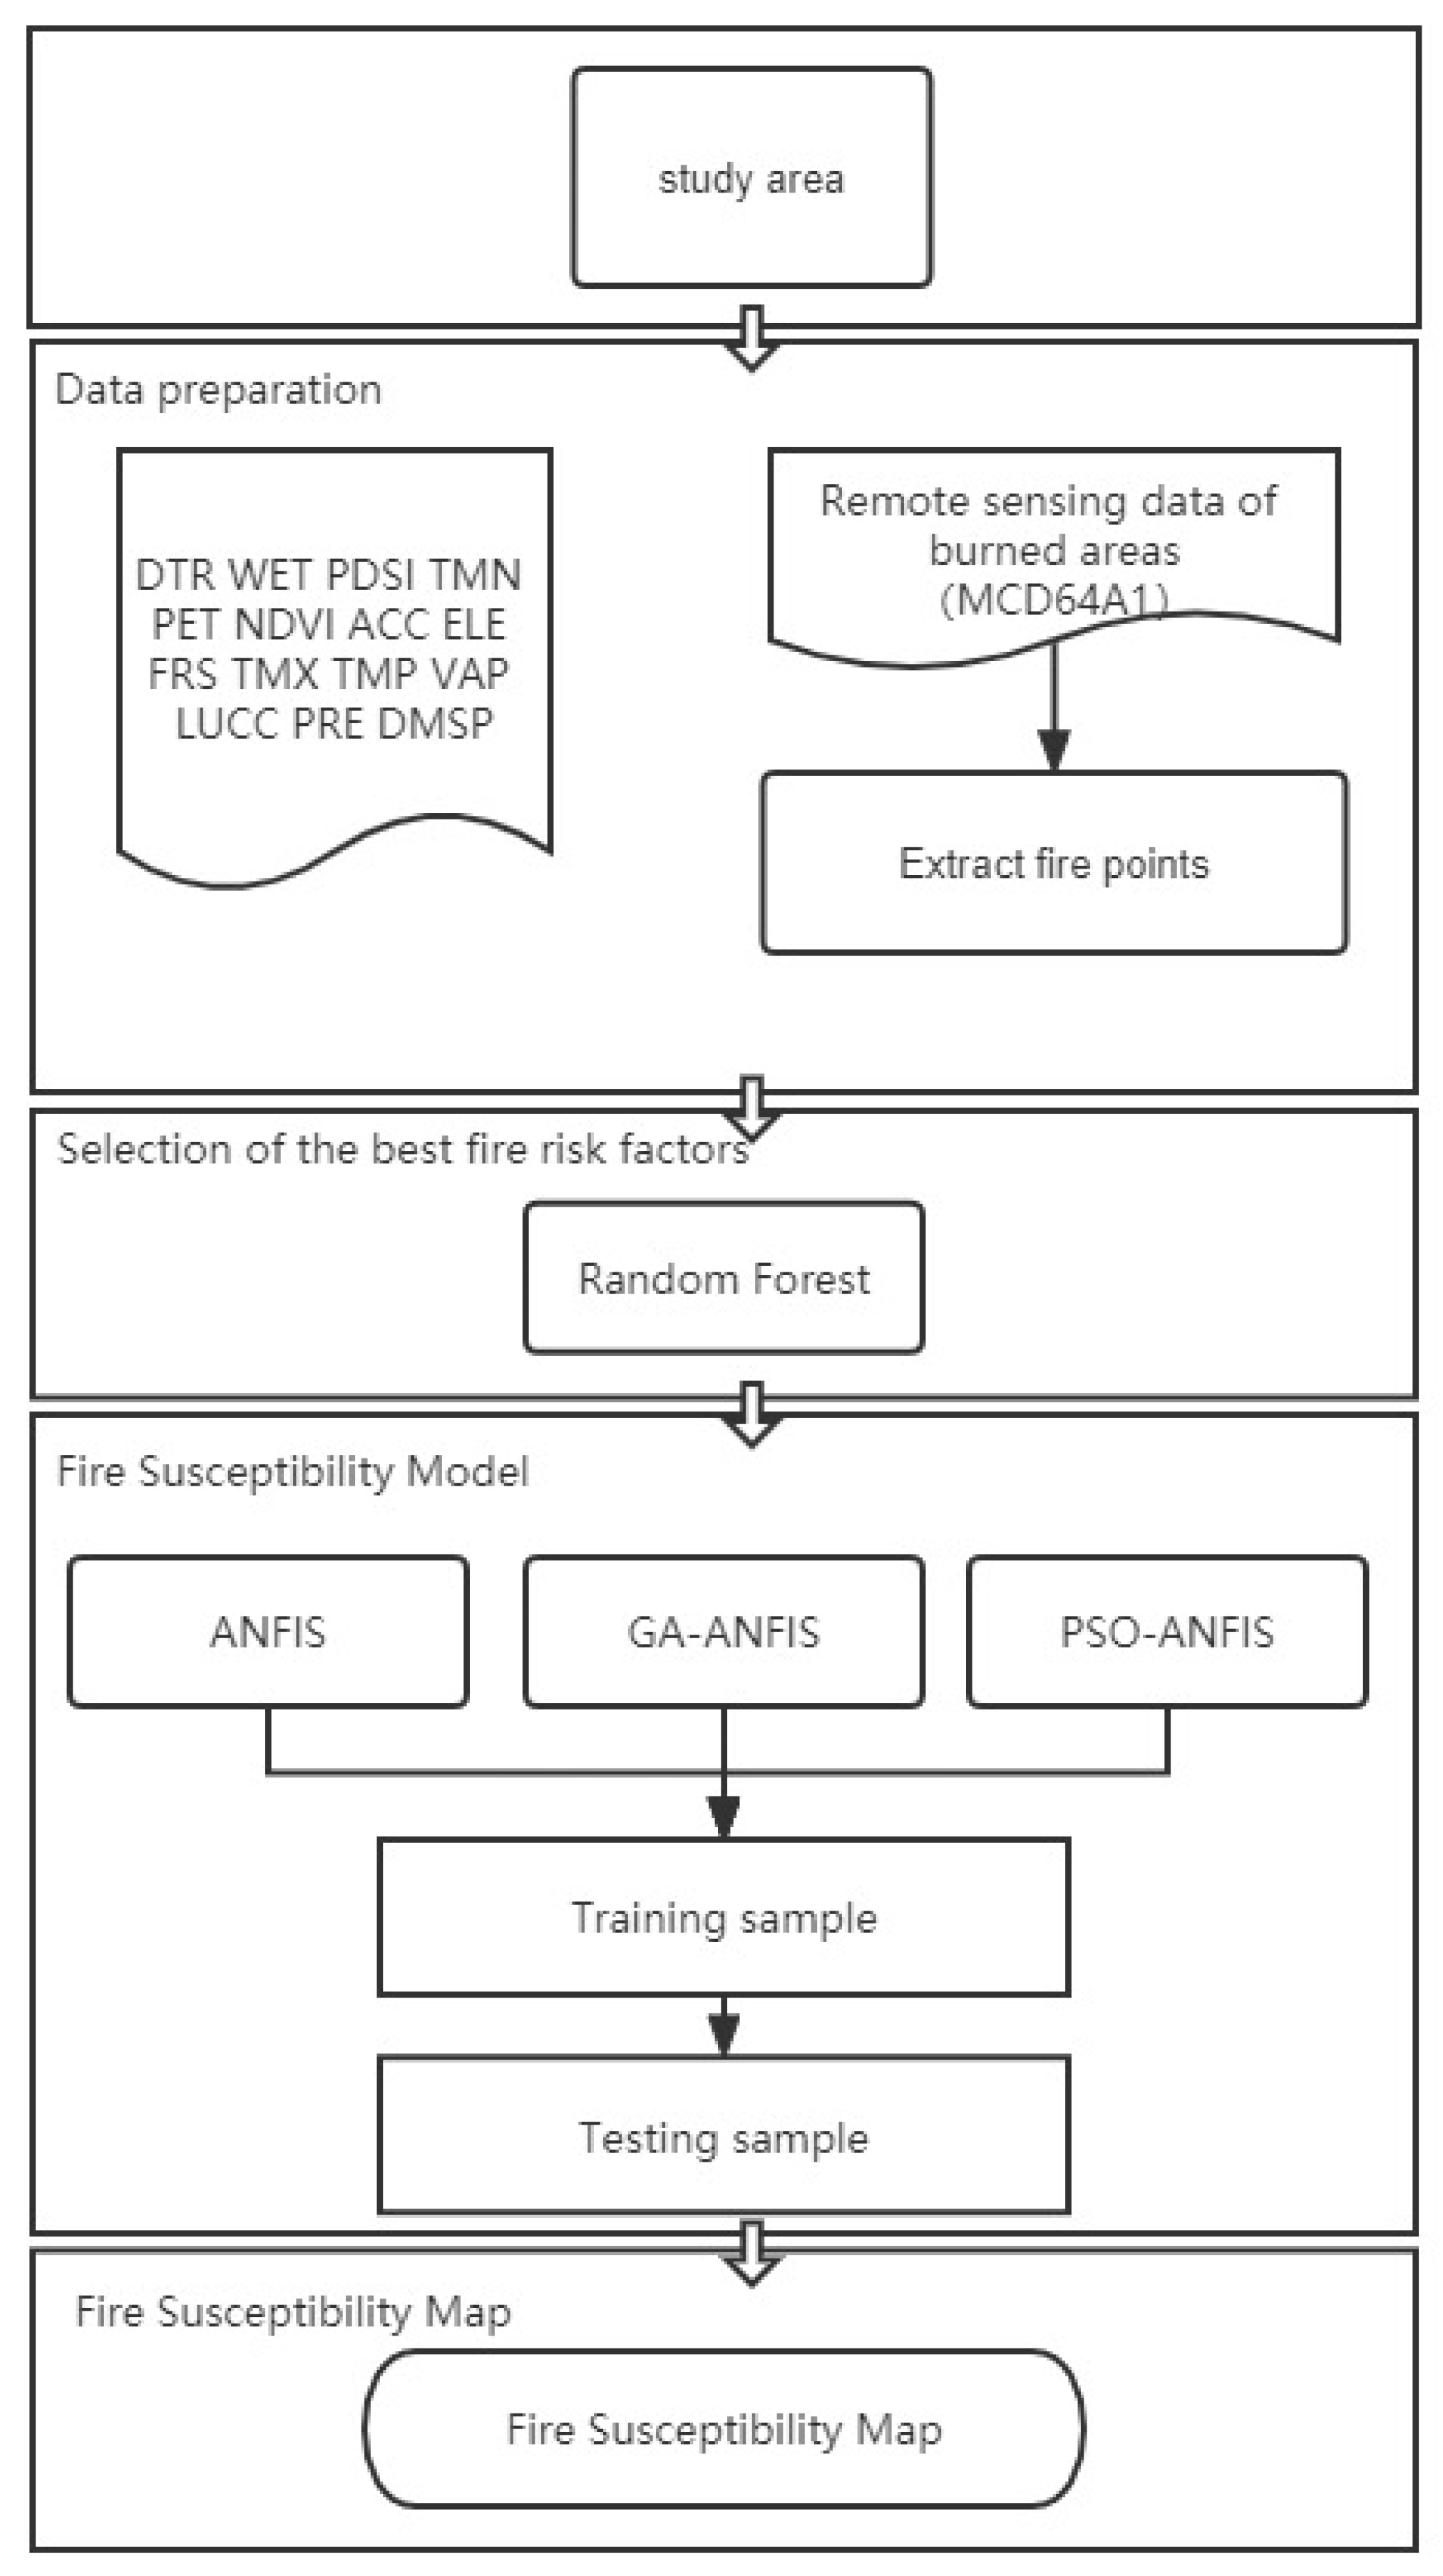
2. Material and Methods
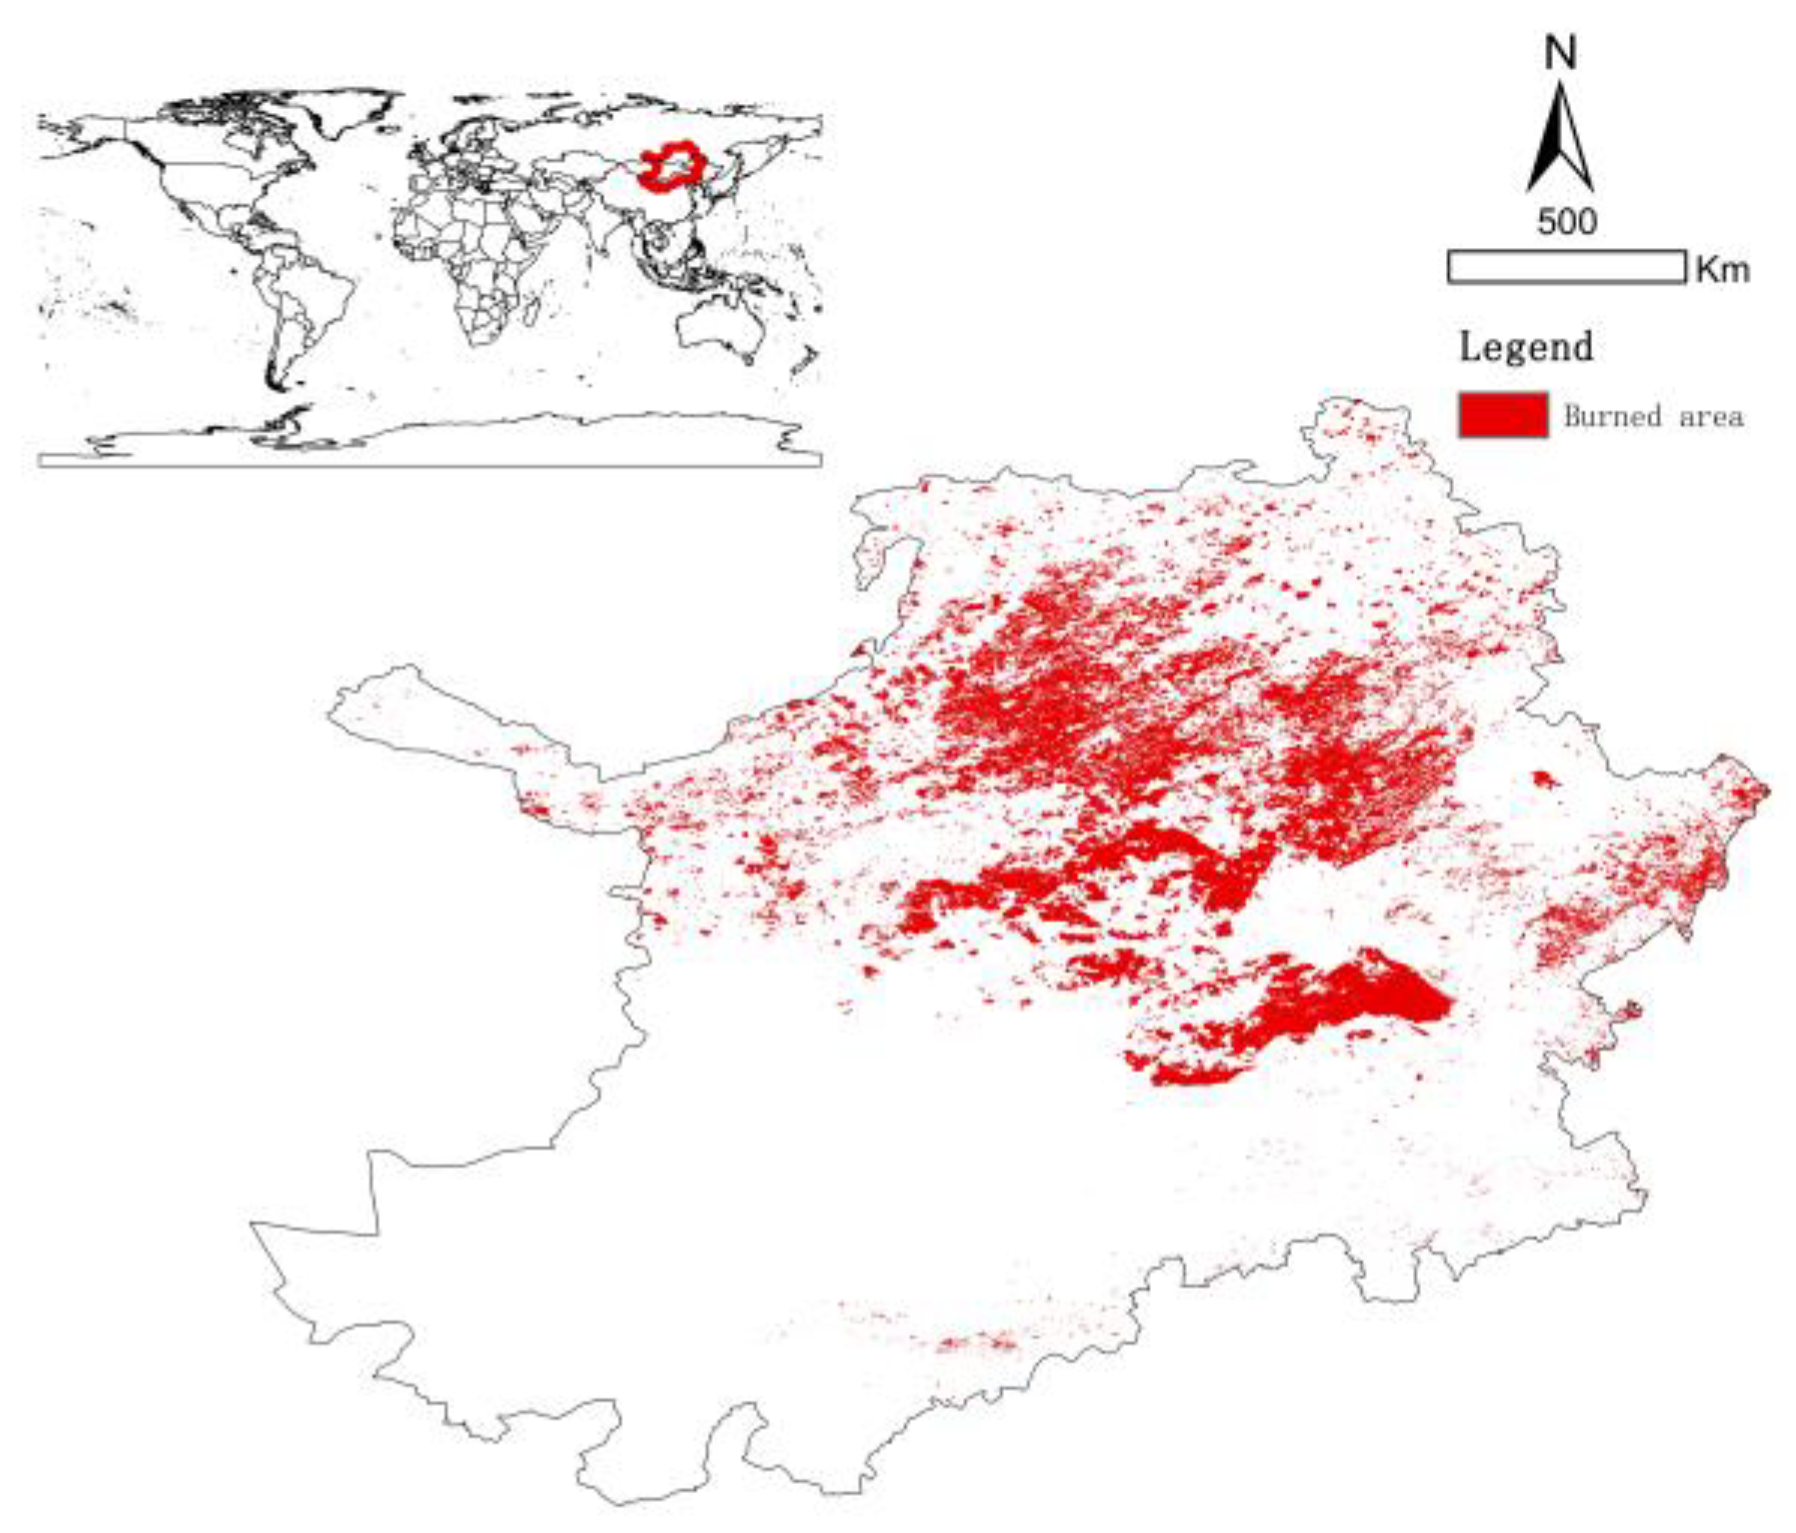
2.1. Study Area

The study area extends approximately 2.49 × 10⁶ km2 across the border area of China, Russia and Mongolia (37°24′~58°12′N, 97°12′~126°04′E). Geographically, it includes the Inner Mongolia Autonomous Region of China, the Republic of Buryatia and Chita state of Russia, and the central and eastern regions of Mongolia (Figure 1).
The study area is relatively flat and open, with an average elevation of 1070 m, and mainly composed of mountains, Gobi, and large hilly plains. There is a temperate continental climate with a warm summer and extremely cold winter [35]. The mean annual temperature is 1.34 °C, with the highest value of 26.61 °C in July and the lowest value of −39.5 °C in January. The mean annual precipitation is about 303.8 mm, concentrating in the summer and autumn. Approximately 85% of the total annual precipitation occurs mainly from May to September. The area is mainly covered by woodlands, grasslands, and Gobi deserts. Woodlands are mainly distributed in the northern mountains. Grasslands are widespread in the middle and eastern plateau, and Gobi deserts are in the southwestern plateau. Wildfires occurred widely in the study area except in the Gobi Desert, located in the southwest area, where wildfire seasons occurred mainly from March to May. The annual average burned area exceeded 2.29 × 10⁴ km2 from 2001 to 2017 (MCD64A1, 2001–2017) (Figure 1).

2.2. Data Source

The monthly burned area from 2013 to 2016 was extracted from the satellite-based burned area data (MCD64A1), representing the wildfire occurrence in each 0.25 km2 grid. The MCD64A1 dataset was first released in 2019 [36]. As part of standard global MODIS datasets, MCD64A1 is the burned area product [37]. Compared with previous generation products, MCD64A1 was generated by a hybrid algorithm that was supplied by daily active wildfire data [38].
This study collected a set of climatic, biophysical, and human-related variables as explanatory variables to predict wildfire occurrences. Each explanatory variable will be transformed to a continuous scale at a 0.25 km2 resolution grid (Table 1). The climate variables were acquired from Climatic Research Unit (CRU) TS v.4.03 0.5-degree gridded dataset (Table 1) during 2001–2017, including the precipitation (PRE), daily temperature range (DTR), daily rain frequency (WET), self-calculation Palmer drought index (PDSI), monthly minimum temperature (TMN), monthly maximum temperature (TMX), monthly mean temperature (TMP), saturated vapor pressure (VAP) and potential evapotranspiration (PET). As critical factors, these relationships between climate and wildfire will contribute to exploring the role of climate on wildfire and predicting the future wildfire trend [5,39,40].
Topographical variables, including the elevation, slope, and aspect, were considered for their relevance to wildfire occurrence and downloaded from the Geospatial Data Cloud (http://www.gscloud.cn/, accessed on 18 April 2021). A topographical feature often affects the vegetation types/composition, the microclimate, and wildfire behavior. Previous studies have found that the higher the altitude, the fewer the wildfire occurrences [24,41].
Another important variable affecting the probability of wildfire occurrences is the vegetation status and land cover. The types and covers of vegetation determine the flammability of wildfire fuel [35] and further influence the wildfire scale. Normalized Difference Vegetation Index (NDVI, accessed on 18 April 2021) was used to quantify the growth of vegetation by measuring the difference between near-infrared and red light.
N D V I = N I R R e d N I R + R e d
where NIR represents the near infrared band, Red represents the visible red band. In this study, NDVI required from MODIS13A3 was used as an indicator expressing the coverage and status of vegetation. The land cover production from MODIS (MCD12Q1) was adopted, and land use was reclassified into six types: forest, grassland, agricultural land, waterbody, urban, and bare land.
Wildfires were often caused by human activity, indicating that human-related variables should be considered in the analytical model to expound the impact of human activity. The study opted to consider two human-related variables: actual carrying capacity and night-light intensity. The stocking capacity was downloaded from the world livestock distribution data (https://dataverse.harvard.edu/dataverse/glw_3, accessed on 18 April 2021), and the actual carrying capacity (ACC) was calculated according to the method proposed by Xu et al. (2011) with a conversion factor of cattle (0.8), sheep (0.1), and horses (0.1). The night-light intensity was required from DMSP/OLS night light remote sensing data (http://www.gscloud.cn/, accessed on 18 April 2021) with a spatial resolution of 1 km2, which reflects the comprehensive information on roads, population, and settlements.

2.3. Wildfire-Risk Factor Importance Analysis Using the Random Forest Model

The random forests (RF) model, an integrated learning technique proposed by Breiman and Culter [42], is good at classification and regression. RF creates multiple decision trees, aggregated to perform a classification task, to select essential factors and figure the importance of wildfire risk factors [43]. Each tree in RF is generated by a bootstrap sample [42]. In this study, considering the uncertainty and instability caused by the distribution of training samples on the prediction results, fire and non-fire pixels were randomly divided into training (70%) and testing (30%) samples. Train samples were used to train classification trees, and testing samples called ‘out-of-bag’ (OOB) were used to verify the model based on the self-service sampling method [44]. The random division was repeated five times to obtain five groups of different training samples and test samples. Each factor’s importance is estimated and ranked by calculating its OOB error in a tree. In the modeling process, each tree’s original OOB error for wildfire risk factors Xi was first calculated. Each tree was recomputed by stochastically arranging the values of a factor in the OOB cases and putting these cases in the tree while leaving other immutable. The average increase in the OOB error of each decision tree in the two cases was determined as the importance score of the wildfire risk factor Xi. The formula is as follows:
V I X i = 1 n t r e e t e r r O O B t e r r O O B t
where ntree is the number of decision trees in RF.
According to the importance scores, RF continuously selects the wildfire risk factors to obtain the OOB error under different combinations of wildfire risk factors. The wildfire factors that can minimize the OOB error are determined as the best wildfire factor of the RF. The detailed process is as follows: (1) the importance scores of each wildfire risk factor were calculated, and their importance order was determined; (2) a certain proportion of factors with low importance was eliminated according to the importance scores; (3) RF model was rebuilt to determine the importance of wildfire factors using the remaining factors as the model’s input; (4) the processes of (1) and (2) were repeated until the minimum number of wildfire risk factors; (5) the OOB errors of RF under the combinations of different wildfire risk factors are compared. The combination with the minimum OOB error is regarded as the optimal combination of wildfire risk factors.

2.4. Wildfire Probability Modeling

2.4.1. Adaptive Neuro-Fuzzy Inference System (ANFIS)

ANFIS is a hybrid combination framework based on fuzzy logic approaches and an artificial neural network developed by Jang (1993) to simulate nonlinear problems. ANFIS is a data-driven model with self-learning ability with no input requirements. The fuzzy logic produces the output using fuzzy logical decisions to create a more reliable structure [45]. Compared with ANN and fuzzy logic, ANFIS is a superior intelligent hybrid model. The neural network in ANFIS has five layers, and each layer has defined nodes except the first and fourth layers. The nodes of the first and fourth layers are used for adjustment during training, while the defined nodes are used to normalize the input data [46]. ANFIS received plenty of attention in solving the nonlinear problem for its robust optimization method, which was wildly employed in forecasting natural hazards and having a good effect on them [47,48,49,50]. The fuzzy C-means clustering method was chose to generate the ANFIS structure by the Gaussian function as membership functions for fuzzification of the input variables to model the wildfire probability, and wildfire risk factors were inputted to ANFIS. The best number of clusters has been determined to be 30 by many experiments.

2.4.2. Genetic Algorithm (GA)

Genetic algorithm is an adaptive, randomized, global search algorithm based on Darwin’s theory of natural selection and the process of biological evolution in genetics thought [51], which plays a vital role in studies of complex adaptive systems. Selection, crossover, and mutation are fundamental components in GA. In the GA algorithm, each group is composed of several genes, so GA first constructs a set of random modeling scheme in the modeling process, and provides a basic parameter value for each gene. The next generation is generated through inheritance from the genes of the parent’s population and variation by itself. In the process of evolving GA-ANFIS model, roulette wheel betting algorithm is often used, and the reciprocal of root mean square error (RMSE) of training data set is used as fitness function [51].

2.4.3. Particle Swarm Optimization (PSO)

PSO, which originated from the study of the natural behavior of bird flocks preying [22,52], is a new evolutionary computation technique in which a massless particle representing the birds in a flock of birds has only the characteristics of position (representing the direction in which the particle moves) and speed (representing the rate of the particle’s movement). Compared with GA, PSO uses fitness to rate the population and obtain the best solution, while retaining the best solution among populations and each population [25,53,54]. All particles in the swarm can adjust their speed and position according to the current extreme individual and global value. In the wildfire probability modeling, the position of each particle in the particle swarm includes the antecedent and consequent parameters of the ANFIS model, with a total of 1290 dimensional ordered vectors with 840 antecedent parameters and 450 consequent parameters. The input variables in ANFIS included 14 wildfire risk factors, and the Gaussian function used fuzzification with 30 rules.

2.5. Model Training

After the original data were preprocessed, the dataset was standardized and divided into training set (70%) and testing set (30%). The training set was used to train the model algorithm, and then the testing set was used to verify the model. In this study, the GA algorithm and PSO algorithm were used to optimize the parameters of the membership function to improve the prediction ability of the single ANFIS model. Single ANFIS was used to randomly generate a fuzzy system, and then, a group of basic values were generated according to the antecedent parameters. GA and PSO algorithms were used to continuously optimize the parameters in the model, and output the results with the best convergence effect after multiple iterations.
The probability thresholds (i.e., cutoff points) for the estimation of prediction accuracy were estimated to classify the predictions into fires and non-fires using the Youden index. If the model’s predicted probability was equal to or higher than the cut-off point, it was assumed that a wildfire had occurred, and vice versa, that there was no wildfire. Further, these cutoffs enabled us to identify each model’s confusion matrix and to compute different performance metrics. The cutoff value for the models in this study was 0.7.
In the modeling, the Random Forest package code in R was used to determine the factor importance of wildfire risk [55]. Furthermore, MATLAB code was used to build the ANFIS, ANFIS-GA, and ANFIS-PSO models. Data from 14 wildfire risk factors were initially fed into these models to train them and assess their potential. In this case, the training set consisted of 630,573 observations, of which 315,227 were classified as non-fire and 315,346 as fire. The wildfire risk factors from RF models were provided as the input, and the values 0 or 1 for fire/non-fired were fed to the output.

2.6. Model Evaluation

The testing dataset was used to validate the predictive capabilities of ANFIS, GA-ANFIS, and PSO-ANFIS. The receiver operating characteristics (ROC) curve and the areas under the ROC curves (AUC) can reflect the whole prediction ability of prediction model. ROC curve was an effective indicator to express the accuracy and prediction rate of the model [56]. The curves were drawn based on sensitivity and specificity, where the horizontal axis represents 1-specificity and the vertical axis represents sensitivity [57,58]. AUC indicates the prediction degree of the model for wildfires in the study area. Generally, the AUC is between 0.5 and 1, and the closer the AUC is to 1, the better the prediction effect [26,56].
When the number of variables in the model changes, the importance of the variable in the prediction process can be estimated according to the change of AUC value. Meanwhile, the root mean square error (RMSE) was also used to measure the magnitude of the error between the observations (non-fire and fire pixels) and predictions (probability).

2.7. Wildfire Probability Map

The probability map of wildfire occurrence for each pixel of this study was generated in ArcGIS and classified into five classes using the Natural Breaks (Jenks) method: very low, low, moderate, high, and very high. In addition, the fire density within each class of the probability maps, a ratio between the number of fire pixels and the number of pixels within each probability class, was computed to investigate the plausibility of these maps-the values of fire density increase from very low to very high probability levels. The probability of wildfire occurrence was also affected by the accuracy of prediction. Higher accuracy means that the probability of wildfire occurrence was more real.

3. Results

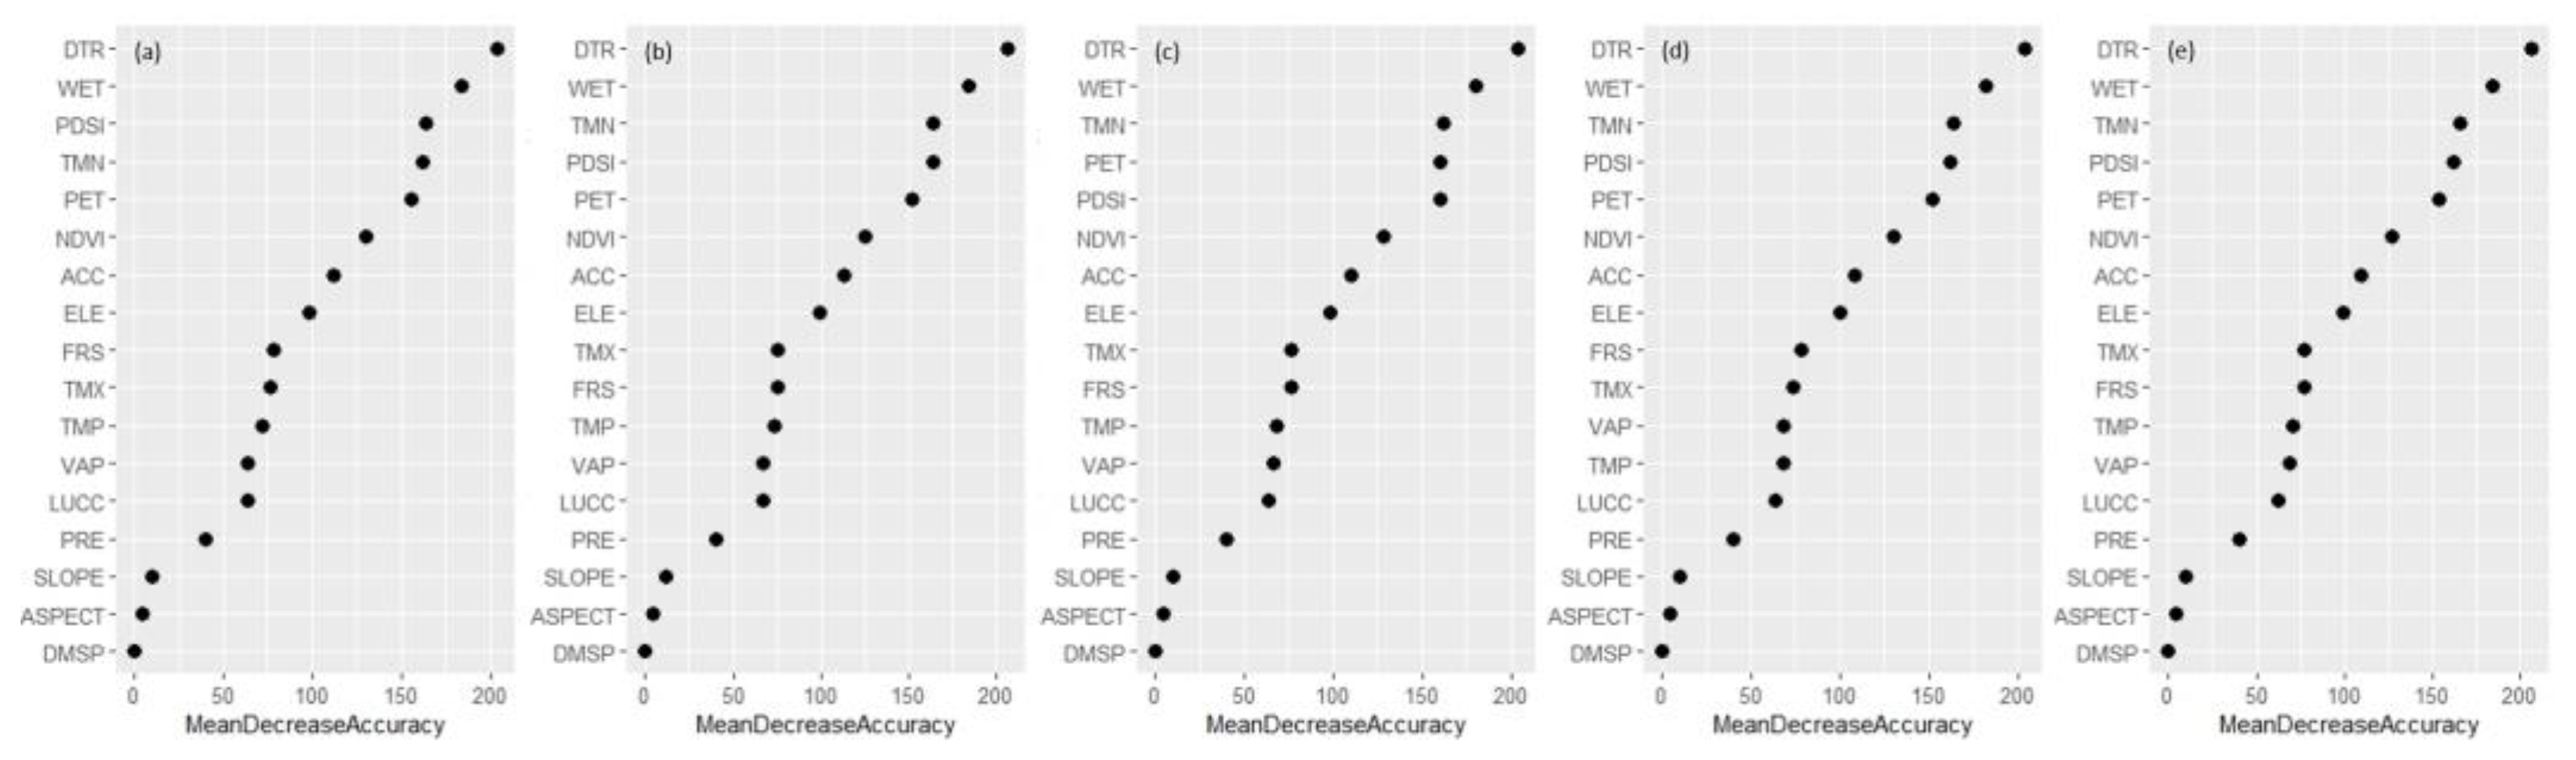
3.1. Factor Importance of Wildfire Occurrence

The RF model showed that there is no over-fitting phenomenon in the cross validation results, indicating that the model prediction had good stability and accuracy. The accuracy rate in five subsamples is more than 93.11%, and the accuracy of recording the classification of fire point and non-fire point exceeded 94.96% and 90.61%, respectively. This result (Table 2) indicates a reasonably good model performance for classifying non-fire and fire pixels over the study area.
The relative importance of wildfire risk factors was outputted using mean decrease accuracy, with the higher values of these measures representing a higher level of importance for a specific causative factor [59]. The climatic variables, such as DTR, WET, TMN, PDSI, and PET, were identified as the most critical wildfire risk factors (Figure 3). DTR showed the highest importance with a value of 0.205, followed by WET, TMN, PDSI, and PET with values 0.183, 0.163, 0.162, and 0.155, respectively. In addition, the vegetation-related variables, such as NDVI and LUCC, were important factors affecting the wildfire occurrence. The ACC, expressing the anthropogenic activity in the study area, was also an essential variable of wildfire occurrence. However, the topographic variables, such as aspect and slope, exhibited a lower importance value. Finally, 14 variables were used to predict the probability of wildfire occurrence (Figure 3).

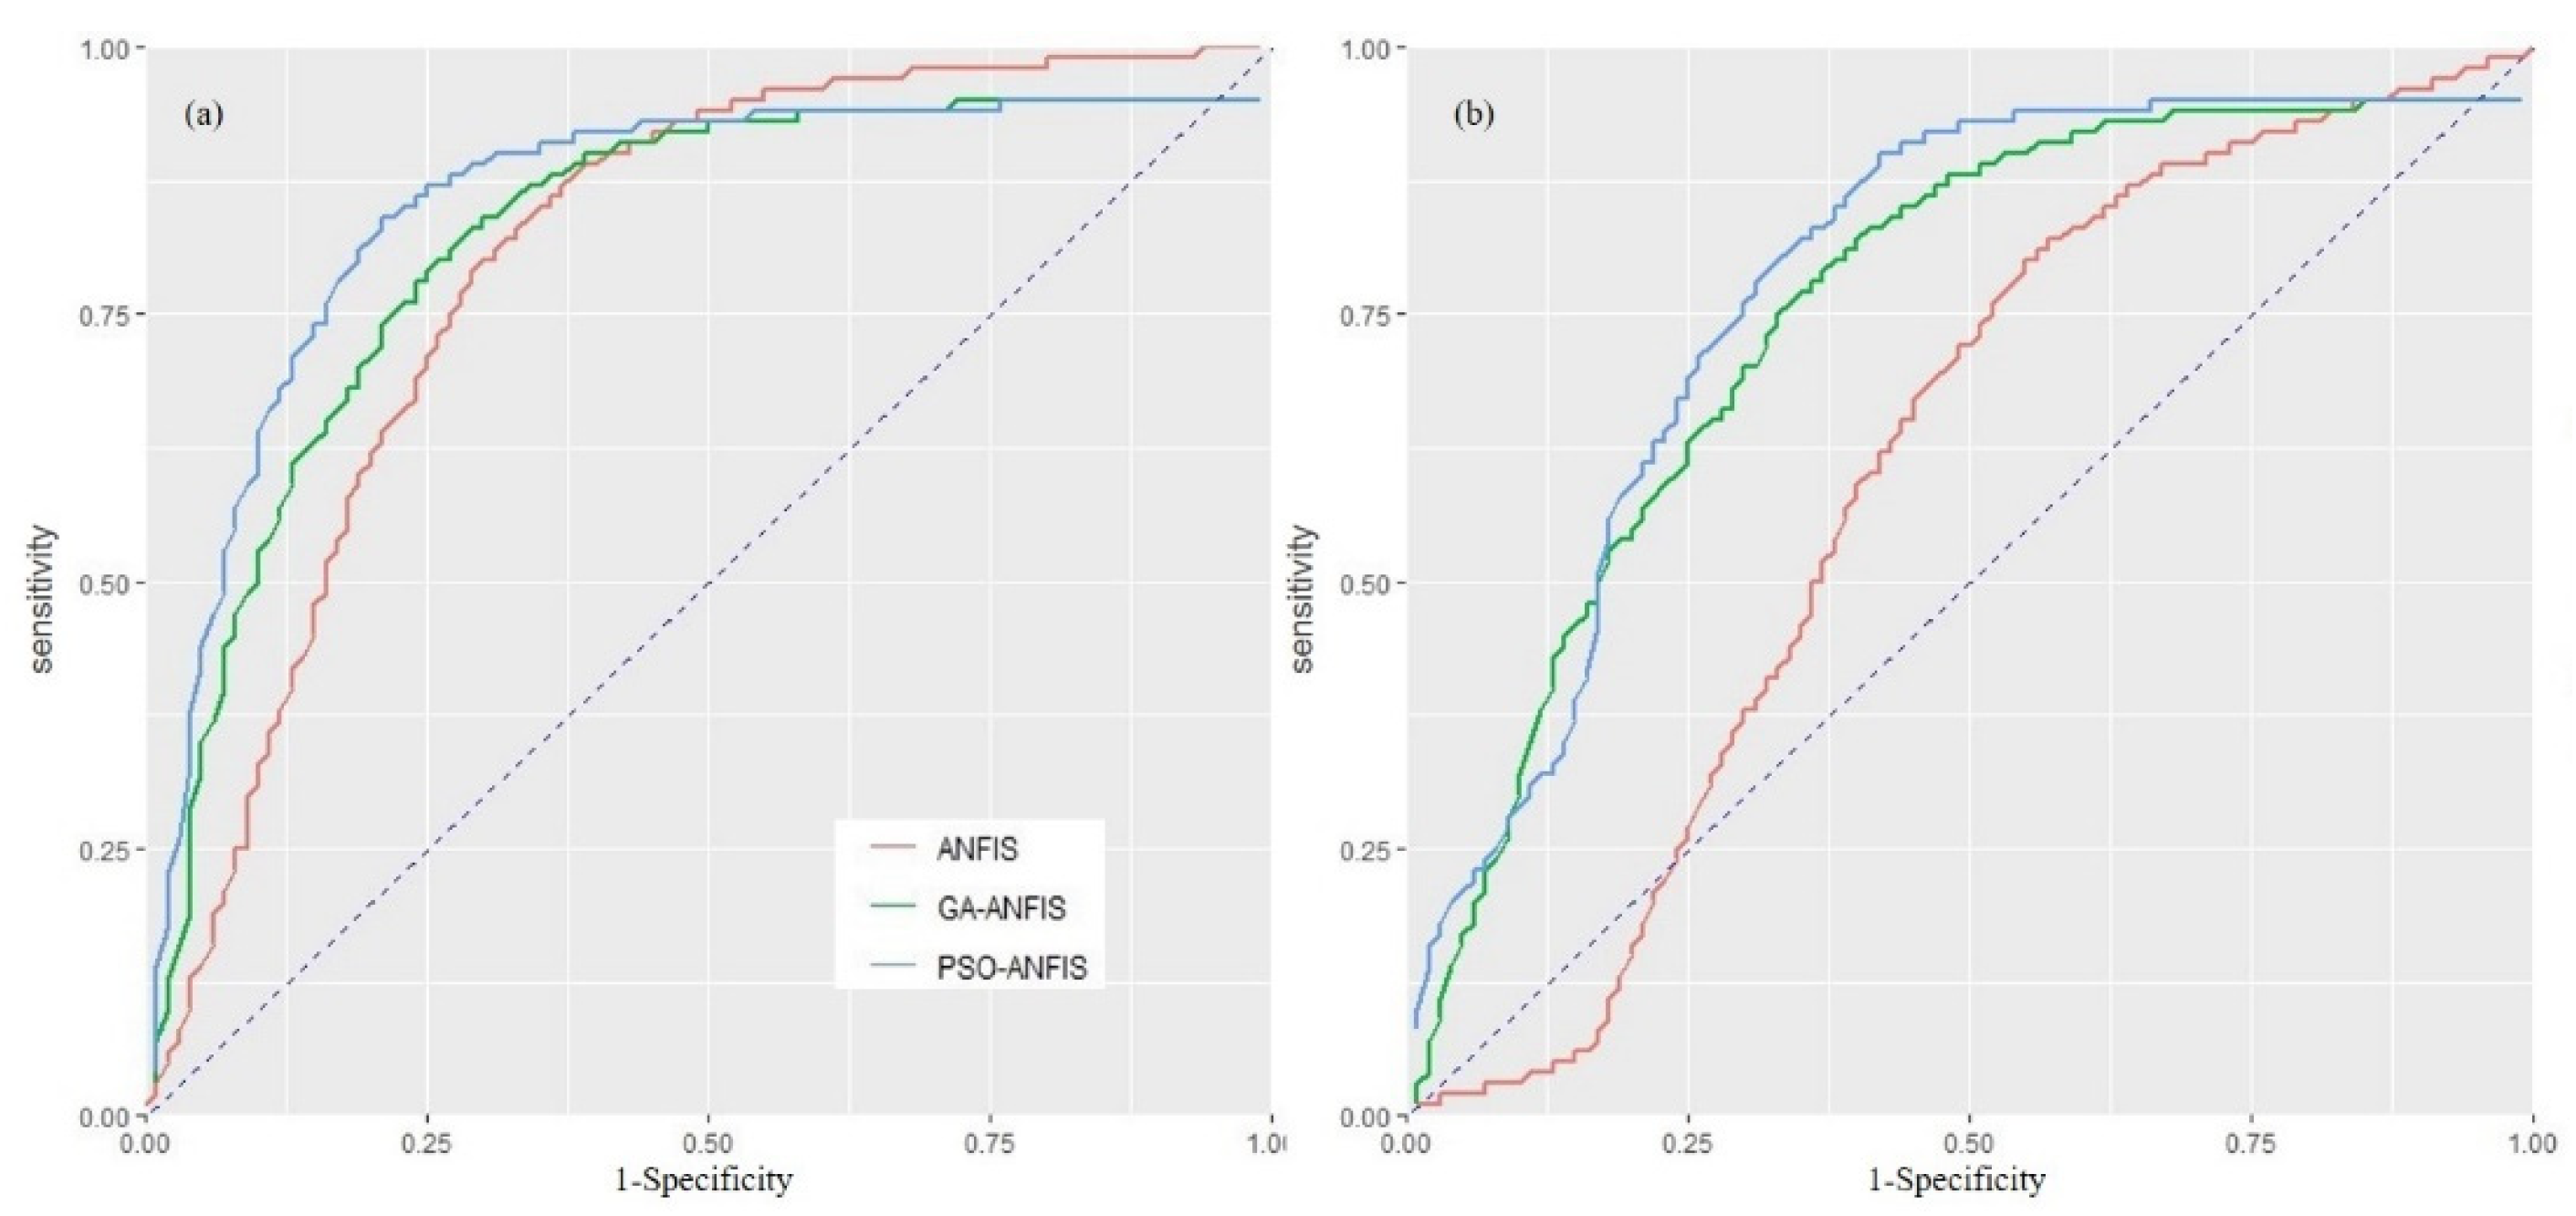
3.2. Model Validation

The gap between success rate and prediction rate indicated that the model had over-fitting problem in the simulation process (Table 3). The hybrid ANFIS models exhibit higher AUC values than the single ANFIS model (Figure 4), which indicated that hybrid ANFIS models had a better performance in fitting ability. Among the models, the PSO-ANFIS model showed the highest training performance with a success rate of 0.898. The model’s performance is followed by the GA-ANFIS, with a success rate of 0.862. The success rate of the single ANFIS (0.796) was lower than 0.8, indicating lower training ability. In the validation, PSO-ANFIS showed the highest prediction rate, followed by GA-ANFIS. In addition, the two hybrid models differed minimally in their performances, with a success rate of 0.898 (PSO-ANFIS) and 0.862 (GA-ANFIS) and a prediction rate of 0.835 (PSO-ANFIS) and 0.786 (GA-ANFIS), indicating a high model performance to predict future fires. The RMSE metrics further confirmed the overfitting of the models (Table 3). This finding suggests the highest accurate performance of the PSO-ANFIS in both the training and validation datasets, proving that PSO algorithm is of optimization significance for improving ANFIS model.
Figure 5 shows the process of finding the minimization of average error magnitude (RMSE) for the hybrid models. From the 50th iteration, PSO-ANFIS performed a faster convergence rate than GA-ANFIS, which indicated that PSO has better accuracy for ANFIS optimization than GA. After finishing the 1000th iteration, the best solution of PSO-ANFIS (RMSE = 0.353) is significantly lower than GA-ANFIS (RMSE = 0.396), suggesting that PSO produced a better convergence solution under the same number of iterations.

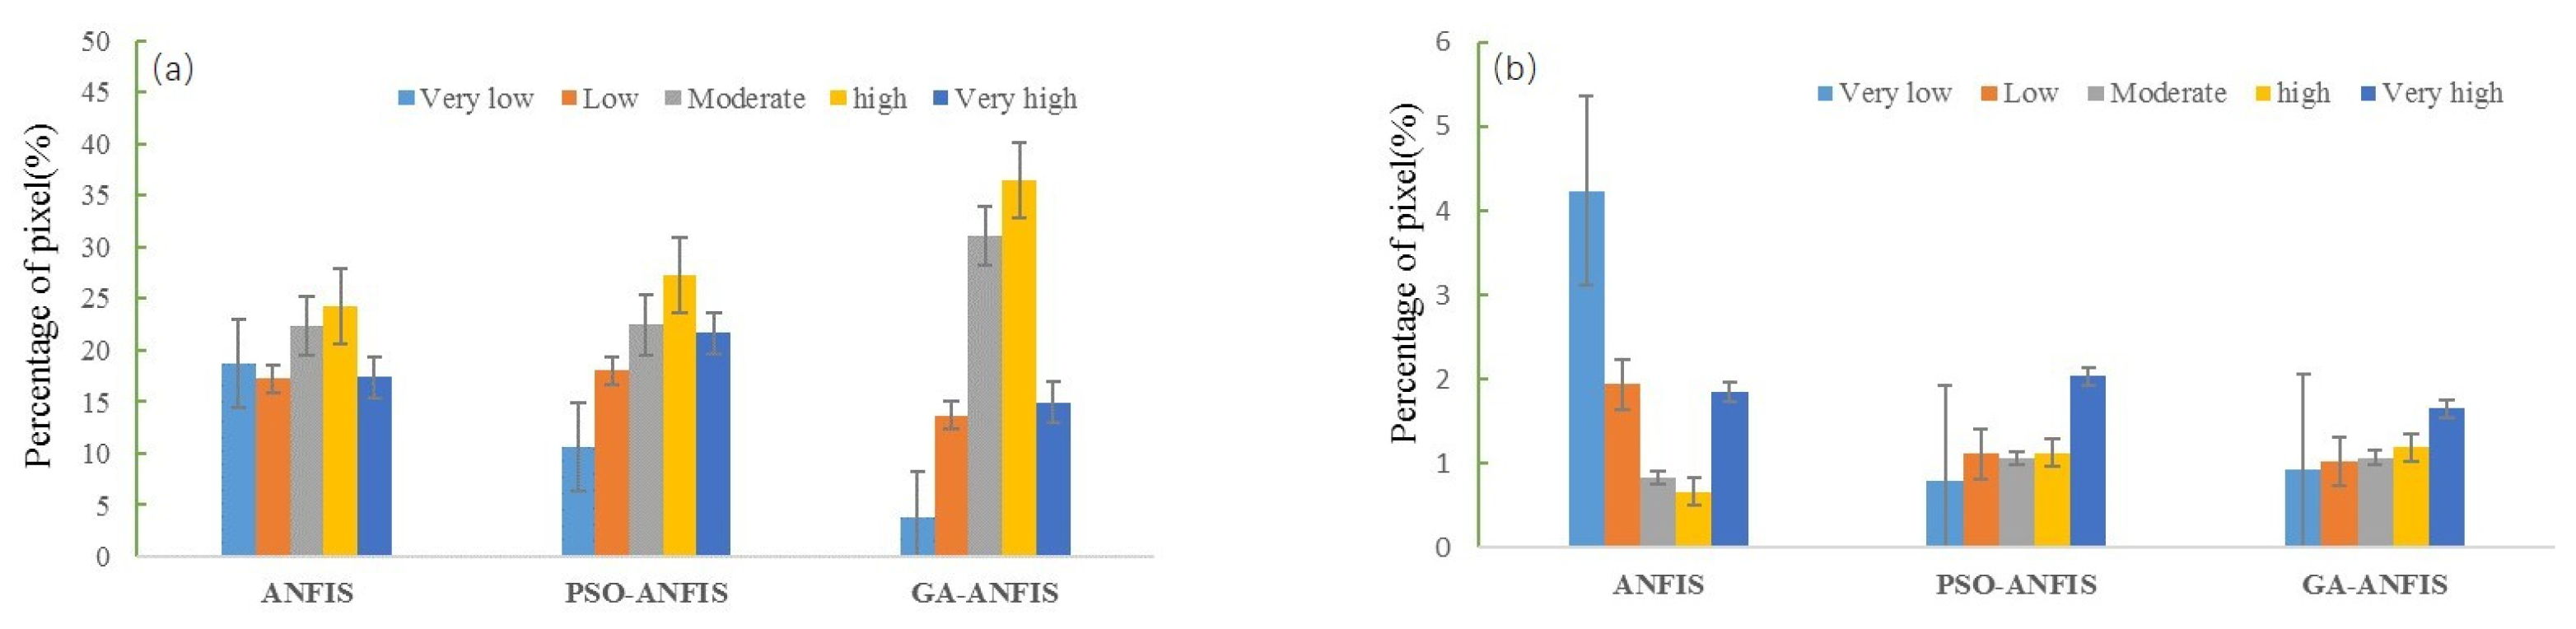
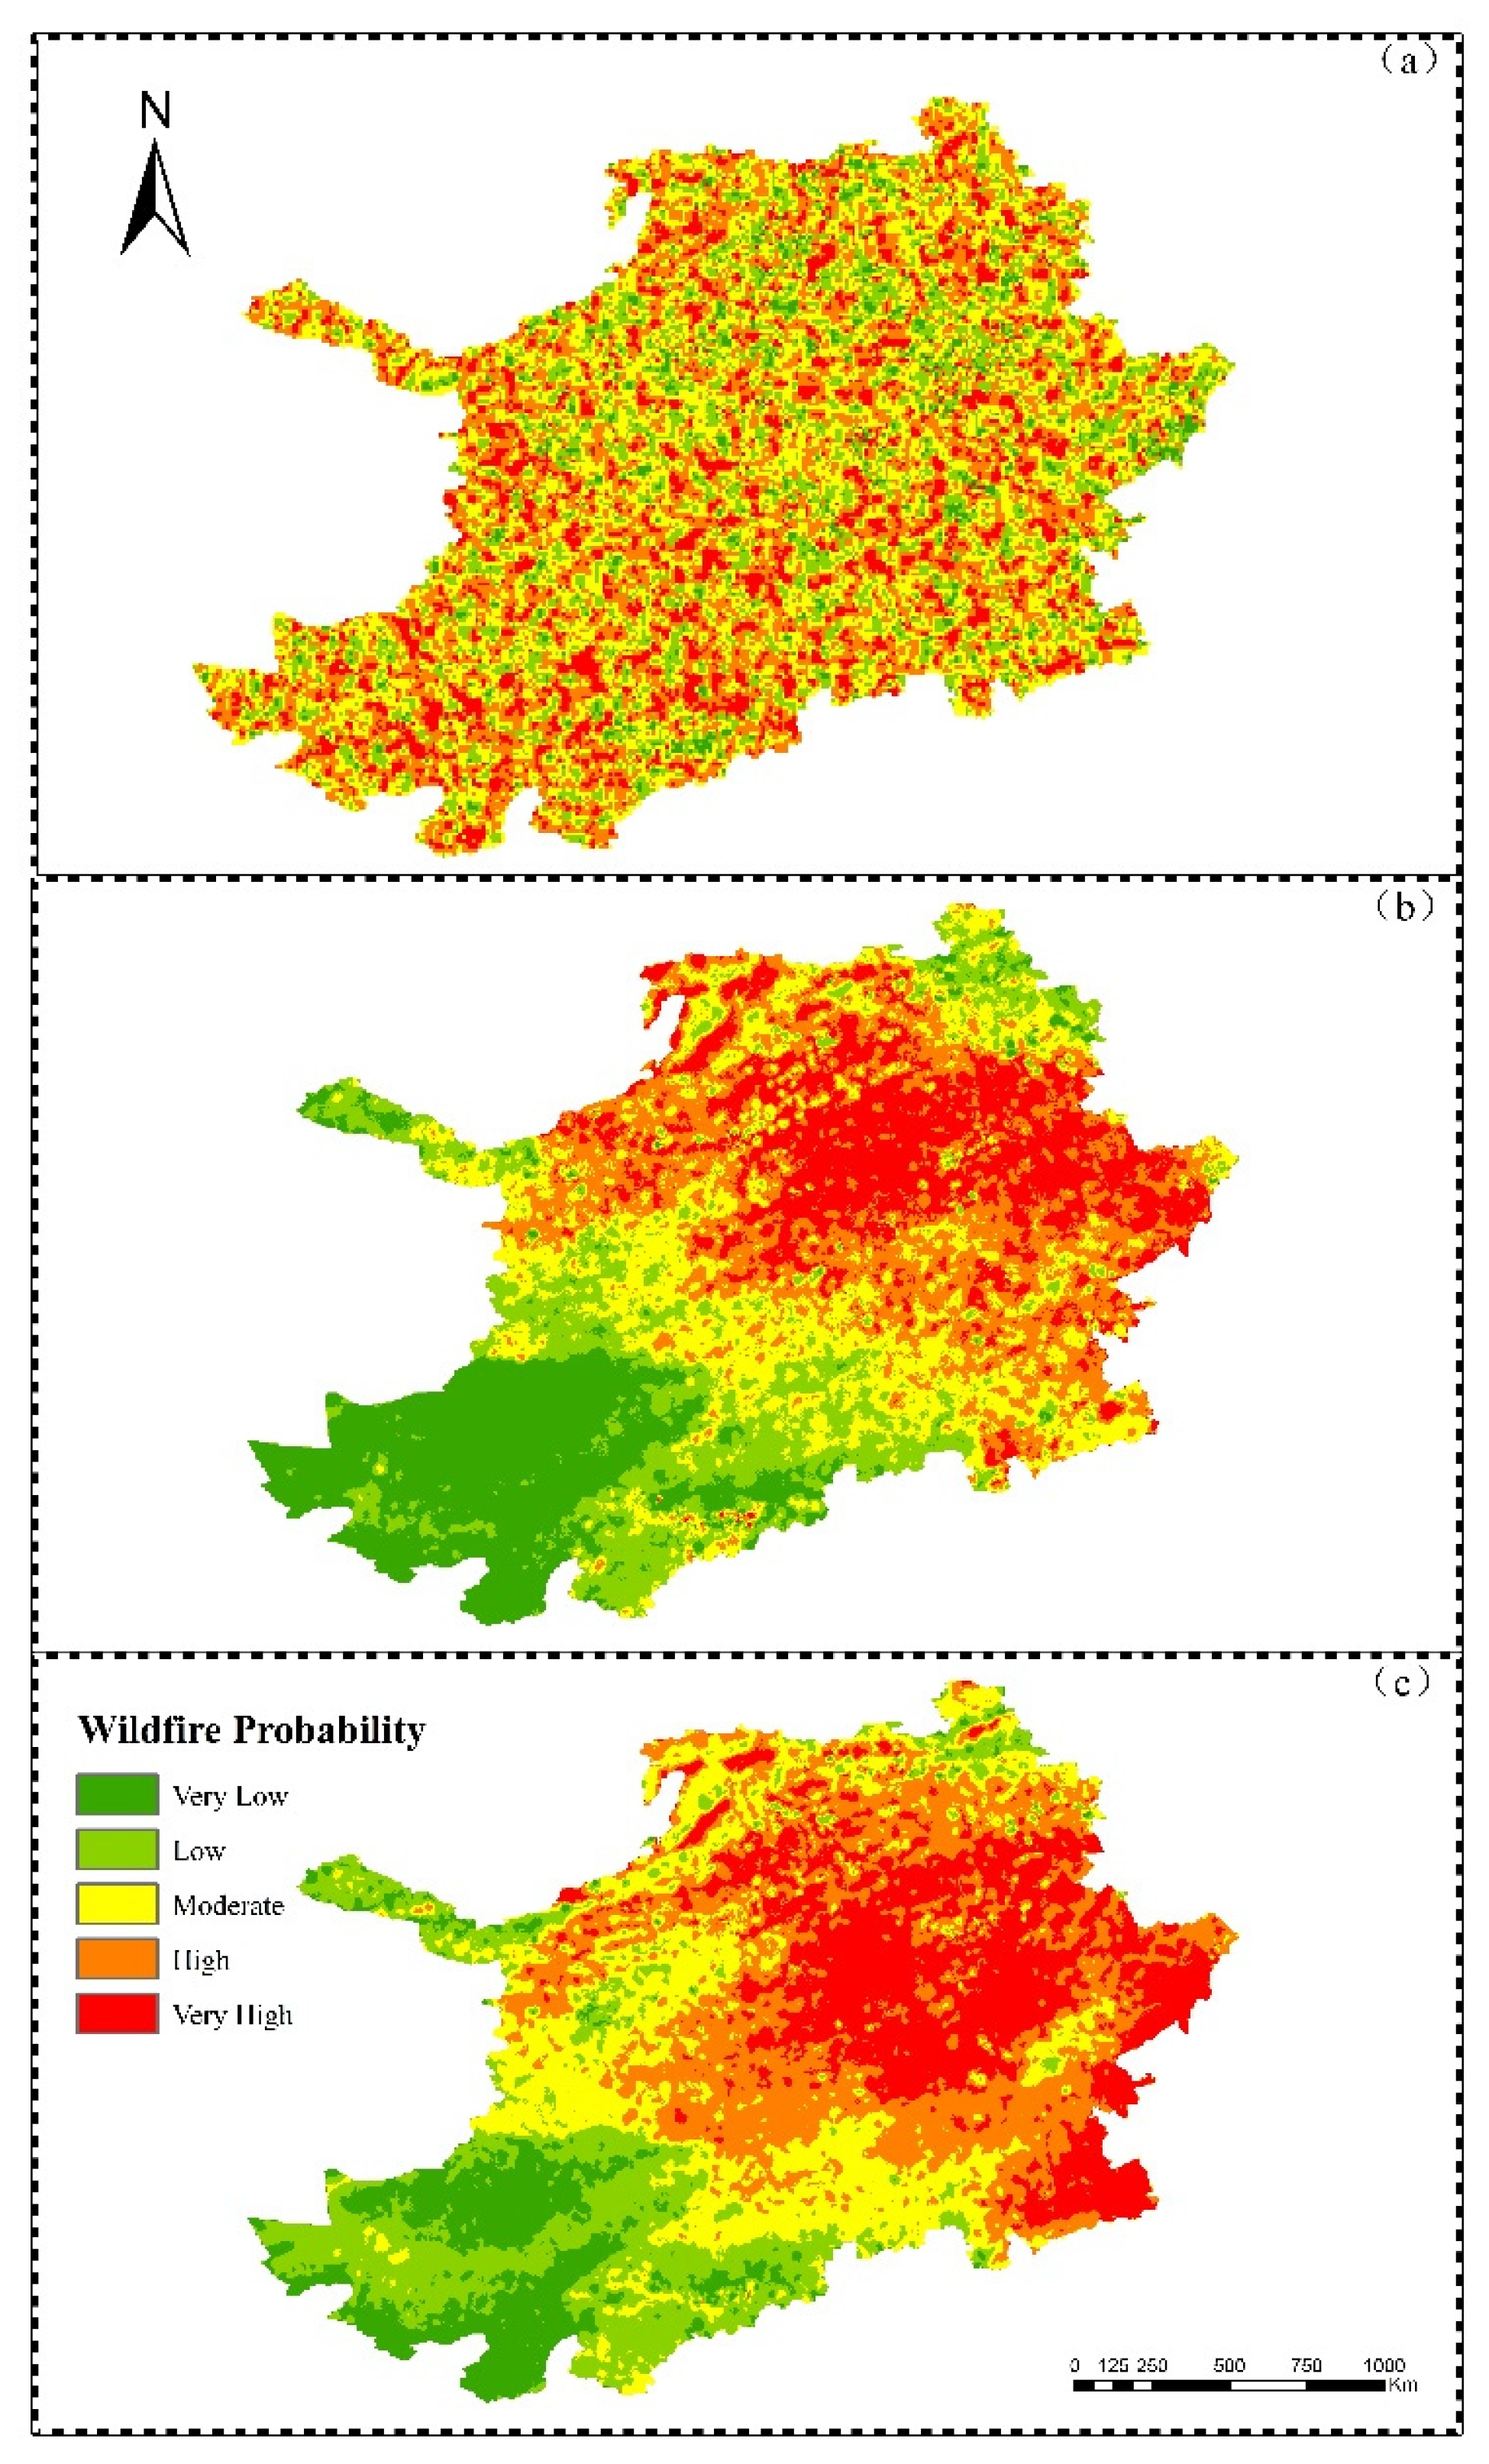
3.3. Probability of Wildfire Occurrence

The probability maps of wildfire occurrence applied to the hybrid ANFIS models were produced by the Kriging method. The probability of wildfire occurrence was reclassified into five levels (very low, low, moderate, high, and very high) across the China–Mongolia–Russia cross-border area according to the natural discontinuity method (Figure 6). The comparison of the spatial distribution of wildfire probability showed that the relative ranking of wildfire probability largely depended on the modeling method used. For example, the probability of wildfire occurrence with a high and very high level accounted for 49.7% of the study area in PSO-ANFIS models, compared to only 41.4% with the same level in GA-ANFIS models (Figure 6 and Figure 7). The analysis results of the disaster density method showed that the probability levels produced by either single ANFIS or mixed ANFIS was quite different from the historical fire points (Figure 7).
From the wildfire probability map of hybrid model (Figure 6), zones with high and very high wildfire probability are mainly concentrated in the northeast of the study area with an altitude of 500–1000 m, a high drought index, and lower rain daily frequency. In addition, the grassland with the higher grazing capacity is more prone to wildfire. In the different regions, high and very high wildfire probability was mainly in the northeastern provinces of Mongolia, the Republic of Buryatia, and the Chita state of Russia. Very high probability also exists in the northeast of Inner Mongolia Autonomous Region, China. The probability of wildfires in China is much lower than that in the other two countries, which may be due to China’s perfect fire prevention policy and the role of fire prevention institutions.

4. Discussion

4.1. Comparison of PSO and GA to Optimize ANFIS

We compared the success and prediction rate of the single and hybrid ANFIS and two meta-heuristic optimization algorithms, i.e., PSO-ANFIS and GA-ANFIS, in simulating and predicting the probability of wildfire occurrence in the China–Mongolia–Russia cross-border area. As a machine learning algorithm, ANFIS performed the best in predicting natural hazards and has recently been applied to wildfire modeling [22,27,57]. Single ANFIS has a lower prediction rate and is often prone to over-fitting in the running process [60,61], likely because it manually adjusts parameters during the debugging process and cannot produce a globally optimal solution. As hybrid artificial intelligence models, PSO and GA offer practical solutions to resolve this problem [22,47]. The two optimization algorithms allow hybrid models to define the prediction parameters automatically and produce more accurate predictions in less time while preventing over-fitting [37,45,62].
GA and PSO algorithms are the global optimization methods that update populations and search for the best advantages by random optimization algorithms. GA had a higher iteration speed than PSO in the process of iteration (Figure 5), but PSO had a more optimal solution than GA [63] (Figure 4). The GA algorithm eliminates old knowledge as the population changes due to insufficient memory. Consequently, GA does not need to spend too much time dealing with old knowledge, which makes GA can manage new knowledge faster and improve the iteration speed. The PSO algorithm retains the optimal solution for each population and the optimal solution among populations while updating new knowledge [22,54]. In the iteration process, each particle in PSO also considers the previous best position and the relationship among optimal positions of other particles, which increases the model’s calculation, so more time is needed to train the model. Therefore, the PSO algorithm to optimize the ANFIS model has higher quality and slower iteration speed than the GA algorithm.
In the prediction of wildfire probability, the areas with the high and very high probability did not fully coincide with historical wildfire points. Affected by the same climate, vegetation, terrain and other natural factors, there may be a high risk of wildfire around this area with no fire having occurred in the past. This may be due to different national policies, fire monitoring, firefighting capacity and other factors, and no large-scale fire had occurred in the past. It may also be related to the characteristics of the nonlinear model. Meanwhile, compared with the trend method used in the linear model, the susceptibility of wildfire occurrence depends on the specific relationship between wildfire points and wildfire risk factors. Due to spatial autocorrelation, there will also be interactions between adjacent pixels, which impact the accuracy of wildfire risk prediction [64,65]. In addition, wildfire risk prediction results are influenced by multiple parameters, which also increases the complexity of model training [18,51].

4.2. Importance of Variables Affecting Wildfire Occurrence

RF model was used to determine the wildfire risk factors in this study. Compared to empirical variable selection methods [66], such as literature retrieval [67,68], correlation analysis [35], and logistic regression [29], RF can improve the accuracy of wildfire risk factors selection by aggregating multiple individual tree models. For instance, the prediction accuracy of logistic regression is usually lower than the RF model [29] due to the nonlinear and complex relationships between the occurrence and risk factors of wildfires. Additionally, as an ensemble classifier, RF is hard to be disturbed by noise and can eliminate exception values [42].
The risk factors screening diagram shows no dominant factors that play decisive roles in the occurrence of wildfire, suggesting wildfire was synergistically produced by muti-factors rather than any single risk factor [24]. Climate prediction can be significantly used if different climatic elements can be linked to wildfires accurately [69]. Among these factors, DTR was considered the most influential variable. Other climate factors, such as WET, PDSI, TMN, and PET, also obviously impacted the occurrence of wildfires. This result suggests that temperature, precipitation, humidity, and evaporation play an essential role in wildfire occurrence. Temperature directly affects the moisture content of the fuel, and high temperature dramatically influence the increase in vegetation evaporation, thus reducing the moisture content of potential fuel. Precipitation and humidity are closely related to the area’s dryness and the vegetation’s moisture content. Low precipitation and humidity reduce the fuel moisture, contributing to the occurrence of wildfire. It is worth noting that climate factors were the main factors affecting the occurrences of wildfires [70]. As the combustible substance of wildfire, vegetation can also significantly affect the occurrence of wildfires. As a topographical factor, elevation has a specific influence on wildfire occurrence. The wildfire mainly occurred in low-elevation areas, which may be because the relatively flat terrain at lower elevations is more conducive to the spread of wildfires [71].
Meanwhile, the vegetation in low-altitude areas is mainly grassland, which also provides good combustible conditions for the spread of wildfires. In addition to these natural factors, anthropogenic factors play a specific role in wildfire occurrence. In order to pursue economic benefits, herders recklessly increased their livestock production [72], which may lead to increased fire used by human activities in grassland. Therefore, increasing actual carrying capacity will also increase the probability of wildfire.

5. Conclusions

In this study, no single dominant factor can play a decisive role in a wildfire. The climatic variables were the most critical factors dominating the occurrence of wildfires, and DTR was the most important meteorological factor. In terms of wildfire probability simulation, hybrid models had better stability than single ANFIS, and PSO-ANFIS produced a higher predicting capacity and greater accuracy than GA-ANFIS when predicting the probability of wildfire occurrence. The probability map of wildfire occurrence showed that high and very high wildfire probability was mainly in the northeastern provinces of Mongolia, the Republic of Buryatia, and the Chita state of Russia. Very high probability also existed in the northeast of Inner Mongolia Autonomous Region, China. Therefore, the monitoring and managing of wildfires should be strengthened in this area to reduce the occurrence of wildfire disasters.

Author Contributions

Conceptualization, Y.L., S.X. and Z.S.; methodology, Y.L. and S.X.; software, Y.L. and S.X.; validation, Y.L., S.X. and S.W.; formal analysis, Y.L.; investigation, S.X.; resources, S.X.; data curation, S.X.; writing—original draft preparation, Y.L.; writing—review and editing, Y.L., Z.F. and Z.S.; visualization, Y.L.; supervision, Z.S. and X.Y.; project administration, Z.S.; funding acquisition, Z.S., X.Z. and X.Y. All authors have read and agreed to the published version of the manuscript.

Funding

This work was financed by the National Natural Science Foundation of China (32071558, 41701249, 32061123005, 31670715), Special Project on Basic Resources of Science and Technology (2017FY101301), the Fundamental Research Funds of CAF—Overseas Outstanding Innovative Scientists Exchange Program (CAFYBB2020GD001) and Re-project of Surplus Funds of Research Institute of Desertification Studies, CAF (IDS2021JY-5).

Data Availability Statement

The MODIS NDVI (MODIS13) burned area (MCD64) and land cover (MCD12) data were obtained through the NASA Reverb service (http://reverb.echo.nasa.gov/reverb/). (Open Government Licence (nationalarchives.gov.uk)) for climate data. Topography data set is provided by Geospatial Data Cloud site, Computer Network Information Center, Chinese Academy of Sciences. (creativecommons.org/publicdomain/zero/1.0/) for ACC data.

Conflicts of Interest

The authors declare that they have no known competing financial interests or personal relationships that could have appeared to influence the work reported in this paper.

References

  1. Meng, Y.; Deng, Y.; Shi, P. Mapping Forest Wildfire Risk of the World. In World Atlas of Natural Disaster Risk; Shi, P., Kasperson, R., Eds.; IHDP/Future Earth-Integrated Risk Governance Project Series; Springer: Berlin/Heidelberg, Germany, 2015; pp. 261–275. ISBN 978-3-662-45429-9. [Google Scholar]
  2. Flannigan, M.; Cantin, A.S.; de Groot, W.J.; Wotton, M.; Newbery, A.; Gowman, L.M. Global Wildland Fire Season Severity in the 21st Century. For. Ecol. Manag. 2013, 294, 54–61. [Google Scholar] [CrossRef]
  3. Stephens, S.L.; Agee, J.K.; Fulé, P.Z.; North, M.P.; Romme, W.H.; Swetnam, T.W.; Turner, M.G. Managing Forests and Fire in Changing Climates. Science 2013, 342, 41–42. [Google Scholar] [CrossRef] [PubMed]
  4. International Strategy for Disaster Reduction (ISDR). 2009 Global Assessment Report on Disaster Risk Reduction: Patterns, Trends and Drivers; United Nations: Geneva, Switzerland, 2009. [Google Scholar]
  5. Jolly, W.M.; Cochrane, M.A.; Freeborn, P.H.; Holden, Z.A.; Brown, T.J.; Williamson, G.J.; Bowman, D.M.J.S. Climate-Induced Variations in Global Wildfire Danger from 1979 to 2013. Nat. Commun. 2015, 6, 7537. [Google Scholar] [CrossRef] [PubMed] [Green Version]
  6. Ying, H.; Shan, Y.; Zhang, H.; Yuan, T.; Rihan, W.; Deng, G. The Effect of Snow Depth on Spring Wildfires on the Hulunbuir from 2001–2018 Based on MODIS. Remote Sens. 2019, 11, 321. [Google Scholar] [CrossRef] [Green Version]
  7. Rodrigues, M.; de la Riva, J.; Fotheringham, S. Modeling the Spatial Variation of the Explanatory Factors of Human-Caused Wildfires in Spain Using Geographically Weighted Logistic Regression. Appl. Geogr. 2014, 48, 52–63. [Google Scholar] [CrossRef]
  8. Ghorbanzadeh, O.; Valizadeh Kamran, K.; Blaschke, T.; Aryal, J.; Naboureh, A.; Einali, J.; Bian, J. Spatial Prediction of Wildfire Susceptibility Using Field Survey GPS Data and Machine Learning Approaches. Fire 2019, 2, 43. [Google Scholar] [CrossRef] [Green Version]
  9. Upadhyay, R.K. Markers for Global Climate Change and Its Impact on Social, Biological and Ecological Systems: A Review. AJCC 2020, 9, 159–203. [Google Scholar] [CrossRef]
  10. Povak, N.A.; Hessburg, P.F.; Salter, R.B. Evidence for Scale-dependent Topographic Controls on Wildfire Spread. Ecosphere 2018, 9. [Google Scholar] [CrossRef] [Green Version]
  11. Aldersley, A.; Murray, S.J.; Cornell, S.E. Global and Regional Analysis of Climate and Human Drivers of Wildfire. Sci. Total Environ. 2011, 409, 3472–3481. [Google Scholar] [CrossRef]
  12. Chuvieco, E.; Congalton, R.G. Application of Remote Sensing and Geographic Information Systems to Forest Fire Hazard Mapping. Remote Sens. Environ. 1989, 29, 147–159. [Google Scholar] [CrossRef]
  13. Cardille, J.A.; Ventura, S.J.; Turner, M.G. Environmental and Social Factors Influencing Wildfires in the Upper Midwest, United States. Ecol. Appl. 2001, 11, 111–127. [Google Scholar] [CrossRef]
  14. Liu, Z.; Yang, J.; Chang, Y.; Weisberg, P.J.; He, H.S. Spatial Patterns and Drivers of Fire Occurrence and Its Future Trend under Climate Change in a Boreal Forest of Northeast China. Glob. Change Biol. 2012, 18, 2041–2056. [Google Scholar] [CrossRef]
  15. Martínez, J.; Vega-Garcia, C.; Chuvieco, E. Human-Caused Wildfire Risk Rating for Prevention Planning in Spain. J. Environ. Manag. 2009, 90, 1241–1252. [Google Scholar] [CrossRef]
  16. Prasad, V.K.; Badarinath, K.V.S.; Eaturu, A. Biophysical and Anthropogenic Controls of Forest Fires in the Deccan Plateau, India. J. Environ. Manag. 2008, 86, 1–13. [Google Scholar] [CrossRef]
  17. Cao, X.; Chen, J.; Matsushita, B.; Imura, H.; Wang, L. An Automatic Method for Burn Scar Mapping Using Support Vector Machines. Int. J. Remote Sens. 2009, 30, 577–594. [Google Scholar] [CrossRef]
  18. Guo, F.; Zhang, L.; Jin, S.; Tigabu, M.; Su, Z.; Wang, W. Modeling Anthropogenic Fire Occurrence in the Boreal Forest of China Using Logistic Regression and Random Forests. Forests 2016, 7, 250. [Google Scholar] [CrossRef] [Green Version]
  19. Jafari Goldarag, Y.; Mohammadzadeh, A.; Ardakani, A.S. Fire Risk Assessment Using Neural Network and Logistic Regression. J. Indian Soc. Remote Sens. 2016, 44, 885–894. [Google Scholar] [CrossRef]
  20. Tien Bui, D.; Bui, Q.-T.; Nguyen, Q.-P.; Pradhan, B.; Nampak, H.; Trinh, P.T. A Hybrid Artificial Intelligence Approach Using GIS-Based Neural-Fuzzy Inference System and Particle Swarm Optimization for Forest Fire Susceptibility Modeling at a Tropical Area. Agric. For. Meteorol. 2017, 233, 32–44. [Google Scholar] [CrossRef]
  21. Jain, P.; Coogan, S.C.P.; Subramanian, S.G.; Crowley, M.; Taylor, S.; Flannigan, M.D. A Review of Machine Learning Applications in Wildfire Science and Management. Environ. Rev. 2020, 28, 478–505. [Google Scholar] [CrossRef]
  22. Jaafari, A.; Zenner, E.K.; Panahi, M.; Shahabi, H. Hybrid Artificial Intelligence Models Based on a Neuro-Fuzzy System and Metaheuristic Optimization Algorithms for Spatial Prediction of Wildfire Probability. Agric. For. Meteorol. 2019, 266–267, 198–207. [Google Scholar] [CrossRef]
  23. de Bem, P.P.; de Carvalho Júnior, O.A.; Matricardi, E.A.T.; Guimarães, R.F.; Gomes, R.A.T. Predicting Wildfire Vulnerability Using Logistic Regression and Artificial Neural Networks: A Case Study in Brazil’s Federal District. Int. J. Wildland Fire 2019, 28, 35. [Google Scholar] [CrossRef]
  24. Elia, M.; D’Este, M.; Ascoli, D.; Giannico, V.; Spano, G.; Ganga, A.; Colangelo, G.; Lafortezza, R.; Sanesi, G. Estimating the Probability of Wildfire Occurrence in Mediterranean Landscapes Using Artificial Neural Networks. Environ. Impact Assess. Rev. 2020, 85, 106474. [Google Scholar] [CrossRef]
  25. Jaafari, A.; Pourghasemi, H.R. Factors Influencing Regional-Scale Wildfire Probability in Iran. In Spatial Modeling in GIS and R for Earth and Environmental Sciences; Elsevier: Amsterdam, The Netherlands, 2019; pp. 607–619. ISBN 978-0-12-815226-3. [Google Scholar]
  26. Jaafari, A.; Zenner, E.K.; Pham, B.T. Wildfire Spatial Pattern Analysis in the Zagros Mountains, Iran: A Comparative Study of Decision Tree Based Classifiers. Ecol. Inform. 2018, 43, 200–211. [Google Scholar] [CrossRef]
  27. Jaafari, A.; Razavi Termeh, S.V.; Bui, D.T. Genetic and Firefly Metaheuristic Algorithms for an Optimized Neuro-Fuzzy Prediction Modeling of Wildfire Probability. J. Environ. Manag. 2019, 243, 358–369. [Google Scholar] [CrossRef] [PubMed]
  28. Pereira, J.; Mendes, J.; Júnior, J.S.S.; Viegas, C.; Paulo, J.R. A Review of Genetic Algorithm Approaches for Wildfire Spread Prediction Calibration. Mathematics 2022, 10, 300. [Google Scholar] [CrossRef]
  29. Guo, F.; Wang, G.; Su, Z.; Liang, H.; Wang, W.; Lin, F.; Liu, A. What Drives Forest Fire in Fujian, China? Evidence from Logistic Regression and Random Forests. Int. J. Wildland Fire 2016, 25, 505. [Google Scholar] [CrossRef]
  30. Zhao, P.; Zhang, F.; Lin, H.; Xu, S. GIS-Based Forest Fire Risk Model: A Case Study in Laoshan National Forest Park, Nanjing. Remote Sens. 2021, 13, 3704. [Google Scholar] [CrossRef]
  31. Yang, X.; Jin, X.; Zhou, Y. Wildfire Risk Assessment and Zoning by Integrating Maxent and GIS in Hunan Province, China. Forests 2021, 12, 1299. [Google Scholar] [CrossRef]
  32. Sharma, L.K.; Gupta, R.; Fatima, N. Assessing the Predictive Efficacy of Six Machine Learning Algorithms for the Susceptibility of Indian Forests to Fire. Int. J. Wildland Fire 2022, 31, 735–758. [Google Scholar] [CrossRef]
  33. Shmuel, A.; Heifetz, E. Global Wildfire Susceptibility Mapping Based on Machine Learning Models. Forests 2022, 13, 1050. [Google Scholar] [CrossRef]
  34. Nur, A.S.; Kim, Y.J.; Lee, C.-W. Creation of Wildfire Susceptibility Maps in Plumas National Forest Using InSAR Coherence, Deep Learning, and Metaheuristic Optimization Approaches. Remote Sens. 2022, 14, 4416. [Google Scholar] [CrossRef]
  35. Zhao, H.; Zhang, Z.; Ying, H.; Chen, J.; Zhen, S.; Wang, X.; Shan, Y. The Spatial Patterns of Climate-Fire Relationships on the Mongolian Plateau. Agric. For. Meteorol. 2021, 308–309, 108549. [Google Scholar] [CrossRef]
  36. Giglio, L.; Randerson, J.T.; van der Werf, G.R. Analysis of Daily, Monthly, and Annual Burned Area Using the Fourth-Generation Global Fire Emissions Database (GFED4): ANALYSIS OF BURNED AREA. J. Geophys. Res. Biogeosci. 2013, 118, 317–328. [Google Scholar] [CrossRef] [Green Version]
  37. Chen, D.; Shevade, V.; Baer, A.; Loboda, T.V. Missing Burns in the High Northern Latitudes: The Case for Regionally Focused Burned Area Products. Remote Sens. 2021, 13, 4145. [Google Scholar] [CrossRef]
  38. Giglio, L.; Boschetti, L.; Roy, D.P.; Humber, M.L.; Justice, C.O. The Collection 6 MODIS Burned Area Mapping Algorithm and Product. Remote Sens. Environ. 2018, 217, 72–85. [Google Scholar] [CrossRef]
  39. Liu, Y.; Goodrick, S.; Heilman, W. Wildland Fire Emissions, Carbon, and Climate: Wildfire–Climate Interactions. For. Ecol. Manag. 2014, 317, 80–96. [Google Scholar] [CrossRef]
  40. Westerling, A.L.; Bryant, B.P. Climate Change and Wildfire in California. Clim. Change 2008, 87, 231–249. [Google Scholar] [CrossRef]
  41. Gralewicz, N.J.; Nelson, T.A.; Wulder, M.A. Factors Influencing National Scale Wildfire Susceptibility in Canada. For. Ecol. Manag. 2012, 265, 20–29. [Google Scholar] [CrossRef]
  42. Breiman, L. Random Forests. Mach. Learn. 2001, 45, 5–32. [Google Scholar] [CrossRef] [Green Version]
  43. Breiman, L.; Friedman, J.H.; Olshen, R.A.; Stone, C.J. Classification And Regression Trees, 1st ed.; Routledge: London, UK, 2017; ISBN 978-1-315-13947-0. [Google Scholar]
  44. Duro, D.C.; Franklin, S.E.; Dubé, M.G. Multi-Scale Object-Based Image Analysis and Feature Selection of Multi-Sensor Earth Observation Imagery Using Random Forests. Int. J. Remote Sens. 2012, 33, 4502–4526. [Google Scholar] [CrossRef]
  45. Hong, H. Flood Susceptibility Assessment in Hengfeng Area Coupling Adaptive Neuro-Fuzzy Inference System with Genetic Algorithm and Differential Evolution. Sci. Total Environ. 2018, 621, 1124–1141. [Google Scholar] [CrossRef] [PubMed]
  46. Jang, J.S.R.; Sun, C.T.; Mizutani, E. Neuro-Fuzzy and Soft Computing-A Computational Approach to Learning and Machine Intelligence [Book Review]. IEEE Trans. Automat. Contr. 1997, 42, 1482–1484. [Google Scholar] [CrossRef]
  47. Abdollahizad, S.; Balafar, M.A.; Feizizadeh, B.; Babazadeh Sangar, A.; Samadzamini, K. Using Hybrid Artificial Intelligence Approach Based on a Neuro-Fuzzy System and Evolutionary Algorithms for Modeling Landslide Susceptibility in East Azerbaijan Province, Iran. Earth Sci. Inf. 2021, 14, 1861–1882. [Google Scholar] [CrossRef]
  48. Ghorbanzadeh, O.; Rostamzadeh, H.; Blaschke, T.; Gholaminia, K.; Aryal, J. A New GIS-Based Data Mining Technique Using an Adaptive Neuro-Fuzzy Inference System (ANFIS) and k-Fold Cross-Validation Approach for Land Subsidence Susceptibility Mapping. Nat. Hazards 2018, 94, 497–517. [Google Scholar] [CrossRef] [Green Version]
  49. Shirmohammadi, B.; Moradi, H.; Moosavi, V.; Semiromi, M.T.; Zeinali, A. Forecasting of Meteorological Drought Using Wavelet-ANFIS Hybrid Model for Different Time Steps (Case Study: Southeastern Part of East Azerbaijan Province, Iran). Nat. Hazards 2013, 69, 389–402. [Google Scholar] [CrossRef]
  50. Tien Bui, D.; Khosravi, K.; Li, S.; Shahabi, H.; Panahi, M.; Singh, V.; Chapi, K.; Shirzadi, A.; Panahi, S.; Chen, W.; et al. New Hybrids of ANFIS with Several Optimization Algorithms for Flood Susceptibility Modeling. Water 2018, 10, 1210. [Google Scholar] [CrossRef] [Green Version]
  51. Rambod, M.; Rezaeian, J. Robust Meta-Heuristics Implementation for Unrelated Parallel Machines Scheduling Problem with Rework Processes and Machine Eligibility Restrictions. Comput. Ind. Eng. 2014, 77, 15–28. [Google Scholar] [CrossRef]
  52. Poli, R.; Kennedy, J.; Blackwell, T. Particle Swarm Optimization: An Overview. Swarm Intell. 2007, 1, 33–57. [Google Scholar] [CrossRef]
  53. Soleimani, H.; Kannan, G. A Hybrid Particle Swarm Optimization and Genetic Algorithm for Closed-Loop Supply Chain Network Design in Large-Scale Networks. Appl. Math. Model. 2015, 39, 3990–4012. [Google Scholar] [CrossRef]
  54. Eberhart, R.; Kennedy, J. A New Optimizer Using Particle Swarm Theory. In Proceedings of the Sixth International Symposium on Micro Machine and Human Science, MHS’95, Nagoya, Japan, 4–6 October 1995; IEEE: Nagoya, Japan, 1995; pp. 39–43. [Google Scholar]
  55. Diaz-Uriarte, R. GeneSrF and VarSelRF: A Web-Based Tool and R Package for Gene Selection and Classification Using Random Forest. BMC Bioinform. 2007, 8, 328. [Google Scholar] [CrossRef]
  56. Youssef, A.M.; Pourghasemi, H.R.; El-Haddad, B.A.; Dhahry, B.K. Landslide Susceptibility Maps Using Different Probabilistic and Bivariate Statistical Models and Comparison of Their Performance at Wadi Itwad Basin, Asir Region, Saudi Arabia. Bull. Eng. Geol. Environ. 2016, 75, 63–87. [Google Scholar] [CrossRef]
  57. Chapi, K.; Singh, V.P.; Shirzadi, A.; Shahabi, H.; Bui, D.T.; Pham, B.T.; Khosravi, K. A Novel Hybrid Artificial Intelligence Approach for Flood Susceptibility Assessment. Environ. Model. Softw. 2017, 95, 229–245. [Google Scholar] [CrossRef]
  58. Pourtaghi, Z.S.; Pourghasemi, H.R.; Rossi, M. Forest Fire Susceptibility Mapping in the Minudasht Forests, Golestan Province, Iran. Environ. Earth Sci. 2015, 73, 1515–1533. [Google Scholar] [CrossRef]
  59. Pourtaghi, Z.S.; Pourghasemi, H.R.; Aretano, R.; Semeraro, T. Investigation of General Indicators Influencing on Forest Fire and Its Susceptibility Modeling Using Different Data Mining Techniques. Ecol. Indic. 2016, 64, 72–84. [Google Scholar] [CrossRef]
  60. Sexton, R.S.; Dorsey, R.E.; Johnson, J.D. Toward Global Optimization of Neural Networks: A Comparison of the Genetic Algorithm and Backpropagation. Decis. Support Syst. 1998, 22, 171–185. [Google Scholar] [CrossRef]
  61. Tahmasebi, P.; Hezarkhani, A. A Hybrid Neural Networks-Fuzzy Logic-Genetic Algorithm for Grade Estimation. Comput. Geosci. 2012, 42, 18–27. [Google Scholar] [CrossRef] [Green Version]
  62. Moosavi, V.; Niazi, Y. Development of Hybrid Wavelet Packet-Statistical Models (WP-SM) for Landslide Susceptibility Mapping. Landslides 2016, 13, 97–114. [Google Scholar] [CrossRef]
  63. Moayedi, H.; Khari, M.; Bahiraei, M. Spatial Assessment of Landslide Risk Using Two Novel Integrations of Neuro-Fuzzy System and Metaheuristic Approaches; Ardabil Province, Iran. Geomat. Nat. Hazards Risk 2020, 11, 230–258. [Google Scholar] [CrossRef] [Green Version]
  64. Cortez, P.; Morais, A. New Trends in Artificial Intelligence. In Proceedings of the 13th Portuguese Conference on Artificial Intelligence (EPIA 2007), Guimarães, Portugal, 3–7 December 2007; APPIA: Lisbon, Portugal, 2007; pp. 512–523, ISBN 978-989-95618-0-9. [Google Scholar]
  65. Nebot, À.; Mugica, F. Forest Fire Forecasting Using Fuzzy Logic Models. Forests 2021, 12, 1005. [Google Scholar] [CrossRef]
  66. Adab, H.; Kanniah, K.D.; Solaimani, K. Modeling Forest Fire Risk in the Northeast of Iran Using Remote Sensing and GIS Techniques. Nat. Hazards 2013, 65, 1723–1743. [Google Scholar] [CrossRef]
  67. Chen, W.; Panahi, M.; Pourghasemi, H.R. Performance Evaluation of GIS-Based New Ensemble Data Mining Techniques of Adaptive Neuro-Fuzzy Inference System (ANFIS) with Genetic Algorithm (GA), Differential Evolution (DE), and Particle Swarm Optimization (PSO) for Landslide Spatial Modelling. CATENA 2017, 157, 310–324. [Google Scholar] [CrossRef]
  68. Tien Bui, D.; Pradhan, B.; Lofman, O.; Revhaug, I.; Dick, O.B. Landslide Susceptibility Assessment in the Hoa Binh Province of Vietnam: A Comparison of the Levenberg–Marquardt and Bayesian Regularized Neural Networks. Geomorphology 2012, 171–172, 12–29. [Google Scholar] [CrossRef]
  69. Holden, Z.A.; Swanson, A.; Luce, C.H.; Jolly, W.M.; Maneta, M.; Oyler, J.W.; Warren, D.A.; Parsons, R.; Affleck, D. Decreasing Fire Season Precipitation Increased Recent Western US Forest Wildfire Activity. Proc. Natl. Acad. Sci. USA 2018, 115. [Google Scholar] [CrossRef] [PubMed] [Green Version]
  70. Liu, M.; Zhao, J.; Guo, X.; Zhang, Z.; Tan, G.; Yang, J. Study on Climate and Grassland Fire in HulunBuir, Inner Mongolia Autonomous Region, China. Sensors 2017, 17, 616. [Google Scholar] [CrossRef] [Green Version]
  71. Ganteaume, A.; Long-Fournel, M. Driving Factors of Fire Density Can Spatially Vary at the Local Scale in South-Eastern France. Int. J. Wildland Fire 2015, 24, 650. [Google Scholar] [CrossRef]
  72. Rihan, W.; Zhao, J.; Zhang, H.; Guo, X.; Ying, H.; Deng, G.; Li, H. Wildfires on the Mongolian Plateau: Identifying Drivers and Spatial Distributions to Predict Wildfire Probability. Remote Sens. 2019, 11, 2361. [Google Scholar] [CrossRef]
Figure 1. Location of the study site, the red area indicates the area where fires have occurred over the years (2001–2017).
Remotesensing 15 00042 g001
Figure 2. Flowchart of the developed methodology.
Remotesensing 15 00042 g002
Figure 3. Variable importance measure from RF five sub-samples (ae) based on mean decrease accuracy (x-axis). Variable names are also found in Table 1.
Remotesensing 15 00042 g003
Figure 4. ROC curves for the model of ANFIS, PSO-ANFIS, and GA-ANFIS, produced by sensibility and specificity. (a) Training dataset represents success rate of the model, (b) testing dataset represents prediction rate of the model.
Remotesensing 15 00042 g004
Figure 5. Convergence curve of the fitness function (RMSE) for PSO-ANFIS and GA-ANFIS in case of 1000 iterations.
Remotesensing 15 00042 g005
Figure 6. Probability map of wildfire occurrence generated by single ANFIS (a), PSO-ANFIS (b) and GA-ANFIS (c) model.
Remotesensing 15 00042 g006
Figure 7. Distribution of probability levels (a) and fire density (b) in the different wildfire probability maps.
Remotesensing 15 00042 g007
Table 1. Explanatory variables selected to predict the probability of wildfire occurrence.
TypesVariableImplication ScaleSource
ClimatePREPrecipitation0.5˚CRU TS v.4.03 database, British Atmospheric Data Centre (BADC)
DTRDiurnal temperature range
WETRain daily frequency
PDSISelf-calculation Palmer drought index
TMNMonthly minimum temperature
TMXMonthly maximum temperature
PETPotential evapotranspiration
TMPMonthly mean temperature
VAPSaturated vapor pressure
FRSFrost daily frequency
TopographyELEElevation30 mGeospatial Data Cloud
SLOPESlope
ASPECTAspect
VegetationNDVINormalized vegetation index500 mNational Aeronautics and Space Administration (NASA)
LUCCLand use/land cover500 m
Anthropogenic factorsACCActual carrying capacity1 kmGridded Livestock of the World (GLW), Harvard Dataverse
DMSPNight-light intensity1 kmGeospatial Data Cloud
Table 2. Model accuracies by RF model.
AccuracySample1Sample2Sample3Sample4Sample5
Average0.93250.93110.93280.93270.9324
Burned0.95520.94960.96130.95530.9549
Unburned0.91130.91380.90610.91160.9114
Table 3. Model performance in the training and validation datasets.
ModelDatasetRMSESensitivitySpecificitySuccess RatePrediction Rate
ANFISTraining0.4320.840.660.796
Validation0.5120.780.470.597
PSO-ANFISTraining0.3530.860.810.898
Validation0.4970.860.810.835
GA-ANFISTraining0.3960.880.690.862
Validation0.5070.830.740.786
Disclaimer/Publisher’s Note: The statements, opinions and data contained in all publications are solely those of the individual author(s) and contributor(s) and not of MDPI and/or the editor(s). MDPI and/or the editor(s) disclaim responsibility for any injury to people or property resulting from any ideas, methods, instructions or products referred to in the content.

