Article

The Influence of Hard Coal Combustion in Individual Household Furnaces on the Atmosphere Quality in Pszczyna (Poland)

by
Danuta Smołka-Danielowska
*,
Mariola Jabłońska
and
Sandra Godziek
University Laboratories of Atmospheric Survey, Faculty of Natural Sciences, Institute of Earth Sciences, University of Silesia, 60, Bedzińska Str., 41-200 Sosnowiec, Poland
*
Author to whom correspondence should be addressed.
Minerals 2021, 11(11), 1155; https://doi.org/10.3390/min11111155
Submission received: 18 September 2021 / Revised: 11 October 2021 / Accepted: 15 October 2021 / Published: 20 October 2021

Abstract

:
This study aimed to determine the influence of ashes produced in the combustion of hard coal and eco-pea coal in individual household furnaces on the air quality in the region under analysis. To achieve this objective, we analysed the chemical and mineral composition of ashes, suspended and respirable dusts with particular attention being paid to phases containing potentially toxic elements (PTE) (As, Cd, Pb, Se, Ni, Ba, Tl, S, Th and U), and sulphur. The research methods used included powder X-ray diffraction, scanning electron microscopy and inductively coupled plasma mass spectrometry. Measurements were taken for PM concentrations, total suspended particulate matter (TSP), gaseous TVOC pollutants (volatile organic compounds) and soot at various altitudes and a mobile laboratory with measuring apparatus placed in the basket of a manned hot-air balloon was used for the analysis. The use of Poland’s unique laboratory allowed us to obtain real-time measurements up to an altitude of 1200 m above sea level. Measurements using unmanned units such as drones do not enable such analyses. The research confirmed that PTE concentrations in ash and its mineral composition are varied. The PM10 and PM2.5 ashes are dominated by sodium chloride, particles containing C, and a substance composed of S + C + O + N + Na. Trace amounts of Pb and Zn sulphides are also present.

1. Introduction

Hard coal is used for energy generation in many countries [1,2,3]. In addition, a significant quantity of resultant emissions is released during combustion into the atmosphere and can have negative impacts on the environment, including human health [4,5]. Hard coal is used in the commercial power sector, in the municipal sector and various industries [6,7,8].
About 2.8–3 billion people use hard coal for heating and cooking meals in their households [9,10]. Pollution from individual household furnaces emitted in the process of hard coal combustion is not recorded. Combustion of hard coal causes emissions of significant amounts of CO2, NOx, SO2 and PM2.5 into the atmosphere, and mainly consists of organic carbon, elemental carbon, polycyclic aromatic hydrocarbons and toxic elements [11,12,13,14,15]. Combustion of hard coal in individual household furnaces is also a common practice for residential heating during the heating season in Poland. In 2018, approximately 12 million ton of hard coal was burned for this purpose [16]. The percentage of households consuming solid fuels fell slightly between 2002 and 2018. We observed a decrease in the percentage share of households burning hard coal and firewood, which is the most readily available and relatively cheap fuel in many regions in Poland. Analysis of the structure of total energy consumption in households broken down into individual energy carriers indicates that Poland was the leader in hard coal consumption in this sector and differed significantly from other EU countries. The share of hard coal in total energy consumption in Polish households is about 32% [17]. For the European Union (EU-28) in 2017, the average share was 2.6%.
Polish cities such as Łódź, Katowice and Kraków were listed among the 20 most polluted cities in the EU in 2020 [17]. The ranking only covers large agglomerations in Poland, but if it were to include pollution levels in smaller towns it would be even worse. In 2020, the town of Pszczyna recorded the highest number of days (106) in which daily PM10 exceeded the permissible level (the norm being 35 days), and a high average annual benzo(a)pyrene concentration (7 ng/m3—target level 1 ng/m3) [16]. Air pollution levels in Pszczyna are very high in the winter season and are mainly connected with the use of hard coal and wood in technologically old boilers for heating buildings. Residents breathe heavily polluted air for almost one-third of the year. Among all the sources in the Silesian Voivodeship emitting pollutants into the air, individual heating devices using solid fuels are responsible for more than 51% of the total PM10 emission, about 44% of the total PM2.5 emission and 94% of the benzo(a)pyrene emission [17].
The mineral and chemical composition of household ash depends on the physical and chemical parameters of the hard coal burned and the combustion technology, because in many cases waste (e.g., plastic, kitchen waste and varnished wood) is additionally burned [18,19,20]. The mineral composition of ashes from individual domestic furnaces is dominated by silicates, aluminosilicates (quartz, feldspar, plagioclase), and clay minerals, carbonates, sulphates and iron oxides [20,21]. Depending on the hard coal burned, Pb and Zn sulphides have also been found in the ashes [21,22]. The chemical composition of ashes from household coal combustion varies, as do the pollutants emitted into the atmosphere [14,19,20,23]. Restrictions concerning fuel combustion were introduced together with replacement programmes of old boilers in households to reduce the negative impact on human health and the environment of the released pollutants. In 2012, an international standard (PN-EN 303-5:2012) [24] was introduced for central heating boilers, which covers criteria relating to issues such as carbon monoxide emissions (must not exceed 500 mg/m3) and tar and dust emissions. In the Silesian Voivodeship, from January 2028 it will no longer be possible to use class 3 and 4 boilers that meet the emission requirements of the PN-EN 303-5:2012 [24] standard. Households should be equipped with boilers that meet the requirements of Commission Regulation (EU) 2015/1185 of 24.04.2015 [25].
This study aimed to evaluate the chemical and mineral composition of ash generated in the process of burning hard coal, in household furnaces in Pszczyna-Piasek (Silesian Voivodeship, Poland) and dust pollutants released into the atmosphere in this process. Using a mobile laboratory with measurement equipment placed in the basket of a manned hot-air balloon, we determined the concentrations of particular PM dusts emitted to the atmosphere and their mineral composition. The use of Poland’s unique laboratory allowed us to obtain real-time measurements up to an altitude of 1200 m above sea level.

2. Samples and Methods

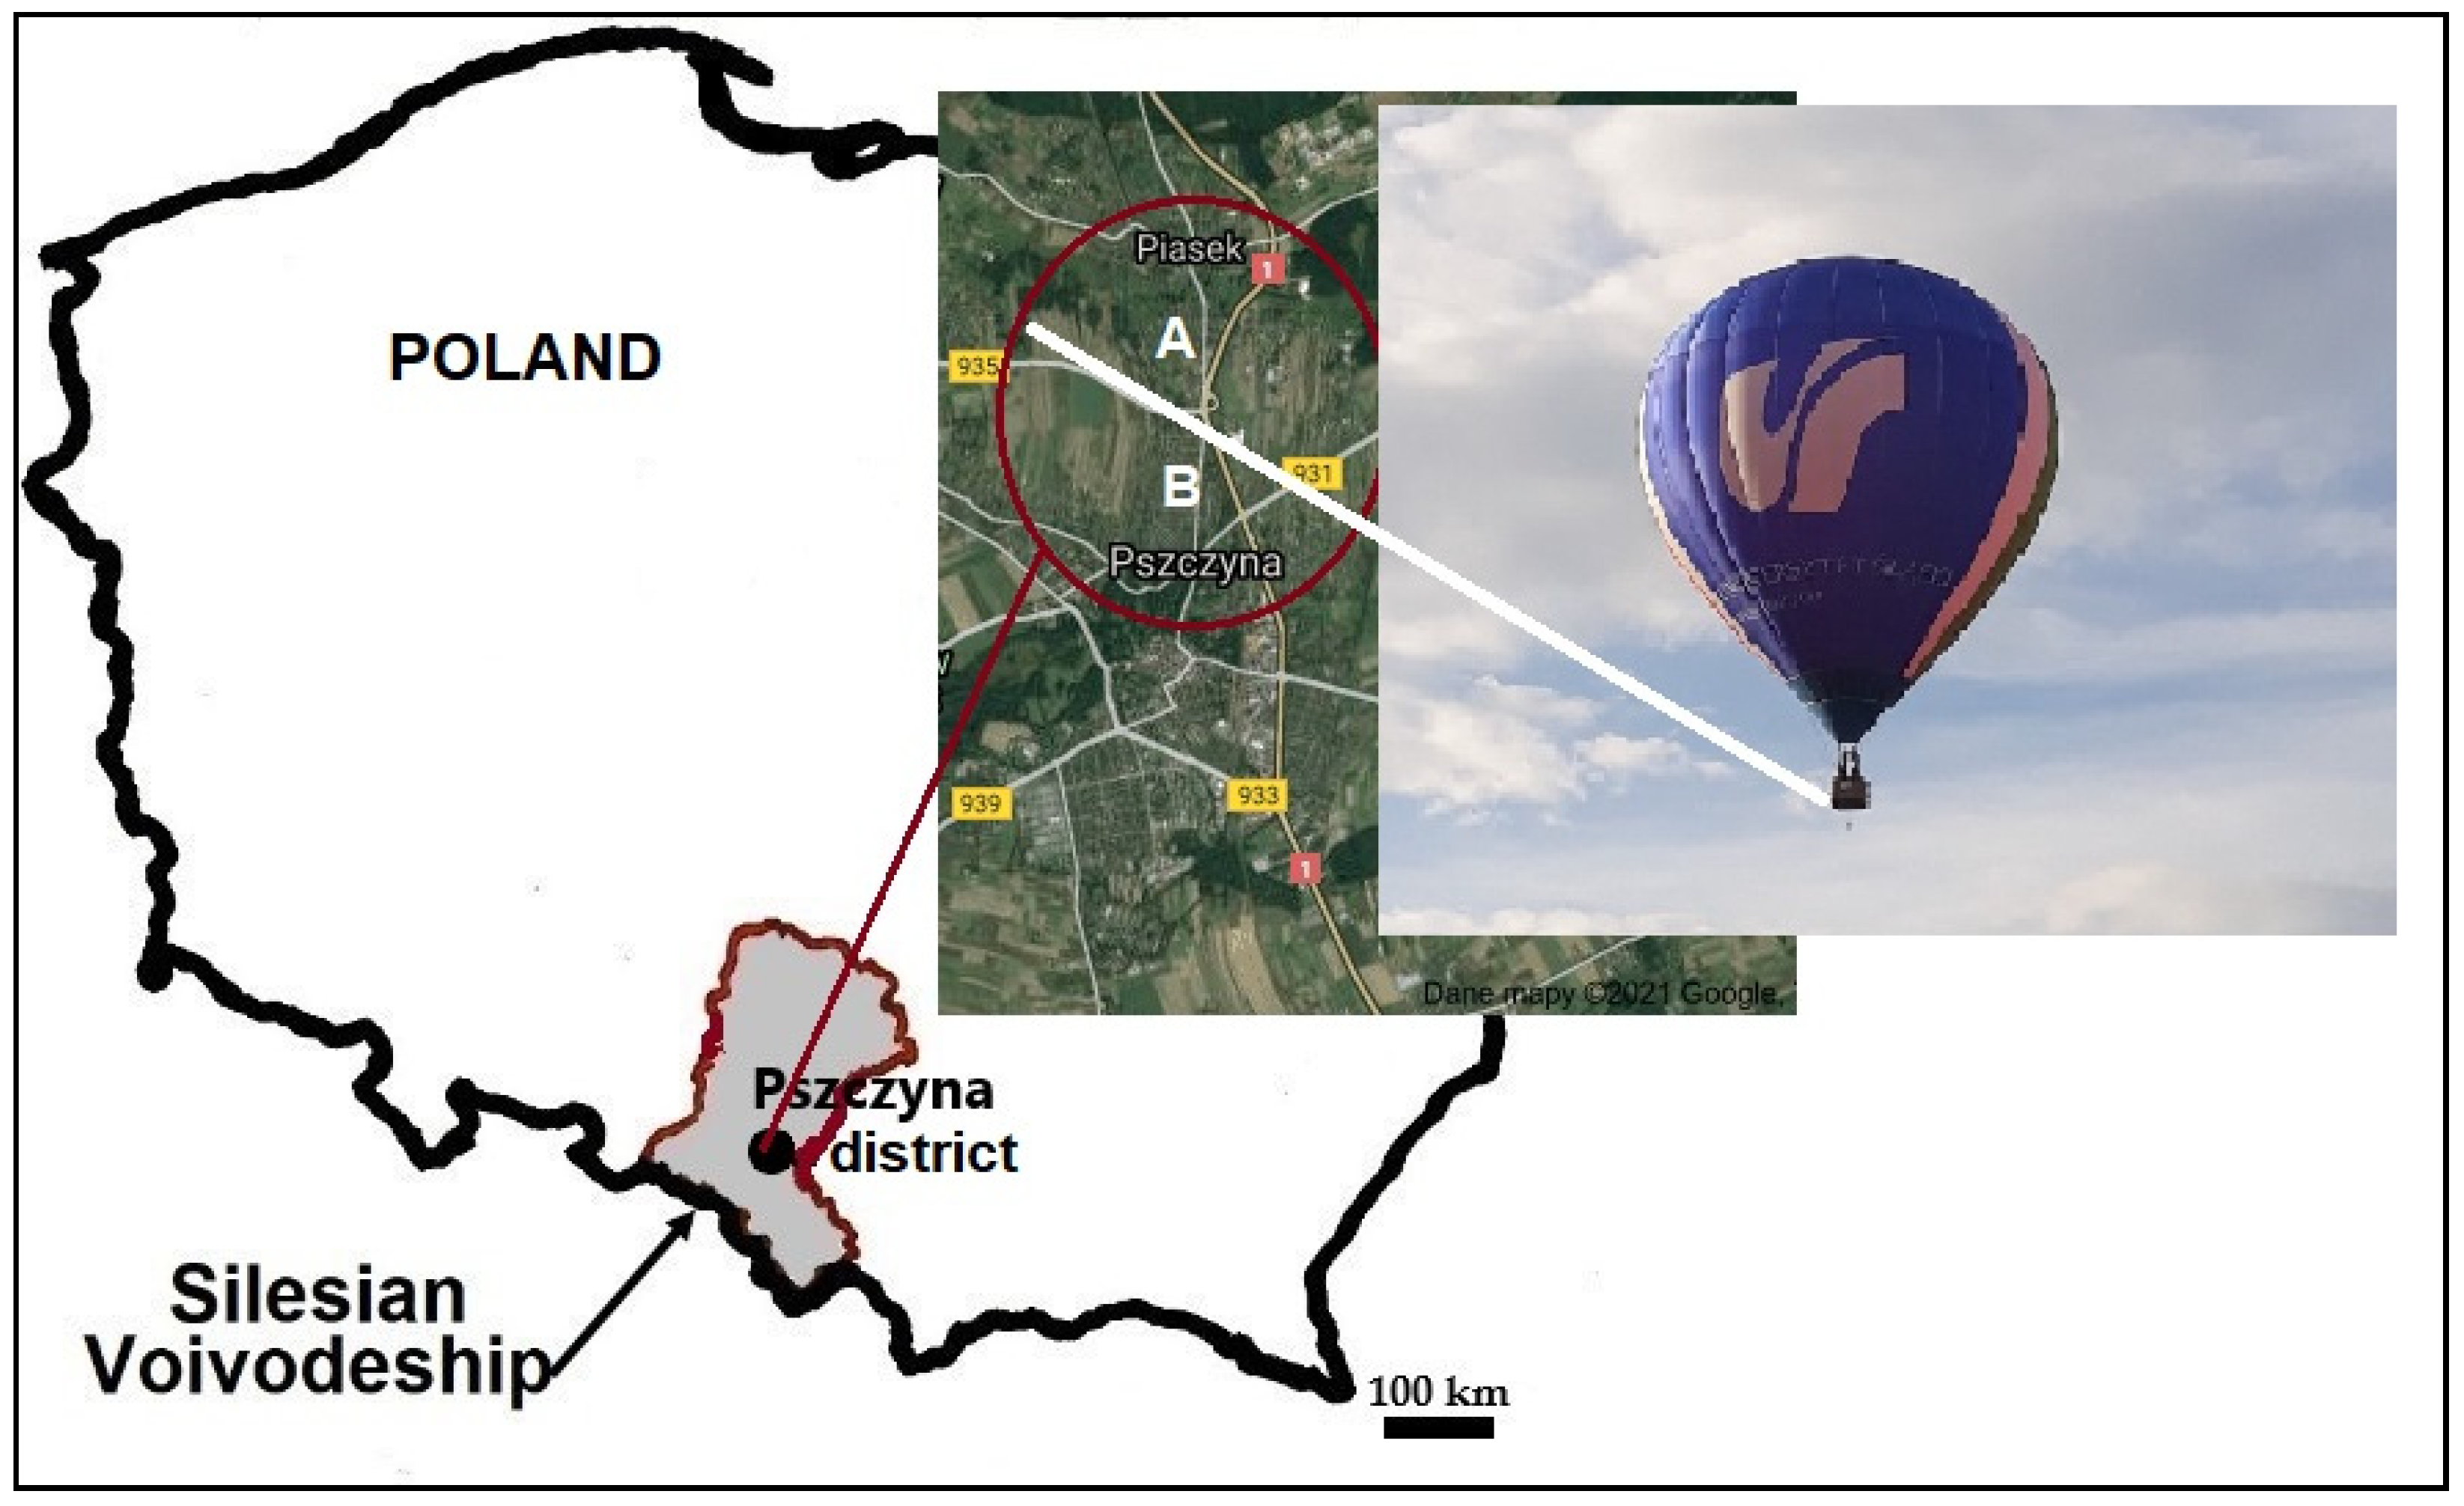
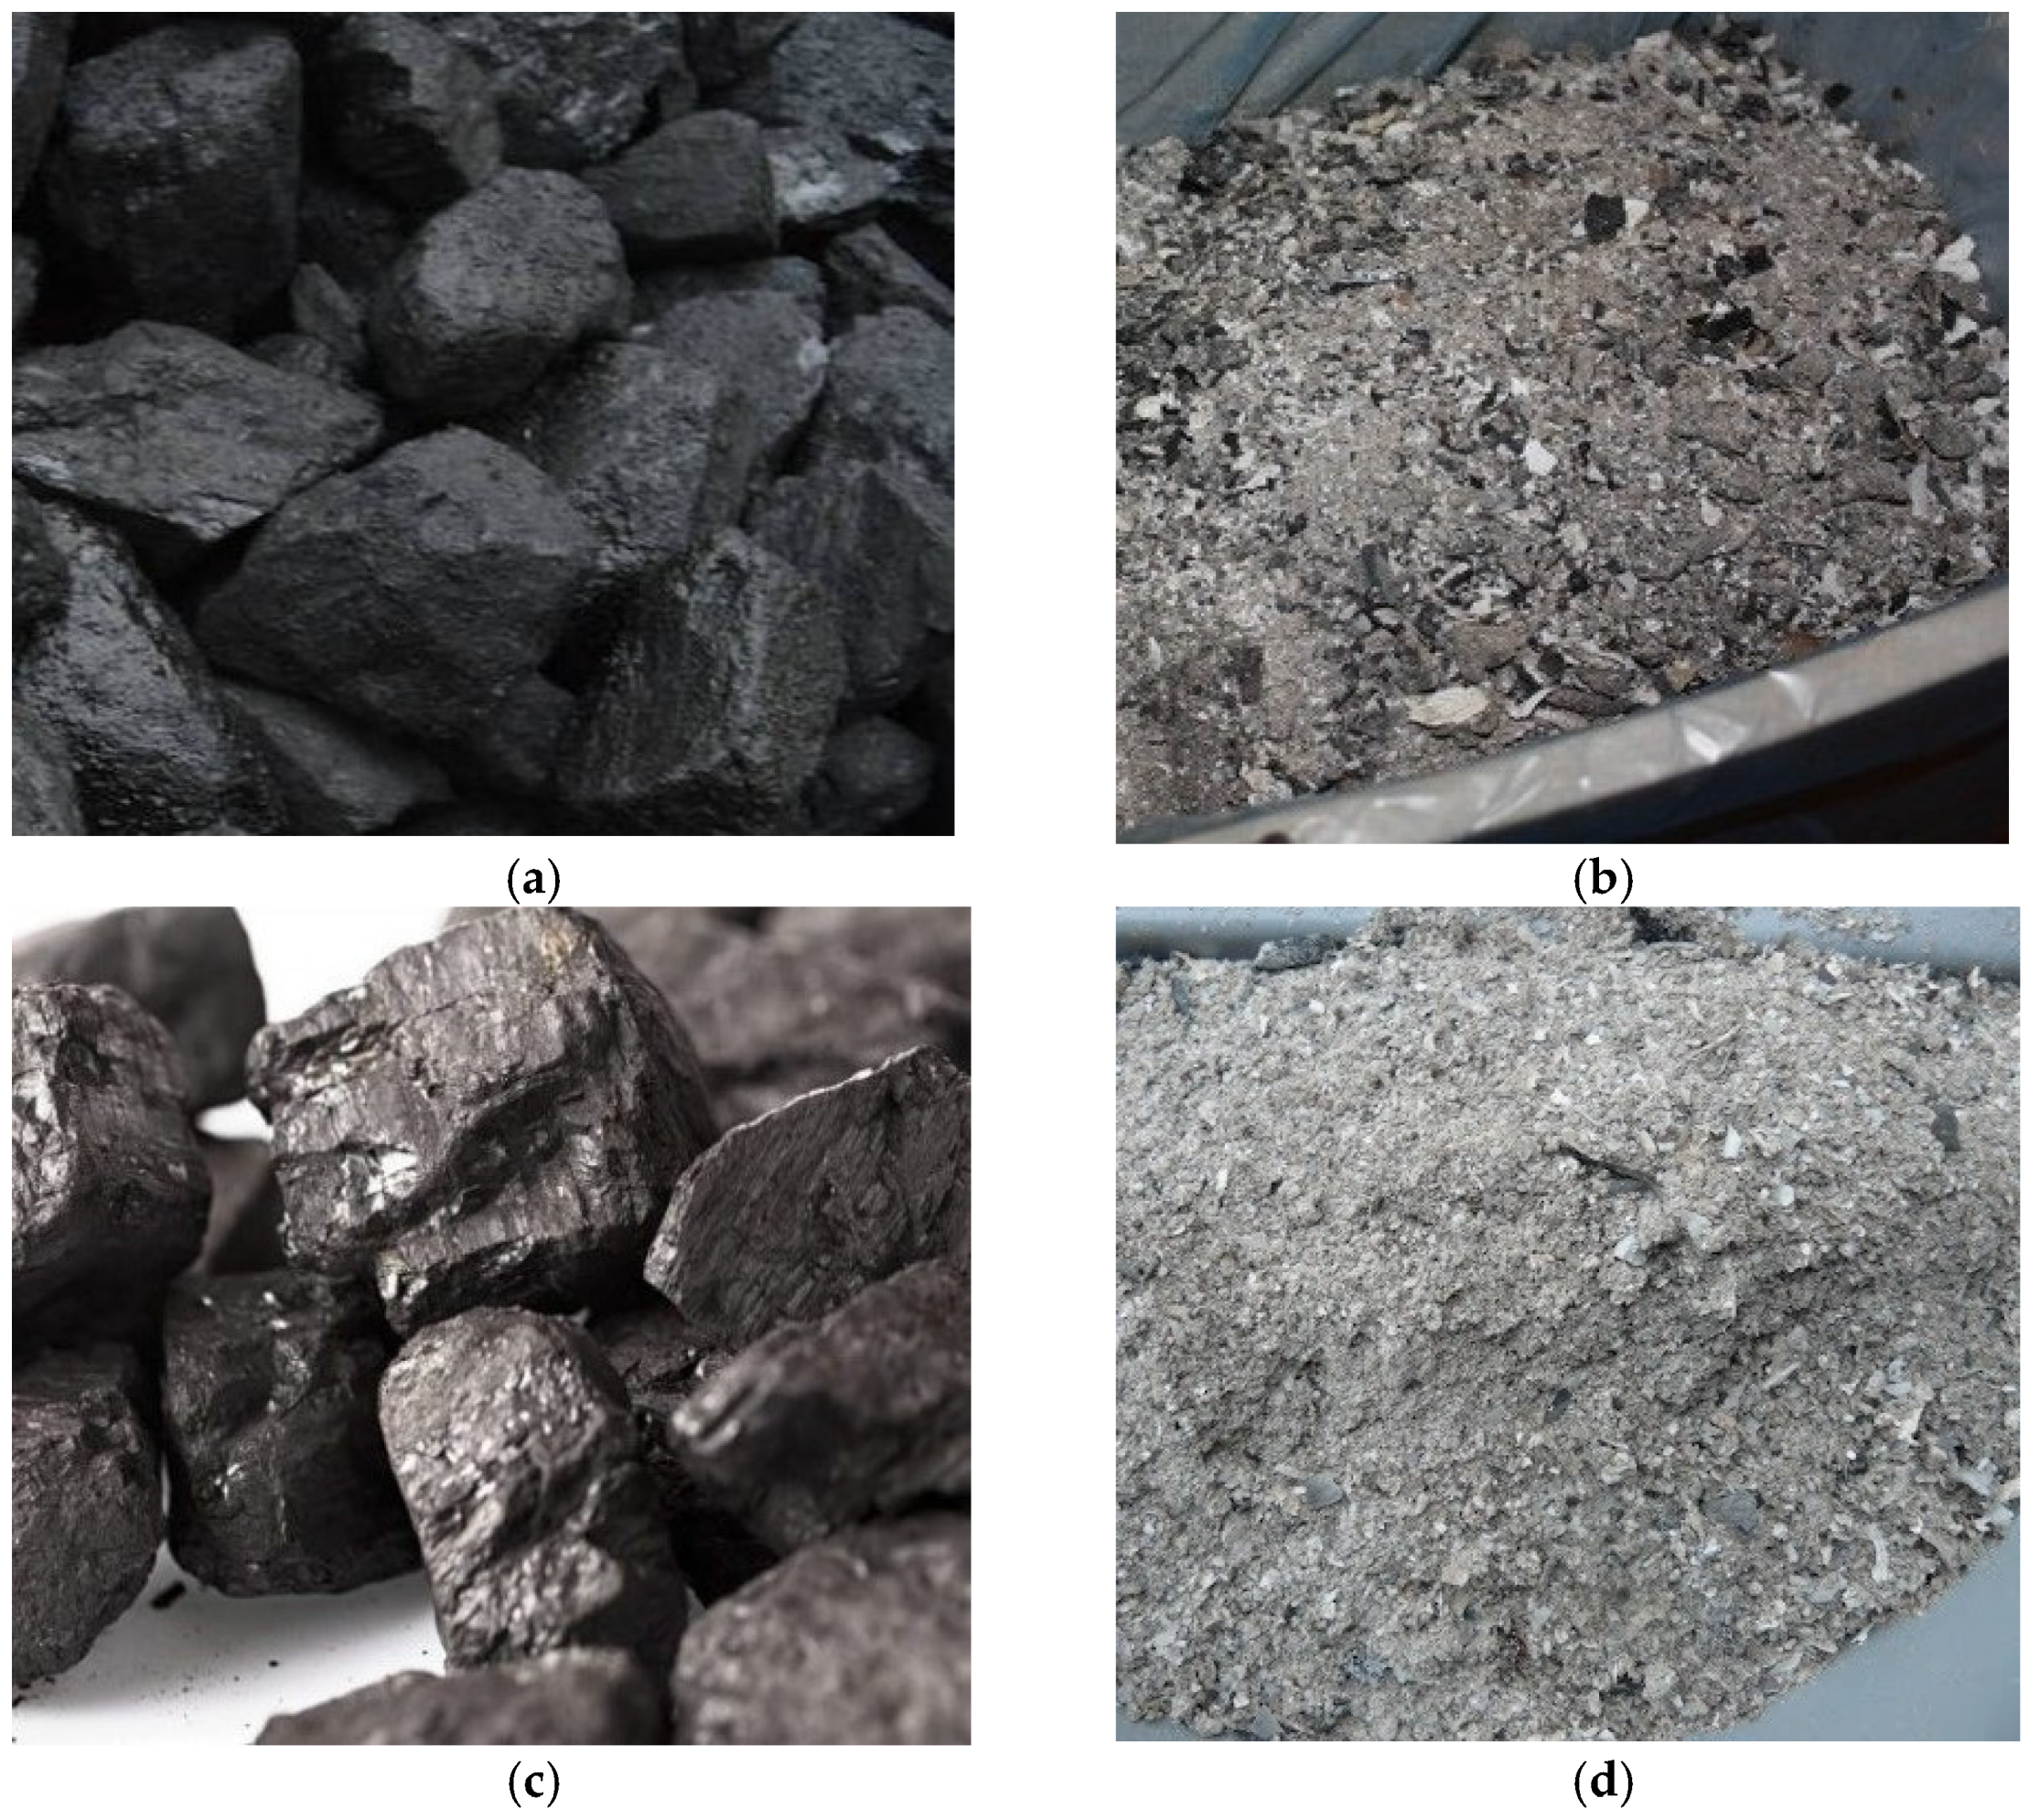
2.1. Samples Collection

The test samples included ashes from the combustion of hard coal and eco-pea coal. Eco-pea coal, in Polish, is a trade name for solid fuel produced from hard coal or lignite for the generation of heat in automatically-powered retort boilers. It is produced from coal having a high calorific value (≥24 MJ/kg) and low sulphur content (≥1%) (max 3.5%; own information). The optimum eco-pea size varies between 5 and 25 mm. Samples were taken from two household boilers of classes 4 and 5, located in Pszczyna-Piasek district (Figure 1).
Hard coal was burned in a household furnace equipped with a class 4 boiler (feeding, lower combustion boiler; point A), and eco-pea coal was burned in a class 5 boiler (point B). The combustion temperature in the households was 270–300 °C (maximum 420 °C in a class 5 boiler). Ash samples were collected during the 2019–2020–2021 heating seasons. A total of 16 samples were collected, including two samples for hard coal and eco-pea, and 12 ash samples (6 samples from each household furnace) (Figure 2).
The hard coal combusted in individual home furnaces comes from the coal mines in the Upper Silesian Coal Basin (USCB). The calorific value of hard coal was 21.5 MJ/kg and the ash content was 25.3%, whereas the calorific value of eco-pea was 25 MJ/kg with an ash content of 11%. On average, about 45 kg of hard coal was burnt per day, which yielded almost 4 kg of ash. Total combustion of a full load of eco-pea coal (100 kg) in class 5 boilers takes about one week, depending on the outdoor temperature. Each load of eco-pea coal in the furnace feeder yields about 8 kg of ash per week. The maximum determined sulphur content was 2.3% for eco-pea coal and 4.7% for hard coal. The ashes feature a large share of unburnt coal, i.e., combustible matter which has not been burnt completely and most often takes the form of degassed carbonised material. The higher the calorific value of the coal, the more unburnt fuel present in the ash. This is caused primarily by poor quality fuel, unskilful combustion, and incorrect boiler operation.
The balloon flights were organised in the winter season with the air temperature being 0–3 °C, atmospheric pressure 987 hPa, humidity between 54% and 72%, and minimal wind speed (2 m/s). PM10 and PM2.5 samples were collected using appropriate heads on MILIPORE Teflon filters with a diameter of 37 mm and pore diameter of 1µm. Onelife aspirators with a flow rate of 26 dm3/min were used. Dust samples were taken above ground level and altitudes of 200 to 500 m above ground level using the balloon. The sampling period averaged about 30 min. Analysis of particulate concentration was performed at 10 measurement spots in Pszczyna—Piasek (Figure 1; white line). Measurement of the concentration of suspended dust, gas measurements, and analysis of air pollutants were performed with the use of apparatus from the University Laboratories of Atmospheric Survey at University of Silesia in Katowice. Concentrations of air pollutant dusts were measured using the Optical Particle Sizer (OPS) model 3330 (TSI, Shoreview, MN, USA), which analyses particles in the range from 0.3 to 10 μm. Airborne soot concentrations were also measured using an AE 51 aethalometer (AethLabs, San Francisco, CA, USA).

2.2. Mineral Composition

The ash mineral composition was determined by X-ray diffraction using an X’Pert Pro MPD (multi-purpose diffractometer) PW3040/60 X-ray diffractometer from the PANalytical company, Almelo, Holland. Measurement conditions were lamp power of 40 kV voltage and 40 mA current, analysis range from 3° to 75° 2Θ, meter stroke of 0.01° Θ and pulse count time of 100 s. The crystal structure models were calculated using the ICDD database. Information on the quantitative, relative content of crystalline phases (the method does not take into account the amorphous phase) was obtained based on the Rietveld method. A Quanta 250 scanning electron microscope was used for detailed studies of the phase composition of ashes and dust. Analyses were performed in a high vacuum using a voltage of 15 keV to accelerate ashes and dust. Analyses were undertaken in the Laboratory of Scanning Microscopy at the Faculty of Earth Sciences of the University of Silesia.

2.3. Chemical Composition

Concentrations of potentially toxic elements (As, Cd, Pb, Se, Ni, Ba, Zn, Tl, S, Th and U) in household ash were determined using the ICP-MS method in Canada (Bureau Veritas), using a Sciex-Elan 9000 spectrometer (Perkin Elmer Inc., MA, USA). The method detection limits (MDL) for the elements in question were: As—0.2 ppm; Cd—0.02 ppm; Pb—0.02 ppm; Se—0.2 ppm; Ni—0.1 ppm; Ba—1.0 ppm; Zn—0.2 ppm; Tl—0.05 ppm; Th—0.1 ppm; U—0.1 ppm; S—0.04%. Ash from individual domestic furnaces was analysed based on the STD OREAS 45H and STD OREAS 501D reference materials.

3. Results and Discussion

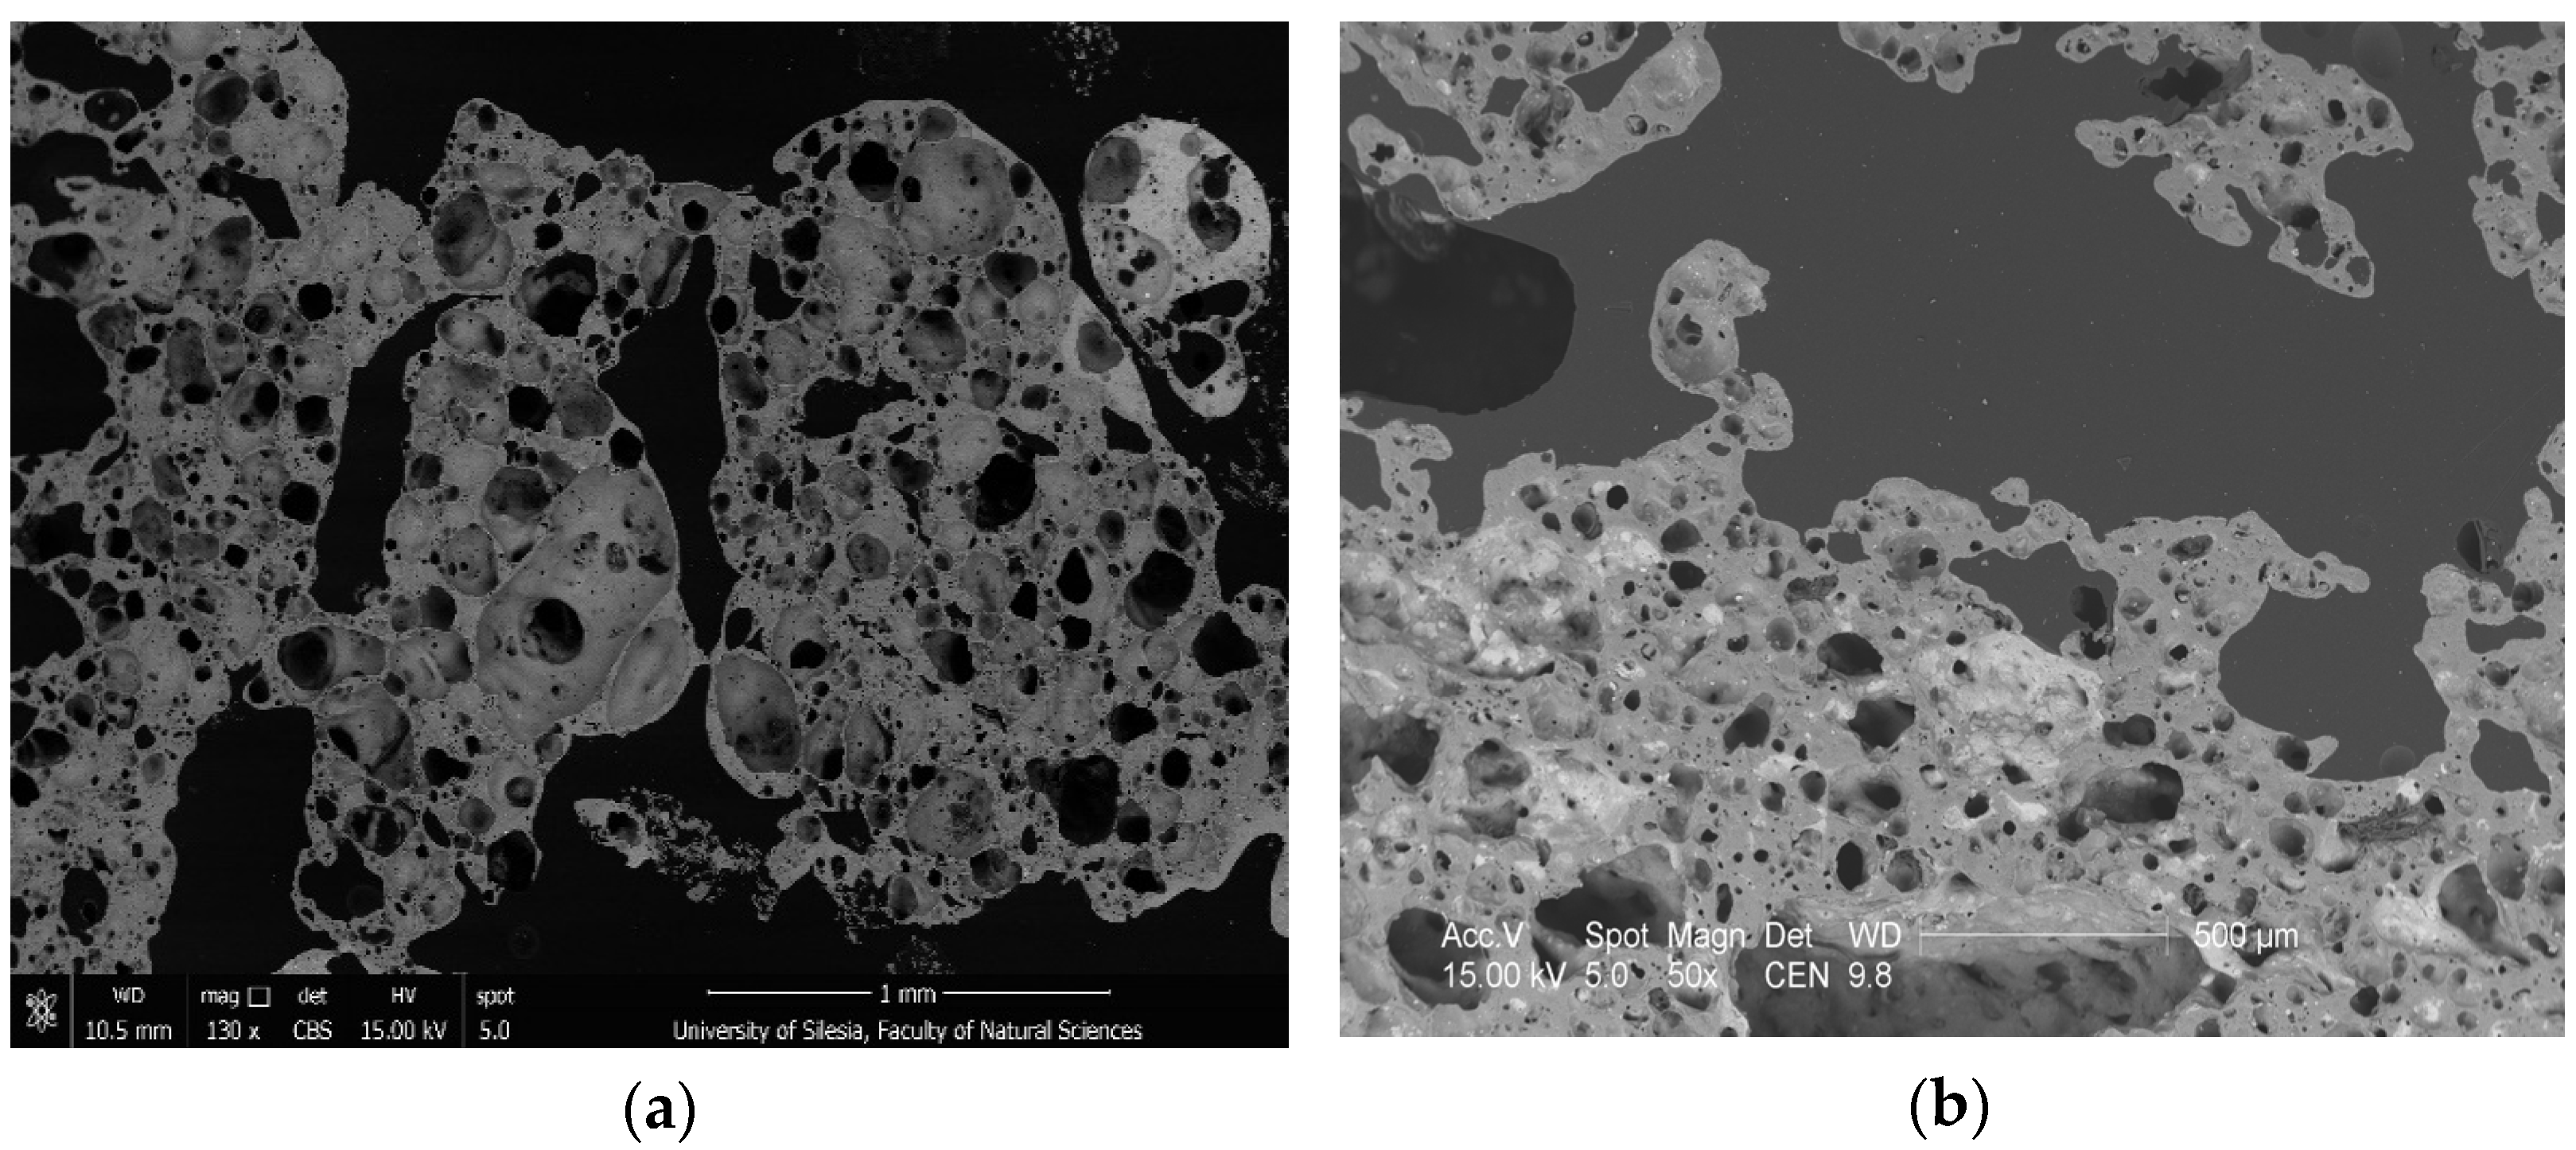
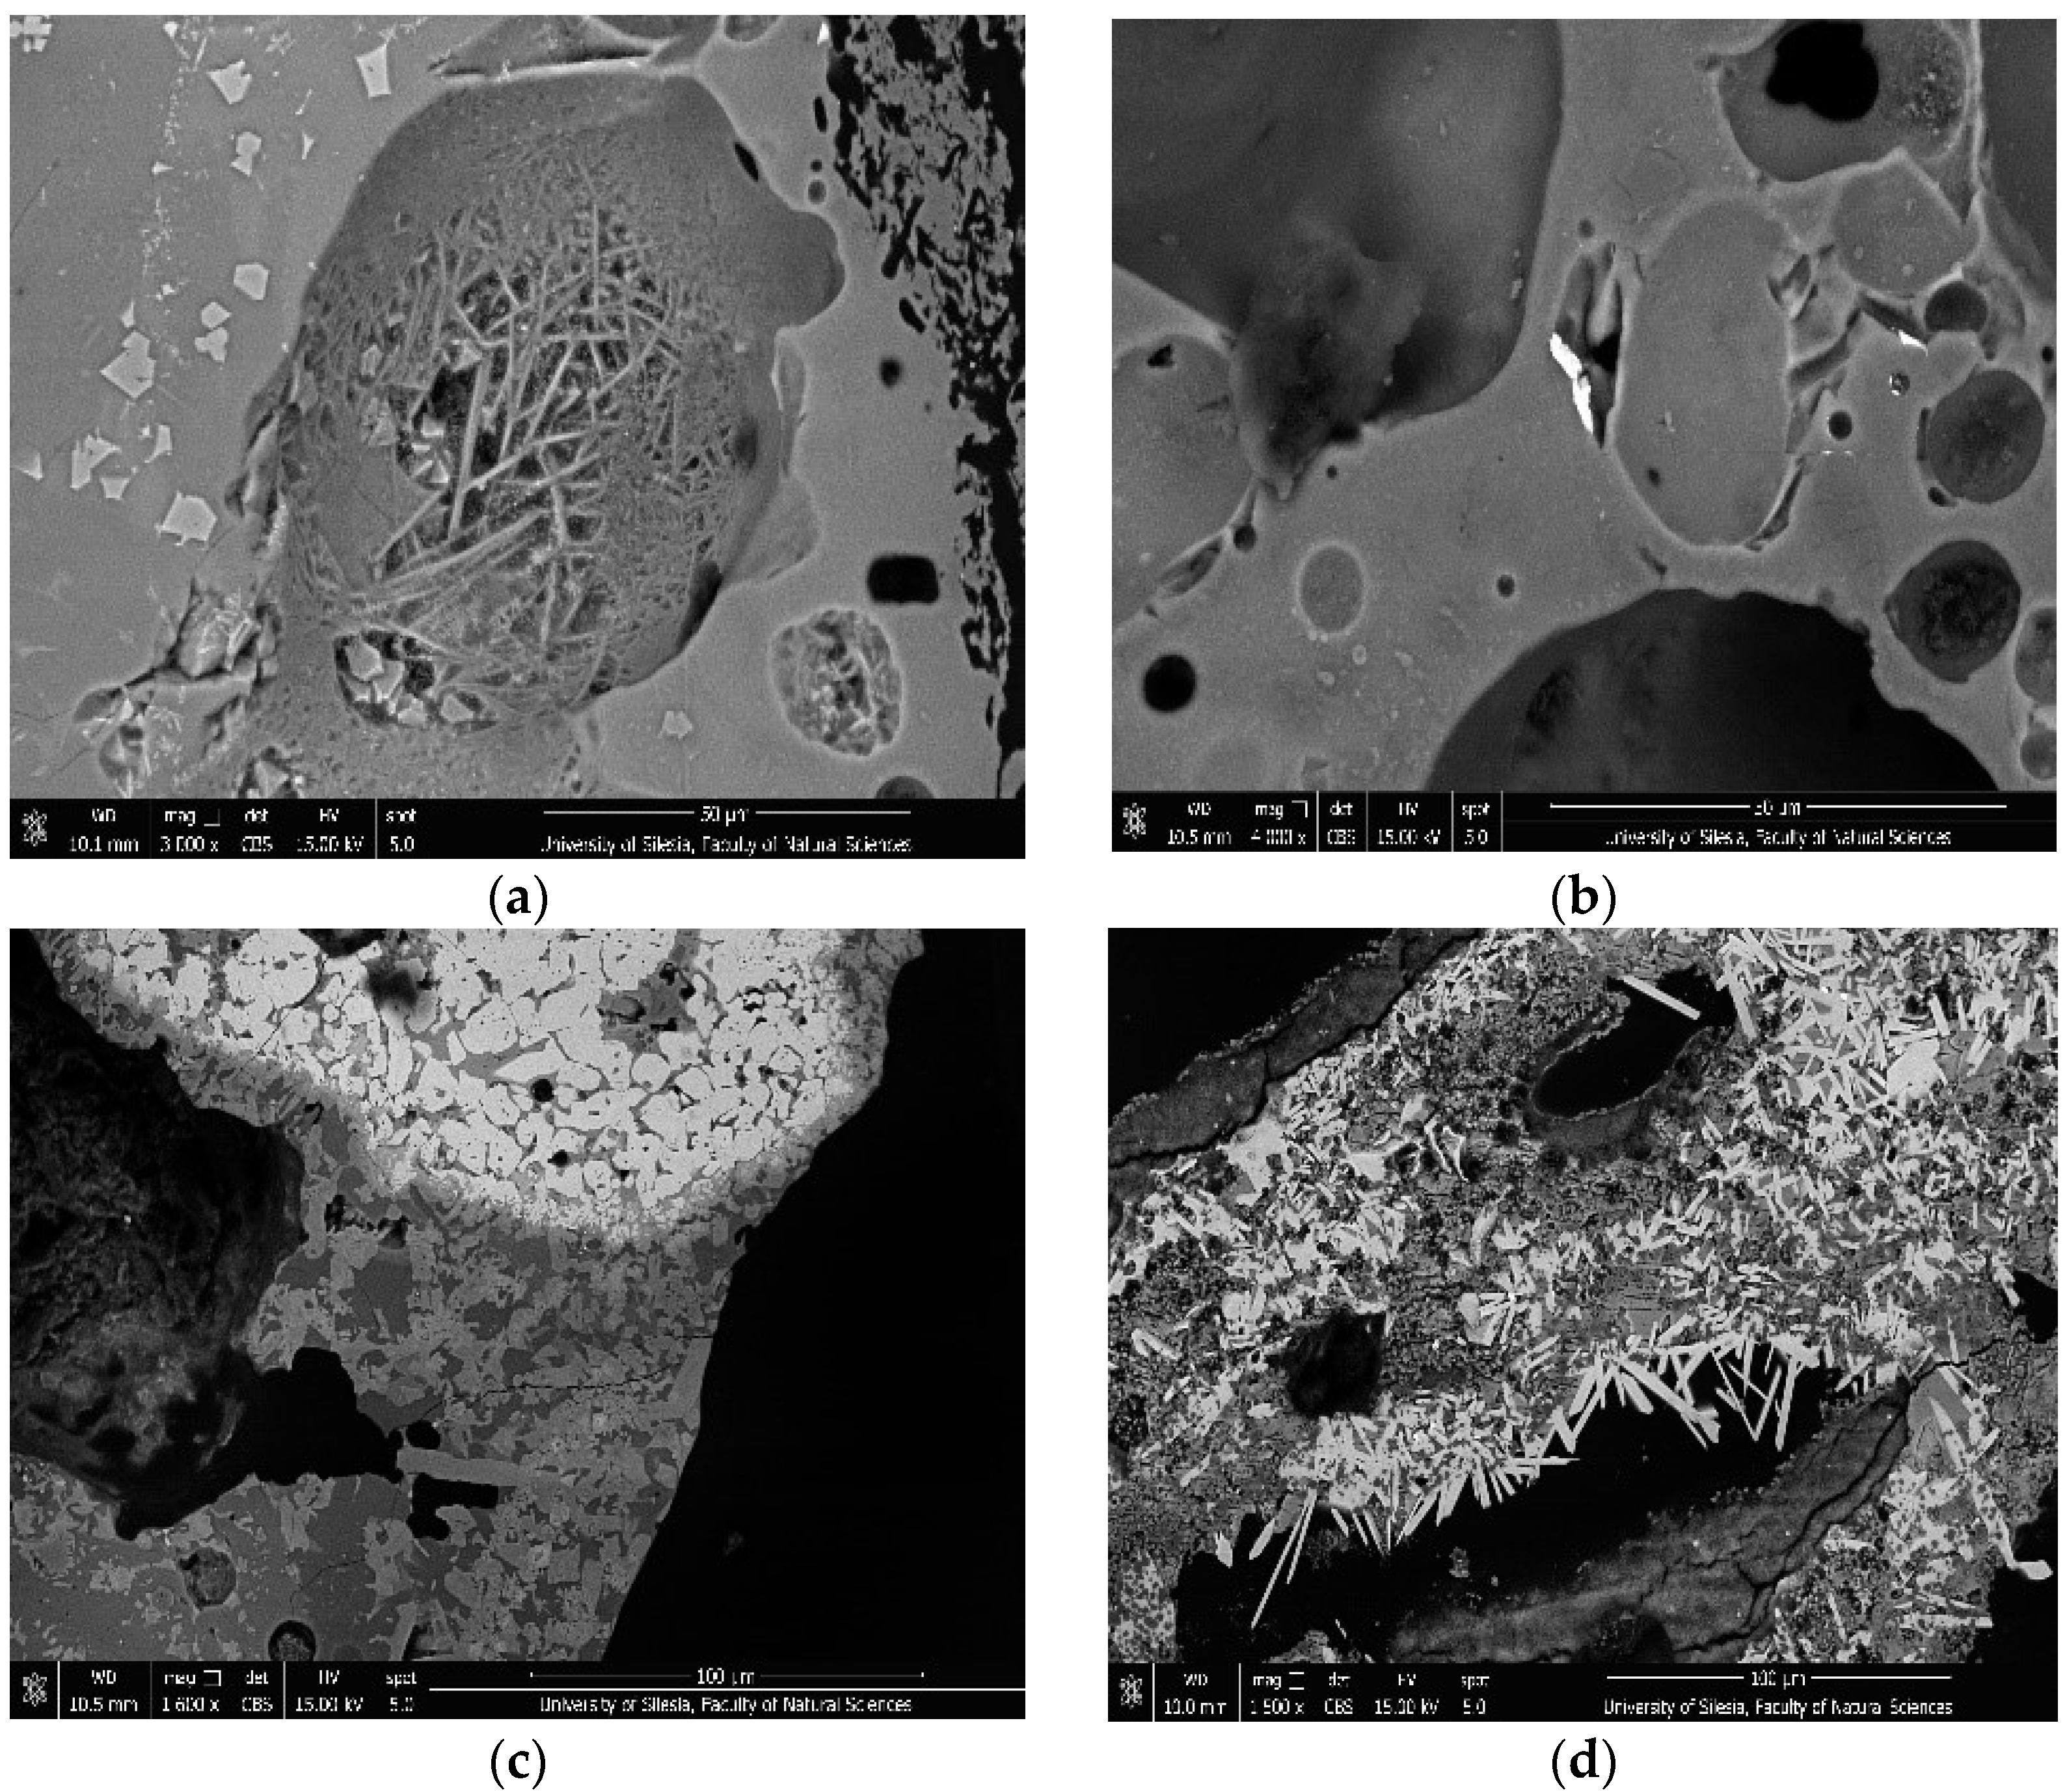
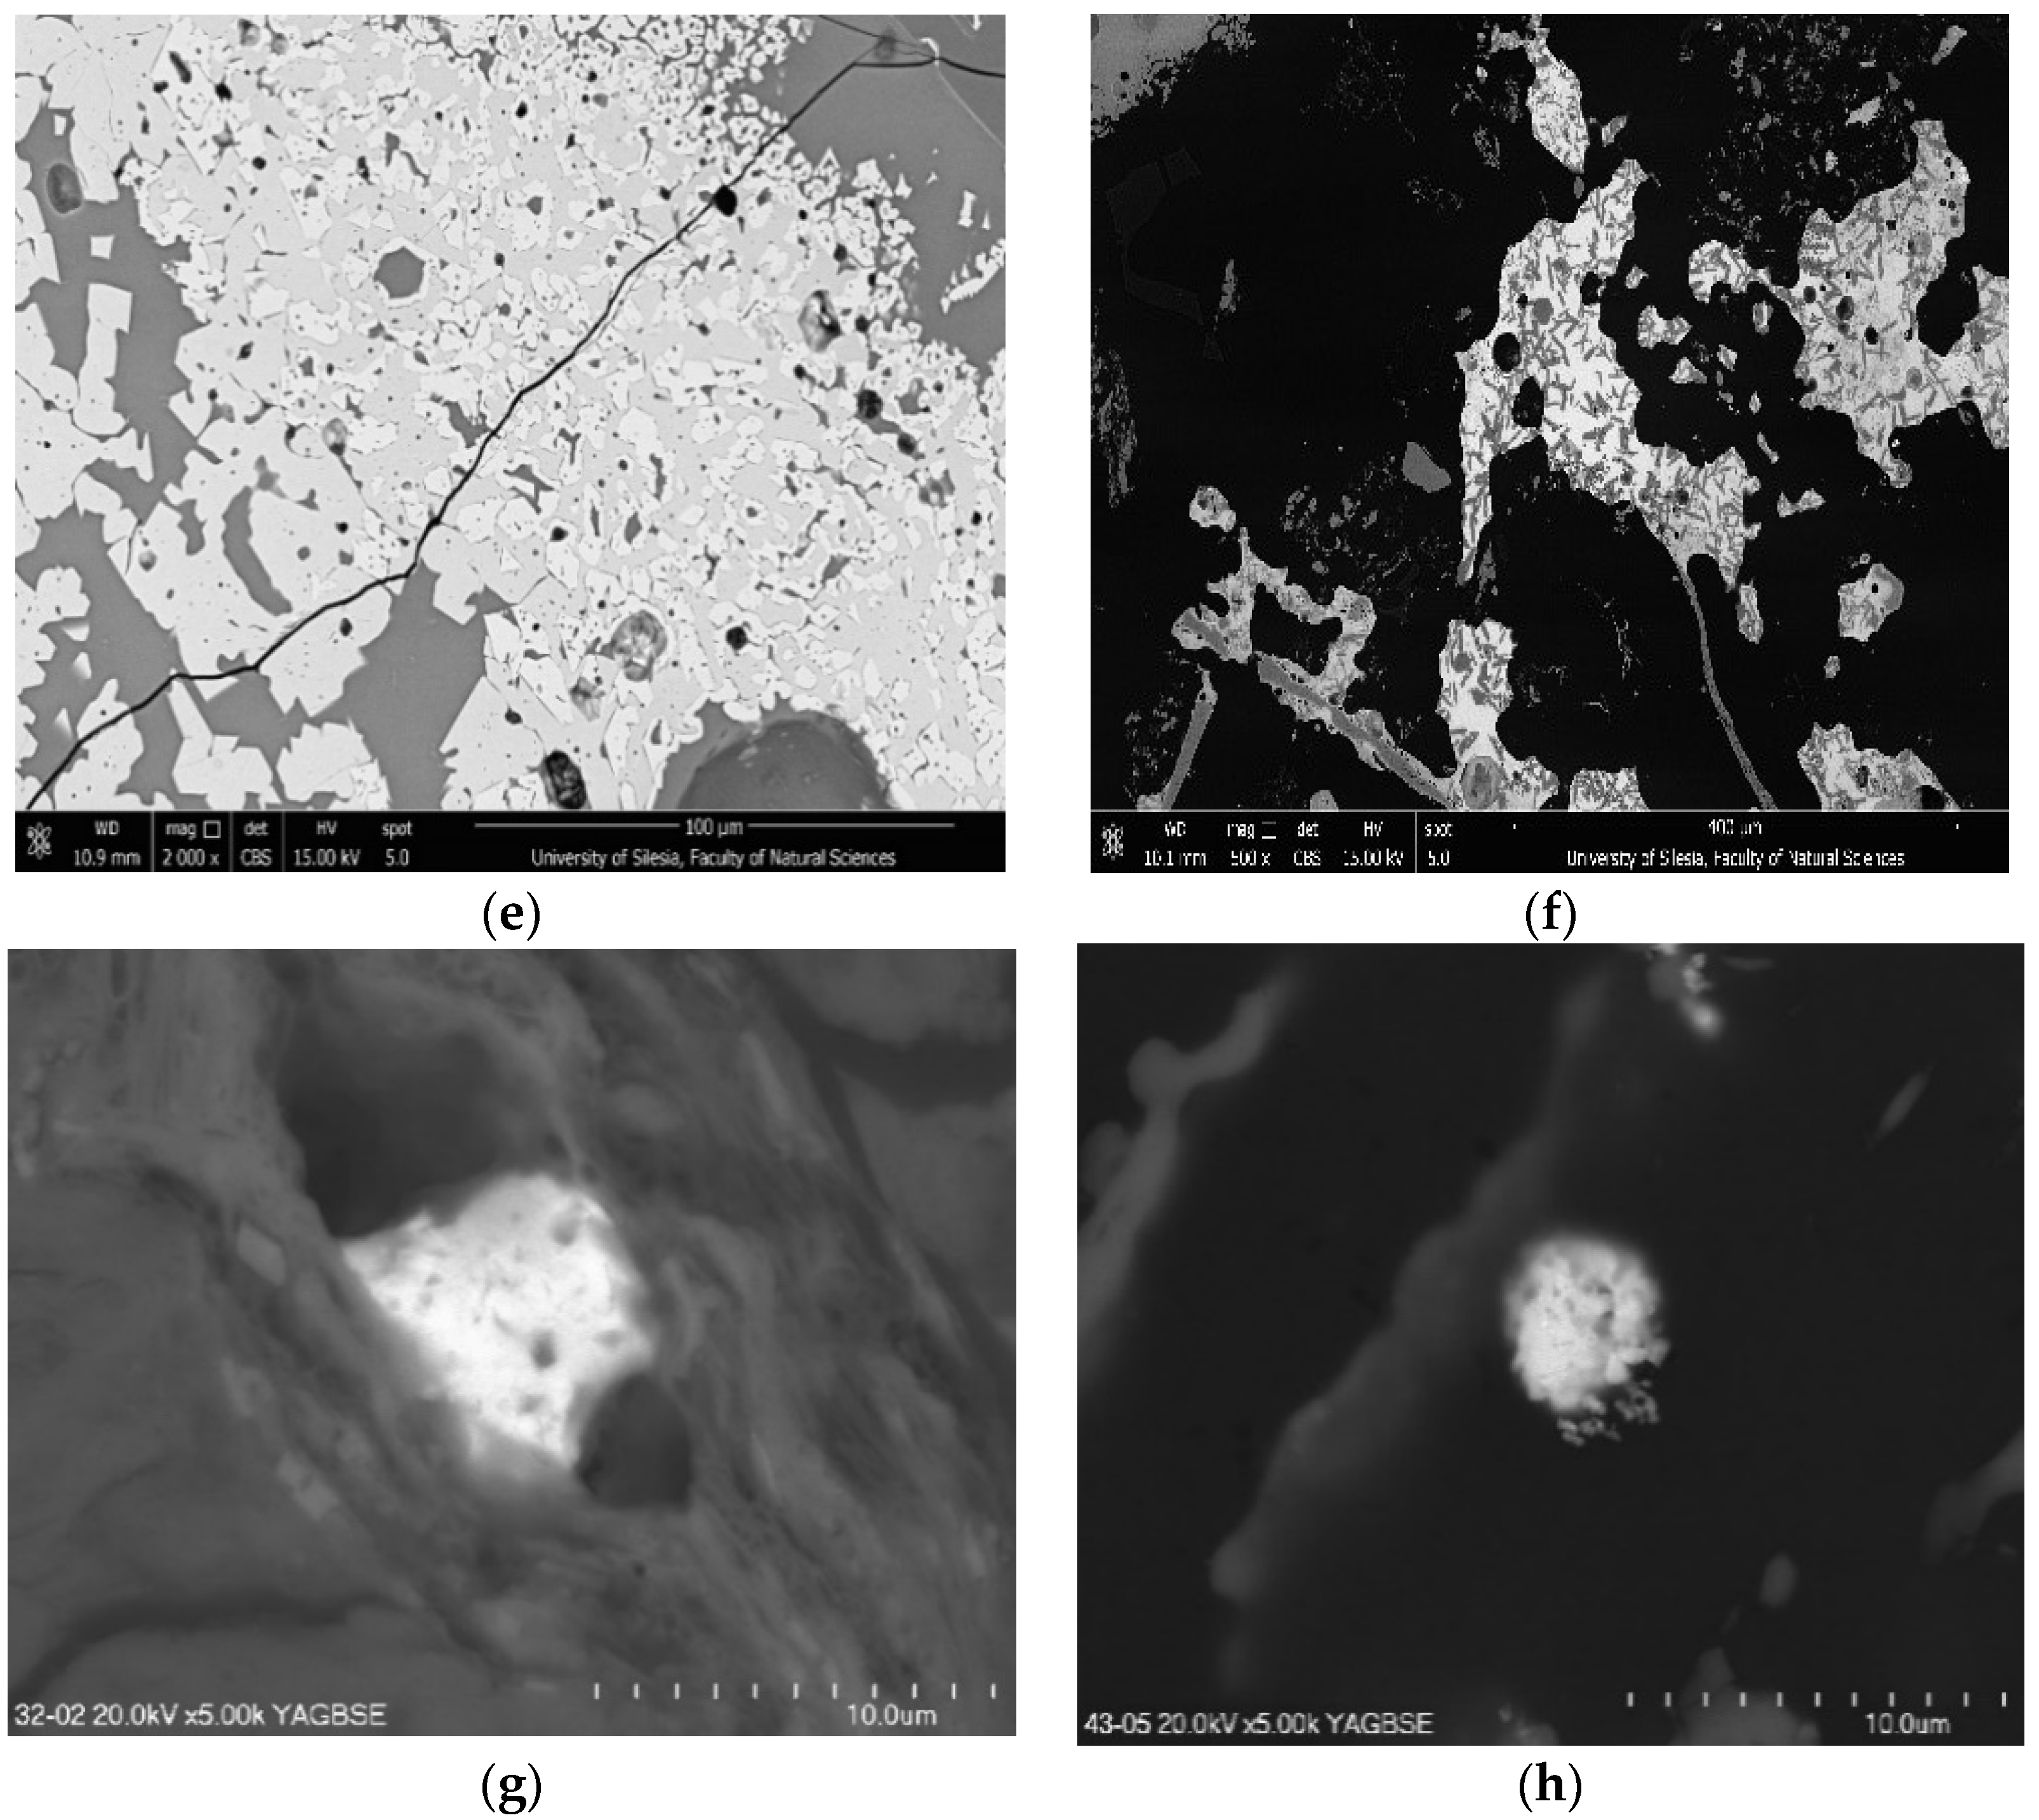
3.1. Mineral Composition of Ashes

Table 1 presents the mineral composition of coal and ash determined using X-ray powder diffraction (XRD). X-ray diffractive analyses show that the amorphous phase makes up about 66% (vol.) of the coal ash from both individual domestic furnaces.
The following minerals (listed in the order of decreasing contents) occur among the identified mineral phases in the examined hard coal ash: gypsum, mullite, quartz, calcite, magnetite, hematite, cristobalite, corundum, feldspars (albite-anorthite), bassanite and sillimanite. Quartz, mullite, spinel, hematite, feldspars (albite-anorthite), gypsum, diopside and cordierite were identified in the ashes from eco-pea coal combustion.
The sequence of determined PTE concentrations in hard coal is as follows: Zn > Ni > Ba > Pb > As > Th > Cd > Tl > Se > U, whereas in eco-pea it is: Ba > Zn > Pb > Ni > As > Cd = Th > U = Se > Tl. With the exception of Ba, ashes from hard coal combustion exhibit higher concentrations of PTEs. Zn and Ba concentrations in eco-pea coal are higher than those in hard coal. This is mainly due to the quality of burned hard coal, combustion technology and boiler class. The results show that not all eco-pea coal can be an ecological alternative to hard coal. High concentrations of Ba, Zn and Pb in eco-pea coal should preclude it from being used in class 5 boilers. The mineral composition of ash from the combustion of eco-pea coal was found to include quartz, mullite, hematite, diopside and sphalerite (in decreasing order in terms of content). These test results are incomparable as there is no published research on them. No diopside was determined in the studied hard coal. The main mineral components in the studied coal, in decreasing order in terms of their content, are quartz, mullite, cristobalite, kaolinite, magnetite, hematite and goethite. Auxiliary components include pyrite, sphalerite and galena. In Polish hard coal, Jonczy et al. [26] mainly found quartz, kaolinite and Fe oxides, and, in smaller amounts, dolomite and muscovite. Parzentny and Róg [27] definitized quartz, feldspars, sulphide minerals (pyrite), clay, carbonate and sulphate minerals in hard coal from the Upper Silesian Coal Basin. The relative contents of quartz, clay minerals, calcite and feldspars (mainly albite) in the coal mineral matter do not change significantly during the enrichment process [28].
The combustion conditions and properties of the hard coal burned significantly influence the ash mineral composition. In addition to common minerals such as silicates and aluminosilicates (quartz, plagioclase-albite, muscovite), Kicińska [20] also found kaolinite and high-temperature mullite, goethite, hematite, calcite, gypsum, anhydrite and diasporite in household ashes. In ash from individual domestic furnaces located in Silesia, Smołka-Danielowska [21] found quartz, anhydrite, hematite, magnetite, calcite, mullite, goethite, periclase, kaolinite, sphalerite, galena and feldspars (albite-anorthite).
The analysis of individual ash particles performed using the SEM coupled with an EDS spectrometer allowed for the observation of the morphology and chemical composition of individual ash particles. Ashes from the combustion of hard coal and eco-pea combustion are partially sintered and they do not differ in their morphology, as shown in Figure 3.
Sintered ash in a class 5 boiler burning eco-pea coal can be problematic due to its negative impact on the hearth and thus the amount of generated heat. It is also indicative of eco-pea being of inferior quality. Sinters are found in class 4 furnaces because the burned hard coal often has inferior physical and chemical parameters. Figure 4a–f shows examples of SEM images taken in the analysed ashes. Mullite was observed in the form of thin columns of various sizes. It usually crystallises into a substance composed of silicates (Figure 4a). Very fine, irregular oxide forms composed of Cr, Ni, Fe were often observed (Figure 4b). Iron oxides mainly occur as feathery forms adsorbed on the aluminosilicate substance (Figure 4c). Gypsum found household ash most often took the form of bars and thin needles (Figure 4d). Diopside, present in ashes from the combustion of eco-pea coal, most often co-occurs with iron oxides, and takes irregular forms (Figure 4e). Corundum (Figure 4f), and a few cordierite grains were also found in the ashes from the combustion of eco-pea coal. Some rare grains of lead sulphide (Figure 4g) and a rare-earth phosphate, monazite, (Ce,La,Nd,Pr,Gd,Sm,Th)(PO4), in which Th was determined (Figure 4h), were found in ashes from hard coal combustion.

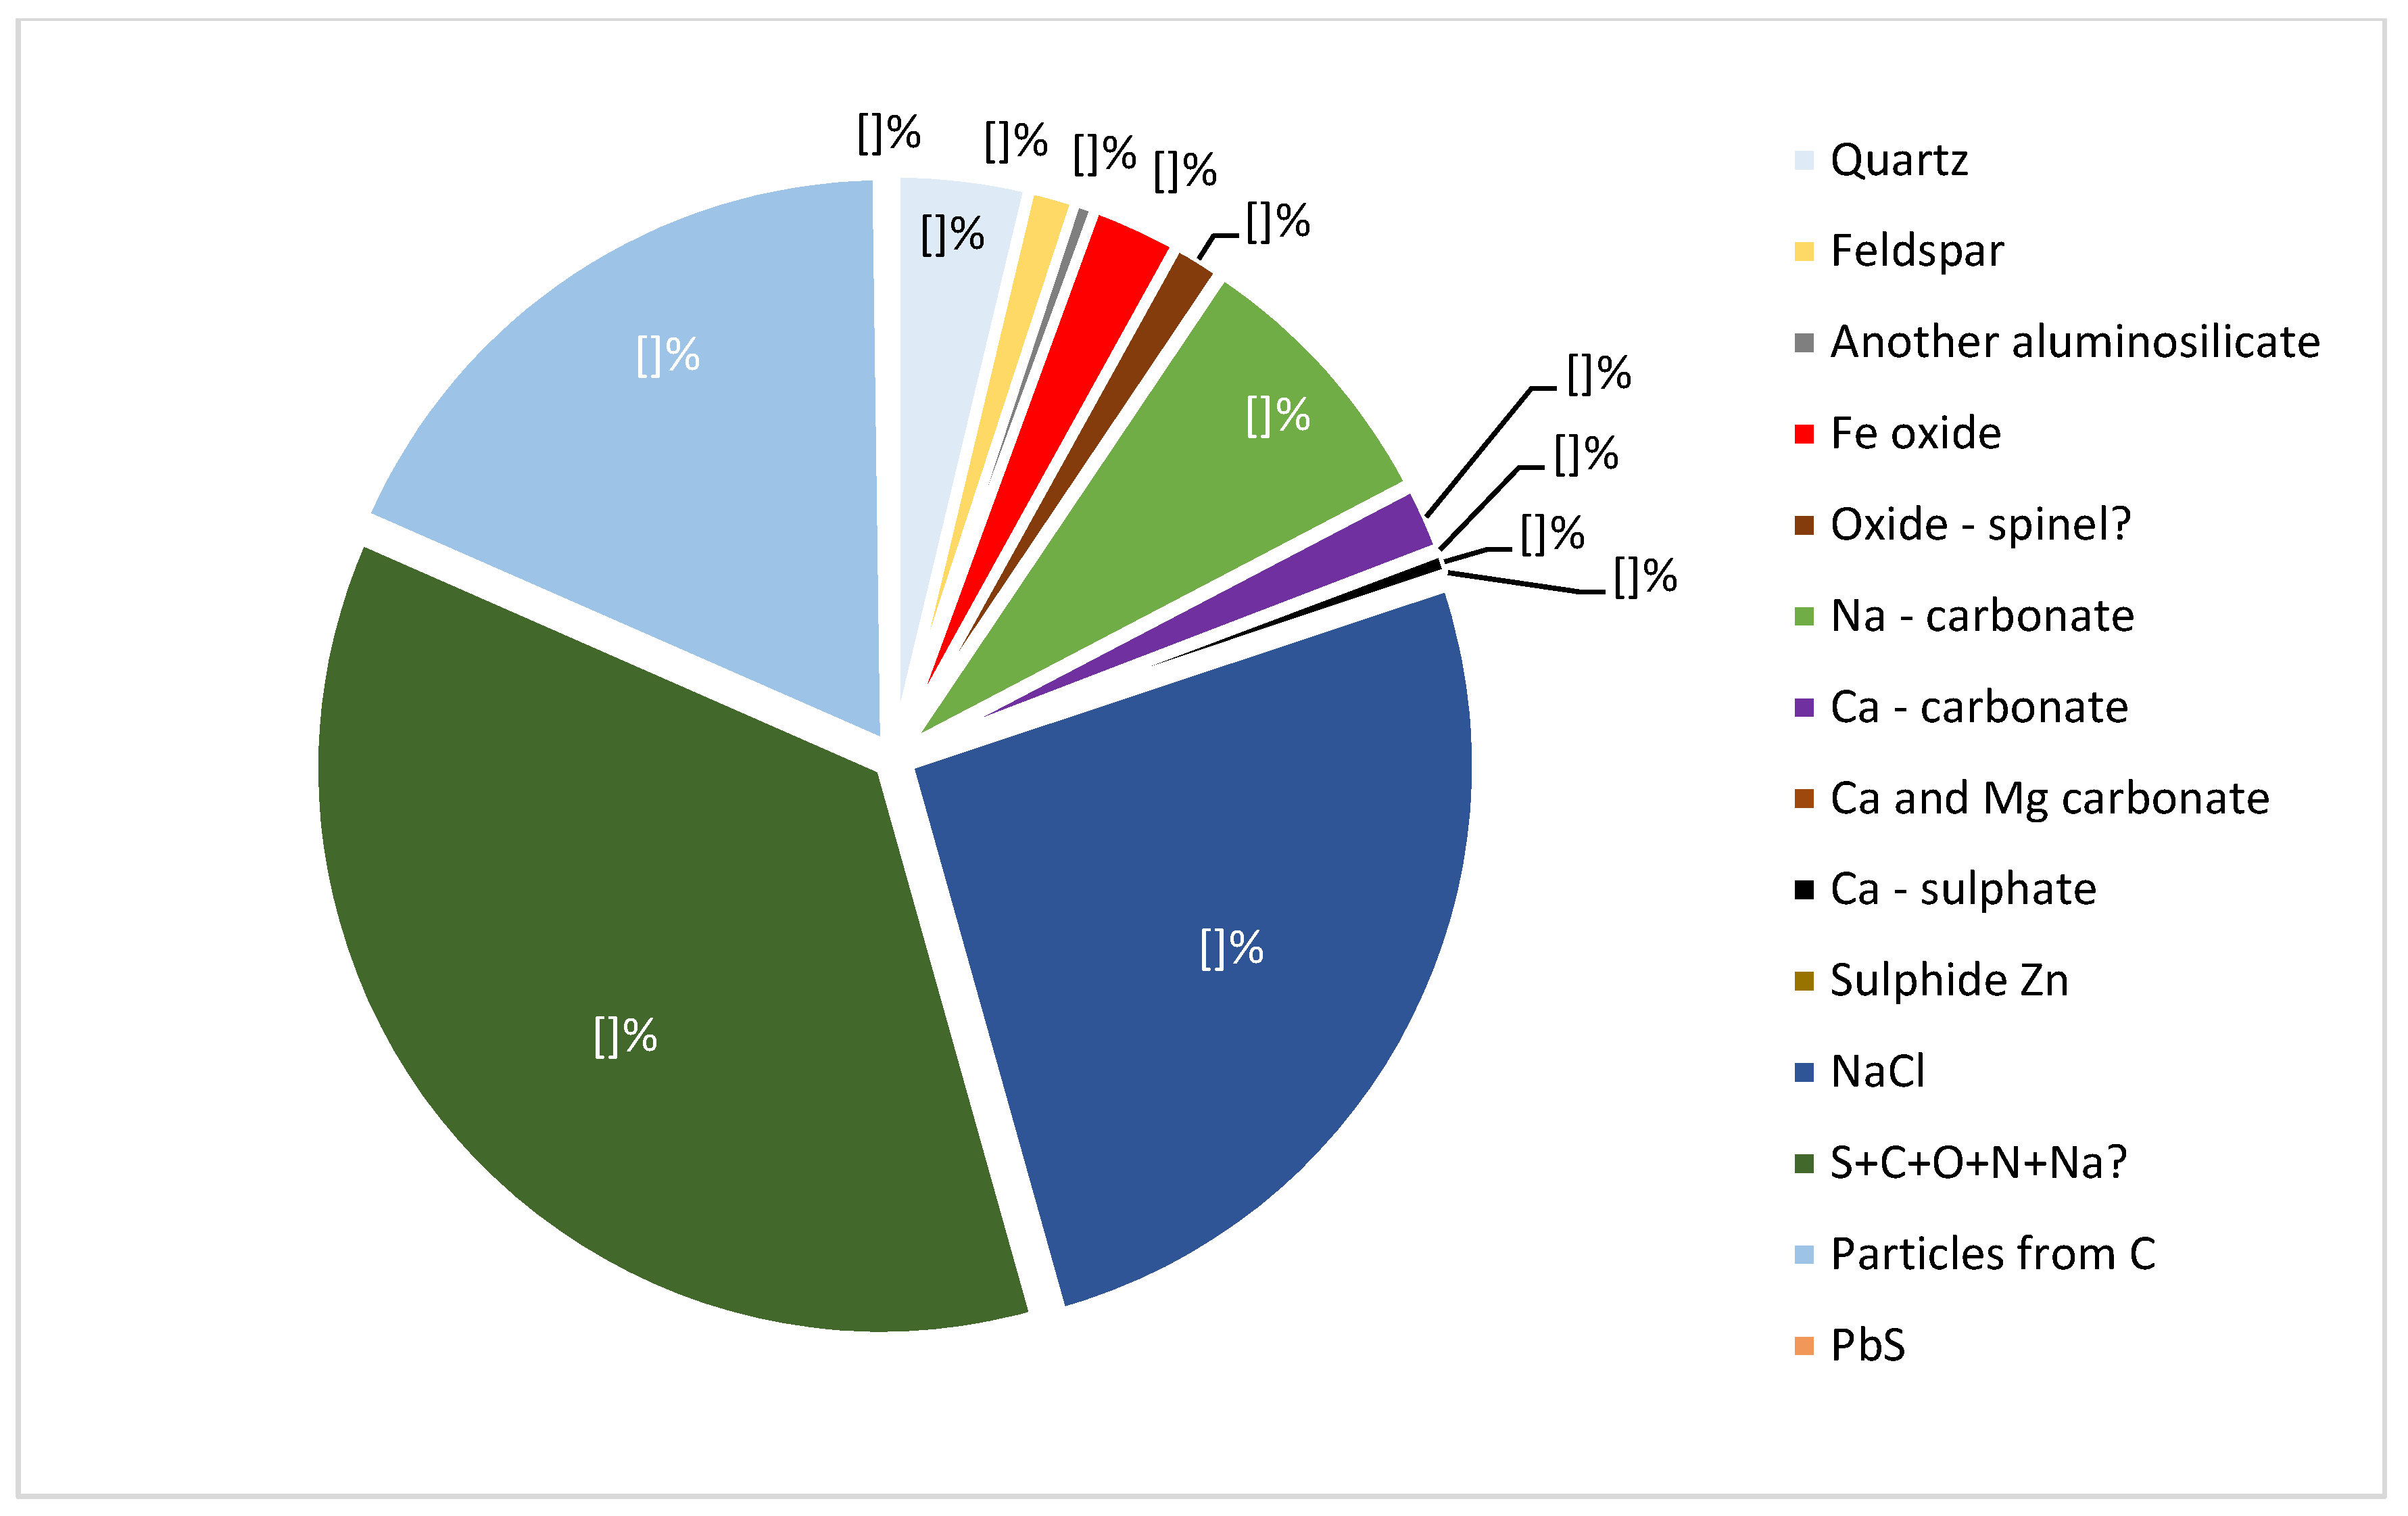
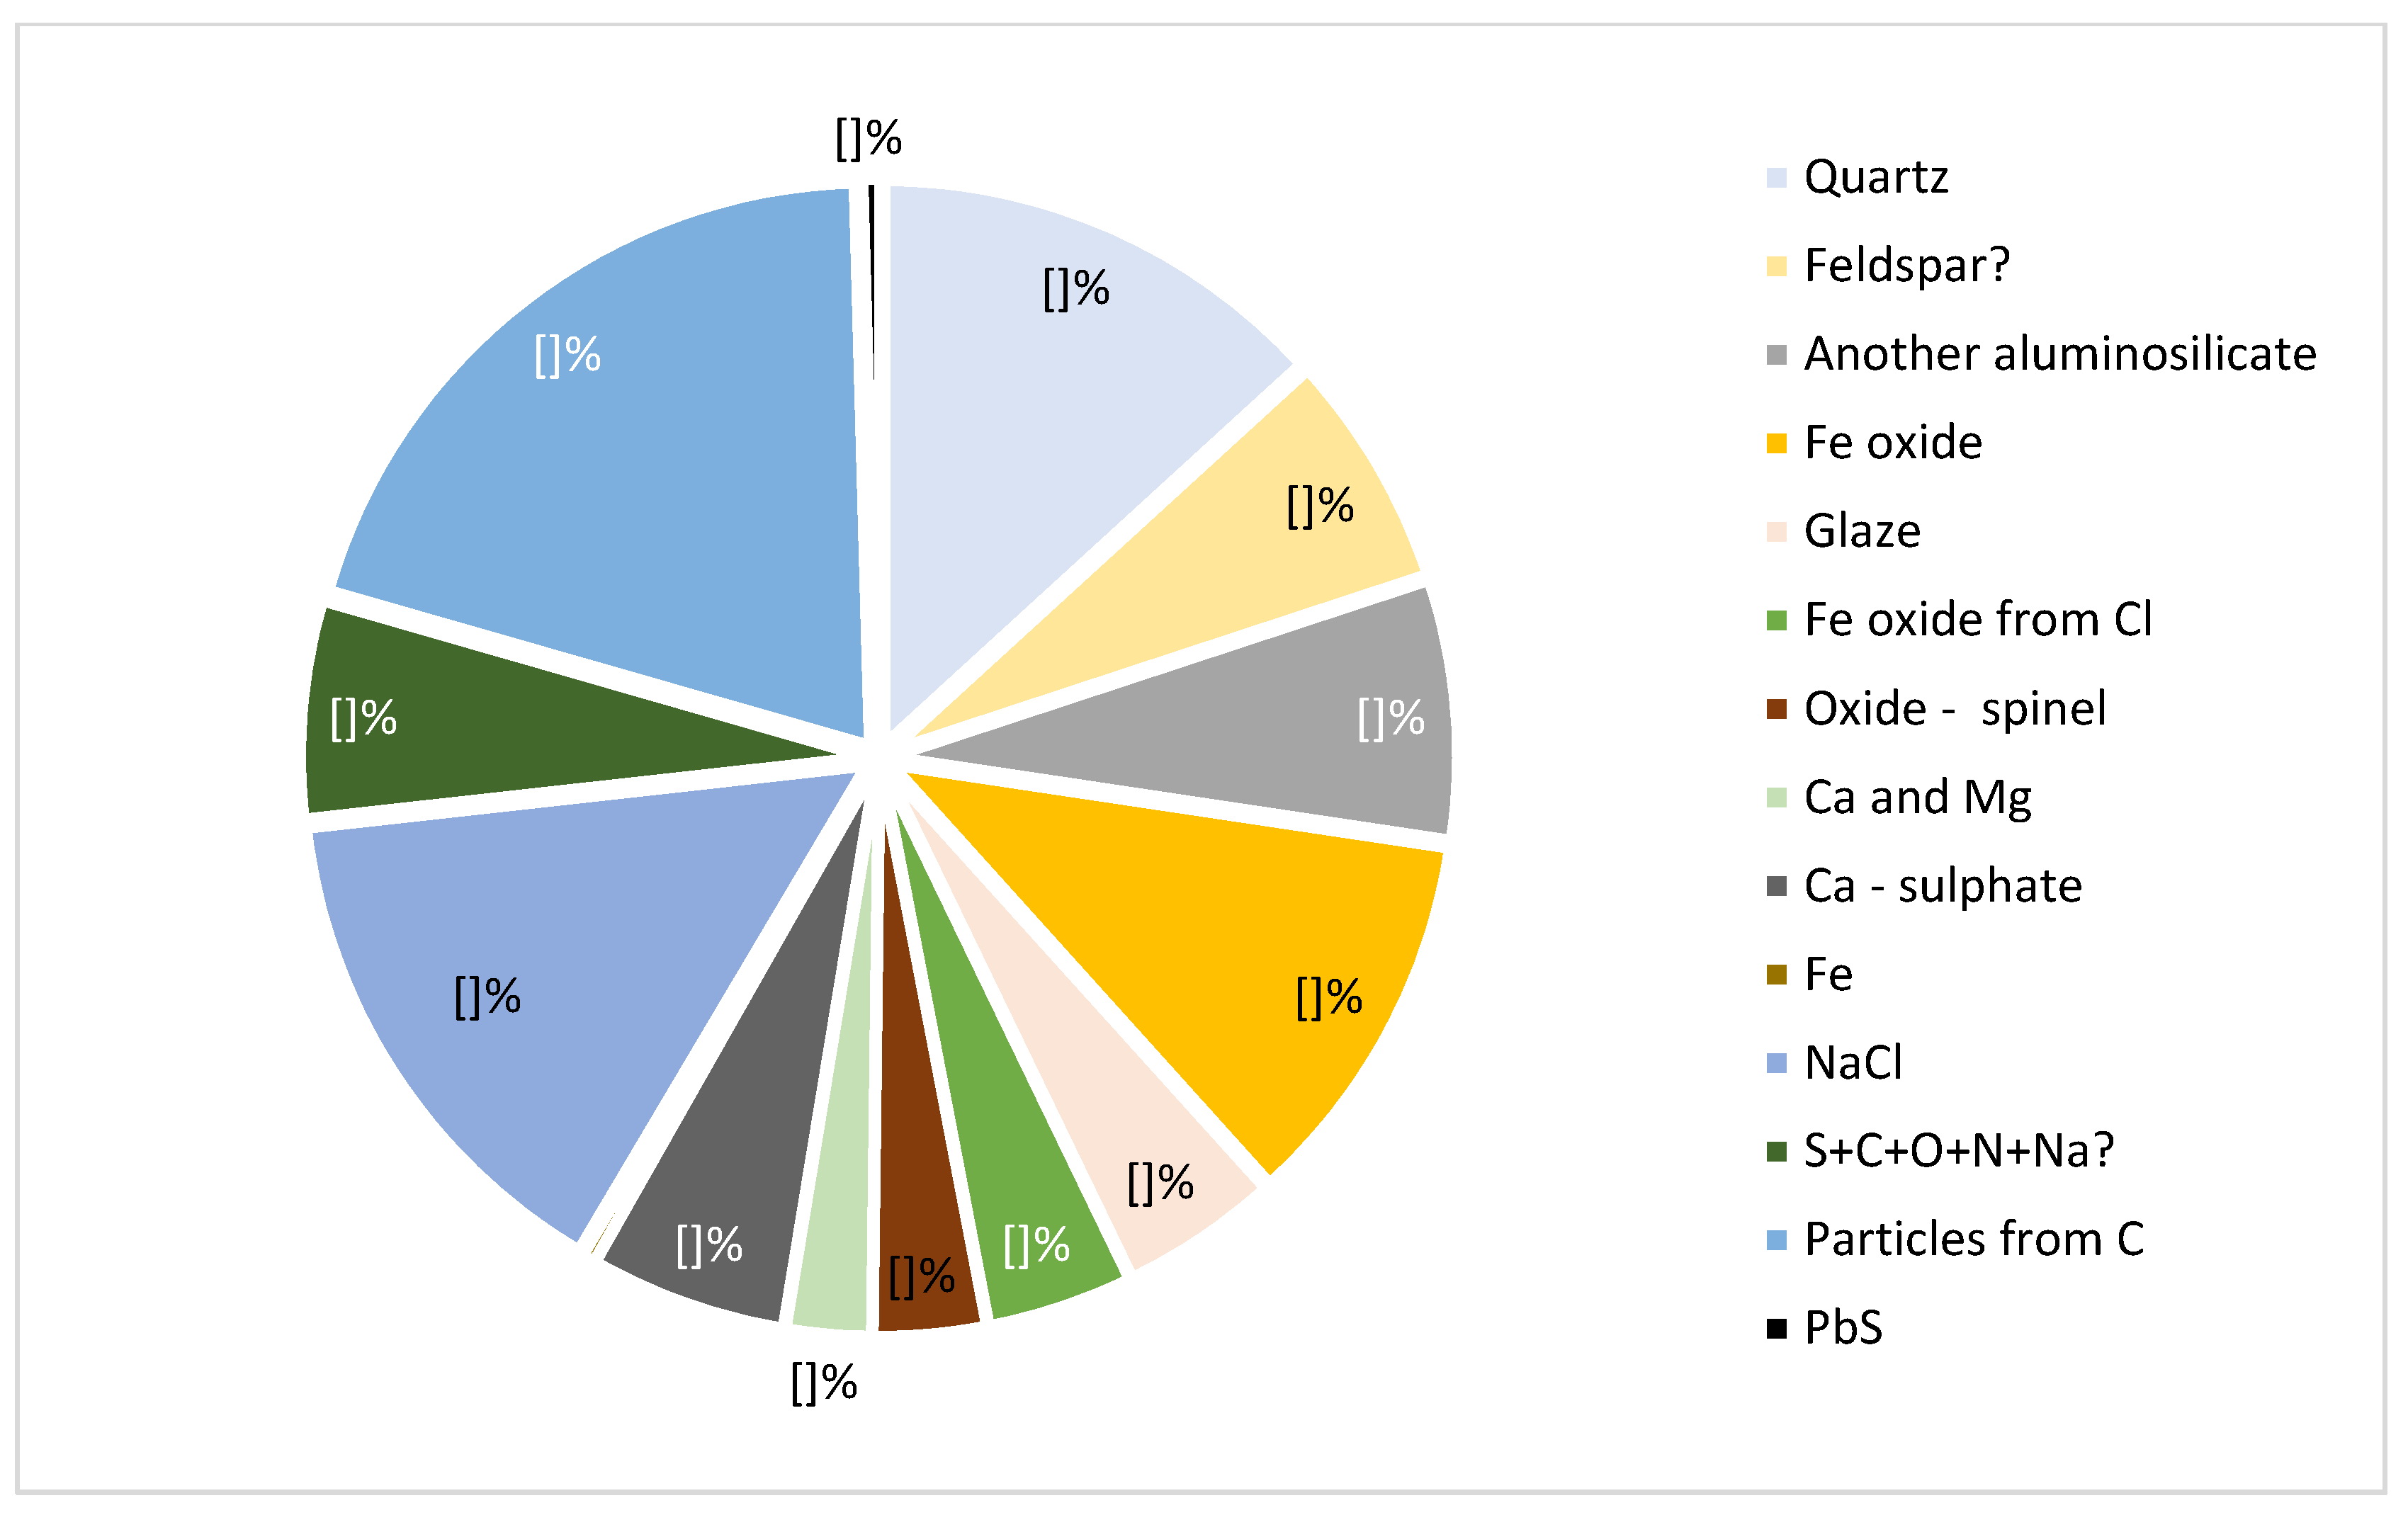
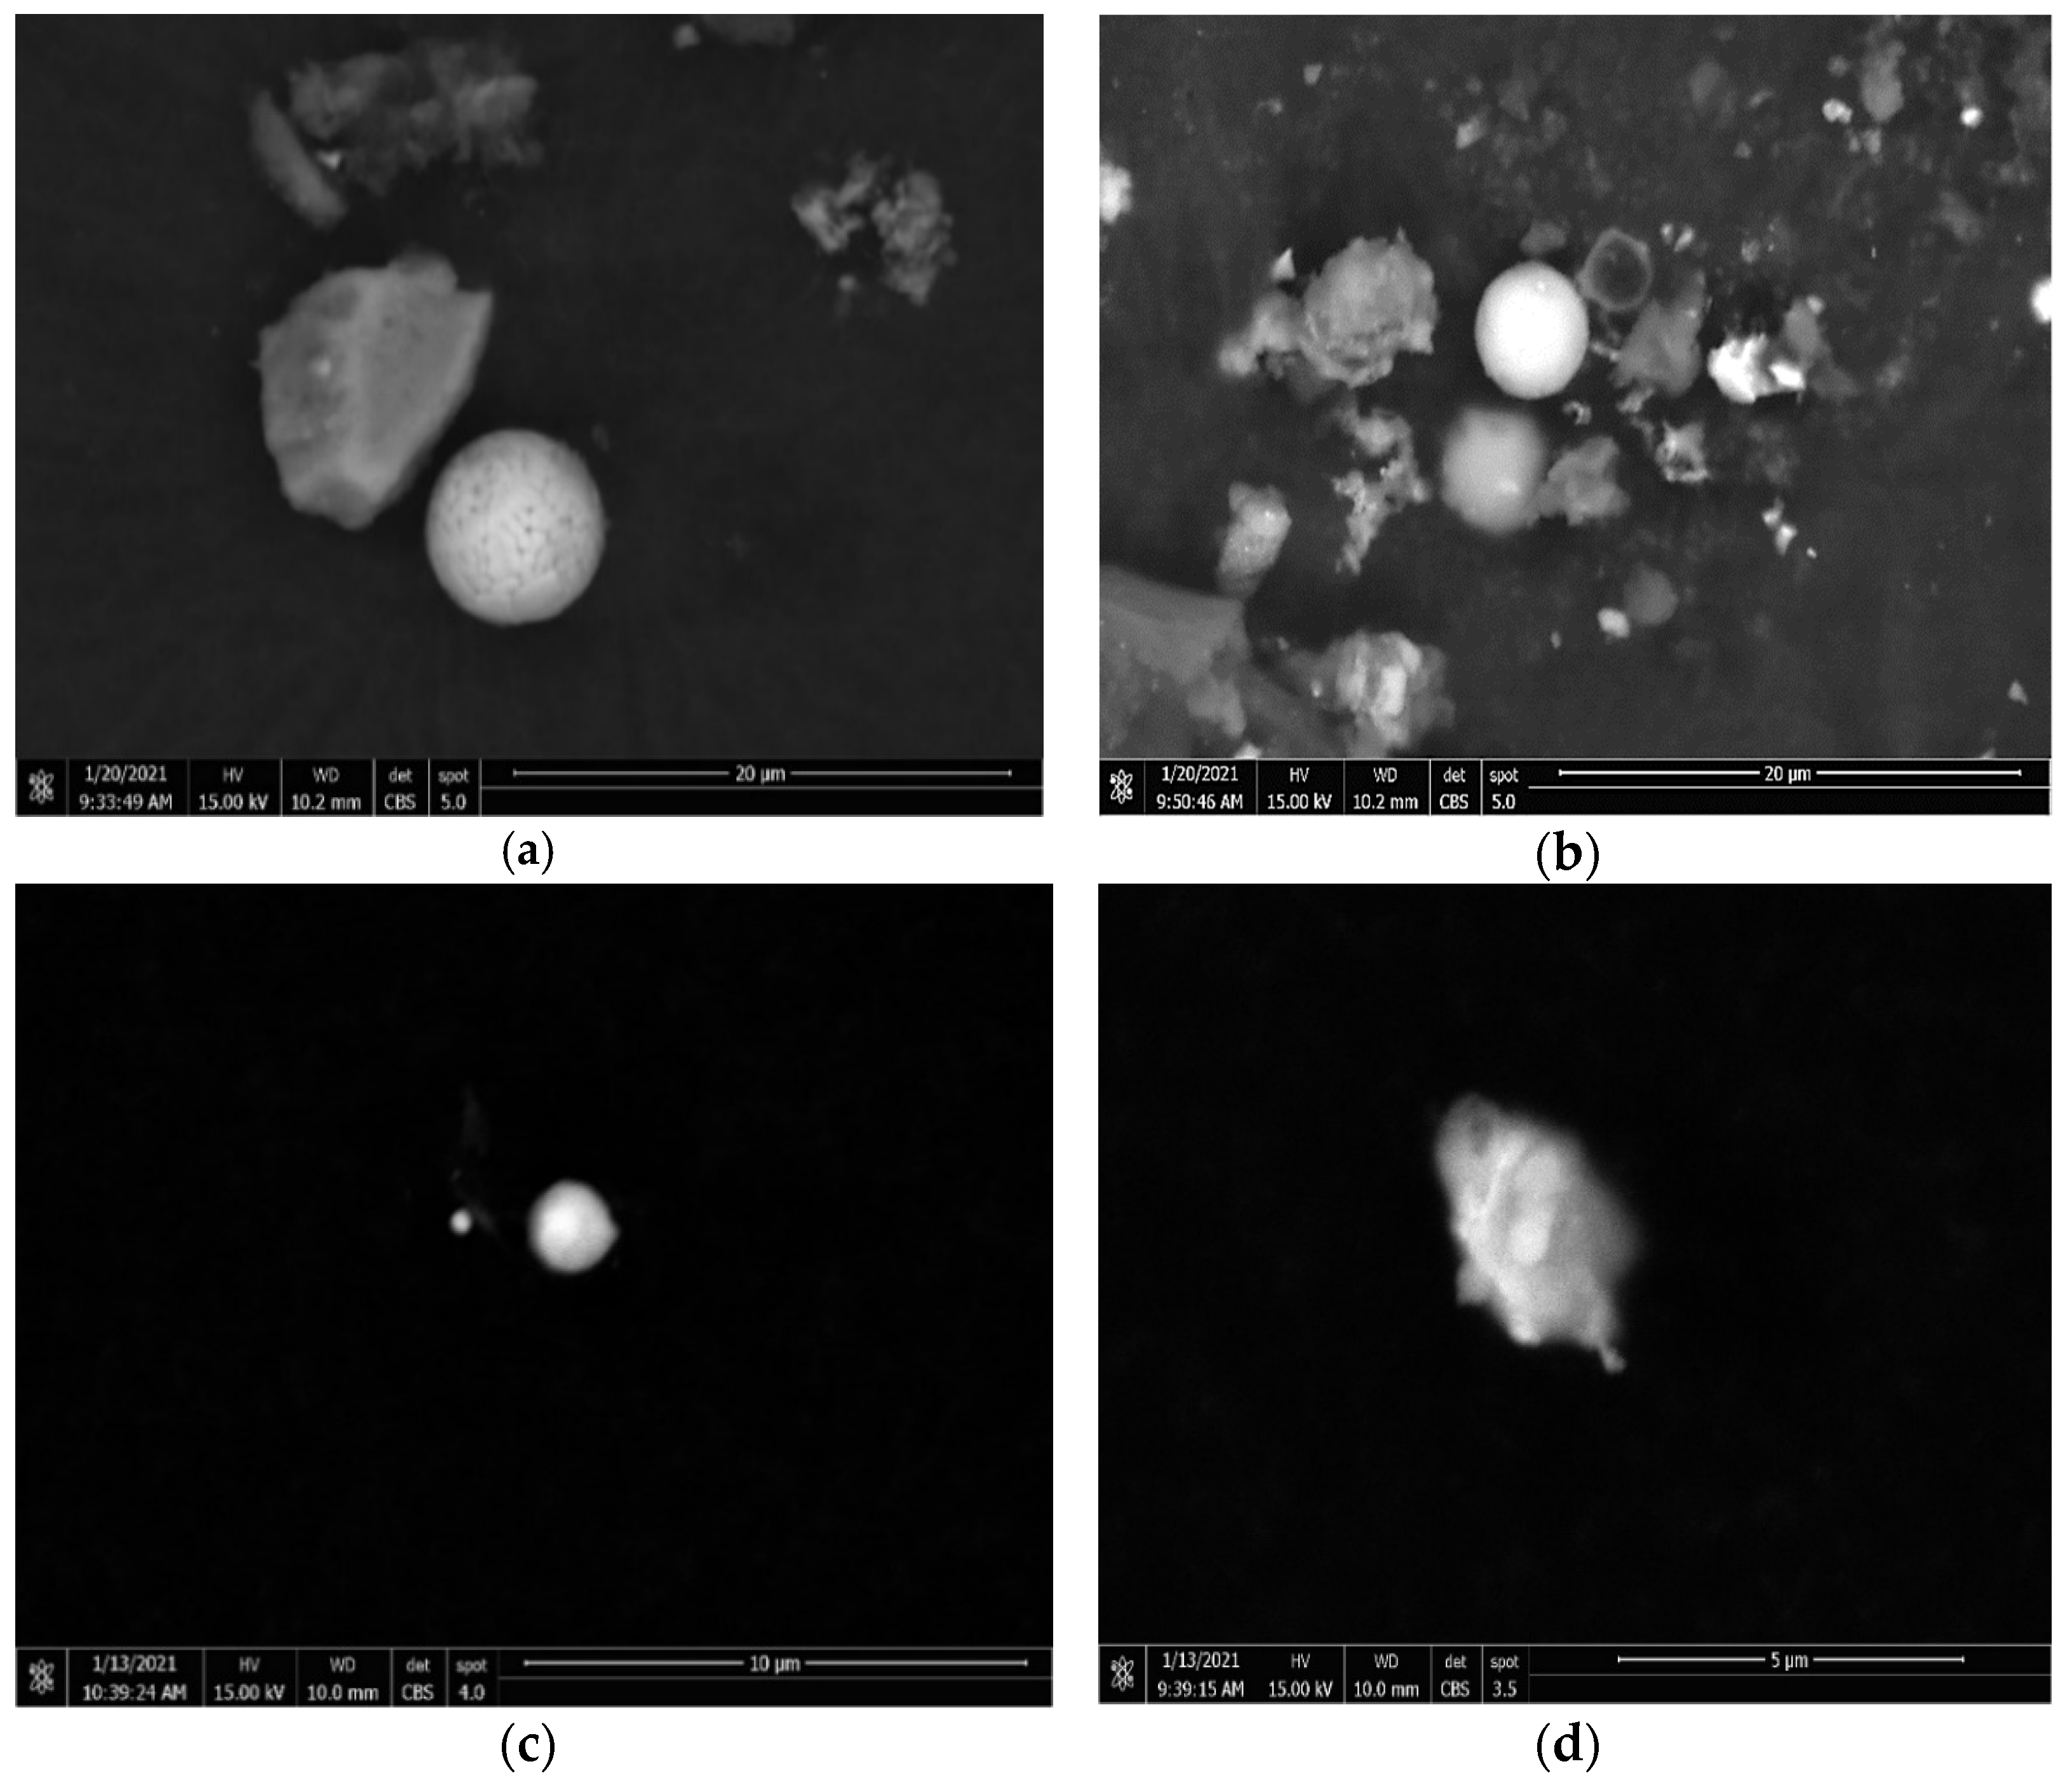
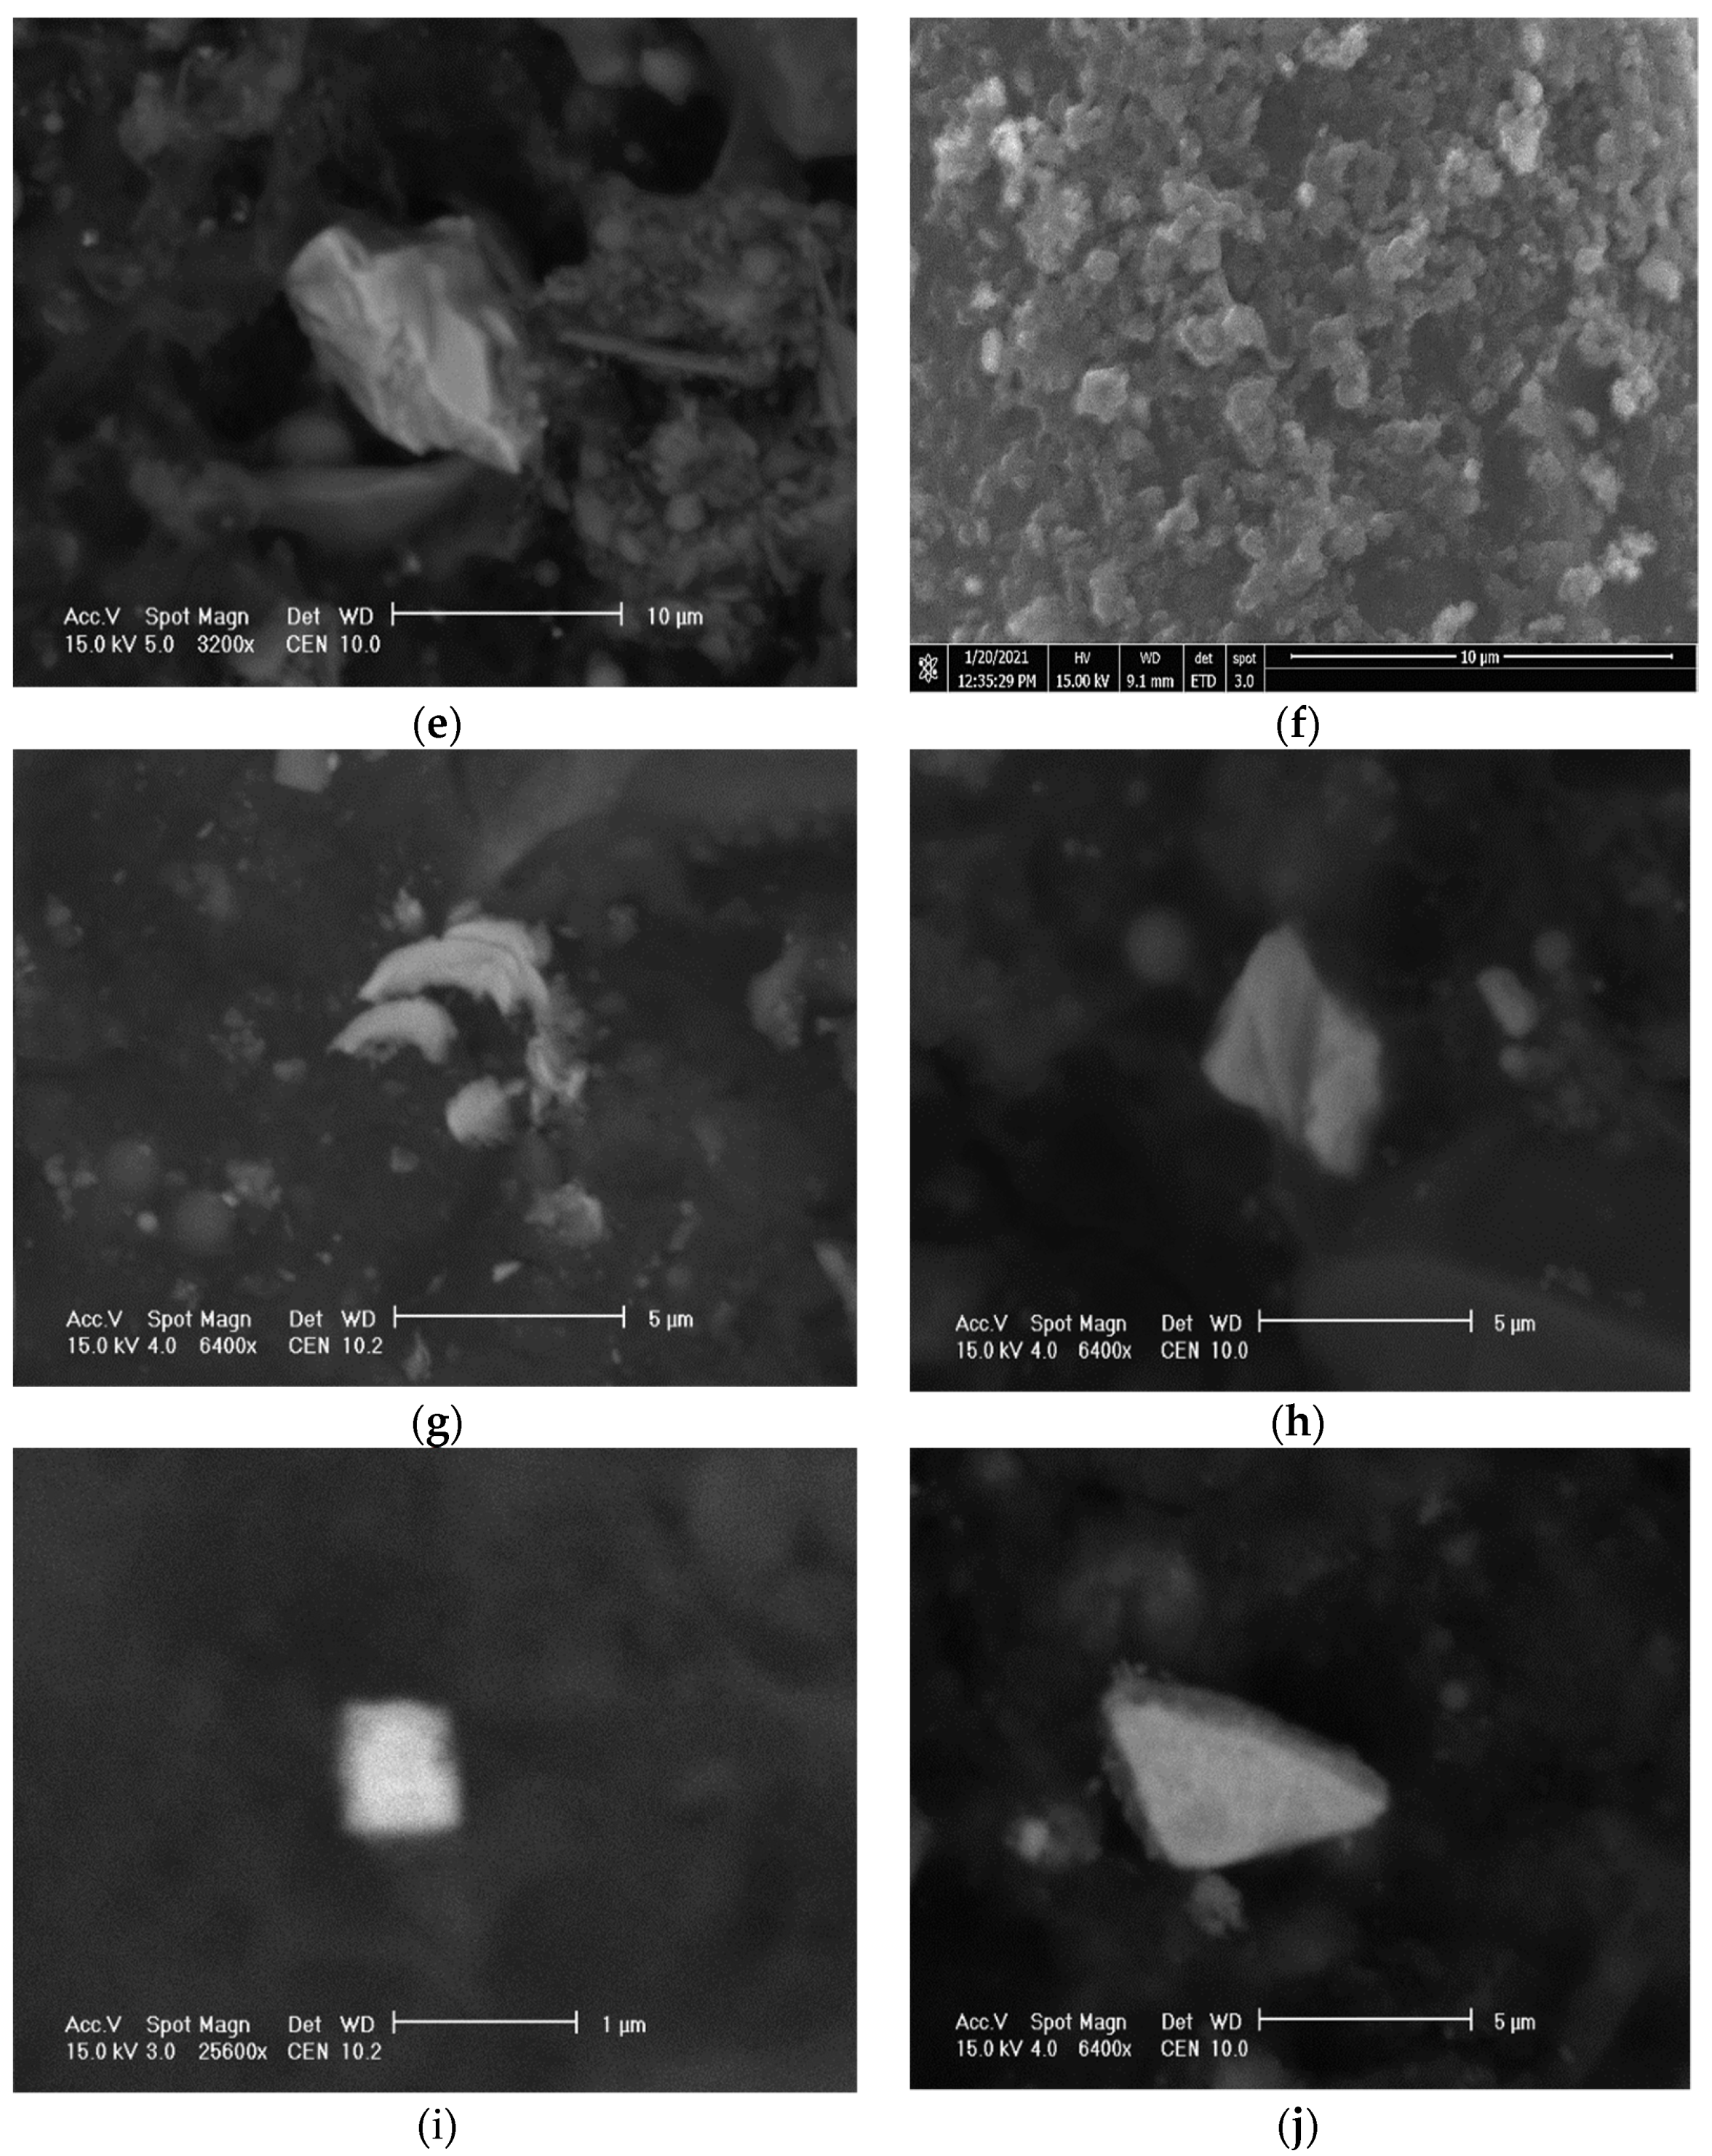
3.2. Composition of Dust Mineral

Research indicates that the primary dust ingredients include carbonaceous matter, both organic (primary and secondary) and inorganic, and elemental carbon (soot), mineral matter including trace elements, secondary inorganic aerosol (primarily sulphates, nitrates and ammonium compounds) and water. Many of the components of dust, e.g., benzo(a)pyrene, arsenic, lead, cadmium, or nickel, have serious negative effects on human health and terrestrial and aquatic ecosystems [29]. The morphology of dust particles determines how they interact with the epithelial cells of the lungs and, consequently, the deposition efficiency in different lung areas [30].
Figure 5 shows the percentage share of the particle’s total surface with different compositions in atmospheric dust samples below 10 µm. Well-formed NaCl crystals may be indicative of them having been formed as a result of secondary reactions between gases emitted during combustion. The formation of secondary barite crystals was observed in previous studies carried out in southern Poland [31,32]. Sharp-edged dusts such as metallic particles of Ni phosphate, Figure 6g, may cause lung tissue injuries. Such injuries may make people susceptible to respiratory tract infections. PM10 particles contain more quartz, feldspars and aluminosilicates, whereas the PM2.5 fraction contains a higher share of secondary NaCl crystals and soot aggregates. Due to their large surface area, soot particles often attach finer particles containing PTE. In the Pszczyna—Piasek dust, we observed phases containing S, C, O, N and Na. In PM2.5 respirable dust, we also identified zinc and lead sulphides.
In atmospheric dust with <10 µm, most of the surface area is occupied by particles with carbon (Figure 6f), halite (NaCl), quartz (SiO2), and Fe oxides (Figure 6d).
Figure 6a–f presents the mineral composition of selected atmospheric dust particles.
NaCl (Figure 7) was the most common component in PM2.5. The vast majority of its grains were smaller than 5 µm and were evenly distributed over the entire surface of the sample. Na and Cl peaks were also found in almost all EDS. Grains composed of S + C + O + N + Na? were also very abundant, whereas Fe oxides/hydroxides and Na carbonates were less abundant. SiO2 and spinel-type oxides were rarely found. Feldspar, Ca carbonate, Ca and Mg carbonate, and Zn and Pb sulphides were observed occasionally (Figure 6e,i). In the samples, there were also quite numerous, relatively large particles composed of carbon, and containing small amounts of Na, P, S and Cl. PM10 and PM2.5 likely contain PTEs, but the methods used in this study did not allow for their identification.
In addition to the phases of ashes typical for hard coal combustion (glass-aluminous silicate, magnetite, hematite), the PM dust emitted may contain soot, amorphous selenium, calcium oxide, crystalline sulphates-anglesite, anhydrite, gypsum and barite [31,33]. Dust emitted into the atmosphere is characterised by highly varied granularity, which is due to the type of coal combustion process in which they are formed and the velocity of the gas that carries them away from their formation site.
Table 2 shows the concentration (µg/m3) of the different fractions of atmospheric dust analysed in Pszczyna—Piasek and gives the values of TVOC, TSP and soot.
Comparison of the results of dust analyses during the heating season reveals a great variation in the concentration of PM1.0, PM2.5 and PM10 dust. Lower temperature and higher humidity were conductive to a higher concentration of dust in the atmosphere in February 2021. On this day of the study, the low temperature probably caused a higher share of fuel to be burned for home heating purposes. The concentration of total suspended particulate (TSP) was also higher, as was the determined soot content. When compared to the permissible daily concentrations of PM10 (50 μg/m3) and PM2.5 (25 μg/m3), those recorded in Pszczyna—Piasek exceeded them by 247–359% and 337–610%, respectively. This confirms that the number of days in Pszczyna with exceeded permissible average daily levels of PM10 is too high (norm of 35 days). The emissions of PM2.5 and PM10 in Poland are among the highest in the European Union [34]. The main reason for exceeding particulate matter air pollution in Poland, including the permissible annual average level of PM10 and PM2.5 concentrations, is the so-called low-stack emission, related primarily to heating of individual buildings. Individual household furnaces are recorded; thus, it is the responsibility of commune governments to decide on the methods for reducing low-stack emissions and the amount of funds to be allocated for this purpose.
Due to its particle size, PM2.5 is more hazardous to health than PM10. These pollutants result in a higher incidence of respiratory, cardiovascular, central nervous system and cancer diseases among residents of the most polluted regions [20,35,36]. The endogenous particles of Ca- and (Ca,Mg)-carbonates in lung tissues may originate in response to the settlement of inhaled atmospheric dust particles [37]. Sedimentation and precipitation remove PM10 from the atmosphere within hours, whereas fine PM2.5 may be retained in the air for days or even weeks [38]. The concentration of soot is high and probably correlated to PM2.5, because this fraction can comprise more than 49% soot [39]. On the contrary, PM0.1 should be classified as a gaseous fraction because it is formed by a coagulation of smaller nucleations and Aitken particles, and condensation of secondary sulphates, nitrates and organic compounds of already existing particles. The size of these particles does not increase with increasing condensation [40].
Figure 8 represents the proportion (%) of individual atmospheric dust fractions analysed together with the altitude at which the balloon climbed (vertically up to 1200 m).
Based on the data presented in Figure 8, we can observe the distribution of dust pollutants in the winter season with intensified coal and eco-pea combustion. The research carried out in January and February showed that the concentration of PM10 dust is the highest up to the altitude of 100 m above the ground (48.1 μg/m3), and then its value decreases as the altitude rises to 700 m above ground level, up to where respirable dust is retained. The dust concentration decreases slowly up to an altitude of 1000 m above sea level. The presence of the finest dust fractions at such altitudes is favourable for their long-distance transport from the source of pollution.
Concentrations of PM2.5 (40.04 μg/m3) and PM1.0 (37.5 μg/m3) measured up to 100 m above the ground level were similar. The higher the balloon climbed, the lower the PM values recorded. Accumulation of pollution in the boundary layer is one of the most troublesome manifestations of atmospheric air pollution. This is most often associated with the presence of smog combined with particulate matter in winter (November–March). Unfavourable meteorological conditions strengthen this phenomenon in this case [41].

3.3. Chemical Composition of Ashes

PTE (Pb, Cd, Ba, As, Zn, Ni, Tl, Th and U) content in ashes is variable and depends on the type of hard coal burned. Lower PTE concentrations were found in hard coal and eco-pea coal samples than in the examined ashes (Table 3).
Compared to eco-pea, the concentrations of As, Pb, Tl, Th and U in the burnt hard coal were higher. The concentrations of Ba and Zn were almost 10 times higher in eco-pea coal than in hard coal. Higher concentrations of Cd and Ni were also found in eco-pea. Higher contents of Ba, Zn, Ni and Cd in eco-pea coal may be indicative of the poor quality of this product. Not all eco-pea coal is as ecological as its name suggests. The Polish market is flooded with counterfeit products, which are a mixture of low-quality fine coal, glued together with substances of unknown origin. When buying eco-pea coal in Poland, attention should be paid to the certificate issued by the Institute for Chemical Coal Processing which certifies its standard parameters. Concentrations of the determined potentially toxic elements in hard coal are consistent with the results of research carried out in various scientific centres in Poland and abroad (Table 3). The burnt hard coal exhibits higher concentrations of Th and U, as compared to world average contents found in coal. The concentration of U in Polish coal is consistent with the results of studies published by Parzentny and Róg [27].
Ashes from hard coal combustion in a class 4 furnace exhibited higher concentrations of Cd, Pb, Zn and Ba, compared to ashes from eco-pea coal combustion (class 5 furnace). Th and U in ashes from hard coal combustion correlated with the content of these elements in coal, whereas ashes from eco-pea combustion exhibited higher Th and U concentrations compared to the consumed fuel (Table 3). Ashes from the combustion of hard coal and eco-pea were enriched in the determined potentially toxic elements. The PTE content in ashes from the combustion of eco-pea coal can be written as follows: Zn > Ni > Ba > Pb > As > Th > Cd > Tl > Se > U, whereas the concentration sequence for eco-pea is: Zn > Ba > Ni > Pb > As > Cd > Th > U > Se > Tl. Ashes from the combustion of eco-pea were enriched in Ba (213 mg/kg) to a greater degree than ashes from hard coal (101.4 mg/kg). The higher PTE concentrations in ashes result from the coal combustion process and lead to an increase in elemental concentrations in the solid products, regardless of the combustion technology. The high concentration of Pb, Zn and Ba in eco-pea coal, which is supposed to be more environmentally friendly than hard coal, is alarming. This example shows that the chemical composition of eco-pea coal can vary and that higher emissions of PTEs into the atmosphere can be expected as a result of its combustion, particularly because, unlike the case for hard coal, there are no corresponding quality standards for the combustion of eco-pea.
Enrichment factors of PTEs in ash were calculated. The results are presented in Table 3. The PTE enrichment in ash was determined by the relative enrichment factor (RF) using the Meij [52] formula, which defines RF as the ratio of the concentration in the combustion product to the concentration in the fuel:
RF = CA/CC·AC/100
where:
RF—relative enrichment factor
CA—element content in ash
CC—element content in hard coal/eco-pea coal
AC—ash content (%) in hard coal/eco-pea coal
The calculated values of relative enrichment factors are higher for ashes from the combustion of hard coal. Thorium is not classified by Meij [53] as a volatile element in the combustion process (RF~1) (class I) and can accumulate in the ash particles. Elements such as Ba (RF > 4) (class IIa), Ni and U (2 < RF ≥ 4) (class IIb), and As, Cd, Pb, Tl and Zn (1.3 < RF < 3) (class IIc) are volatile and can accumulate on ash particles in varying amounts. Selenium (RF << 1) (class III) is a very volatile element and can accumulate in ash particles produced by coal combustion only to a small extent. The calculated RF values do not comply with the Meij classification (Table 3).
Determination of the amount of PTE emitted to the atmosphere is of great importance for measures taken to improve air quality. Hard coal boilers are surface sources of atmospheric pollution. Households mostly emit this pollution during the winter season. The volume of emissions into the atmosphere depends on the type of fuel and its parameters, in addition to the amount of fuel consumed. Emissions generated by individual domestic furnaces are particularly problematic because they originate from a large number of low-stack emitters, causing the emitted pollutants to accumulate primarily around the generation site. Lead, mercury and cadmium are considered the most toxic PTEs and they are contained, inter alia, in hard coal and released into the atmosphere as a result of its combustion. Cd and Ni concentrations in the air in Poland are mostly influenced by combustion processes in the municipal and residential sectors, whereas Hg content is influenced by combustion processes in the power generation and transformation sector [38]. Air concentrations of dust-related PTEs (both PM2.5–10 and PM2.5) vary across space, whereas their seasonal variability in urban areas is much lower for coarse dust than for fine dust [54]. Elements such as Pb, Zn, Cd and As are typically found in PM2.5, whereas Cu, Mn, Ni and Cr can be found in both coarse and fine particles [29]. Tao et al. [55] determined a Pb content of 168.1 ± 32.0 ng/m3 in PM2.5 in winter dust. Thorium is also present in atmospheric dust (Figure 6) and was found in monazite particles containing cerium, lanthanum and neodymium. Emission of SeO2 from the combustion of fossil fuels can be transformed into elemental Se by reaction with SO2 in the atmosphere [56].
The studied dust also included particles containing Ni, Cr and Zn. It is likely that other elements are also present, but due to the small size of the dust particles, they were not determined with the test method used. High concentrations of Zn and Ni in ashes from the combustion of hard coal (Zn—2016.8 mg/kg) and eco-pea coal (Zn—1386.3 mg/kg) may be a cause of significant emissions to the atmosphere, because individual household furnaces are not equipped with dedusting devices. PTEs such as As, Cd, Ni and Pb are components of particulate matter for which air concentration limits have been established in both the European Union [57,58] and national legislations.
Concentrations of PTEs contained in particulate matter exhibit seasonal variability, similar to the cases of PM10 and PM2.5 [18,59]. The concentrations are the highest in winter, which is associated with increased dust emissions from individual household furnaces, and often with meteorological conditions unfavourable for dispersing pollutants in the atmosphere.

4. Conclusions

The determined PM1, PM2.5 and PM10 concentrations were found to be the highest up to 50 m above the ground. The determined PM10 and PM2.5 concentrations originate from the so-called low-stack emissions, where the harmful compounds enter the atmosphere at the height of no more than 40 m above the ground, i.e., directly affecting the quality of air inhaled by the residents of Pszczyna—Piasek. As household chimneys without filters are numerous and very densely deployed in Pszczyna—Piasek, they emit significantly more pollutants than industrial plants (covered by emission standards). The sequence of determined PTE concentrations in hard coal is as follows: Zn > Ni > Ba > Pb > As > Th > Cd > Tl > Se > U, whereas in eco-pea it is: Ba > Zn > Pb > Ni > As > Cd = Th > U = Se > Tl. With the exception of Ba, ashes from hard coal combustion exhibit higher concentrations of PTEs. Zn and Ba concentrations in eco-pea coal are higher than in hard coal. This is mainly due to the quality of burned hard coal, combustion technology and boiler class. The results show that not all forms of eco-pea coal can be an ecological alternative to hard coal. High concentrations of Ba, Zn and Pb in eco-pea should preclude it from being used in class 5 boilers.
The use of a manned hot-air balloon made it possible to determine the concentrations of PM1, PM2.5 and PM10 dust up to 50 m above ground level to depict the so-called low emissions, which directly affect the quality of air inhaled by the inhabitants of Pszczyna—Piasek. The PM10 and PM2.5 dusts are dominated by particles containing elemental carbon, sodium chloride and an S + C + O + N + Na mixture. The PM2.5 dust also contains Pb and Zn sulphides with a slightly higher concentration than in the PM10 dust.
Emissions from individual household furnaces in winter are a major source of air pollution and are currently the biggest problem for many municipalities, and not only in Silesia.

Author Contributions

Conceptualization, D.S.-D. and M.J.; methodology, D.S.-D., M.J. and S.G.; formal analysis M.J, D.S.-D. and S.G.; investigation, M.J. and D.S.-D.; writing-original draft preparation, M.J. and D.S.-D.; writing-review and editing, D.S.-D. and M.J. All authors have read and agreed to the published version of the manuscript.

Funding

This work was financially supported by thy statutory fund of the Institute of Earth Sciences, University of Silesia.

Institutional Review Board Statement

Not applicable.

Informed Consent Statement

Not applicable.

Data Availability Statement

The data presented in this study are available on request from the corresponding author.

Acknowledgments

We are grateful to Junique Justin Nnorom for improving the English of the manuscript. The authors are grateful to the anonymous reviewers for their insightful comments.

Conflicts of Interest

The authors declare no conflict of interest.

References

  1. Smil, V. Energy Transitions: Global and National Perspectives, 2nd ed.; ABC-CLIO, LLC: Santa Barbara, CA, USA, 2016. [Google Scholar]
  2. Munawer, M. Human health and environmental impacts of coal combustion and post-combustion wastes. J. Sustain. Min. 2018, 17, 87e96. [Google Scholar] [CrossRef]
  3. Pavlović, B.; Ivezić, D.; Živković, M. State and perspective of individual household heating in Serbia: A survey-based study. Energy Build. 2021, 247, 111128. [Google Scholar] [CrossRef]
  4. Olufemi, A.C.; Bello, P.O.; Mja, A. Conflict implications of coal mining and environmental pollution in South Africa: Lessons from Niger delta, Nigeria. Afr. J. Confl. Resolut. 2018, 18, 7–35. [Google Scholar]
  5. Hendryx, M.; Islam, M.S.; Dong, G.H.; Paul, G. Air pollution emissions 2008–2018 from Australian coal mining: Implications for public and occupational health. Int. J. Environ. Res. Public Health 2020, 17, 1570. [Google Scholar] [CrossRef] [Green Version]
  6. Kubica, K.; Paradiz, B.; Dilara, P. Small Combustion Installations: Techniques, Emissions and Measures for Emission Reduction; JRC Scientific and Technical Report; EUR 23214 EN—Joint Research Centre—Institute for Environment and Sustainability, Office for Official Publications of the European Communities: Luxembourg, 2007. [Google Scholar] [CrossRef]
  7. Zierold, K.M.; Odoh, C. A review on fly ash from coal-fired power plants: Chemical composition, regulations, and health evidence. Rev. Environ. Health 2020, 35, 401–418. [Google Scholar] [CrossRef]
  8. Ye, J.; Zubair, M.; Wang, S.; Cai, Y.; Zhang, P. Power production waste. Water Environ. Res. 2020, 91, 1091–1096. [Google Scholar] [CrossRef] [Green Version]
  9. Flues, M.; Sato, I.M.; Scapin, M.A.; Cotrim, M.E.B.; Camargo, I.M.C. Toxic elements mobility in coal and ashes of Figueira cola power plant, Brazil. Fuel 2013, 103, 430–436. [Google Scholar] [CrossRef] [Green Version]
  10. Perera, F. Pollution from fossil-fuel combustion is the leading environmental threat to global pediatric health and equity: Solutions exist. Int. J. Environ. Res. Public Health 2018, 15, 16. [Google Scholar] [CrossRef] [PubMed] [Green Version]
  11. Deng, M.; Li, P.; Ma, R.; Shan, M.; Yang, X. Air pollutant emission factors of solid fuel stoves and estimated emission amounts in rural Beijing. Environ. Int. 2020, 138, 106608. [Google Scholar] [CrossRef] [PubMed]
  12. Li, Q.; Qi, J.; Jiang, J.; Wu, J.; Duan, L.; Wang, S.; Hao, J. Significant reduction in air pollutant emissions from household cooking stoves by replacing raw solid fuels with their carbonized products. Sci. Total Environ. 2019, 650, 653–660. [Google Scholar] [CrossRef]
  13. Nádudvari, Á.; Fabiańska, M.J.; Marynowski, L.; Kozielska, B.; Konieczyński, J.; Smołka-Danielowska, D.; Ćmiel, S. Distribution of coal and coal combustion related organic pollutants in the environment of the Upper Silesian Industrial Region. Sci. Total Environ. 2018, 628–629, 1462–1488. [Google Scholar] [CrossRef]
  14. Fabiańska, M.J.; Smołka-Danielowska, D. Biomarker compounds in ash from coal combustion in domestic furnaces (Upper Silesia Coal Basin, Poland). Fuel 2012, 102, 333–344. [Google Scholar] [CrossRef]
  15. Li, Q.; Jiang, J.; Wang, S.; Rumchev, K.; Mead-Hunter, R.; Morawska, L.; Hao, J. Impacts of household coal and biomass combustion on indoor and ambient air quality in China: Current status and implication. Sci. Total Environ. 2017, 576, 347–361. [Google Scholar] [CrossRef] [Green Version]
  16. GUS—Główny Urząd Stystyczny. Statistical Yearbook of the Republic of Poland; Energy Consumption in Households in 2018; Statistics Poland: Warsaw, Poland, 2019. [Google Scholar]
  17. Report IQ Air. World Air Quality Report 2020; Region and City PM2.5 Ranking; IQAir: Goldach, Switzerland, 2021. [Google Scholar]
  18. Zhao, N.; Li, B.; Li, H.; Li, G.; Wu, R.; Hong, Q.; Mperejekumana, P.; Li, S.; Zhou, Y.; Ahmad, R.; et al. The potential co-benefits for health, economy and climate by substituting raw coal with waste cooking oil as a winter heating fuel in rural households of northern China. Environ. Res. 2021, 194, 110683. [Google Scholar] [CrossRef] [PubMed]
  19. Tsiridis, V.; Petala, M.; Samaras, P.; Kungolos, A.; Sakellaropoulos, G.P. Environmental hazard assessment of coal fly ashes using leaching and ecotoxicity test. Ecotoxicol. Environ. Saf. 2012, 84, 212–220. [Google Scholar] [CrossRef] [PubMed]
  20. Kicińska, A. Chemical and mineral composition of fly ashes from home furnaces, and health and environmental risk related to their presence in the environment. Chemosphere 2019, 215, 574–585. [Google Scholar] [CrossRef]
  21. Smołka-Danielowska, D. Trace elements and mineral composition of waste produced in the process of combustion of solid fuels in individual household furnaces in the Upper Silesian Industrial Region (Poland). Environ. Socio-Econ. Stud. 2015, 3, 30–38. [Google Scholar] [CrossRef] [Green Version]
  22. Smolka-Danielowska, D.; Fiedor, D. Potentially toxic elements in fly ash dependently of applied technology of hard coal combustion. Environ. Sci. Pollut. Res. 2018, 25, 25091–25097. [Google Scholar] [CrossRef] [PubMed]
  23. GIOŚ—Główny Inspektorat Ochrony Środowiska w Polsce. Stan Środowiska 404 W Województwie Śląskim; Raport; Chief Inspectorate of Environmental Protection: Katowice, Poland, 2020. [Google Scholar]
  24. PN-EN 303-5:2012. Kotły Grzewcze—Część 5: Kotły Grzewcze Na Paliwa Stałe Z Ręcznym I Automatycznym Zasypem Paliwa O Mocy Nominalnej Do 500 kW—Terminologia, Wymagania, Badania I Oznakowanie; Polish Committee for Standardization: Warszawa, Poland, 2012; ICS 01.040.91.140.10. [Google Scholar]
  25. Commission Regulation (EU) 2015/1185 of 24 April 2015 Implementing Directive 2009/125/EC of the European Parliament and of the Council with Regard to Ecodesign Requirements for Solid Fuel Local Space Heaters (Official Journal of the European Union); Publications Office of the European Union: Luxembourg, 2015.
  26. Jończy, I.; Wieczorek, A.; Podwórny, J.; Gerle, A.; Staszuk, M.; Szweblik, J. Characteristic of hard coal and its mixtures with water subjected to friction. Gospod. Surowcami Miner.—Miner. Resour. Manag. 2020, 36, 185–202. [Google Scholar] [CrossRef]
  27. Parzentny, H.R.; Róg, L. The role of mineral matter in concentrating uranium and thorium in coal and combustion residues from power plants in Poland. Minerals 2019, 9, 312. [Google Scholar] [CrossRef] [Green Version]
  28. Oliveira, M.L.S.; Ward, C.R.; Sampaio, C.H.; Querol, X.; Cutruneo, C.M.N.L.; Taffarel, S.R.; Silva, L.F.O. Partitioning of mineralogical and inorganic geochemical components of coals from Santa Catarina, Brazil, by industrial beneficiation processes. Int. J. Geol. 2013, 116–117, 75–92. [Google Scholar] [CrossRef]
  29. Juda-Rezler, K.; Toczko, B. Pyły Drobne W Atmosferze. Kompendium Wiedzy O Zanieczyszczeniu Powietrza Pyłem Zawieszonym W Polsce; Biblioteka Monitoringu Środowiska: Warszawa, Poland, 2016. [Google Scholar]
  30. Gieré, R.; Querol, X. Solid particulate matter in the atmosphere. Elements 2010, 6, 215–222. [Google Scholar] [CrossRef]
  31. Jablonska, M.; Rietmeijer, F.J.M.; Janeczek, J. Fine-grained barite in coal fly ash from the Upper Silesian industrial region. Environ. Geol. 2001, 40, 941–948. [Google Scholar] [CrossRef]
  32. Rietmeijer, F.J.M.; Janeczek, J. An analytical electron microscope study of airborne industrial particle in Sosnowiec, Poland. Atmos. Environ. 1997, 31, 1941–1951. [Google Scholar] [CrossRef]
  33. Gieré, R.; Blackford, M.G.; Smith, K.L. TEM study of PM2.5 emitted from coal and tire combustion in a thermal power station. Environ. Sci. Technol. 2006, 40, 6235–6240. [Google Scholar] [CrossRef]
  34. Report. Officially Reported Emission Data. 2021. Available online: https://www.ceip.at/webdab-emission-database/reportedemissiondata; https://www.ceip.at/status-of-reporting-and-review-results/2021-submissions (accessed on 12 September 2021).
  35. Xing, Y.; Xu, Y.; Shi, M.; Lian, Y. The impact of PM2.5 on the human respiratory system. J. Thorac. Dis. 2016, 8, E69–E74. [Google Scholar] [CrossRef]
  36. Zahran, A.; Ibrahim, M.I.; Ramadan, L.; Ibrahim, M.M. Air quality indices, sources and impact on human health of PM10 and PM2.5 in Alexandria Governorate, Egypt. J. Environ. Prot. 2018, 9, 1237–1261. [Google Scholar] [CrossRef] [Green Version]
  37. Jabłońska, M.; Janeczek, J.; Smieja-Król, B. The impact of ambient atmospheric mineral-dust particles on the calcification of lungs. Minerals 2020, 11, 125. [Google Scholar] [CrossRef]
  38. Kostrz, M.; Satora, P. Związki odpowiedzialne za zanieczyszczenie powietrza. Inżynieria Ekol. (Ecol. Eng.) 2017, 18, 89–95. [Google Scholar] [CrossRef]
  39. Shi, Y.; Ji, Y.; Sun, H.; Hui, F.; Hu, J.; Wu, Y.; Fang, J.; Lin, H.; Wang, J.; Duan, H.; et al. Nanocsale characterization of PM2.5 airborne pollutants reveals high adhesiveness and aggregation capability of soot particles. Sci. Rep. 2015, 5, 11232. [Google Scholar] [CrossRef]
  40. Colbeck, I.; Lazaridis, M. Aerosols and environmental pollution. Naturwissenschaften 2010, 97, 117–131. [Google Scholar] [CrossRef]
  41. Reizer, M. Co to Jest pył zawieszony? W: Pyły Drobne W Atmosferze. Kompendium Wiedzy O Zanieczyszczeniu Powietrza Pyłem Zawieszonym W Polsce, Juda-Rezler, K. and Toczko B; Biblioteka Monitoringu Środowiska, Główny Inspektorat Ochrony Środowiska: Chief Inspectorate of Environmental Protection: Warszawa, Poland, 2016; pp. 11–21. [Google Scholar]
  42. Lewińska-Preis, L.; Fabiańska, M.J.; Ćmiel, S.; Kita, A. Geochemical distribution of trace elements in Kaffioyra and Longyearbyen coals, Spitsbergen, Norway. Int. J. Coal Geol. 2009, 80, 211. [Google Scholar] [CrossRef]
  43. Swaine, D.J. Why trace elements are important. Fuel Process. Technol. 2000, 65–66, 21–33. [Google Scholar] [CrossRef]
  44. Srinivasa, R.M.; Basha, S.; Joshi, H.V.; Jha, B. Evaluation of the emission characteristics of trace metals from coal and oil fired power plants and their fate during combustion. J. Hazard. Mater. 2005, 123, 242–249. [Google Scholar] [CrossRef]
  45. Singh, R.N.; Porter, J. Incidence of barium pollution in mine water discharge in an underground coal mine. In Proceedings of the Johannesburg, International Mine Water Association Symposium; 1998; pp. 433–447. [Google Scholar]
  46. Jabłońska, M.; Kramarczyk, M.; Smieja-Król, B. Barium concentration in cost roe deer antlers related to air pollution caused by burning of barium—enriched coal in southern Poland. Environ. Sci. Pollut. Res. 2016, 23, 5978–5982. [Google Scholar] [CrossRef] [Green Version]
  47. Li, Z.; Zhou, X.; Wang, Q.; Li, X.; Zhang, L.; Wang, D.; He, T.; Cao, Y.; Feng, X. Behavior of tallium in pulverized coal utility boiler installations in Southwest China. J. Air Waste Manag. Assoc. 2021, 71, 488–500. [Google Scholar] [CrossRef]
  48. Yudovich, Y.E.; Ketris, M.P. Selenium in coal: A review. Int. J. Coal Geol. 2006, 1–2, 112–126. [Google Scholar] [CrossRef]
  49. Coleman, L.; Bragg, L.J.; Finkelman, R.B. Distribution and mode of occurrence of selenium in US coals. Environ. Geochem. Health 1993, 15, 215–227. [Google Scholar] [CrossRef] [PubMed]
  50. Arbuzov, S.L.; Maslar, S.G.; Volostnov, A.V.; II’enok, S.S.; Arkhipov, V.S. Modes of occurrence of uranium and thorium in coals and peats of Northern Asia. Solid Fuel Chem. 2012, 46, 52–66. [Google Scholar] [CrossRef]
  51. Chen, J.; Chen, P.; Yao, D.; Huang, W.; Tong, S.; Wang, K.; Liu, W.; Hu, J.; Li, Q.; Wang, R. Geochemistry of uranium in Chinese coals and the emission invertory of coal-fired power plants in China. Int. Geol. Rev. 2018, 60, 621–637. [Google Scholar] [CrossRef]
  52. Meij, R. Trace Element Behavior in Coal-Fired Power Plants. Fuel Process. Technol. 1994, 39. [Google Scholar] [CrossRef]
  53. Meij, R.; Winkel, H. The emissions of heavy metals and persistent organic pollutants from modern coal-fired power stations. Atmos. Environ. 2007, 41, 9262–9272. [Google Scholar] [CrossRef]
  54. Rogula-Kozłowska, W.; Klejnowski, K.; Rogula-Kopiec, P.; Mathews, B.; Szopa, S. A study on the seasonal mass closure of ambient fine and coarse dusts in Zabrze, Poland. Bull. Environ. Contam. Toxicol. 2012, 88, 722–729. [Google Scholar] [CrossRef]
  55. Tao, Z.; Guo, Q.; Wei, R.; Dong, X.; Han, X.; Guo, Z. Atmospheric lead pollution in a typical megacity: Evidence from lead isotopes. Sci. Total Environ. 2016, 778, 145810. [Google Scholar] [CrossRef] [PubMed]
  56. Utsunomiya, S.; Jensen, K.A.; Keller, G.J.; Ewing, J.C. Direct identification of trace metals in fine and ultrafine particles in the Detroit urban atmosphere. Environ. Sci. Technol. 2004, 38, 2289–2297. [Google Scholar] [CrossRef] [PubMed]
  57. Directive 2004/107/EC of the European Parliament and of the Council of 15 December 2004 Relating to Arsenic, Cadmium, Mercury, Nickel and Polycyclic Aromatic Hydrocarbons in Ambient Air; Publications Office of the European Union: Luxembourg, 2005; p. 3.
  58. Directive 2008/50/EC of the European Parliament and of the Council of 21 May 2008 on Ambient Air Quality and Cleaner Air for Europe; Publications Office of the European Union: Luxembourg, 2008; p. 1.
  59. Meng, C.C.; Wang, L.T.; Zhang, F.F.; Wei, Z.; Ma, S.M.; Ma, X.; Yang, J. Characteristics of concentrations and water-soluble inorganic ions in PM2.5 in Handan City, Hebei province, China. Atmos. Res. 2016, 171, 133–146. [Google Scholar] [CrossRef]
Figure 1. Sampling location (Pszczyna—Piasek).
Minerals 11 01155 g001
Figure 2. Research material: hard coal (a), ash from hard coal (b), eco-pea coal (c), and ash from eco-pea coal (d).
Minerals 11 01155 g002
Figure 3. SEM images of sinter found in ash from coal combustion in individual domestic furnaces: (a) ash from eco-pea coal; (b) ash from hard coal.
Minerals 11 01155 g003
Figure 4. SEM images of the morphology of different ash particles: (a) mullite (needles inside); (b) aggregate composed of Mn, Ni, and Fe oxides (bright particle); (c) Fe oxides; (d) gypsum (bright bars); (e) diopside (f); corundum (dark on a light background); (g) lead sulphide; (h) rare earth phosphate (monazite) with Th.
Minerals 11 01155 g004aMinerals 11 01155 g004b
Figure 5. Surface area of grains (<10 µm) of different components of Pszczyna—Piasek dusts.
Minerals 11 01155 g005
Figure 6. SEM images of dust particles: (a) potassium feldspar particle (irregular shape) and iron oxide ball (spherical form); (b) Fe oxide (light ball) and aluminosilicate glaze-grey balls; (c) the particle of metallic Fe, Cr and Ni; (d) Fe oxide; (e) zinc sulphide; (f) submicron particles of soot; (g) Ni phosphide; (h) rare earth phosphate (monazite) with Th; (i) Pb sulphide; (j) Pb sulphide from Zn.
Minerals 11 01155 g006aMinerals 11 01155 g006b
Figure 7. Surface area of grains (2.5 µm) of different components of Pszczyna—Piasek dusts.
Minerals 11 01155 g007
Figure 8. Summary of concentrations of dust fractions as a function of height above ground level (data from measurement apparatus installed on the balloon basket).
Minerals 11 01155 g008
Table 1. Mineral composition of coal and ash from individual domestic furnaces on the basis of XRD analyses.
ComponentFormulaHard CoalAshEco-Pea CoalAsh
QuartzSiO2xxxx
CristobaliteSiO2xx--
CorundumAl2O3-x--
SillimaniteAl2SiO5-x--
MulliteAl6Si2O13xxxx
CalciteCaCO3-x--
MagnetiteFe3O4xx--
HematiteFe2O3xxxx
SpinelMgAl2O4-x-x
GoethiteFeO(OH)x---
GypsumCaSO4·2H2O-x-x
BassaniteCaSO4·½ H2O-x--
DiopsideCaMg[Si2O6]--xx
CordieriteMg2Al3[AlSi5O18]---x
PyriteFeS2x---
KaoliniteAl4[Si4O10](OH)8x---
SphaleriteZnSx-x-
GalenaPbSx---
Feldspars (albite-anorthite)KAlSi3O8 (NaAlSi3O8–CaAl2Si2O8)-x-x
Table 2. Concentrations of PM, TSP, TVOC and soot determined in the winter season in Pszczyna—Piasek.
MeasurementPM1.0 (μg/m3)PM2.5 (μg/m3)PM10 (μg/m3)TVOC (ppb)TSP (μg/m3)Soot (ng/m3)
Meteorological conditions: temperature min. 2.5 °C; temperature max. 3.0 °C;
humidity 54–61%; atmospheric pressure 987 hPa (15 January 2021)
Min.71.6381.2498.02401853217
Max.76.3288.49172.597022217,078
Mean73.984.2123.55320410,162
Meteorological conditions: temperature min. 0 °C; temperature max. 2.0 °C;
humidity 66–72%; atmospheric pressure 987 hPa (10 February 2021)
MeasurementPM1.0 (μg/m3)PM2.5 (μg/m3)PM10 (μg/m3)TVOC (ppb)TSP (μg/m3)Soot (ng/m3)
Min.114.57151.59173.70439981247
Max.118.85154.46187.8353632022,858
Mean116.5152.6179.649824311,779
Table 3. Average content of PTE in coal and ashes from individual household furnaces in Pszczyna—Piasek (standard deviation, SD, presented in brackets; RF—relative enrichment factor).
SampleElement (mg/kg)
AsCdPbBaSeNiTlZnThU
Hard coal
Mean
4.9 (0.45)0.4 (0.083)77.4 (2.83)103 (15.9)0.7 (0.095)18.2 (1.99)1.41 (0.13)87.6 (2.20)10.2 (0.83)5.2 (0.27)
Min.4.40.269.4870.417.31.1279.39.84.9
Max.5.30.486.21280.819.71.5196.210.95.4
Ash
Mean
20.2 (0.87)7.1 (6.83)36.1 (13.31)101.4 (121.5)6.4 (0.69)122.5 (14.58)6.6 (0.42)2016.8 (31.39)12.4 (1.17)6.1 (0.33)
Min.19.63.429.476.35.7109.45.51983.311.85.9
Max.21.38.643.8128.46.9131.67.12173.212.96.3
RF1.04.50.10.22.31.71.25.80.30.3
Eco-pea coal Mean1.1 (0.54)0.6 (0.35)60.2 (2.38)940 (20.3)0.2 (0.058)43.1 (0.98)0.13 (0.04)933.6 (17.67)0.6 (0.18)0.2 (0.016)
Min.0.90.556.48450.239.60.11879.20.40.2
Max.1.30.763.89690.348.10.14951.60.70.3
Ash Mean5.5 (0.23)3.5 (0.30)8.4 (0.43)213 (313.3)0.6 (0.20)11.5 (2.36)0.22 (0.06)1386.3 (32.22)2.5 (0.36)1.3 (0.62)
Min.4.93.37.81670.410.80.201312.72.30.9
Max.5.73.78.62420.811.90.261434.92.71.4
RF0.60.60.020.020.30.030.20.20.50.7
Literature data 1Comparison of trace elements contents in coal from different countries
0.5–800.1–4.312.69–800.2–43600.2–4.70.5–500.1–0.345–3002.4–3.53
1 [27,42,43,44,45,46,47,48,49,50,51].
Publisher’s Note: MDPI stays neutral with regard to jurisdictional claims in published maps and institutional affiliations.

