1. Introduction
As one of the critical ways for global trade, maritime transportation accounts for 80% of the global trade volume [
1] but also emits many pollutants. The International Maritime Organization (IMO) has made further restrictions on the emissions of ships [
2,
3,
4]. At least 40% carbon emission intensity of ships should be reduced by 2030, and make efforts to reduce 70% compared with the level in 2008 [
5]. The shipping industry is currently facing the challenges of increasingly stringent environmental protection regulations [
6]. One of the effective means of response is the use of green and clean energy.
IMO Marine Environmental Protection Commission (MEPC) proposed that wind energy is a green energy source, and the use of wind energy to assist the thrust of ships can effectively reduce ship energy consumption [
7,
8]. Sail-assisted navigation is the main form of wind energy utilization on ships [
9,
10]. In order to ensure the best thrust effect, the sail should keep at an optimal rotation position as the wind direction changes. The rotation of the sail is usually driven by a hydraulic system. Leakage is the most common failure in the hydraulic system [
11,
12]. The leakage failure is usually concealed and complicated. Therefore, the maintenance cost of equipment can be reduced, and the reliability of the system can be improved by a high-accuracy diagnosis method for the sail slewing hydraulic system [
13,
14].
Research on the diagnosis of hydraulics has been conducted by many scholars, and many methods were proposed [
15,
16,
17], such as model diagnosis method and data-based diagnostic method [
18]. The model-based fault diagnosis method is to build a highly accurate simulation model based on the mechanism of the diagnostic object to perform the cause of the fault analysis [
19]. This diagnostic method has high requirements for the accuracy of the model. Kumar et al. [
20] analyzed the state of failure by constructing a dynamic model of the hydraulic column plunger pump to monitor the health of the device. Nie et al. [
21] analyzed the loss of internal leakage by establishing a fluid power model of friction in the plunger pump. These studies have promoted the possibility of the model diagnosis method in practical applications, but the model established by these scholars is aimed at a single device and is not suitable for large mechanical systems.
The working status of the device is reflected by extracting the hidden features of the data through the intelligent algorithm in data-based diagnosis method [
22]. Zhu et al. [
23] established a Particle Swarm Optimization (PSO) based Convolutional Neural Network (CNN) model and identified the faulty state of the hydraulic plunger pump by sound signals. Jiang et al. [
24] conducted time-frequency decomposition and de-noising of the original signal to realize real-time fault diagnosis. Yafei et al. [
25] decomposed vibration signals of piston pumps by the Extreme-point Symmetric Mode Decomposition method (ESMD) to diagnose internal wear faults. Vibration signal fault features of centrifugal pumps are extracted through Continuous Wavelet Transform (CWT) by ALTobi et al. [
26]. They trained the extracted feature data by using the back-propagated Multi-Layer feedforward Perceptron-neural network (MLP-BP), achieving high diagnostic performance. Muralidharan et al. [
27] diagnosed five different fault states of a centrifugal pump with SVM and Extreme Learning Machine (ELM) by extracting features with different wavelet generating functions. A fault detection model is established with FPR by Huo et al. [
28] for equipment under harsh working conditions. The real-time running state of equipment can be monitored.
With the progress of sensor technology, various sensors are installed on the ship. It’s convenient to get the hydraulic system pressure and flow onboard [
29]. The signal acquired by the sensor needs to be decomposed in the time-frequency domain for analysis. As a classical time-frequency analysis method, Empirical Mode Decomposition (EMD) can decompose the original signal into multiple Intrinsic Mode Functions (IMF) for easy analysis and processing. Kumar et al. [
30] conducted EMD for bearing vibration signals. The original multi-component signals are divided into multiple single-component signals IMF, and the first three IMFs of bearings under different working conditions are extracted as the input of the K-Nearest Neighbor (K-NN) classifier, finally achieving relatively excellent diagnostic performance. Grover et al. [
31] used the EMD method to preprocess the original vibration data, extracted six types of statistical features, and proposed a fault diagnosis method consisting of five stacked integrators. By comparing with traditional integrated classifiers, the effectiveness of this method was proved. However, the EMD method has the problem of mode mixing. In order to solve this problem, scholars have proposed many improved methods, including Ensemble Empirical Mode Decomposition (EEMD) and parameter adaptive Variational Mode decomposition (VMD). Shifat et al. [
32] used EEMD to decompose the collected motor vibration signals, selected IMF according to the similarity index to facilitate fault frequency location, then used Principal Component Analysis (PCA) technology to reduce the characteristic dimensions, and used KNN’s supervised machine learning technology for classification. This method is feasible for early fault diagnosis. Miao et al. [
33] proposed an improved parameter adaptive VMD to design a new indicator of integrated kurtosis by utilizing kurtosis and envelope spectrum kurtosis. By iterating, modes with more fault information are selected as candidate modes for the final diagnosis decision, and the residual signals after each decomposition are reconstructed through filtering. This method is helpful in extracting weak fault information for compound fault diagnosis. Xie et al. [
34] proposed a multi-scale multi-layer perceptron (MSMLP) hybrid bearing fault diagnosis method based on complementary integrated Empirical Mode decomposition (CEEMD) in combination with the characteristics of large noise and small samples of mechanical equipment data. CEEMD was used to decompose bearing vibration signals. The IMF with the highest correlation is selected and finally input into the MSMLP model for classification. Through comparison, it is found that this method has higher diagnostic accuracy than other methods. Although these methods are of great significance for solving the problem of compound fault diagnosis, due to their weak noise suppression ability [
35], the results of direct decomposition are often difficult to reach the expected goal.
Table 1 shows the analysis of different methods for fault diagnosis.
Studies mentioned above mainly focused on vibration and noise signals to perform diagnosis analysis. Nevertheless, due to the harsh working environment and complex system structure, as well as the alternating wind load, effective noise signals and vibration signals for the sail slewing hydraulic system are hard to get. Therefore, the studies mentioned are not suitable for performing fault diagnosis for the sail slewing hydraulic system. WPT is suitable for extracting and recognizing the feature of pressure and flow signals in sail slewing hydraulic systems, as its high accuracy and strong time-frequency localization decomposition ability. Ma et al. [
36] decomposed the pressure signals in the hydraulic lifting system by wavelet packet, extracted signal features such as wavelet packet entropy and energy variance, and used the extracted features to train the SVM multi-classification diagnosis model, achieving good diagnostic results and proving the effectiveness of fault feature extraction by wavelet packet decomposition. In FPR, the membership function is used as the measure of the sample and template, which can effectively reflect the overall features of the pattern, and has a strong ability to eliminate interference, noise, or distortion in the sample. Consequently, this paper proposed a WPT-FPR-based fault diagnosis method to diagnose three critical equipment leakage with pressure and flow signal of the sail slewing hydraulic system.
This paper has two contributions:
- (1)
An AMESim simulation model of sail slewing hydraulic testbed is established. The comparison of pressure, rotation speed, as well as rotation angle between the simulation model and testbed verified the effectiveness of the model. The established model can effectively analyze the running states of the sail slewing hydraulic system.
- (2)
A WPT-FPR-based method for leakage fault diagnosis of sail slewing hydraulic system is proposed. Different leakage fault diagnosis of the reversing valve, speed regulating valve, and the hydraulic motor is realized with high accuracy. It is of great significance to improve the energy efficiency level of the sail-assisted ship as well as the reliability of the sail slewing hydraulic system.
The remainder of this paper is organized as follows:
Section 2 introduces the fault diagnosis method, including the modeling of the sail slewing hydraulic system, the fault feature extraction method, as well as FPR-based diagnosis method.
Section 3 presents a case study, including the model effectiveness verification, operation analysis, and leakage fault feature of the sail slewing hydraulic system testbed.
Section 4 discusses the fault diagnosis results of 10 different fault modes and the limitations of the present work. Finally, the conclusions and future work are given in
Section 5.
2. Method
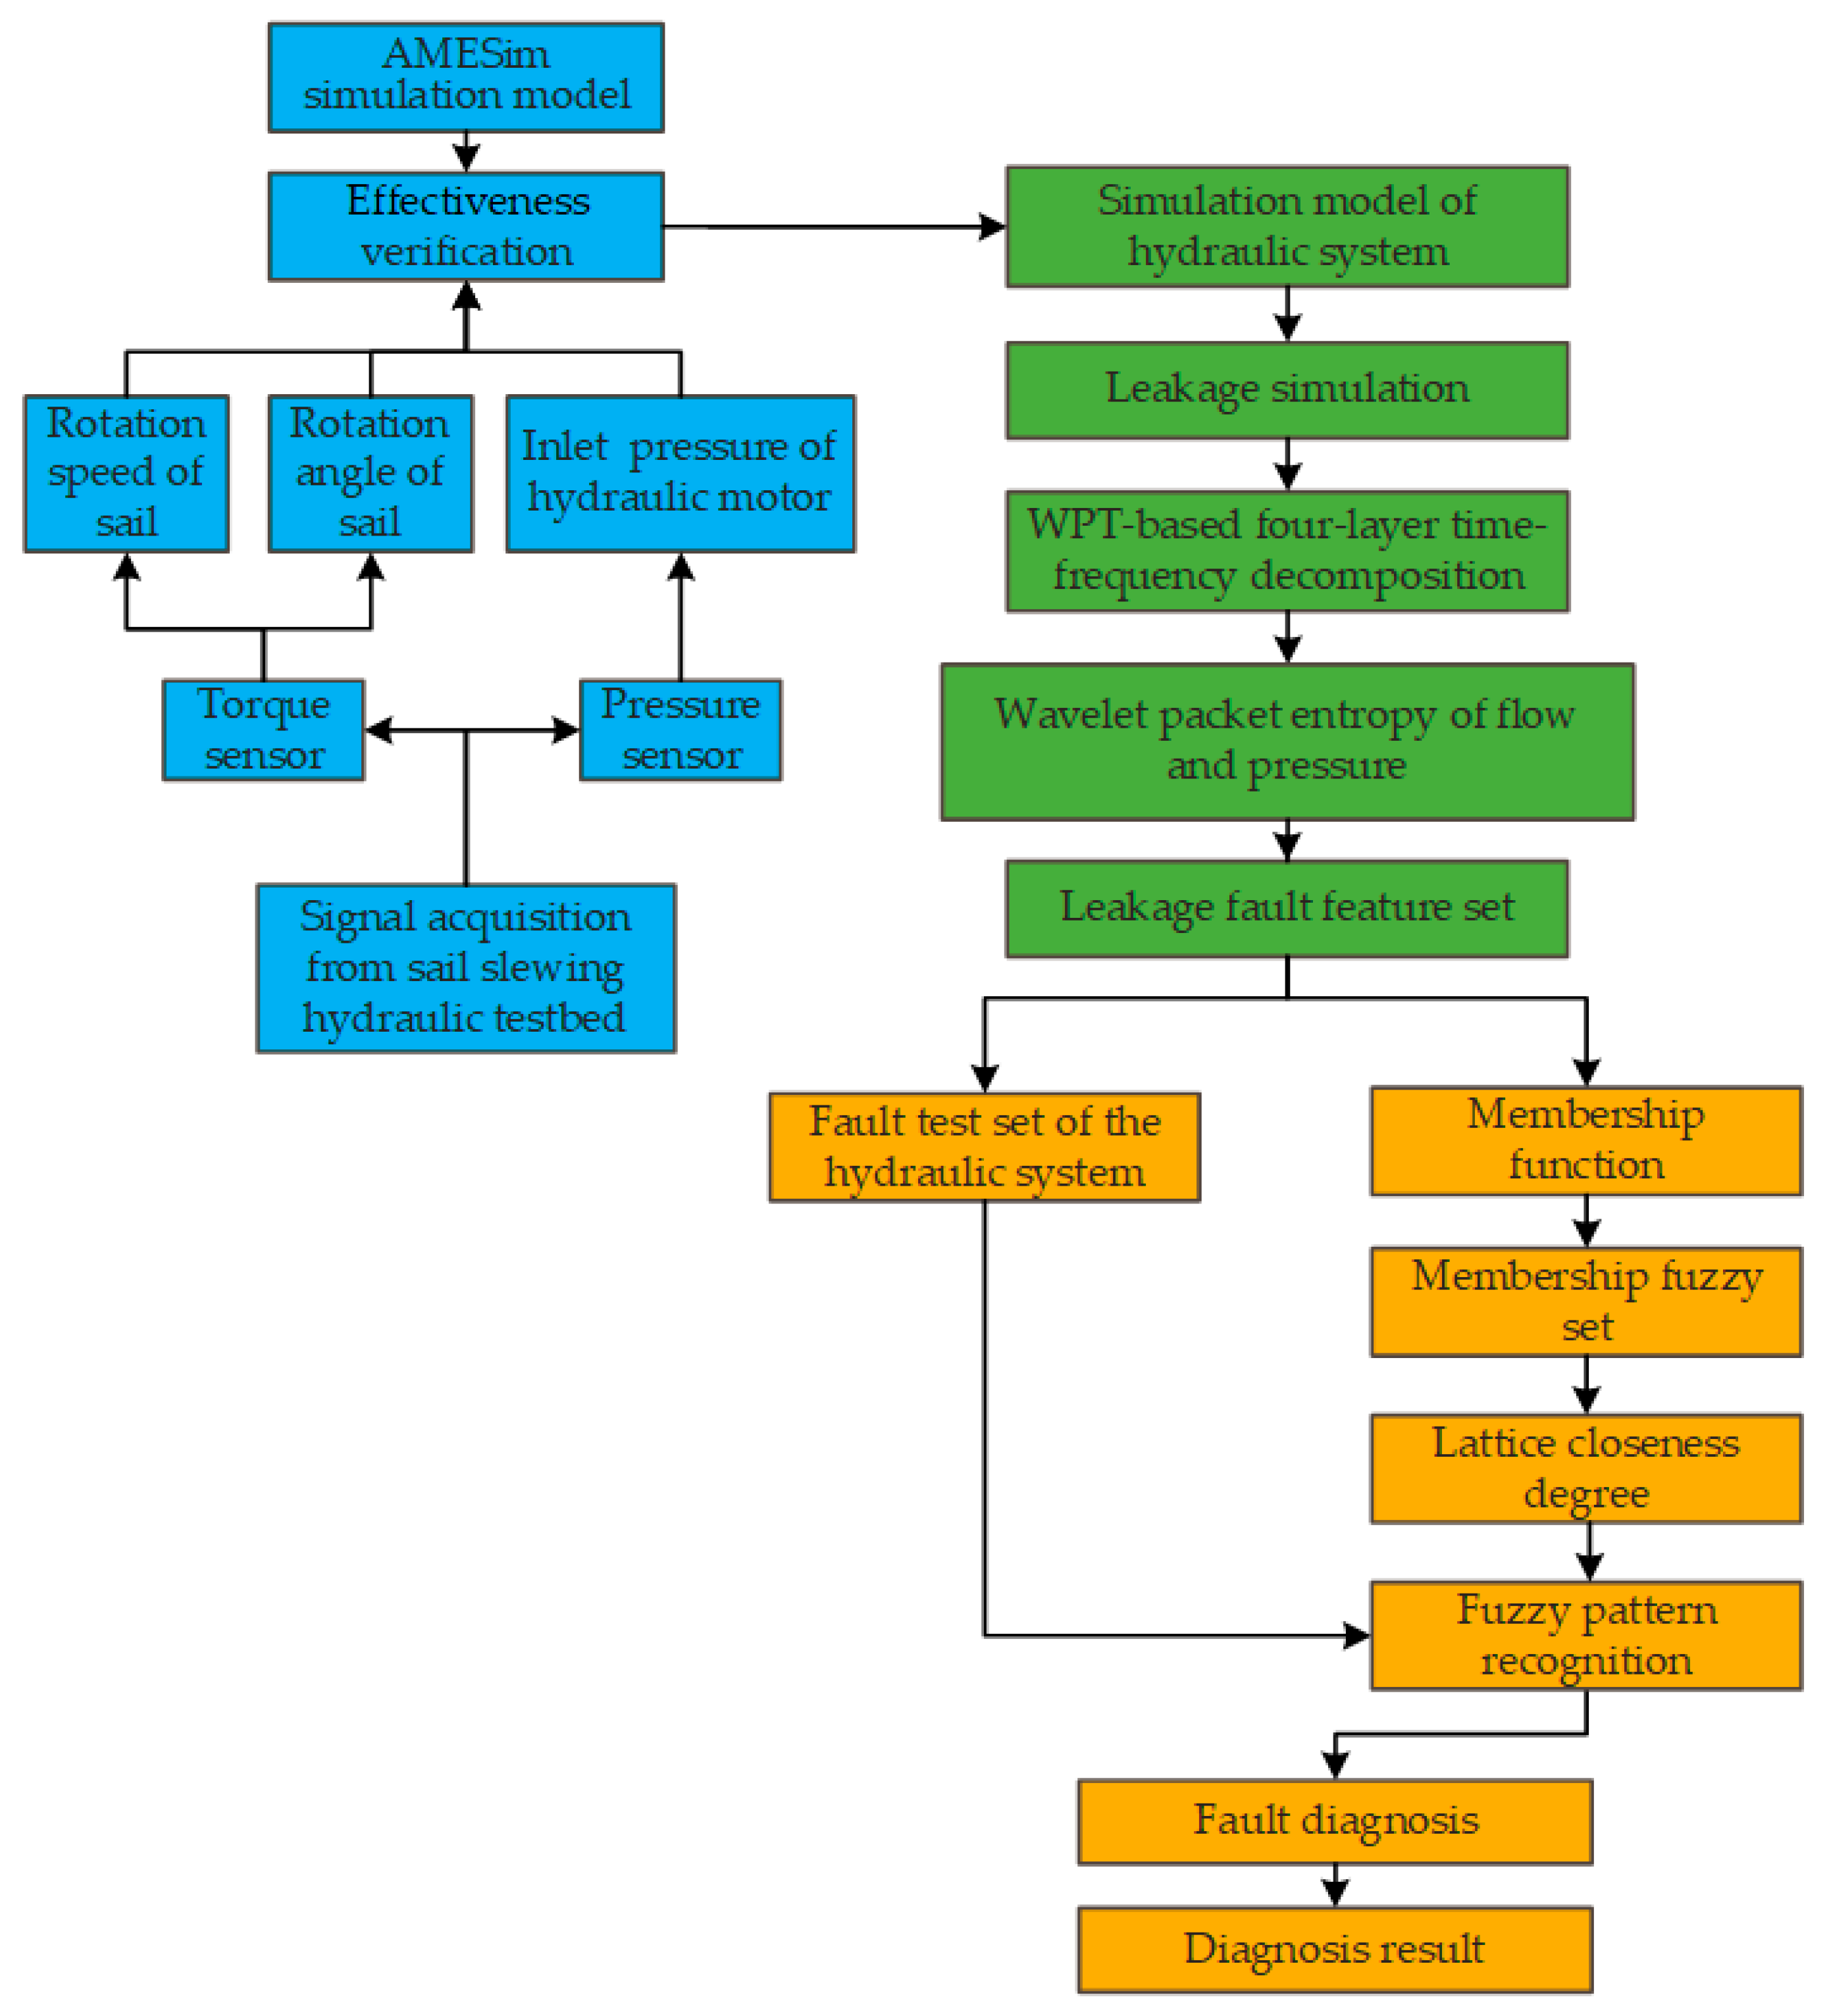
Figure 1 shows the process of the proposed method: First, an AMESim simulation model is established, the rotation speed and angle of the sail slewing gear are measured from a torque sensor, and the inlet pressure of the hydraulic motor is measured from a pressure sensor of sail slewing testbed is used to verify the effectiveness of the model. Then, different leakage conditions are set to simulate the leakage fault states.
Secondly, the flow and pressure signals of reversing valve, speed regulation valve, and hydraulic motor are decomposed by four-layer WPT to extract the leakage fault features, and the fault feature set is established.
Then, the membership function and fuzzy set of different leakage modes are calculated, and the fault diagnosis is performed by calculating the lattice closeness degree of the fault test set based on FPR.
Finally, a fault diagnosis case of a sail slewing hydraulic testbed shows the result of the proposed method.
2.1. Modelling of the Sail Slewing Hydraulic System
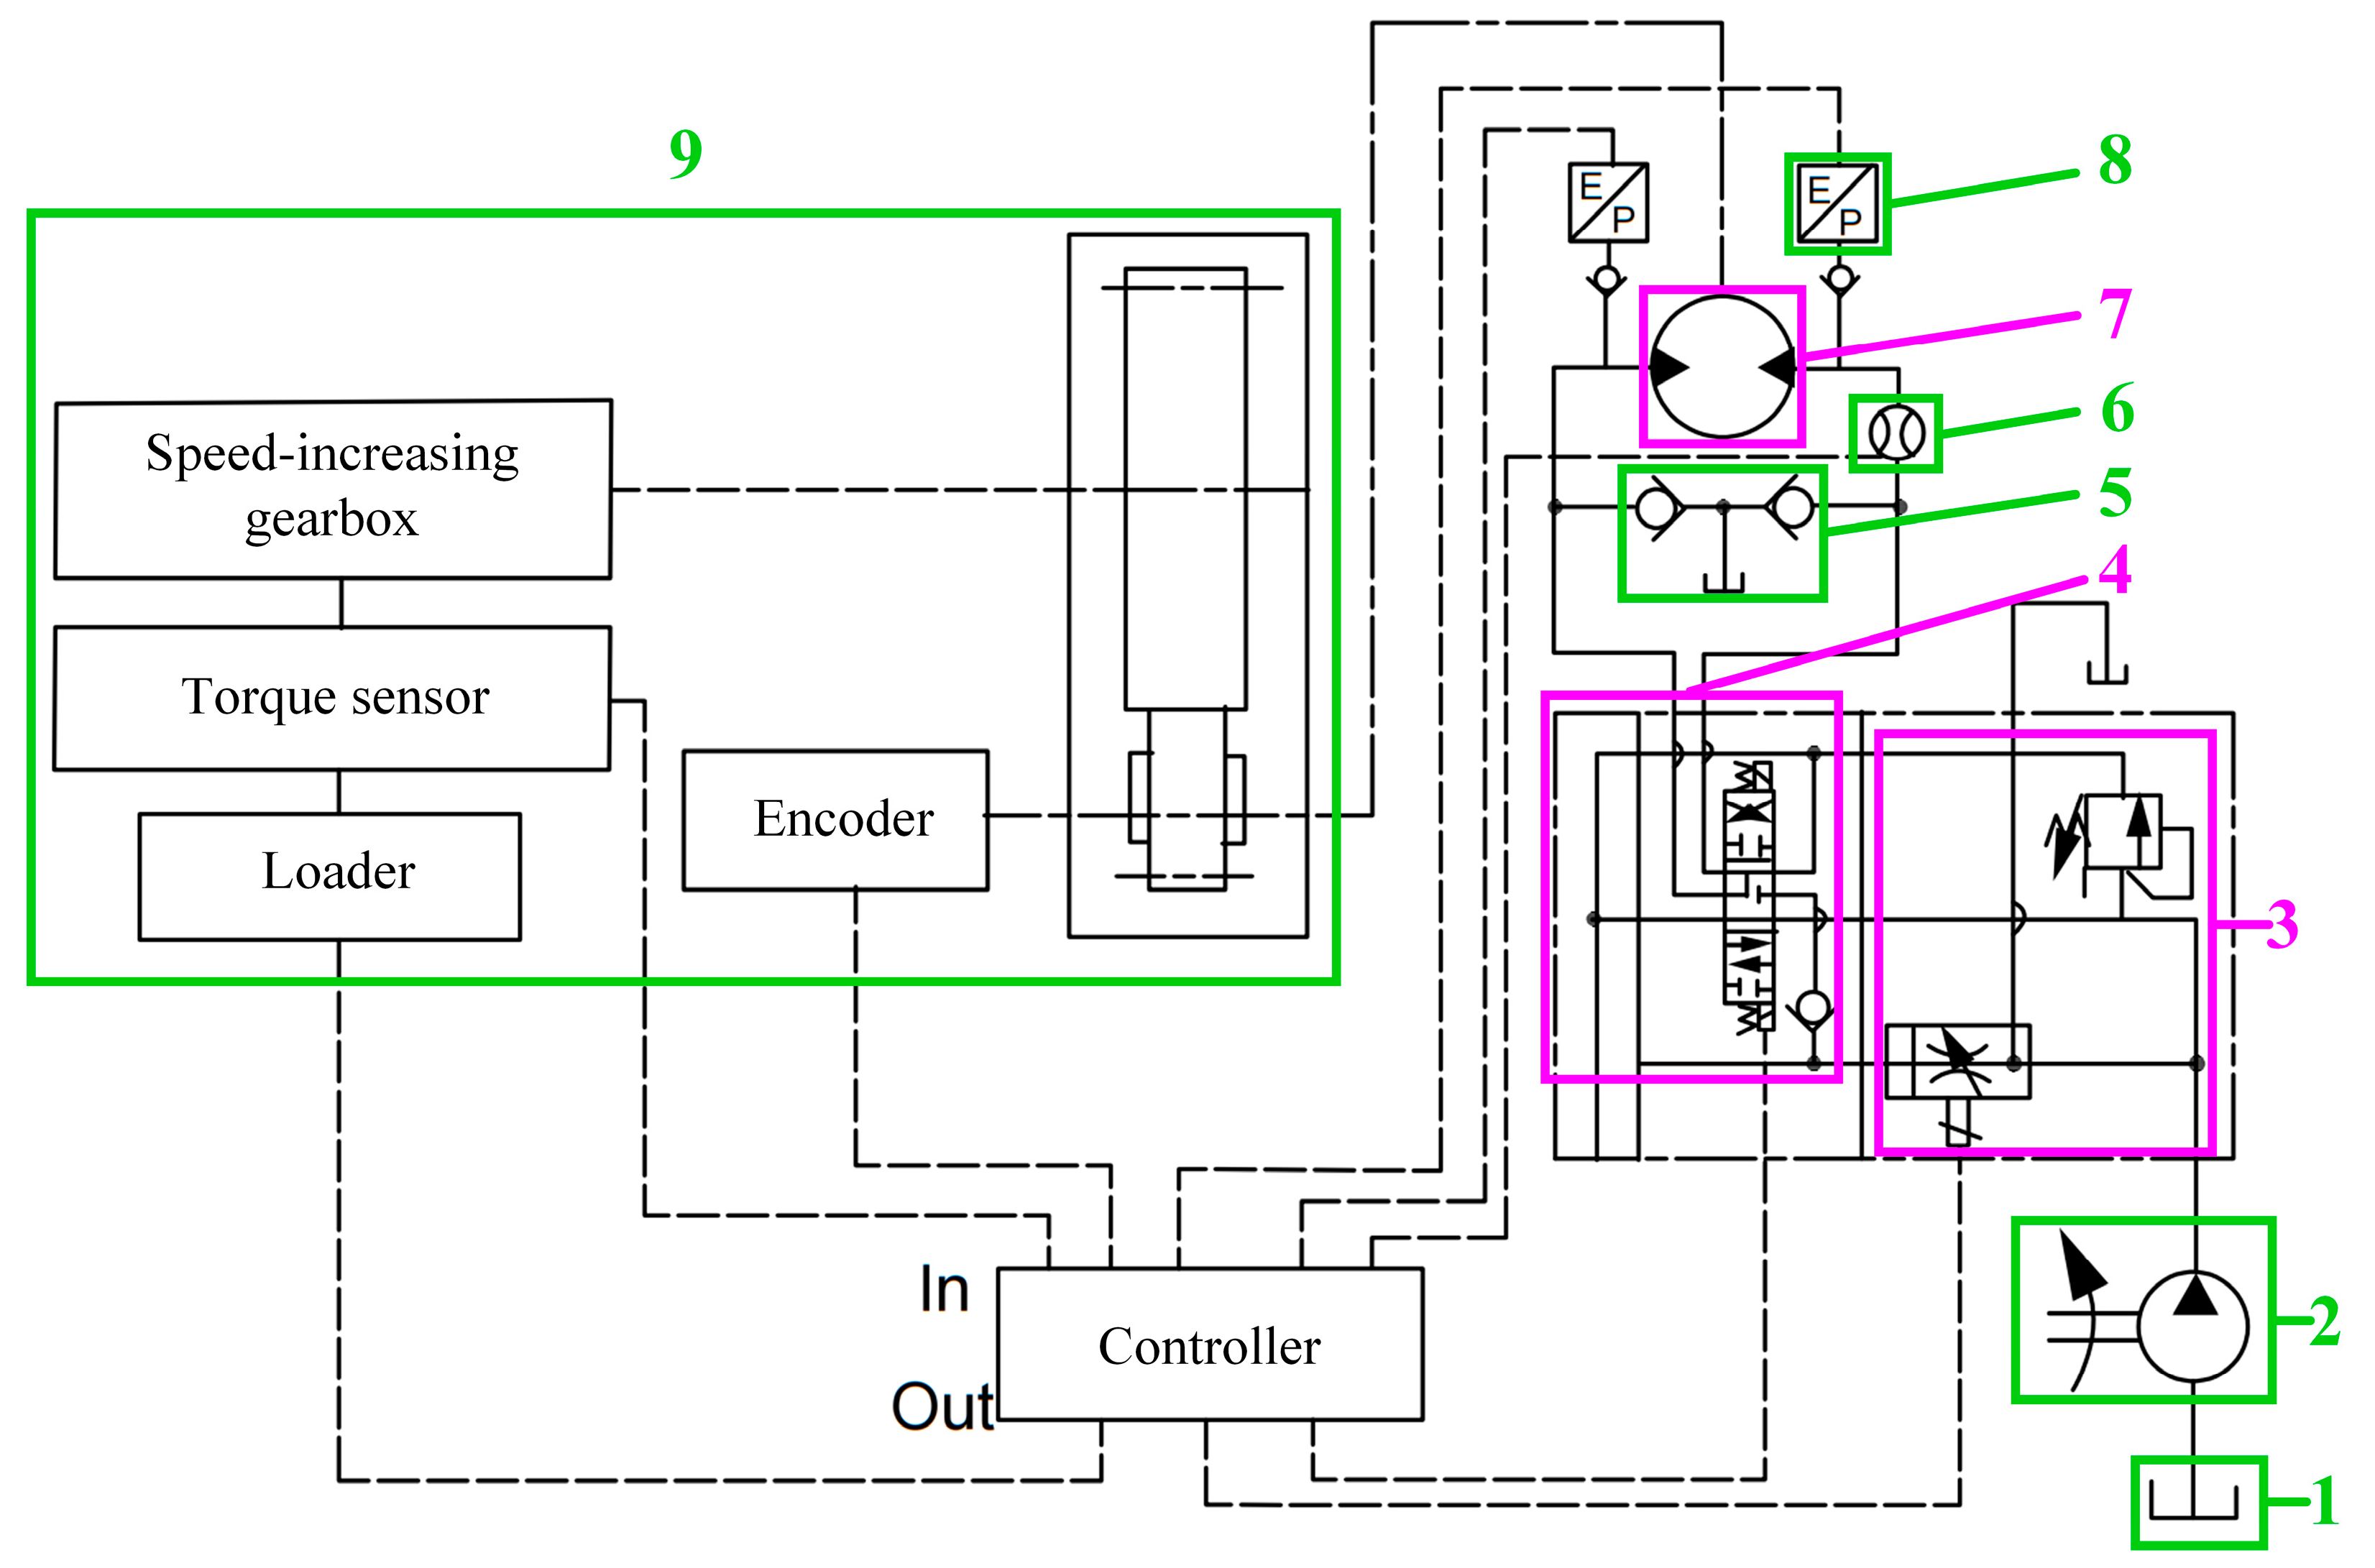
A sail slewing hydraulic testbed was established according to the actual system of a ship. The schematic diagram is shown in
Figure 2. The slewing movement of the sail is controlled by reversing valve, and the slewing speed of the sail is controlled by the speed regulating valve.
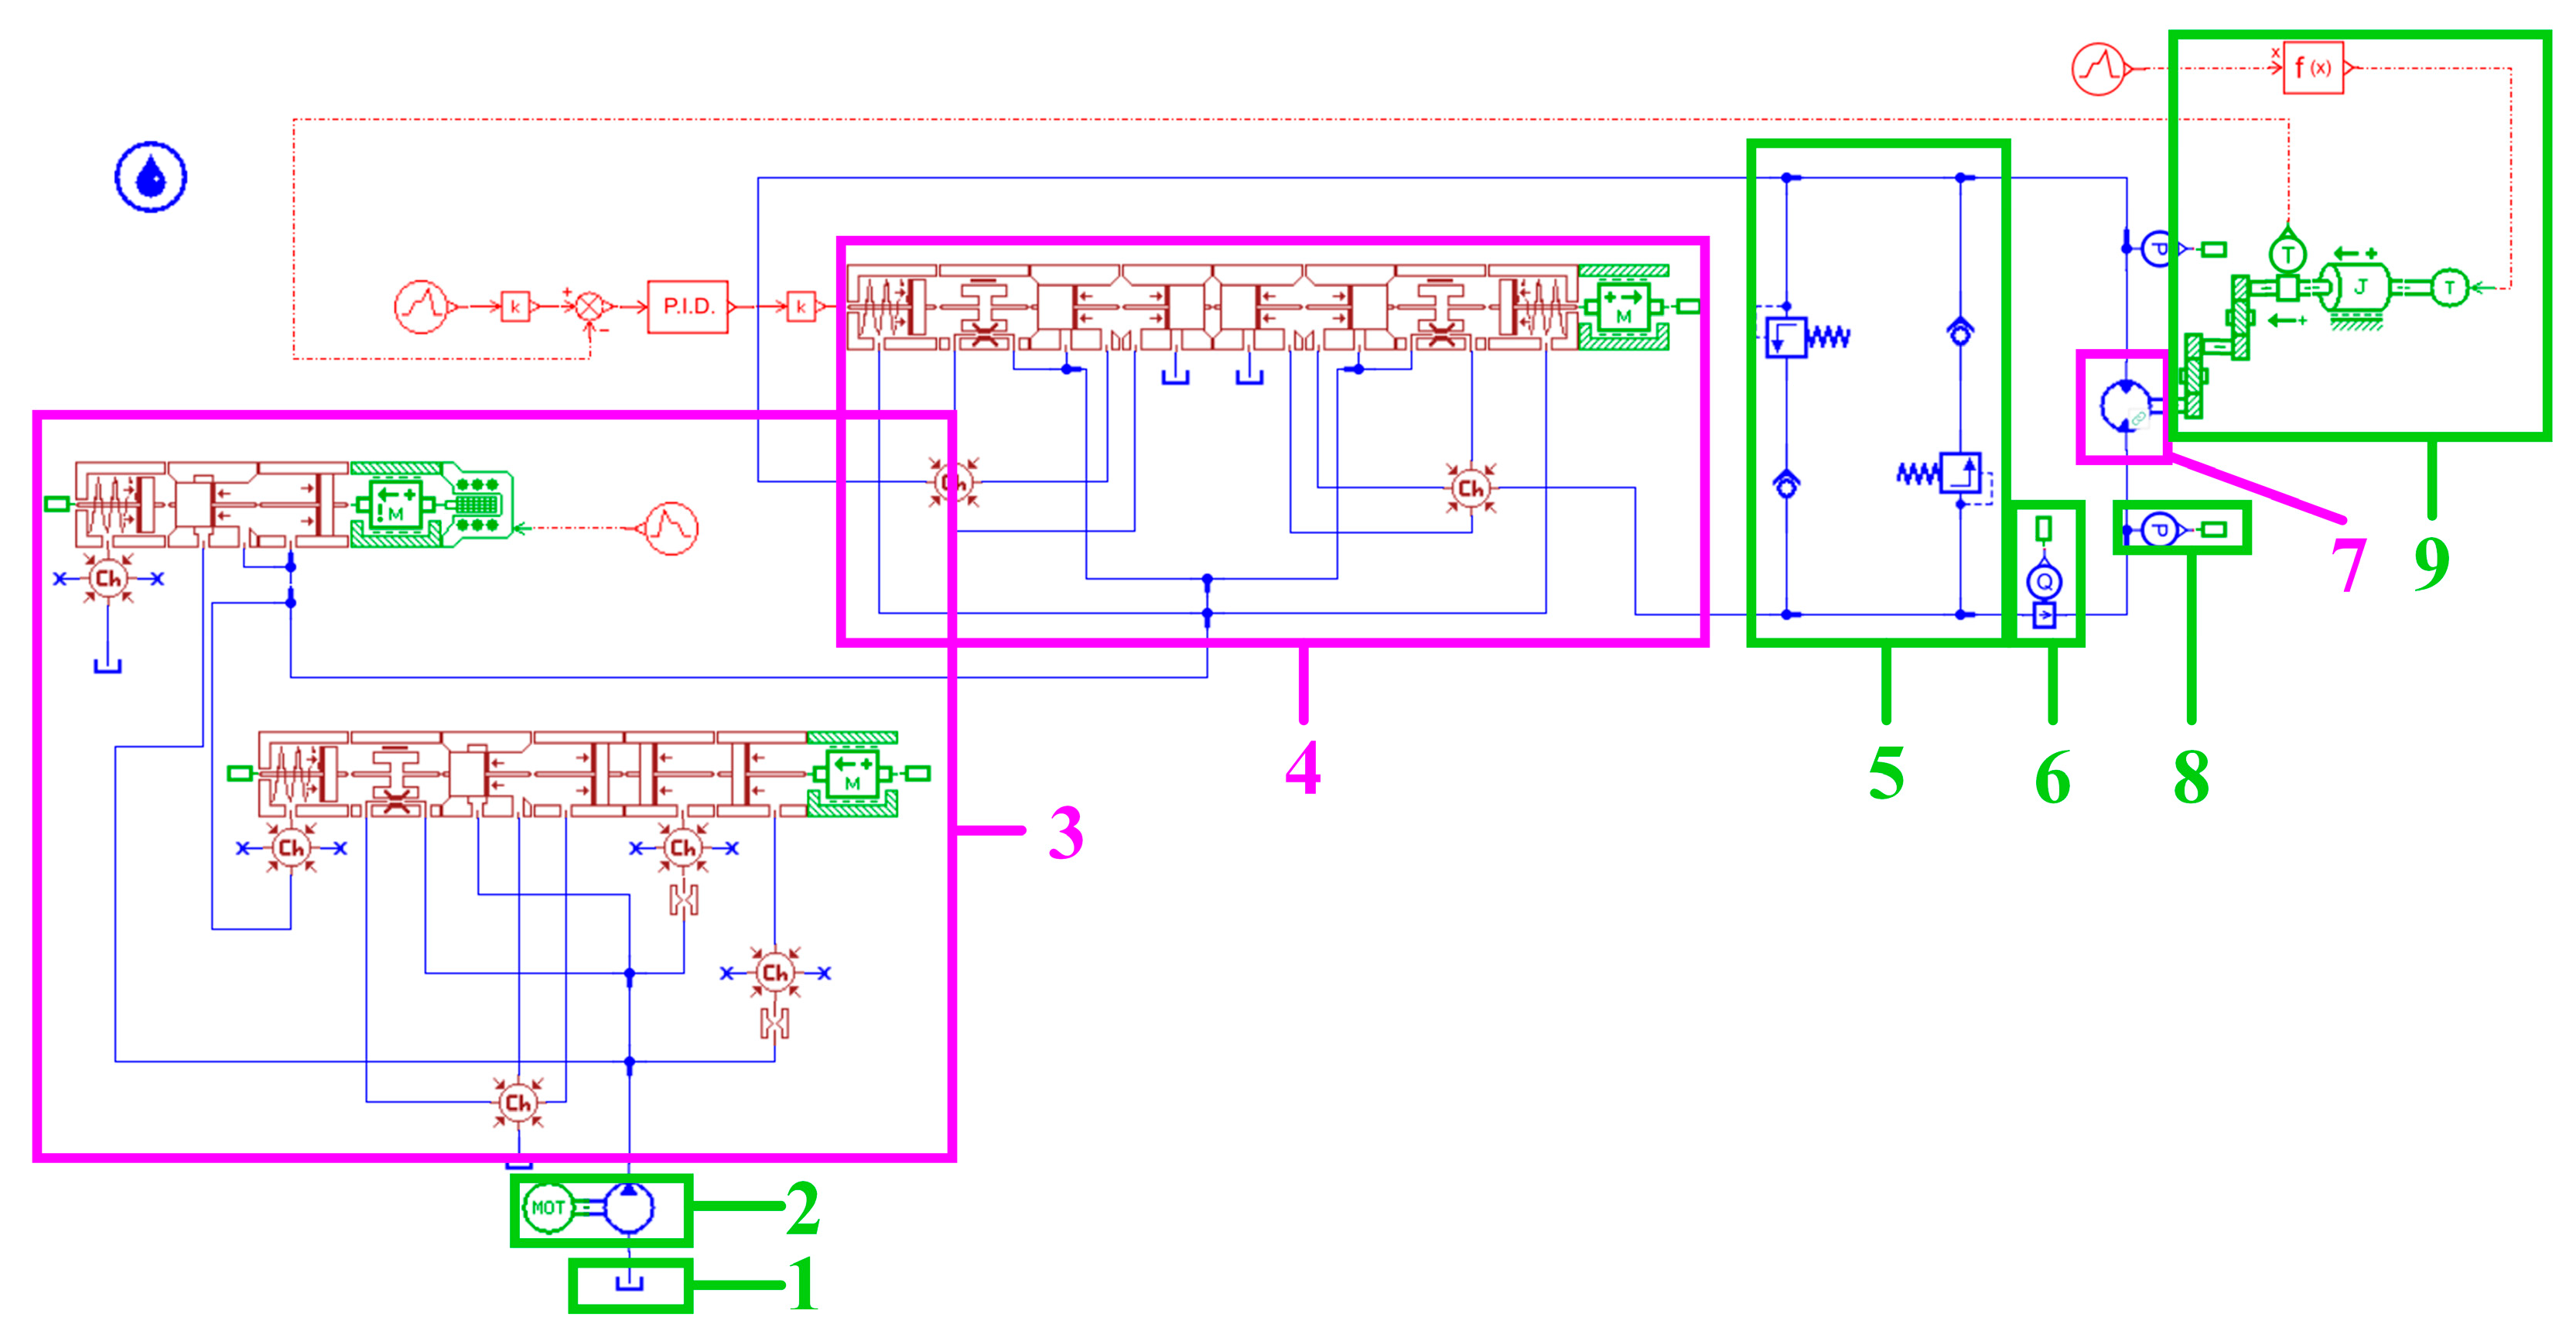
AMESim is a large simulation platform used for the simulation analysis of hydraulic systems, through which the simulation of the hydraulic system can be carried out conveniently.
Figure 3 shows the AMESim simulation model of the testbed. Flow and pressure sensors are used to monitor the operating status of the hydraulic system. State performance and different leakage faults can be simulated by adjusting the parameters of the model.
2.2. Fault Feature Extraction Method
Lots of information are contained in the flow and pressure signals of the sail slewing hydraulic system [
37], and the components contained in these signals, such as the energy of each frequency band, will change once a leakage fault occurs. Therefore, the sensitive feature parameters of internal leakage can be extracted by decomposing the signal.
The decomposition algorithm of wavelet packet is
where,
is the
ith wavelet packet node (
j,
i) on 2
j decomposition scale,
t = 1, 2, …, 2
J−j;
i = 1, 2, …, 2
j;
J = log
2N,
H(
t) and
G(
t) are low-pass and high-pass filter respectively.
The reconstruction algorithm can be expressed as:
In addition, multi-resolution analysis can be achieved when scaling factors j change.
Daubechies wavelet (compactly supported set orthogonal wavelet) is the most used wavelet basis function for wavelet analysis. The db4 and db6 wavelets have advantages for the analysis of the high-frequency transient signal. Therefore, the db4 and db6 wavelets are selected to process the flow and pressure signals of the sail slewing hydraulic system.
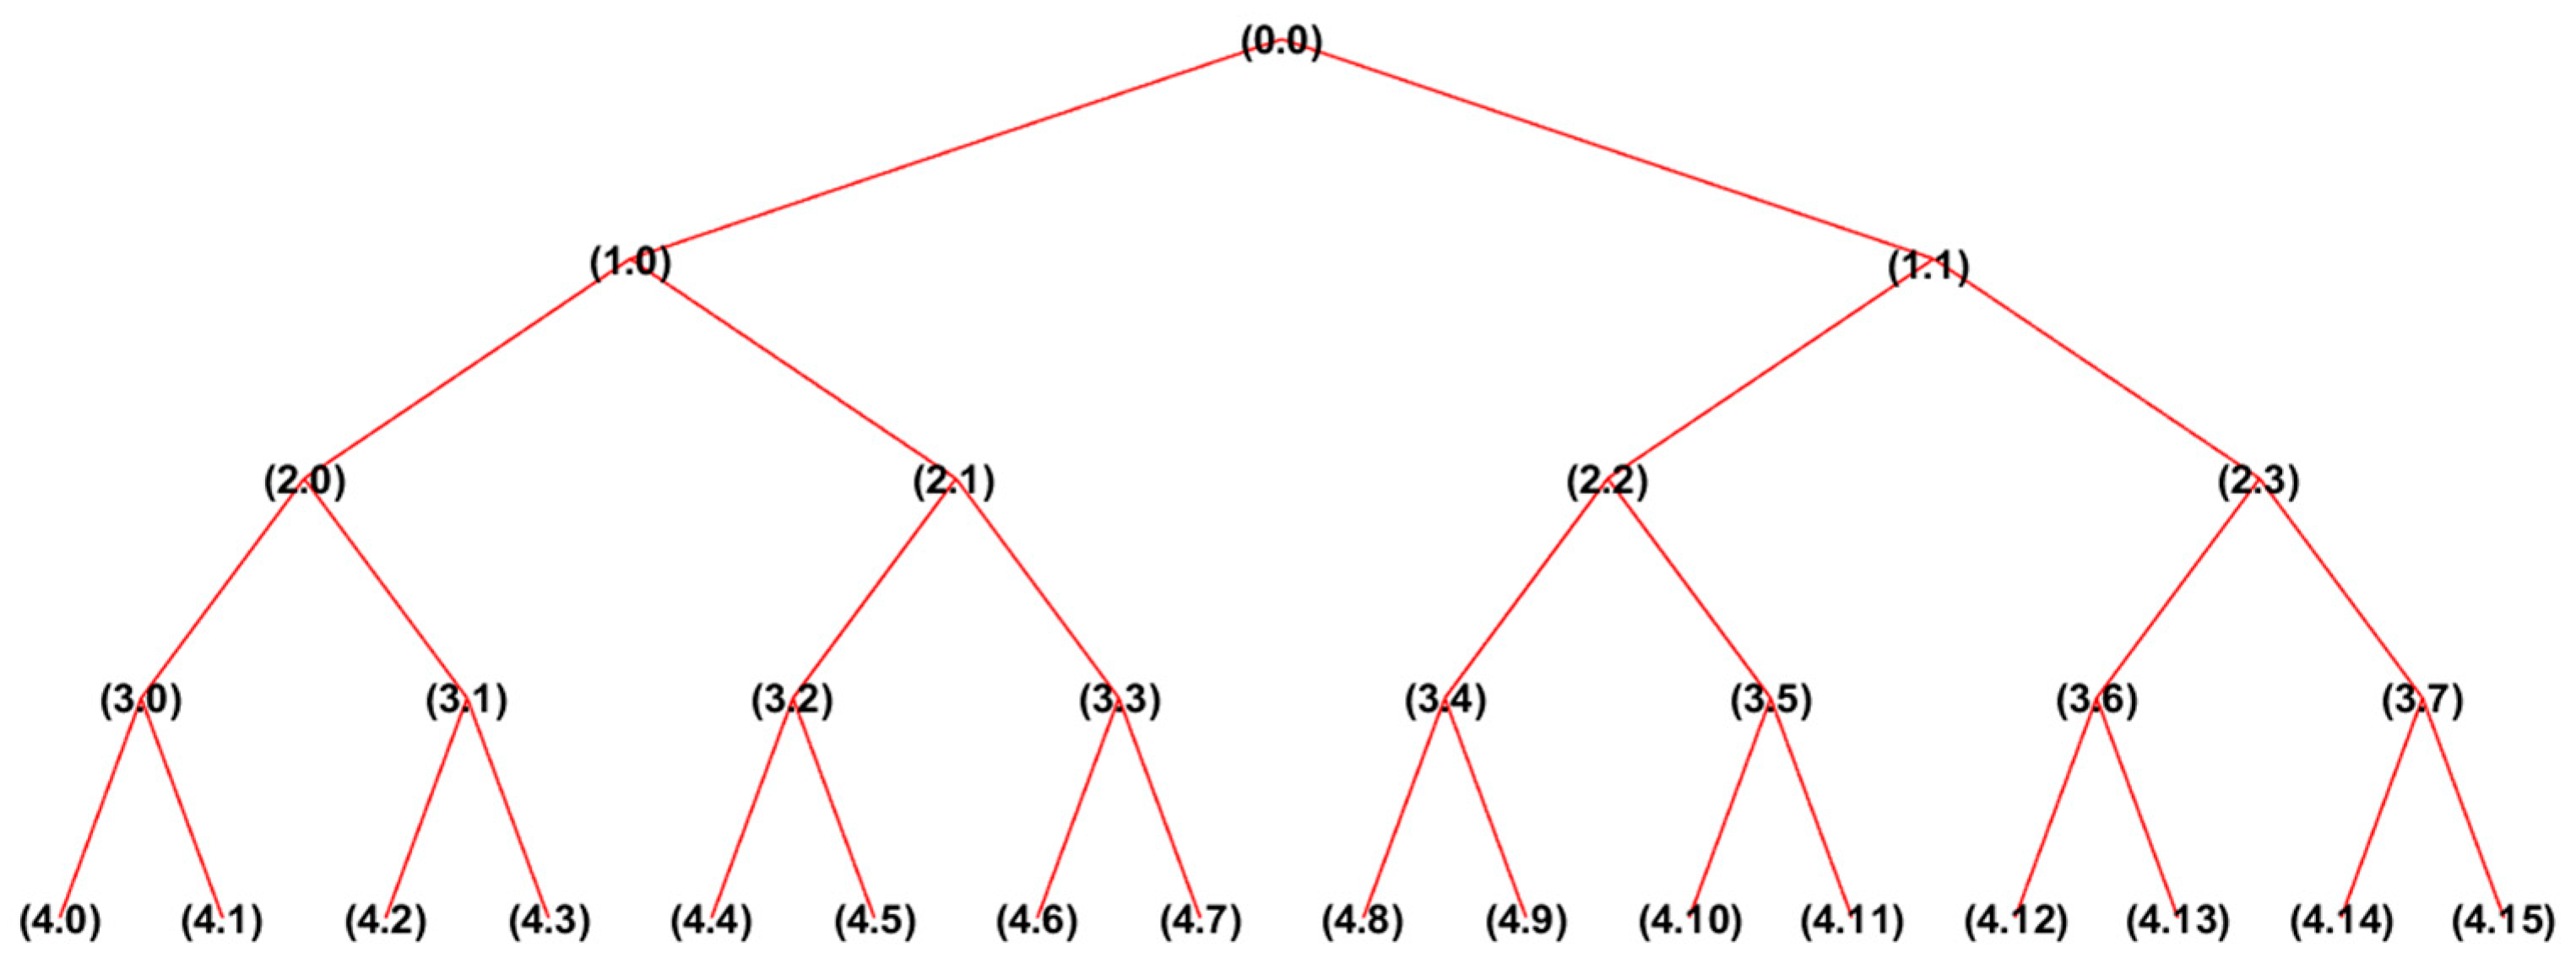
The decomposition layer is a certain division of the frequency range. The increase in the number of decomposition layers helps to analyze the characteristic information contained in high-frequency signals. However, with the increase in the number of decomposition layers, the calculation amount of data also increases. The four-layer wavelet packet decomposition can effectively extract the signal features reflecting internal leakage with less calculation amount, which is suitable to sail slewing hydraulic systems. Four-layer WPT is used to decompose the signals, as shown in
Figure 4.
After decomposition, the flow and pressure signal are reconstructed as follows,
where
S0,0 is the signal before decomposition,
Si,j is the reconstructed signal of the (
i,
j) sub band,
i = 4,
j = 0, 1, 2, …, 2
i− 1. Quantized energy values are:
where
Ei,j is the energy corresponding to
Si,j,
k is the signal points in
Si,j, (
k = 0, 1, 2,..., n),
xj,k is each signal point’s amplitude, and
T is signal acquisition time length. The quantization value
E of total wavelet packet energy is,
where
M is the feature vector.
The energy entropy statistical analysis of the signal to be identified in all frequency bands of the energy distribution, which is defined as:
where
WE is the energy entropy,
Pi is
ith sub-band percentage,
Ei is the energy of
ith sub-band.
2.3. FPR-Based Diagnosis Method
The information should be interpreted and classified after the fault features are obtained. The target objects can be classified by constructing the membership function of the fuzzy set in the FPR method. The membership function represents the fuzzy concept property of the target fuzzy set and quantifies the fuzzy property to facilitate the mathematical operation and analysis.
U is the set containing all objects to be identified. The interior of U can be divided into n fuzzy mode A1, A2, …… An, every target object included in U contains p feature indicators. The features of these indicators and targets are one-to-one correspondence. When all the targets to be identified in U are represented in the form of fuzzy set B, target B is divided into a category Ai with the highest degree of approximation in accordance with the nearest principle.
Set
A1,
A2,
…… An as
n fuzzy mode,
B is a fuzzy object, If
exists, that
It is believed that the fuzzy object B is a priority to the fuzzy mode Ai, of which N is the proximity function. The degree of closeness represents the degree of approximation between two fuzzy subsets. The higher the closeness, the more similar they are. Lattice closeness is selected in this paper to calculate the closeness.
As for the fuzzy set, if
X refers to the all-discussion objects within a certain range, fuzzy set
A on the domain
X is a mapping of [0,1], that is,
where
is the degree of membership of
x to
A when
x belongs to
X. The greater the
is, the higher probability of
x being classified as a fuzzy set
A. The fuzzy set is usually expressed as a vector:
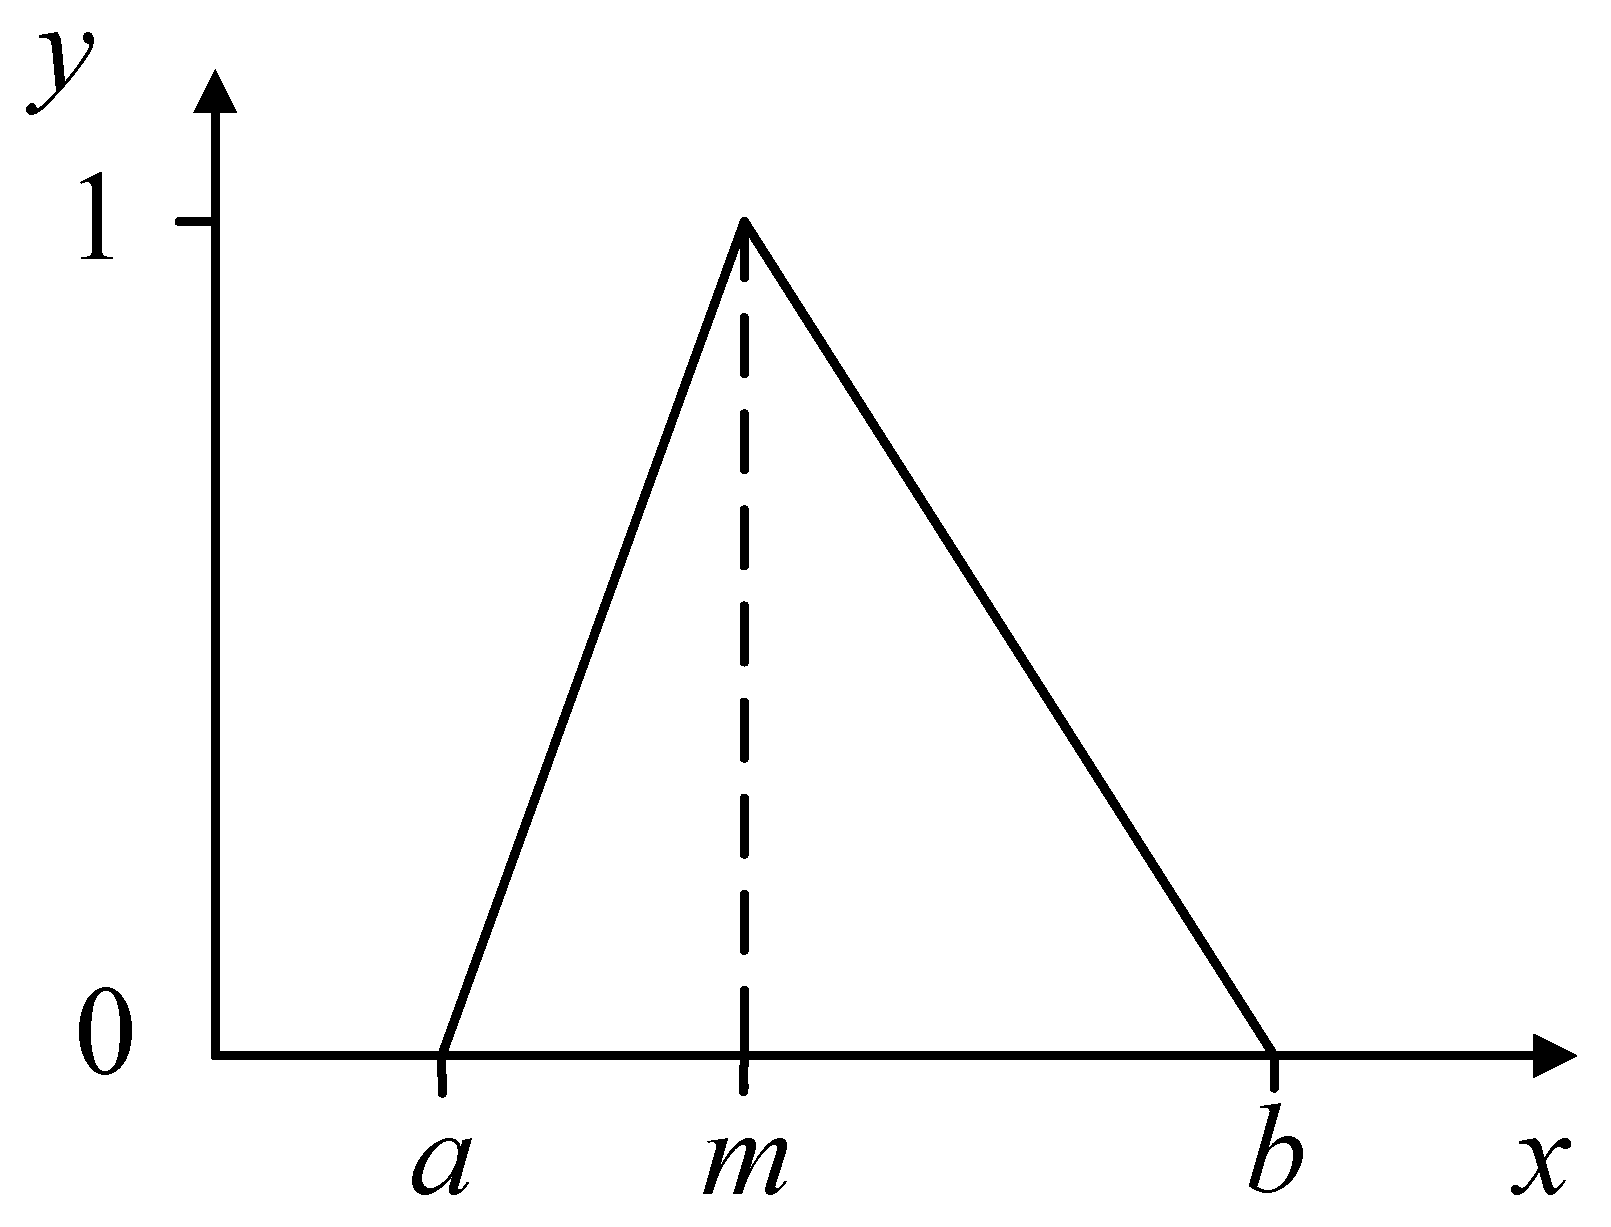
In order to express the vagueness as well as show the specific objective content contained behind the evaluation index, the ambiguity of the selected fuzzy set needs to be minimized. The minimum ambiguity method and triangular membership function is selected in this paper to construct the membership function of the hydraulic system leaking fault, as shown in
Figure 5. The establishment method of triangular membership functions is as follows.
Based on the principle of minimum ambiguity, when the median number is taken, the vagueness is the smallest, so a, b, and m are the signal energy entropy corresponding to minimum leakage, maximum leakage, and medium digit number, respectively. The membership function is obtained according to the different modes of leakage.
3. Case Study
3.1. Study Object
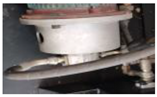
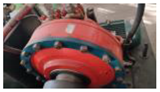
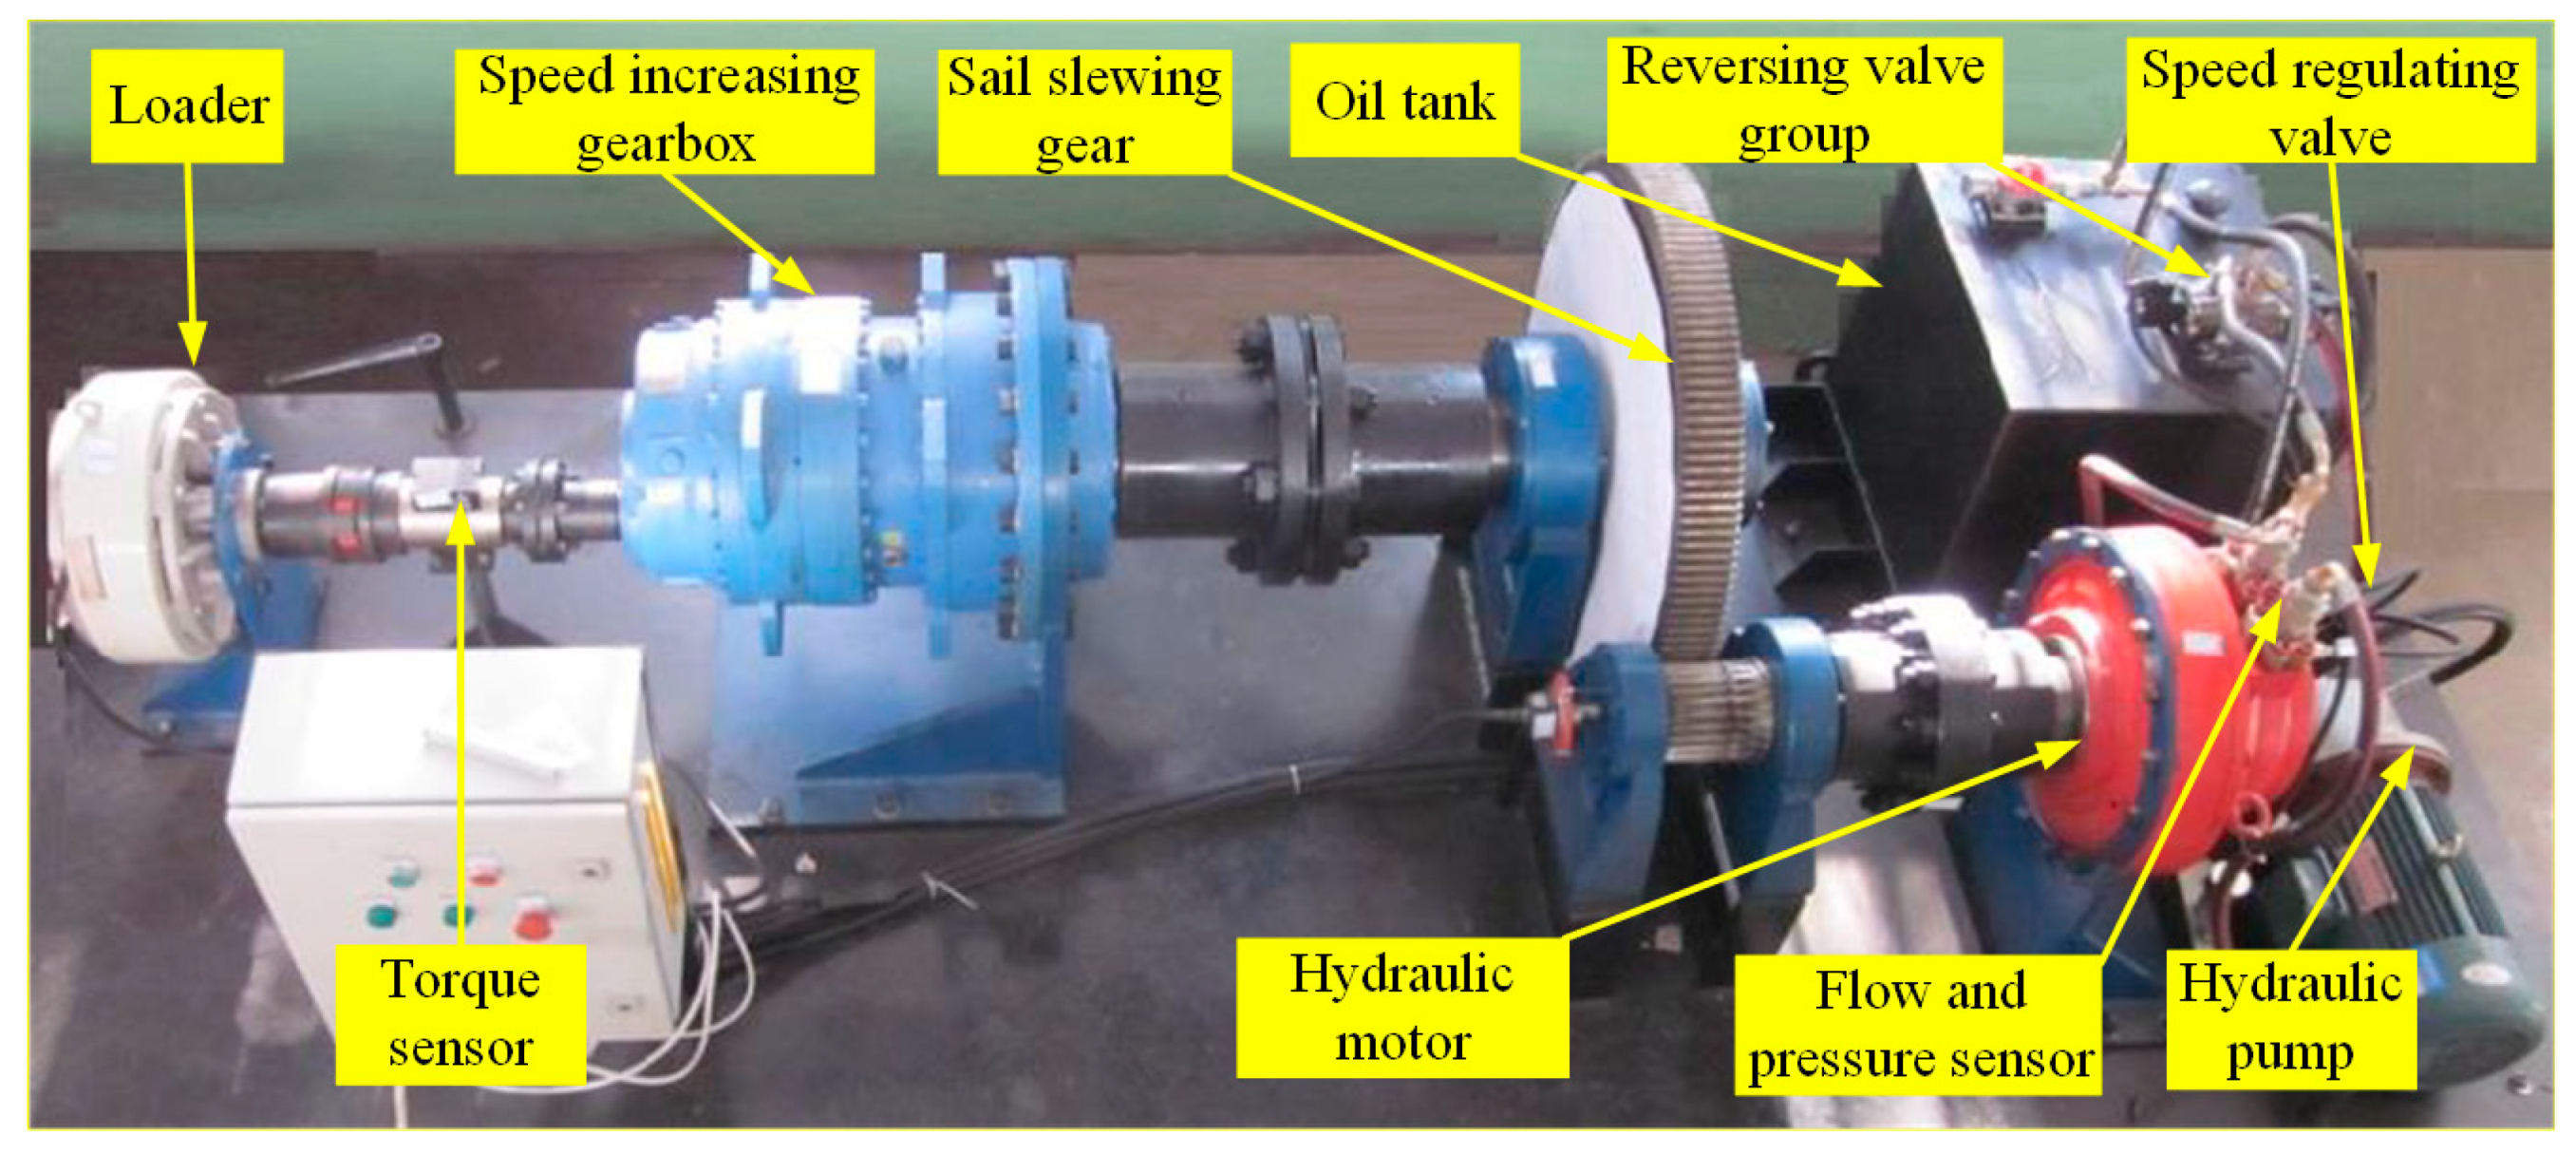
A sail slewing hydraulic system equipped on a large bulk carrier is selected as the research object. According to the parameters of ship and sail, as well as the schematic diagram of sail slewing hydraulic, a sail slewing hydraulic testbed is built at a ratio of 10:1, as shown in
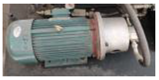
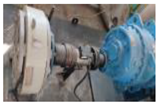
Figure 6.
The magnetic particle brake is used to simulate the loading of wind resistance moment. The torque sensor, pressure sensor, and flow sensor are used to collect the operating parameters of the system. Due to its compact structure and ease of installation, a CT60 turbine flowmeter is used to measure the flow rate of the testbed. It has a measuring flow range of 3~60 L/min, a maximum working pressure of up to 42 MPa, and an accuracy error of ±1% FS. A 520 series relative pressure transmitter is used to measure the inlet and outlet pressure of the hydraulic motor. It has a pressure range of 0.25~60 MPa, a working ambient temperature of −30~85 °C, and a dynamic response time of less than 2 ms. The TL303 speed torque sensor can measure speed and torque at the same time, which is used to measure the speed and angle of sail slewing gear as well as the input wind resistance moment. It has an accuracy of ±0.5% FS, a frequency response of 100 µs, an operating temperature of −10~50 °C, and a frequency signal output range of 5 kHz~15 kHz.
The controller collects the signals and transmits the signals of various sensors to the computer in real-time through the CAN bus for display and storage. At the same time, after obtaining the input control signal, the controller controls the working state of the loader, reversing valve, and speed regulating valve, respectively, to adjust the wind resistance moment, the rotation direction, and the speed of the hydraulic motor in real-time, and achieve the precise control of the sail slewing angle and speed.
Table 2 shows the sail slewing testbed and simulation model parameters.
3.2. Model Effectiveness Verification of Simulation Model
When the ship course or true wind direction changes, the sail needs to rotate to a new position according to the sail control strategy to achieve the best-assisted thrust effect.
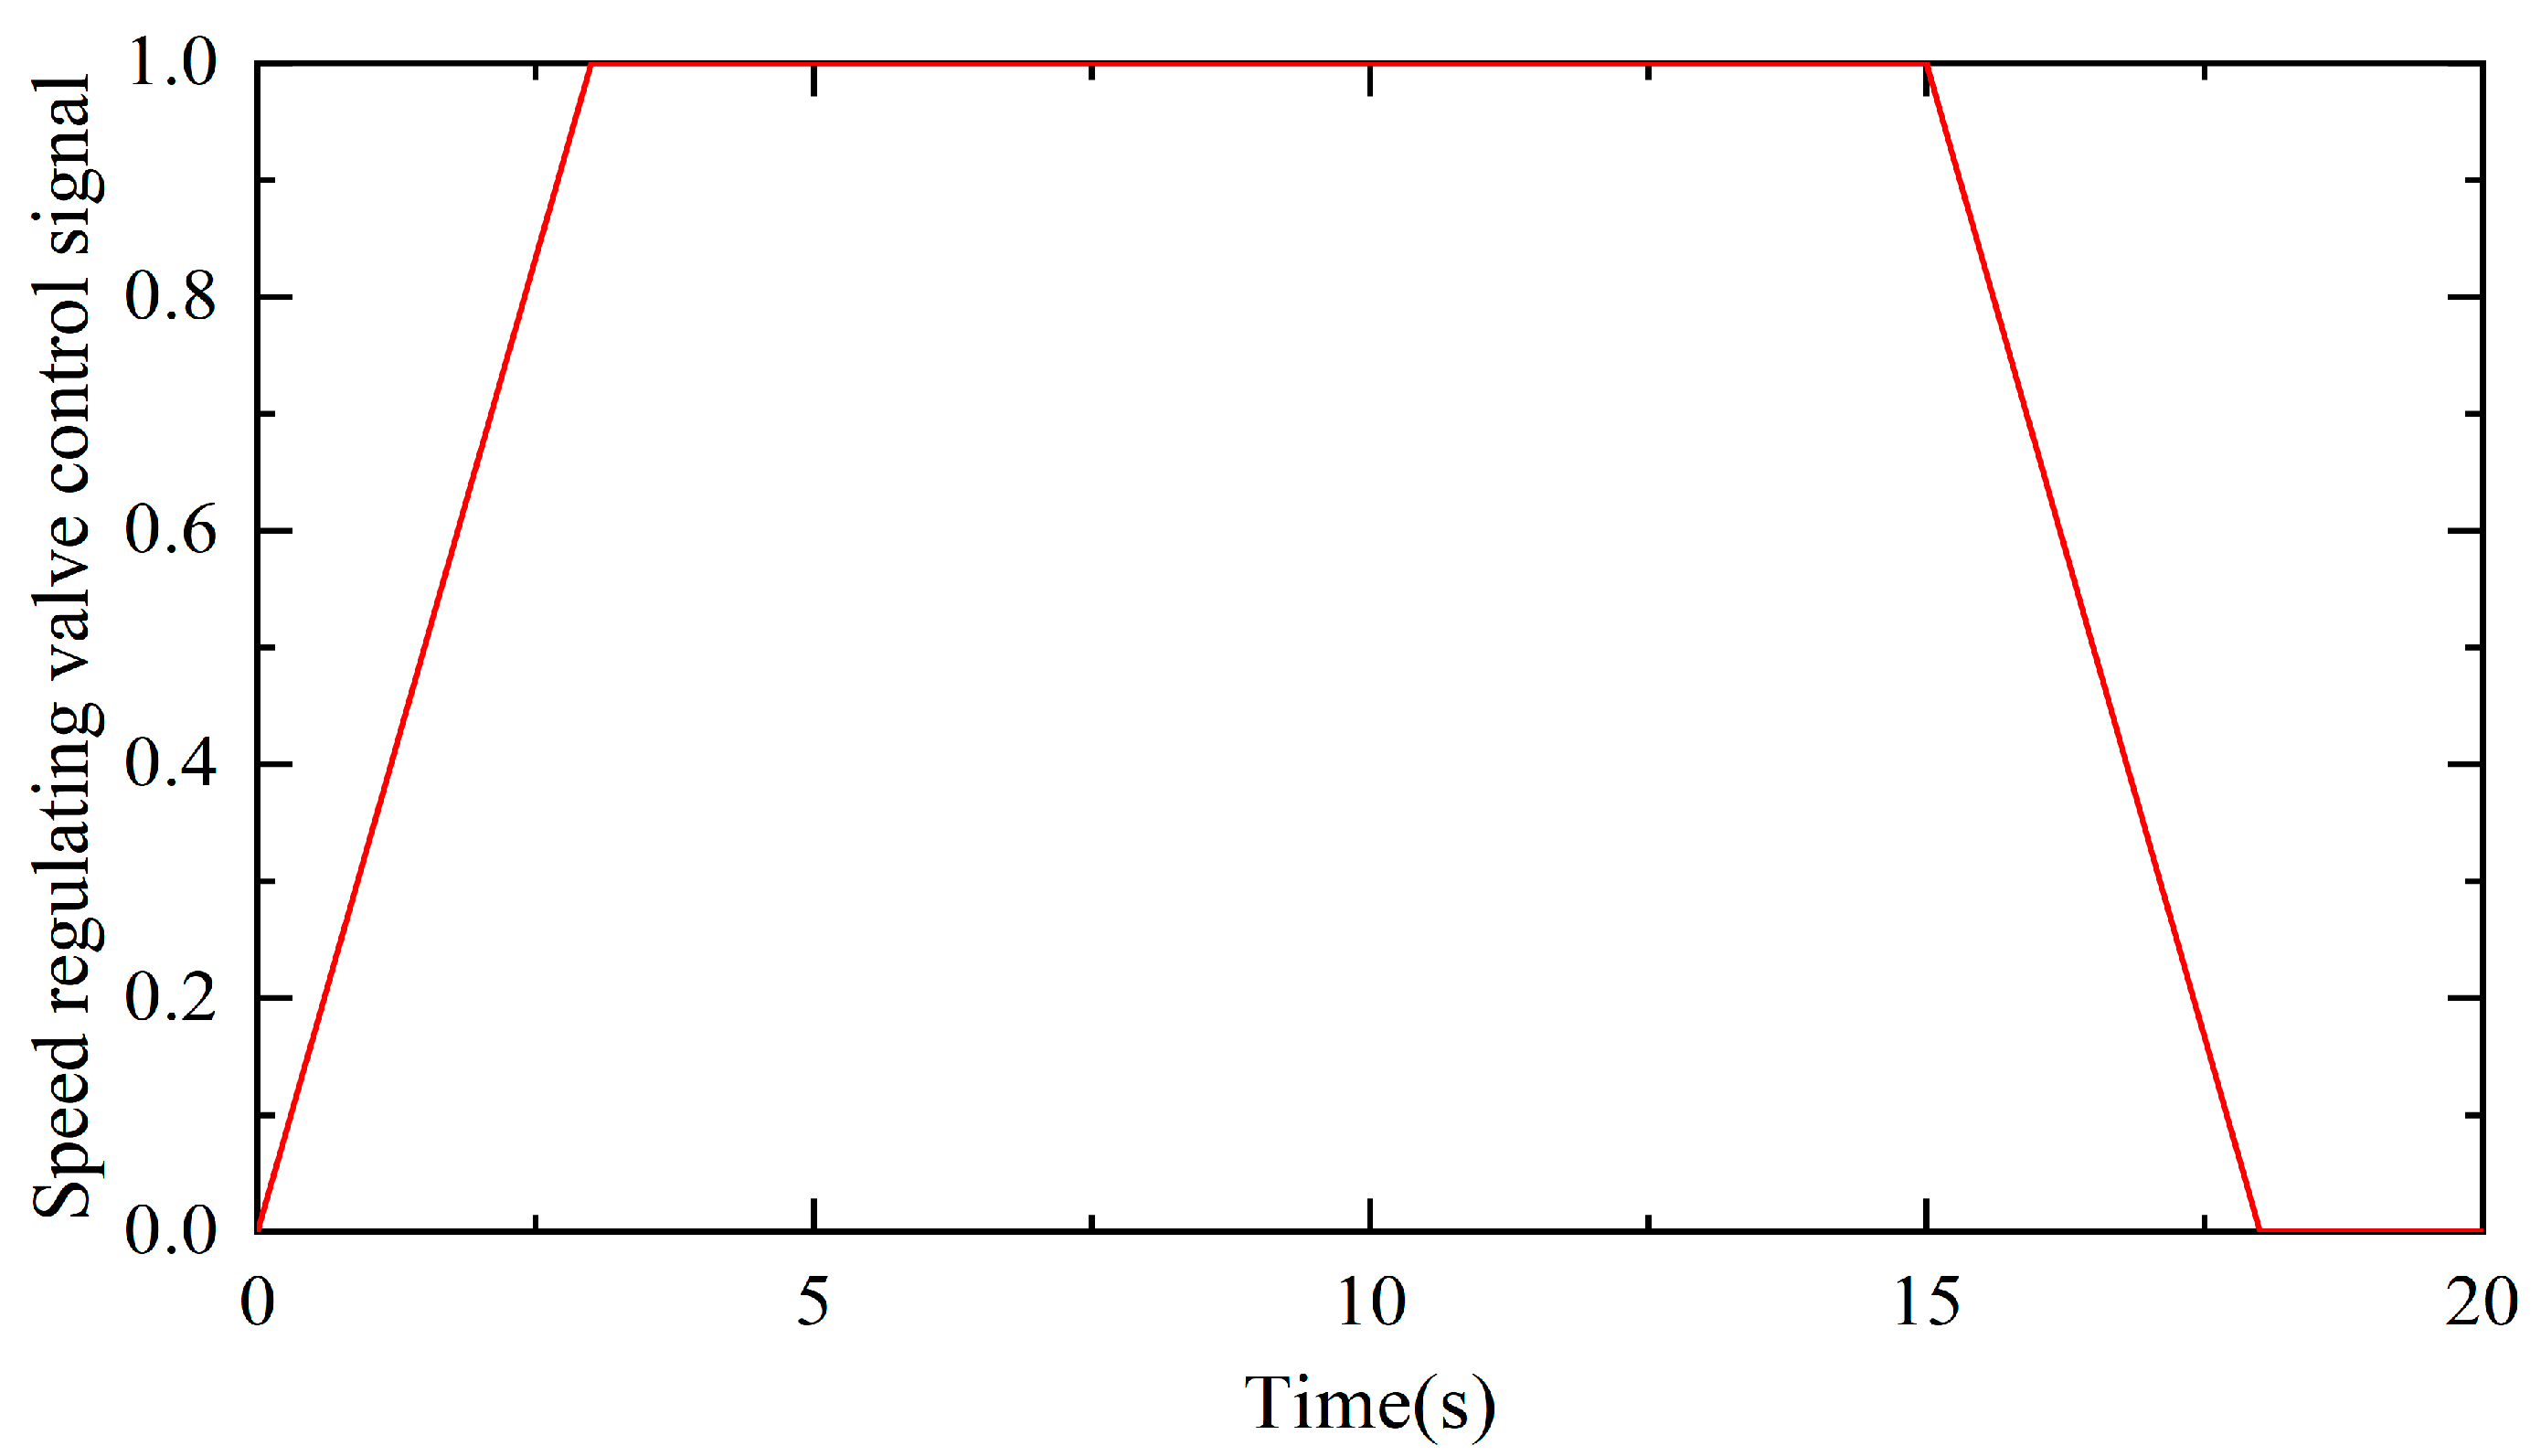
Figure 7 shows the control signal of the speed regulating valve. There are three stages to complete the slewing operation within 18 s. For the starting stage, the control signal controls the speed regulating valve from the neutral position to fully open in 3 s. The speed regulating valve keeps fully open for 12 s at the constant speed stage, and the hydraulic motor keeps uniform rotation. For the stop stage, the control signal controls the speed regulating valve from fully open to a neutral position in 3 s, and the rotary speed of the hydraulic motor gradually decreases to stop.
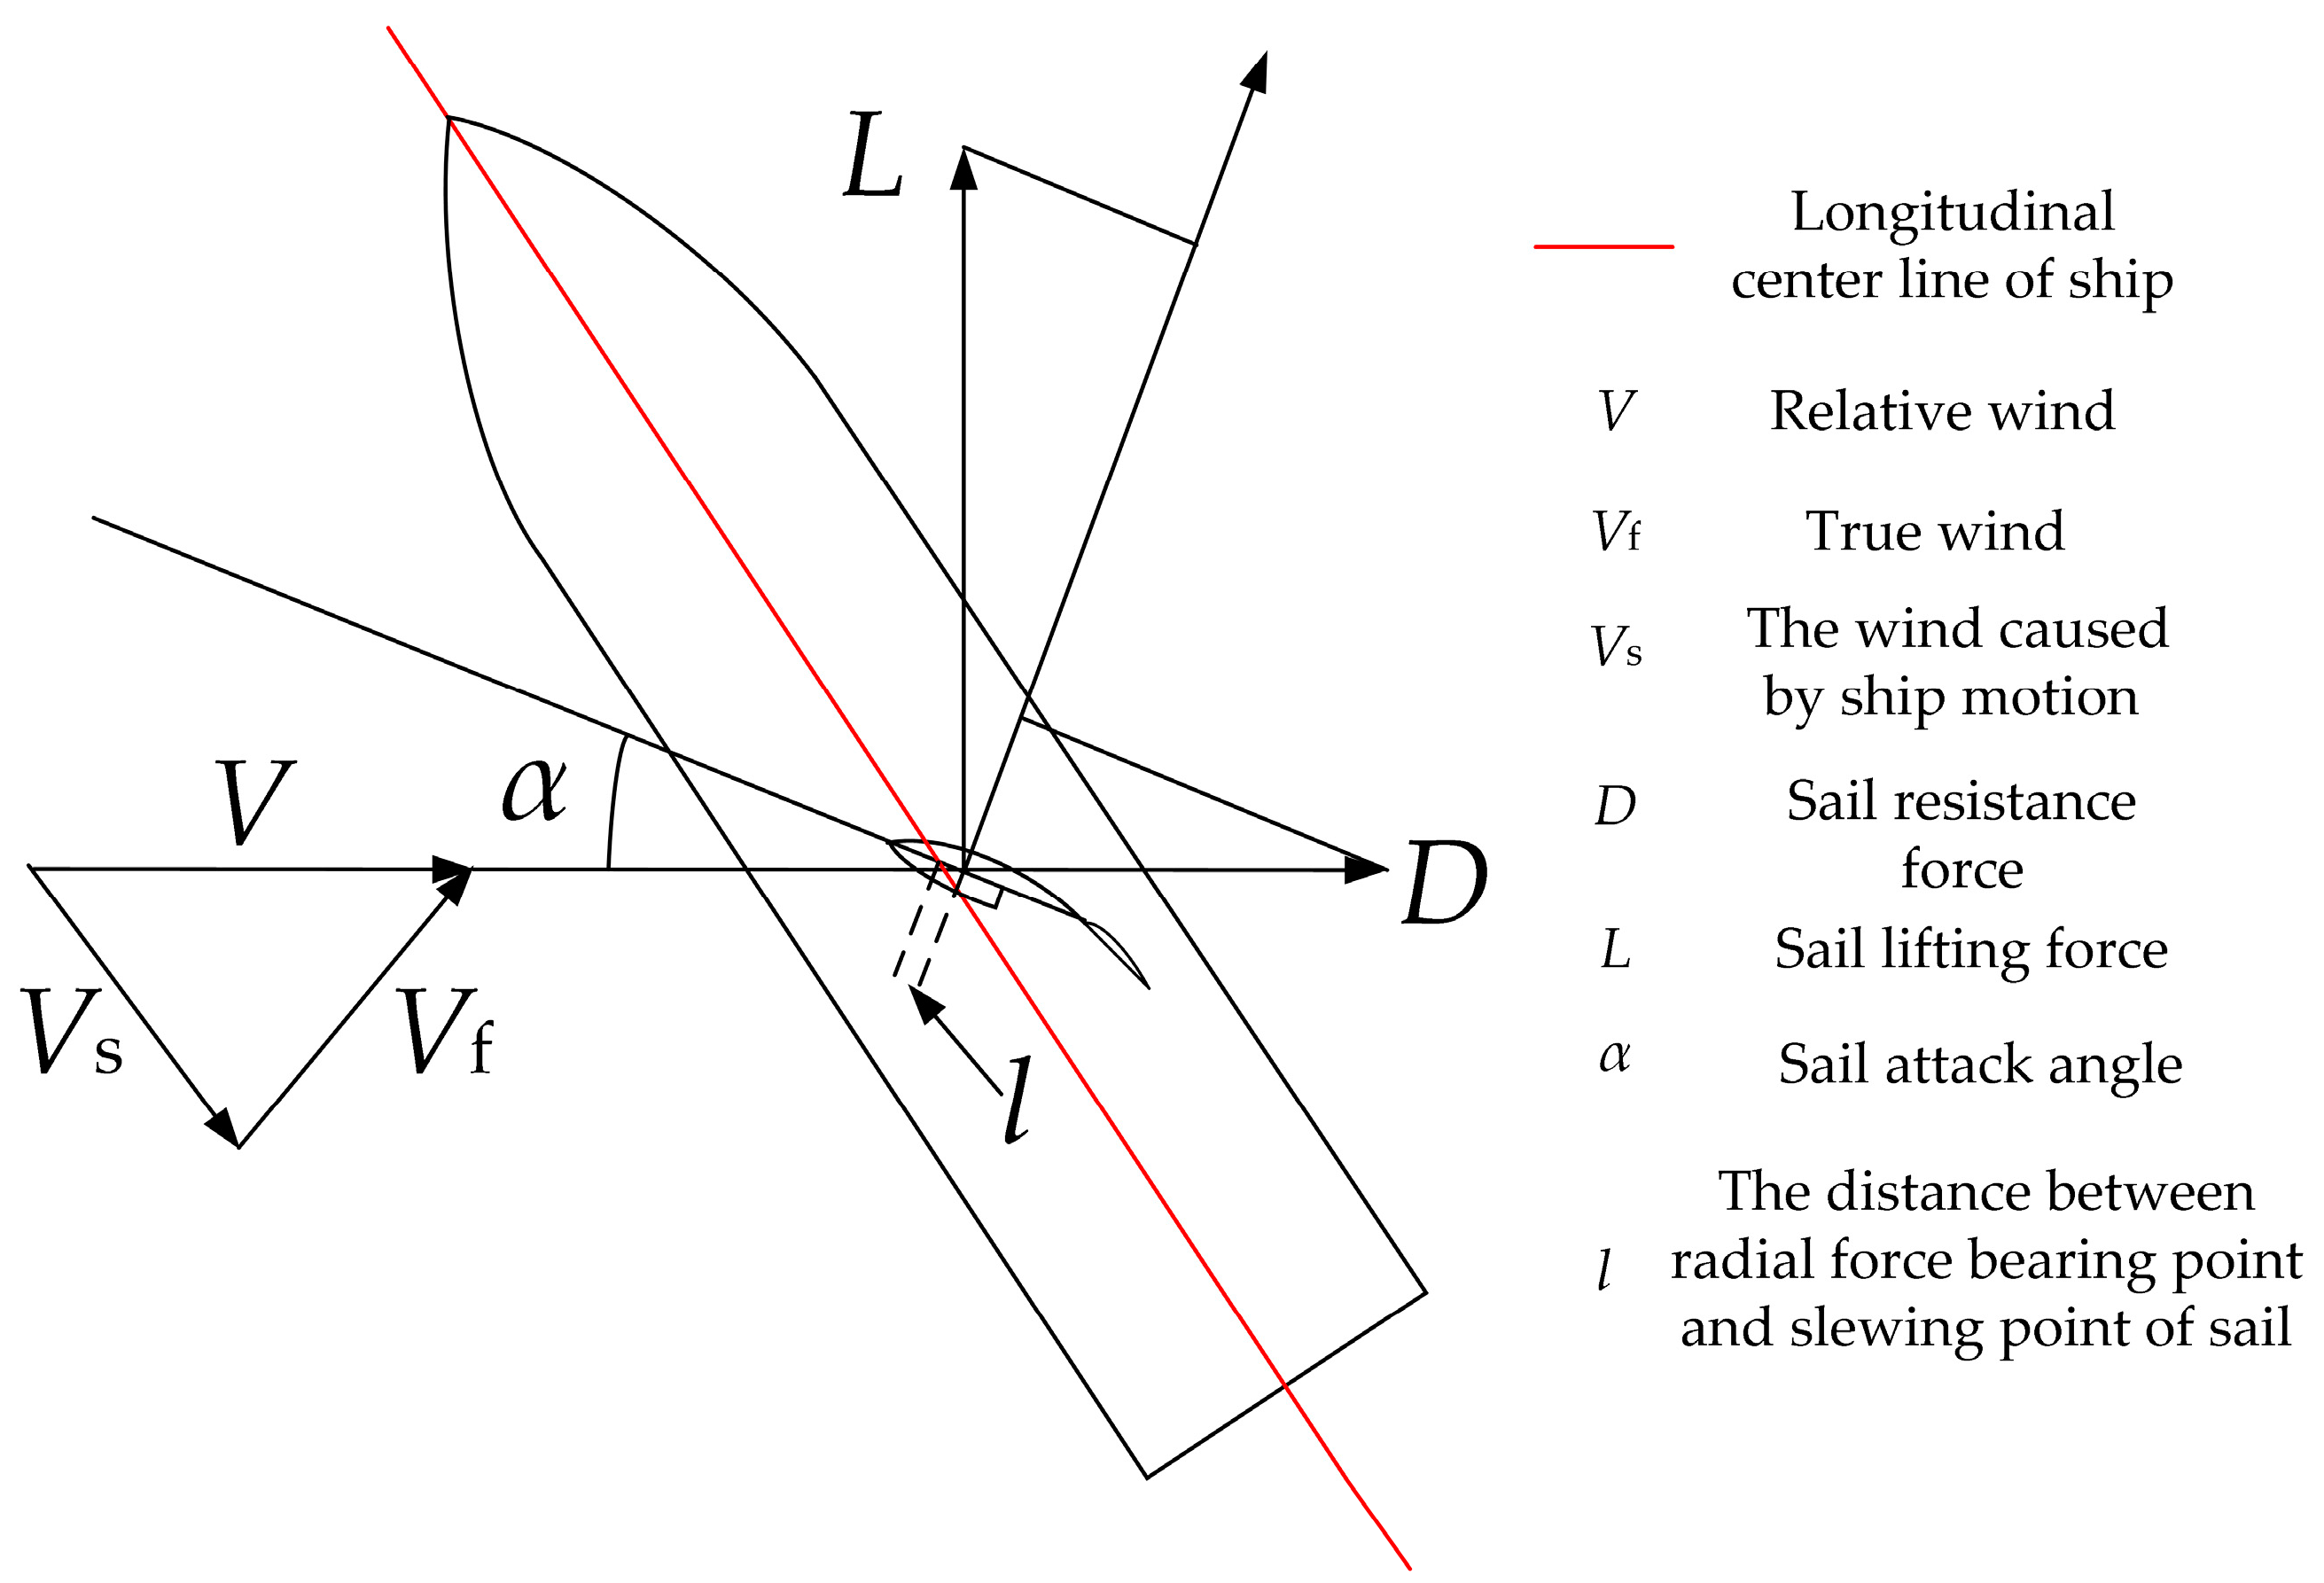
The noncoincidence of the radial force bearing point and slewing point of the sail leads to the wind resistance moment, as is shown in
Figure 8.
Where Vs is the wind caused by ship motion, Vf is true wind, V is relative wind, L is the lifting force of the sail, D is the resistance force of the sail, α is the attack angle of the sail, l is the distance between radial force bearing point and slewing point of the sail.
The wind resistance moment
Mwind is calculated by the equation as follows
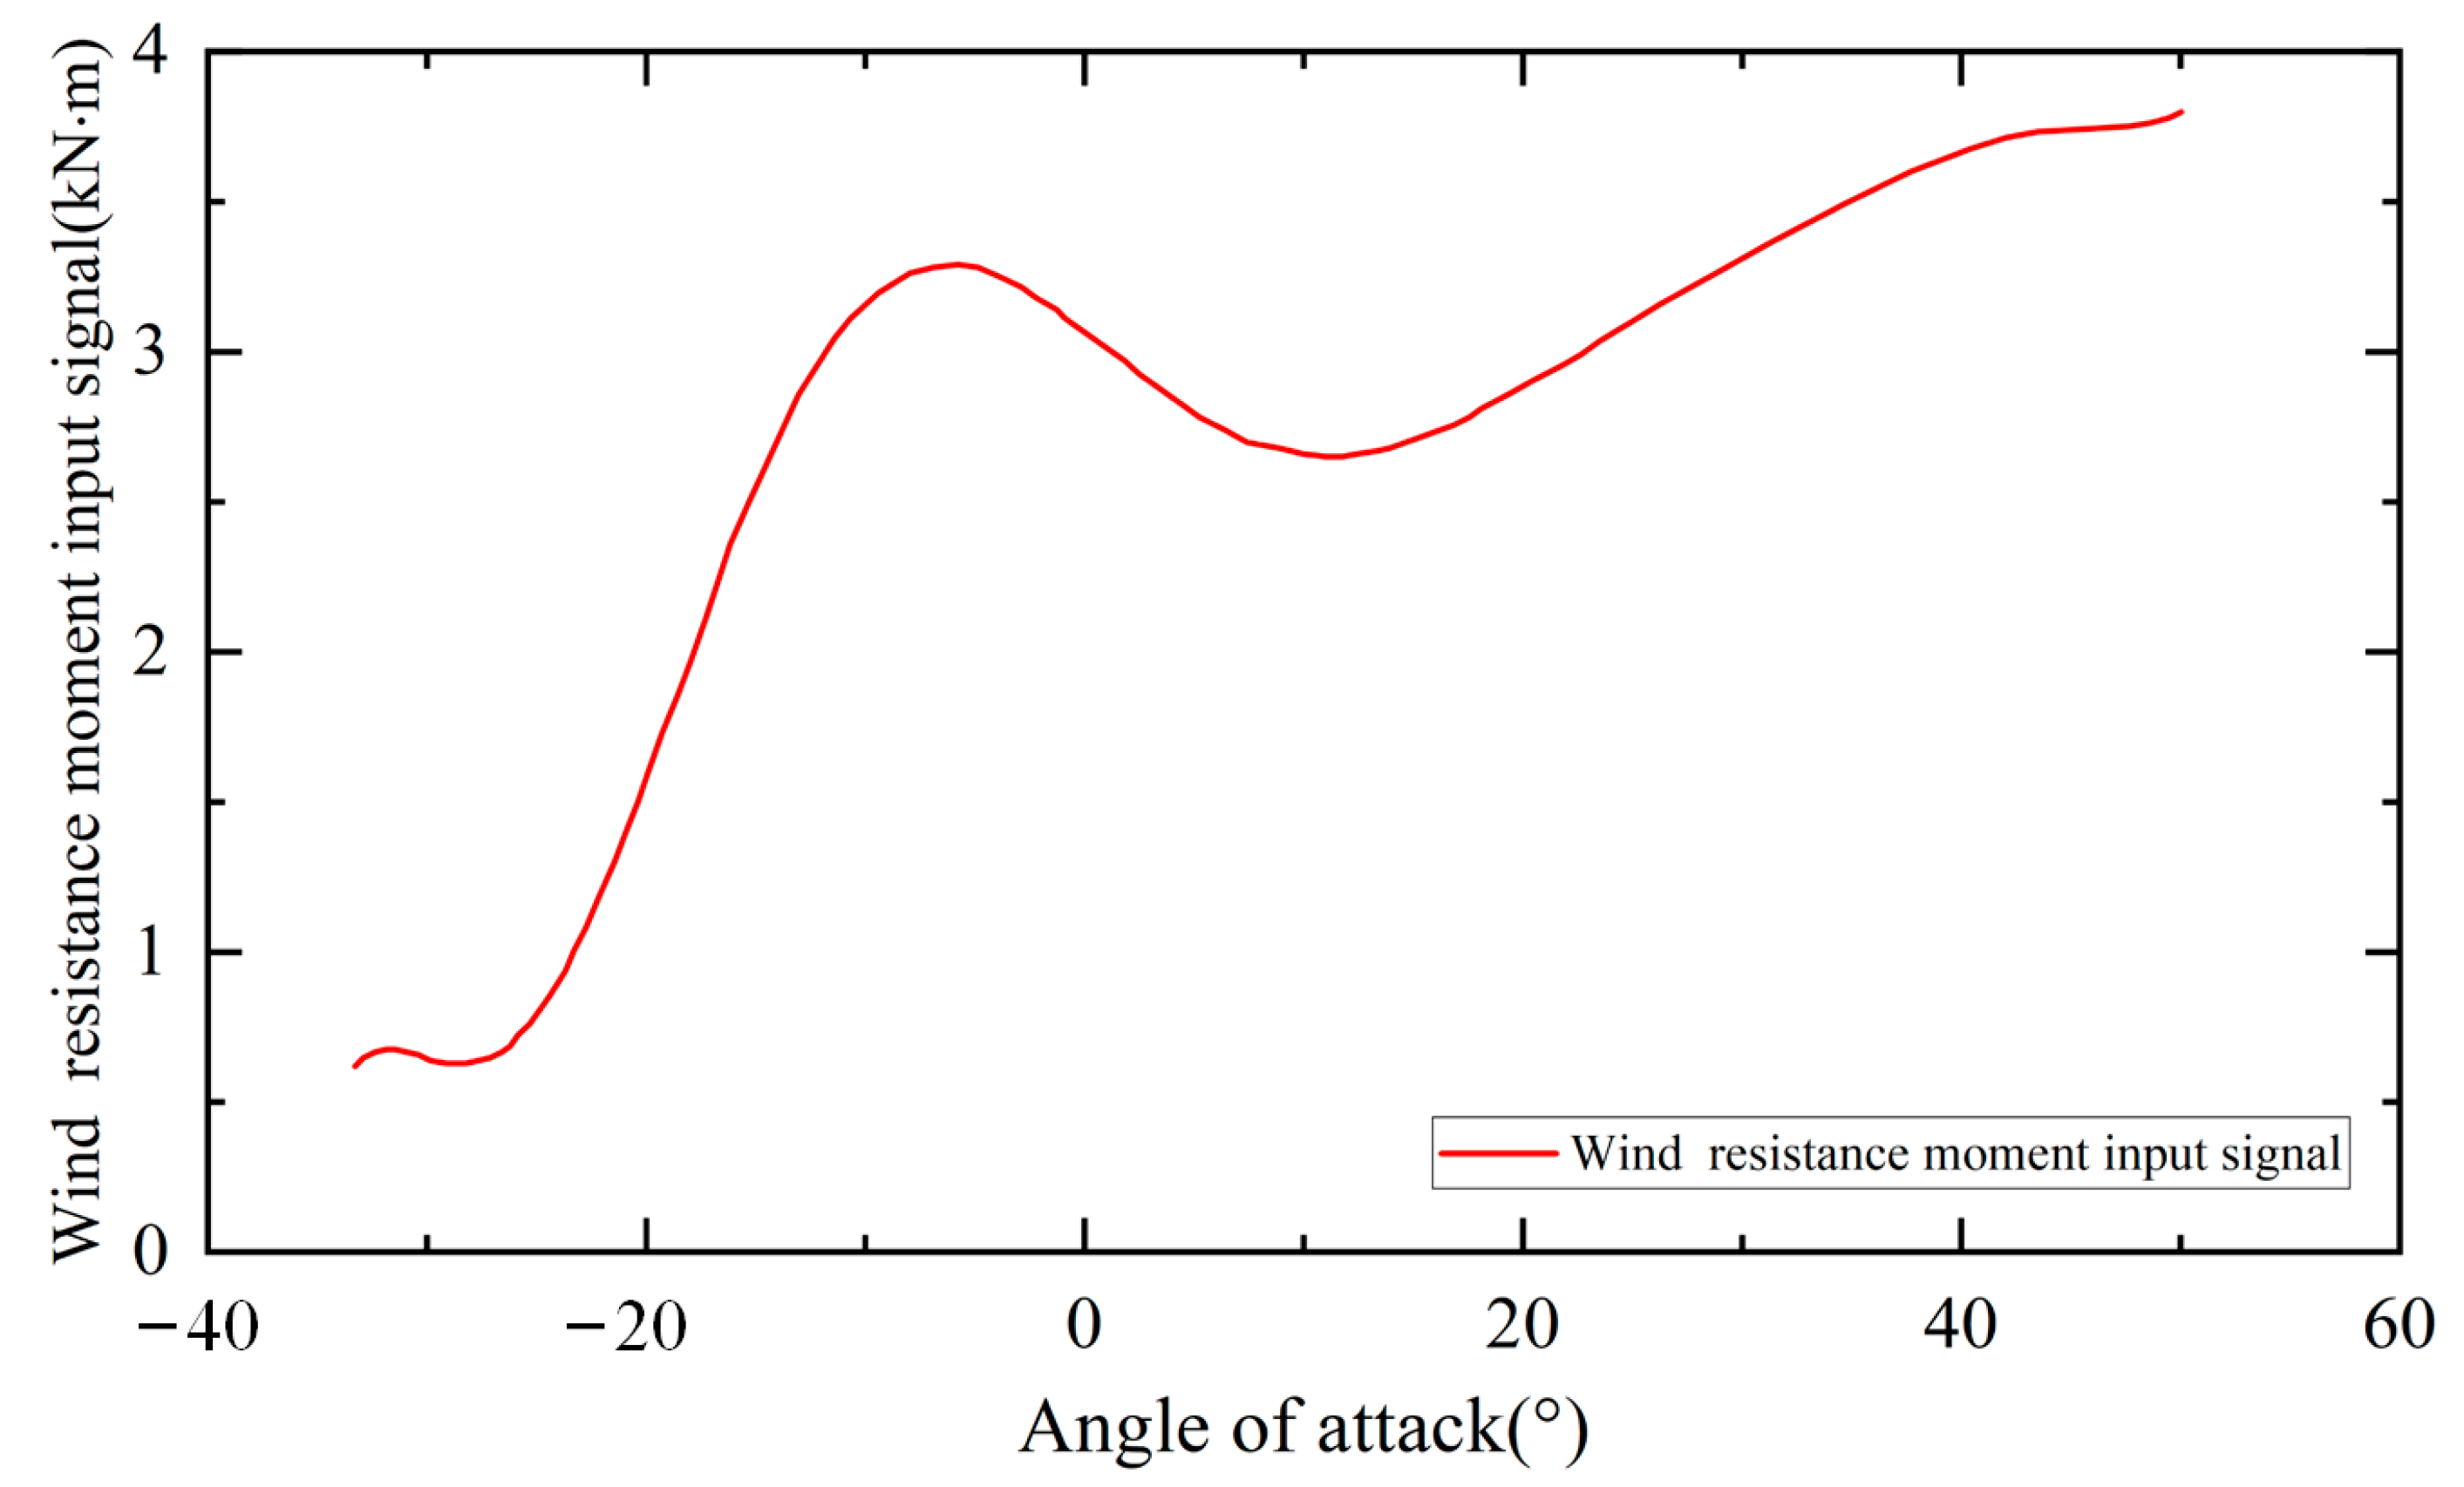
The sail slewing hydraulic system needs to overcome wind resistance moment to realize the rotation operation. Considering the safety of the sail-assisted ship, the maximum working wind speed of the sail is 26 m/s. The wind resistance moment of the target sail is calculated at the wind speed of 26 m/s according to the sail’s aerodynamic performance. The wind resistance moment of different attack angles is reduced as an input signal for the sail slewing hydraulic testbed, as shown in
Figure 9.
The wind resistance moment was input into the loader in the form of a function, running the testbed and simulation model with the same input signal, and the operation results were compared and analyzed. The running time was set to 20 s, and the simulation time interval was set to 0.1 s.
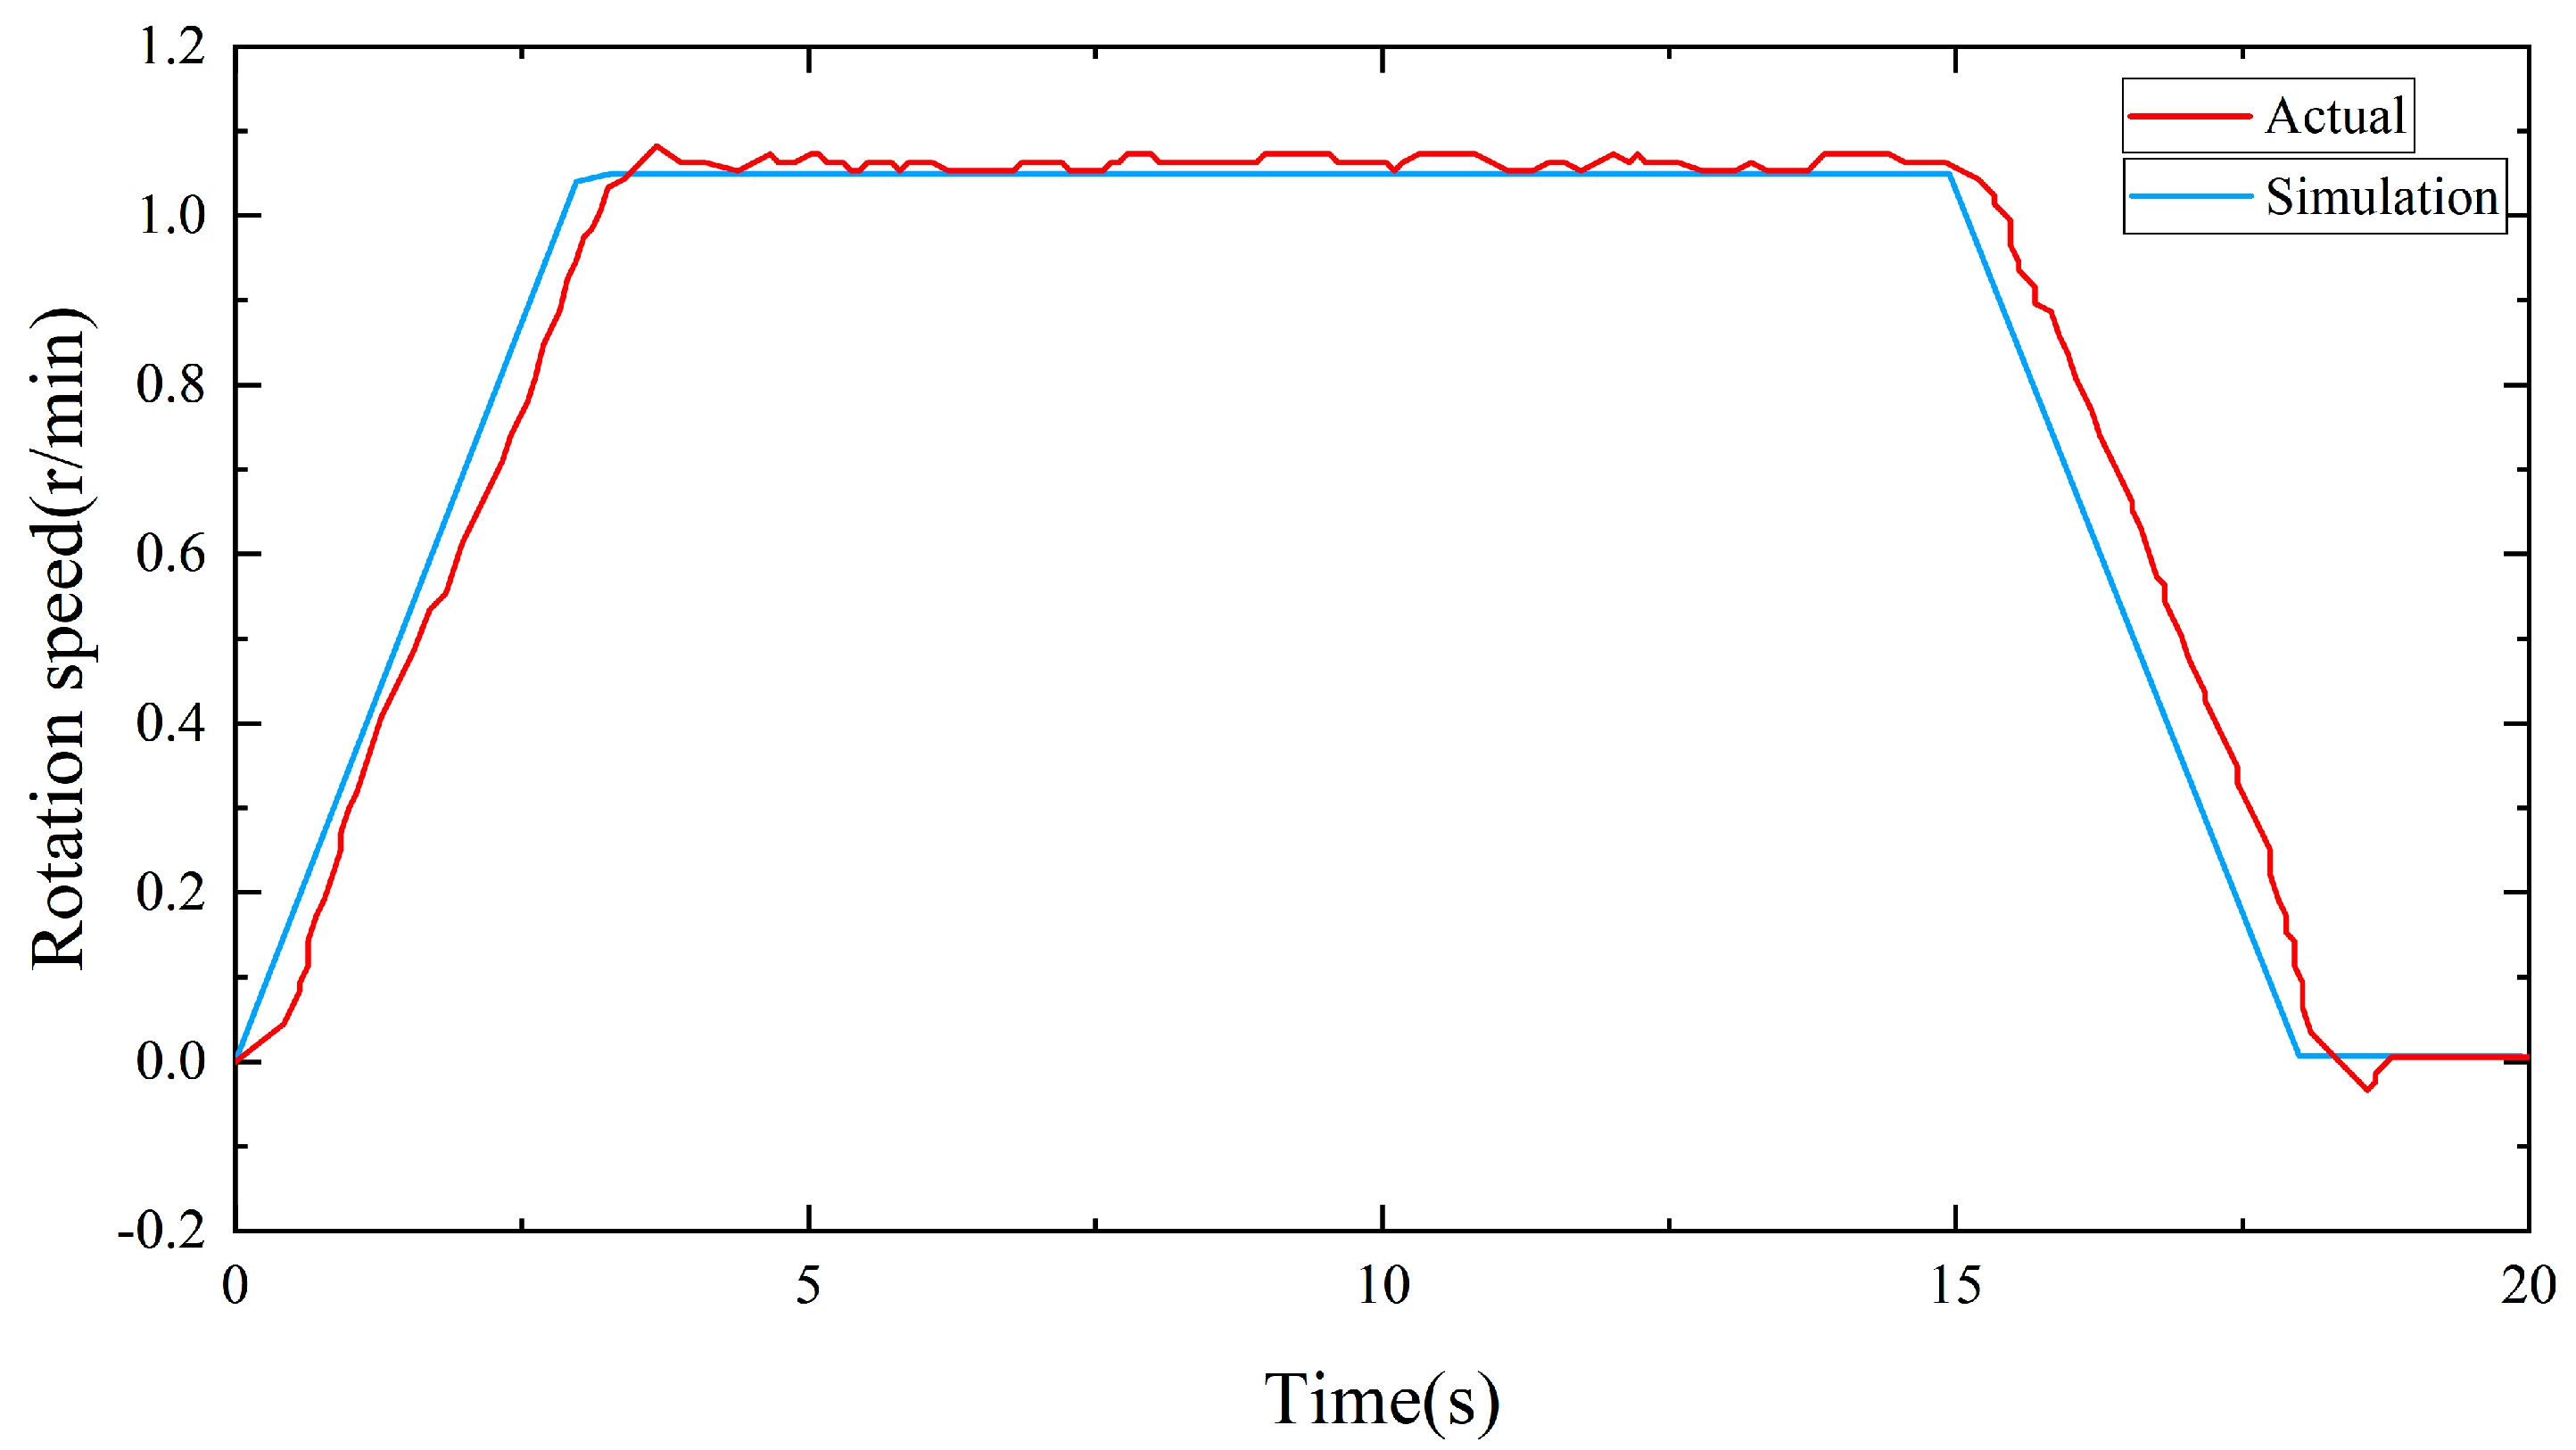
Figure 10 shows the rotation speed of the sail. For the actual hydraulic system, after receiving the control signal, the maximum rotation speed of 1.02 r/min is reached at 3.2 s, the maximum rotation speed sustains for 12 s, and the deceleration starts at 12.2 s and stops at 18.2 s. For the simulation model, when the maximum speed of 1.01 r/min is reached at 3 s, the maximum speed also sustains 12 s and stops at 18 s. It can be found that the rotation speed of the model and the actual hydraulic system are basically consistent.
The system pressure is shown in
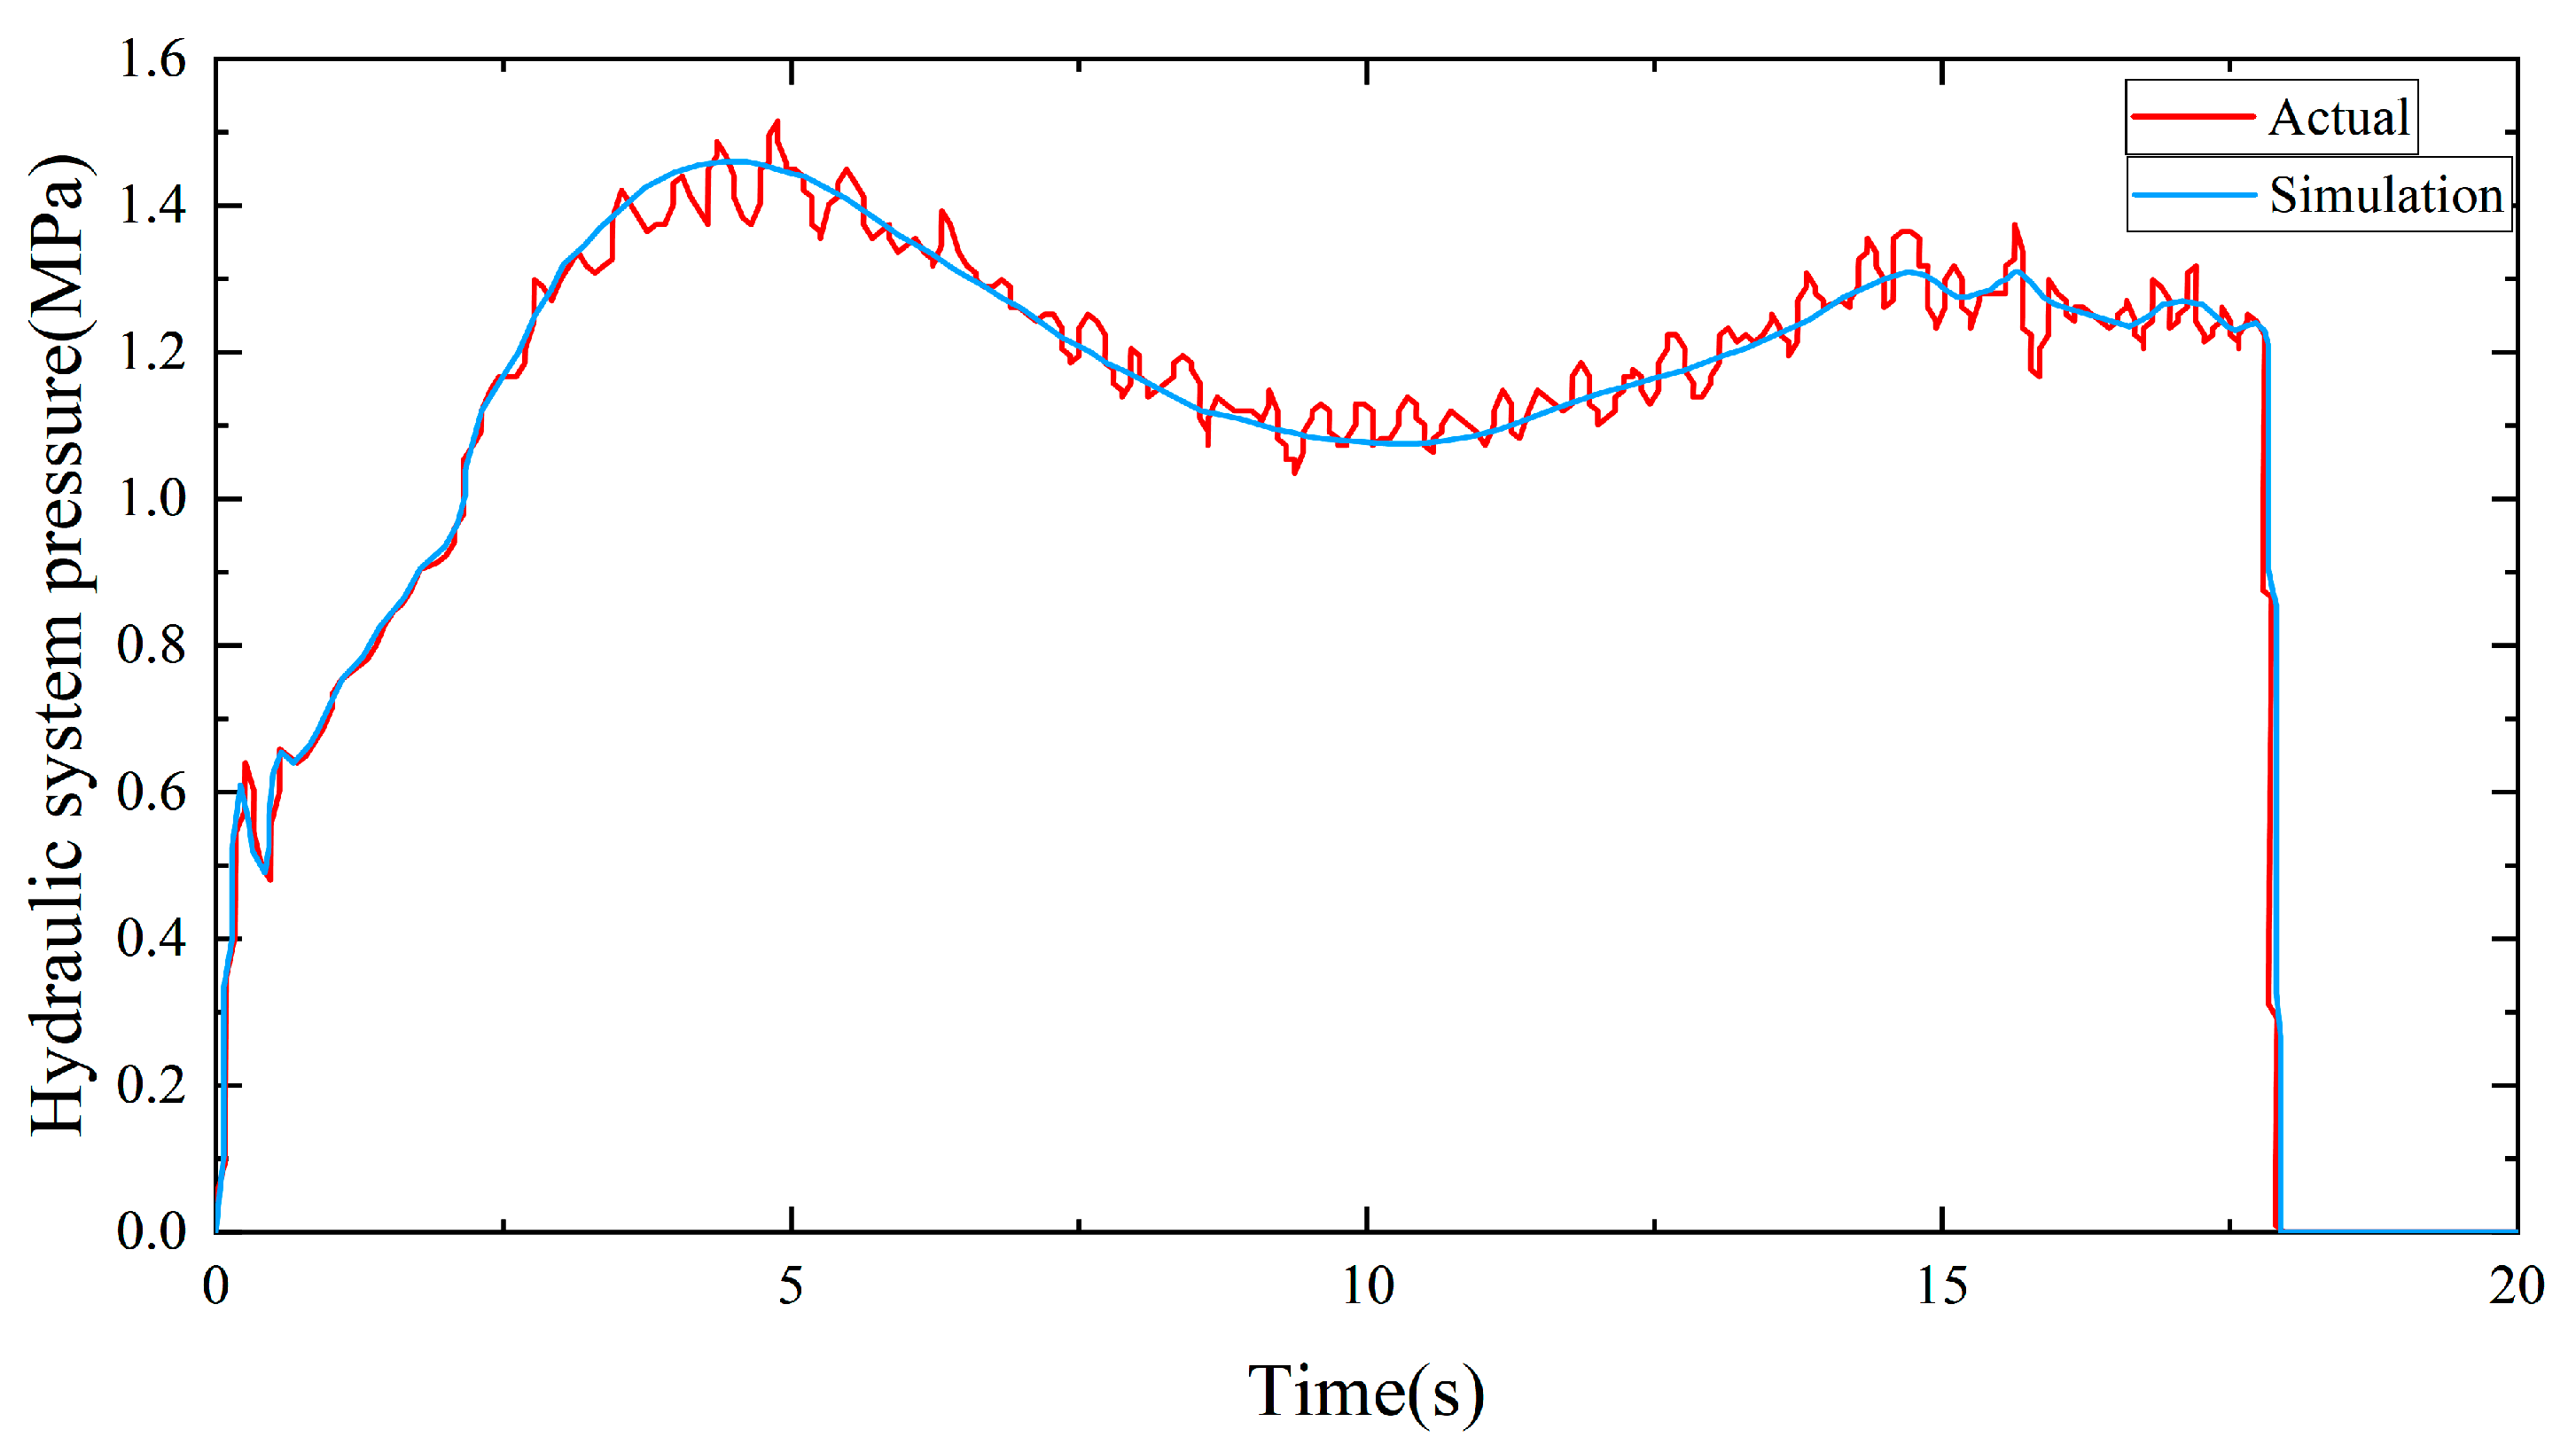
Figure 11. For the actual hydraulic system, the pressure reaches the maximum pressure of 1.46 MPa from 0 in 5 s. For the simulation model, the maximum pressure reaches 1.42 MPa at 4.9 s, and the minimum pressure at the constant speed stage is 1.1 MPa, which also drops to 0 at 18 s.
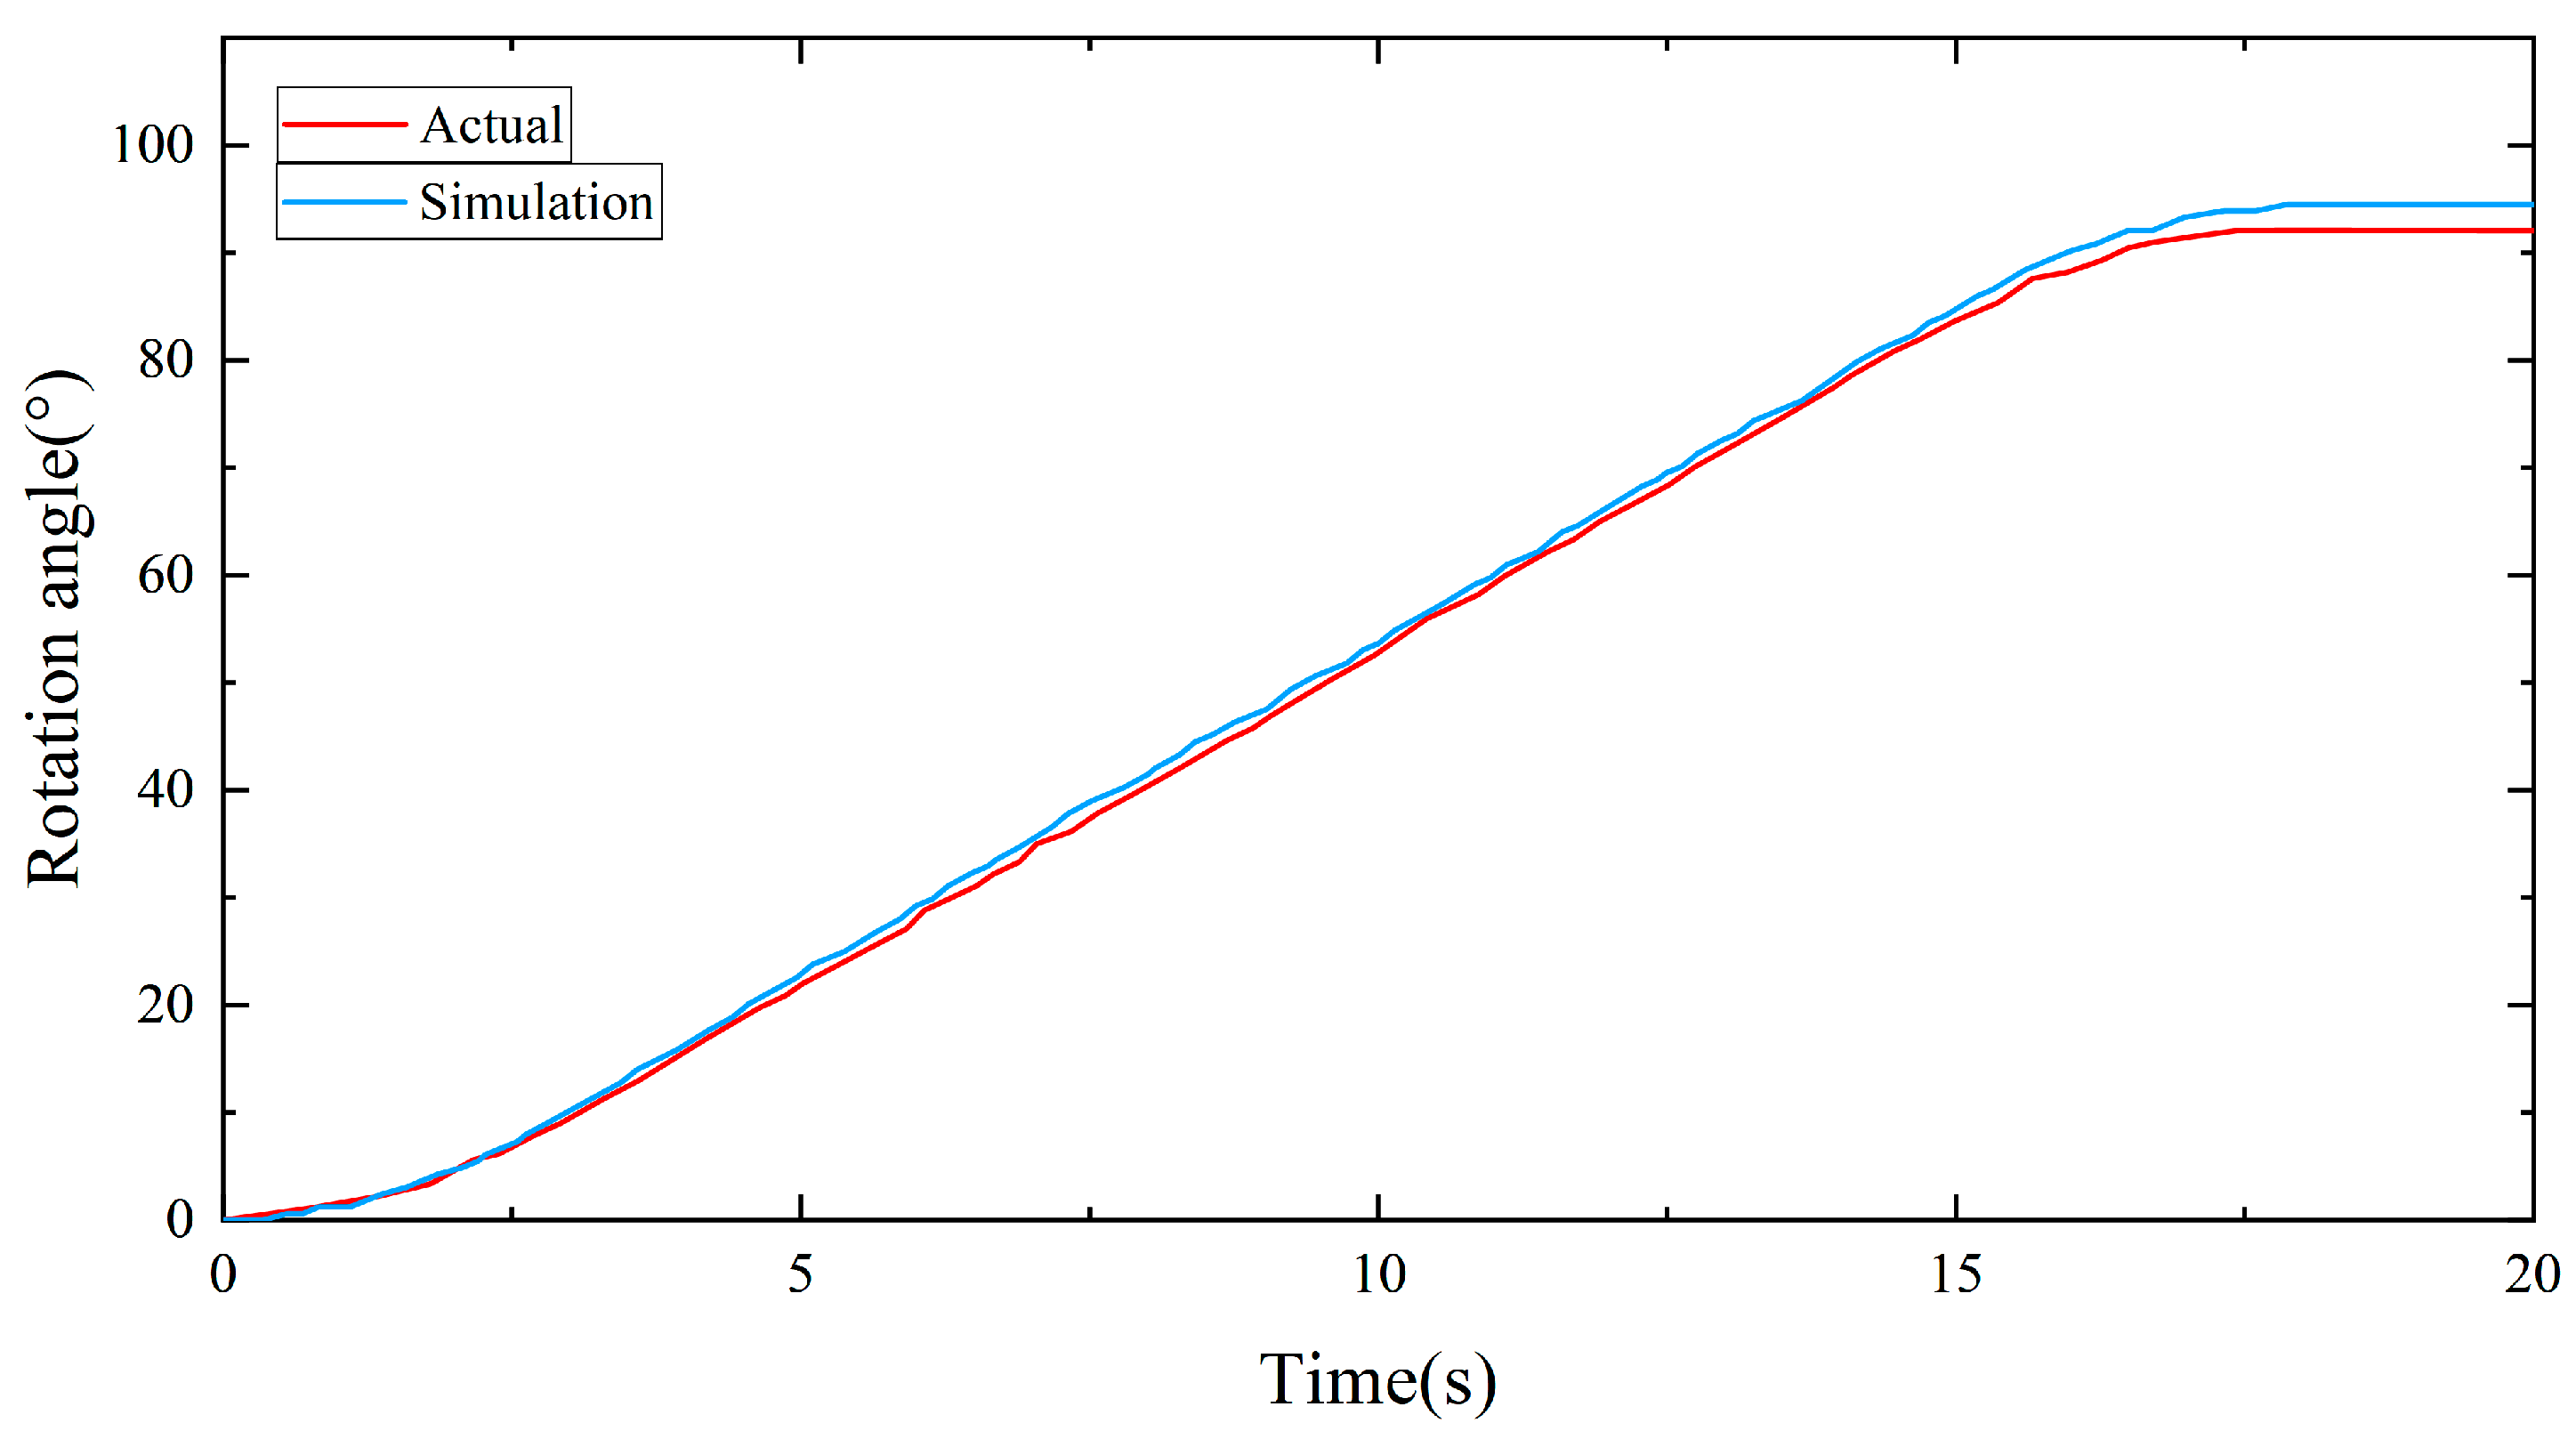
Figure 12 shows the rotation angle of the hydraulic system. For the actual hydraulic system, in the starting stage, the rotation angle slowly increases to 10°; in the constant speed stage, the sail rotates to 80°; after the rotation stops, the final rotation angle is 92°. The simulation model, it is consistent with the actual hydraulic system in the starting stage and constant speed stage. After the rotation stops, the final rotation angle is 93.7°.
The results comparison is shown in
Table 3. Due to the inertia effect of actual hydraulic components, the simulation model is 0.2 s faster than the actual testbed to reach maximum speed. Other than that, the simulation model has an accuracy of more than 97% on other comparison results, such as rotational speed, pressure, and rotational angle, et al. This proves the simulation model is effective in performing operation analysis of leakage fault.
3.3. Operation Analysis of Leakage Fault Based on Simulation Model
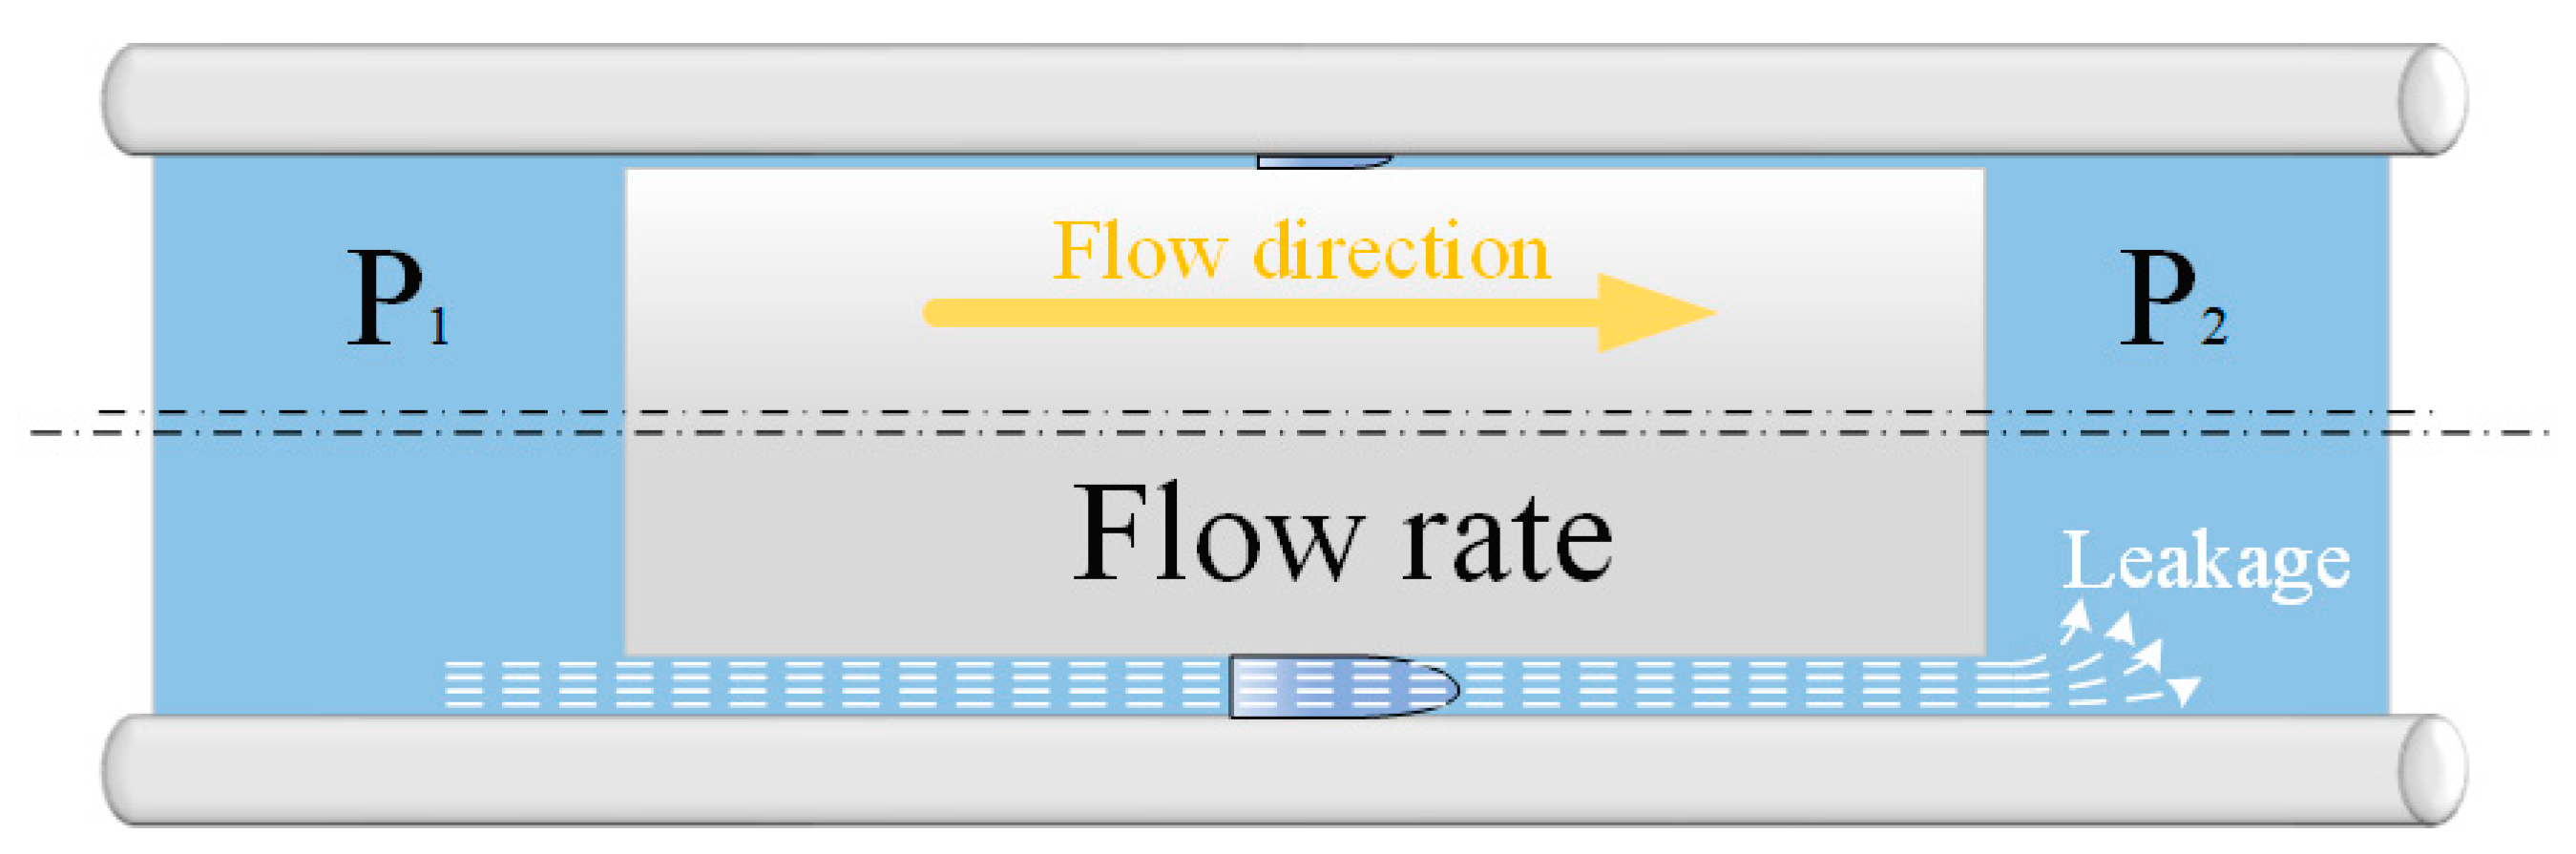
In the sail slewing hydraulic system, reversing valve and speed regulating valve will be affected by hydraulic shock and vibration, which will cause the radial clearance between the valve core and sleeve to expand, then lead to internal leakage, as shown in
Figure 13.
The internal clearance will cause the hydraulic oil leaks from high-pressure side (P1) to low-pressure side (P2), thus resulting in abnormal function of hydraulic components.
3.3.1. Reversing Valve
Different radial leakage clearances of reversing valve are set in
Table 4.
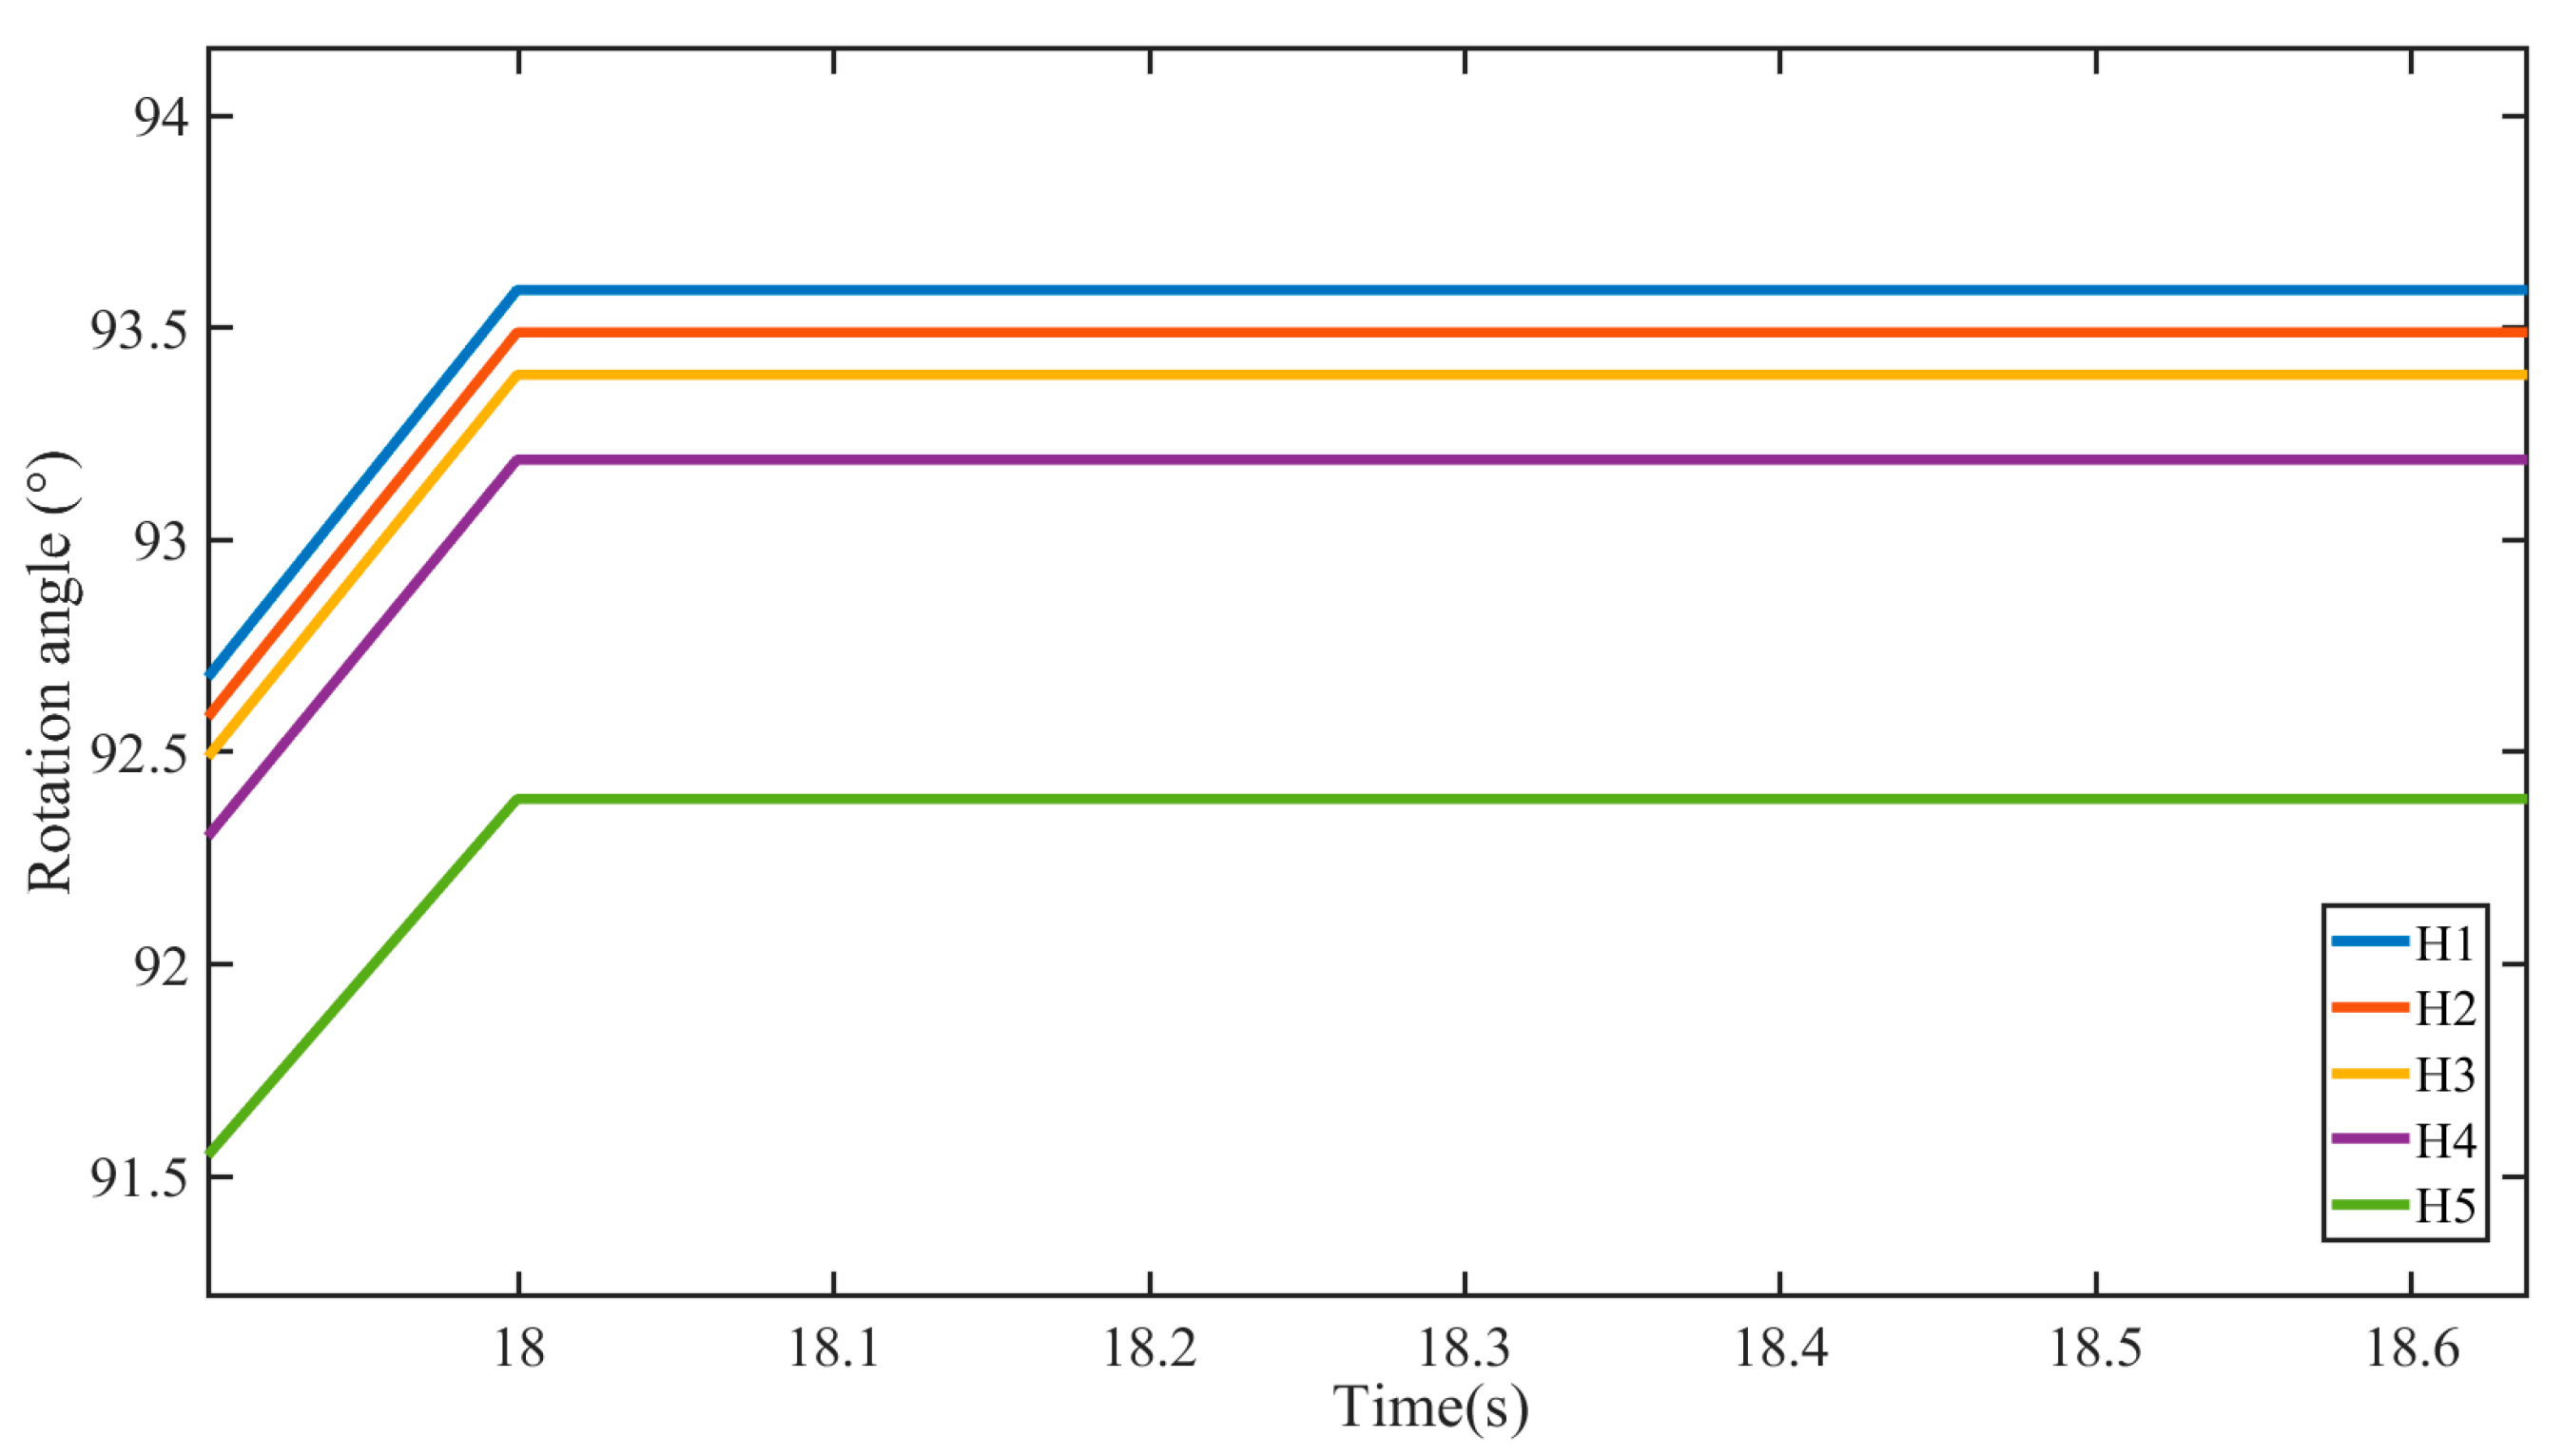
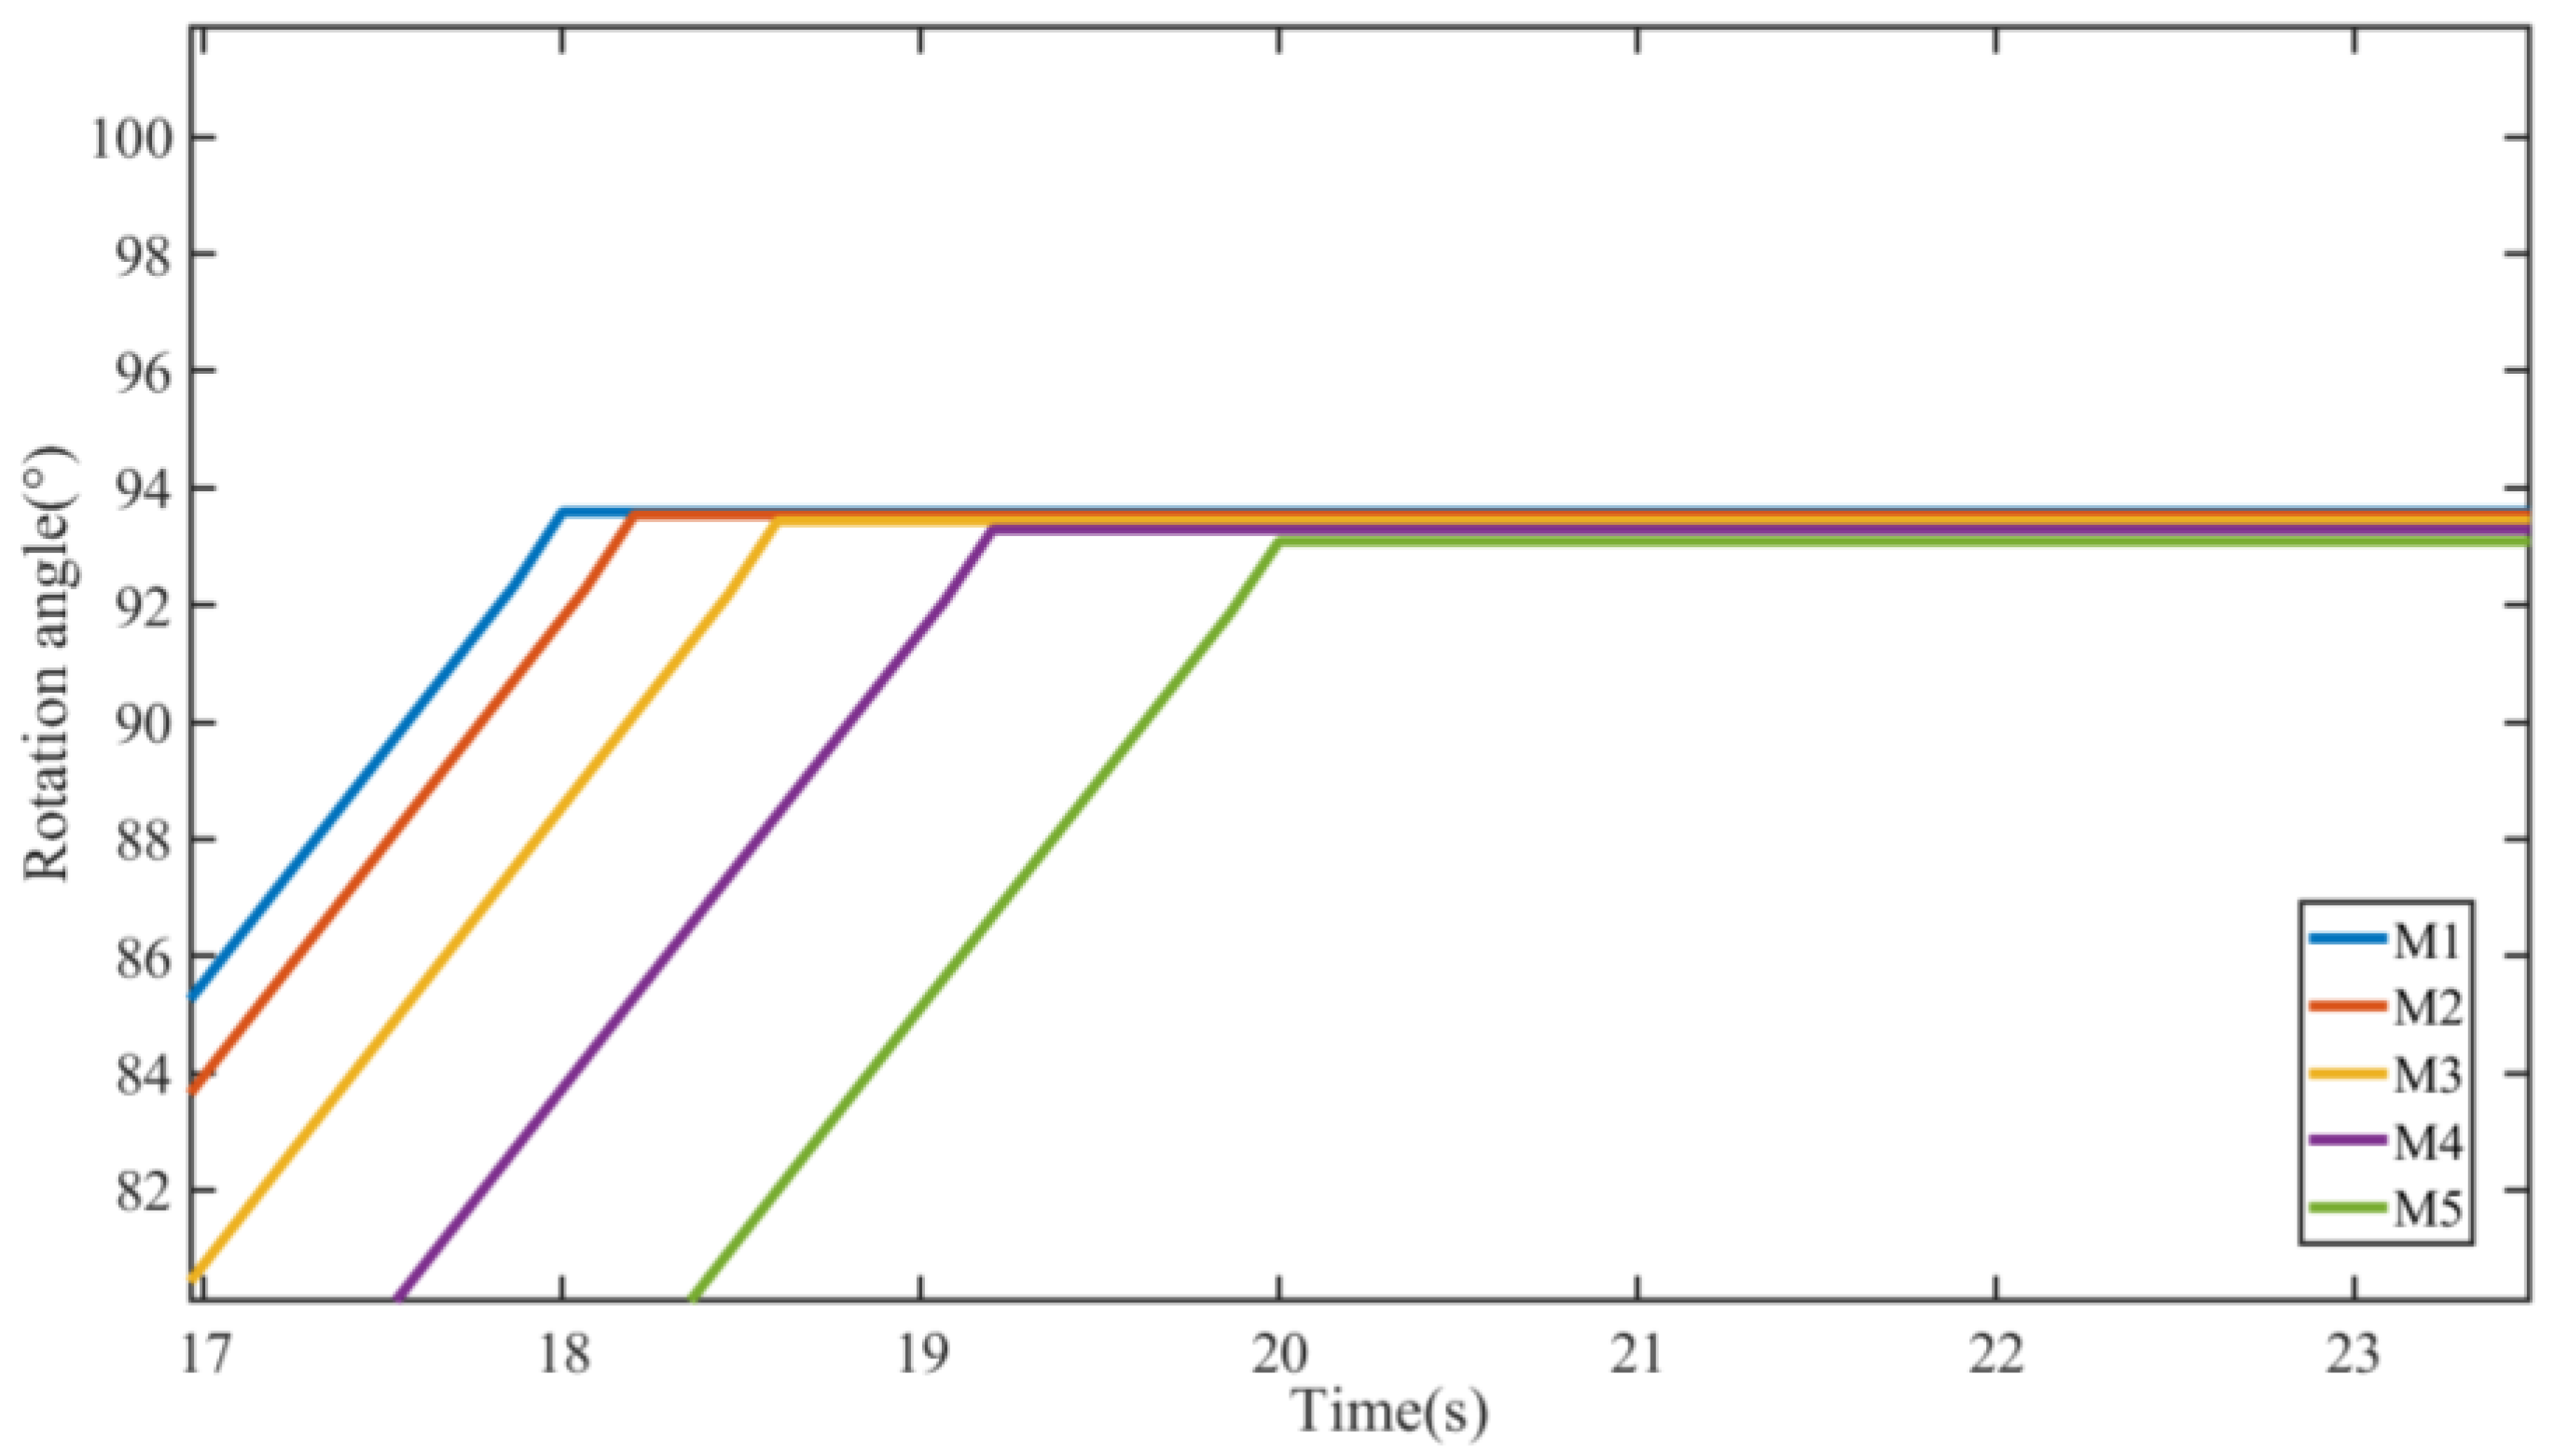
Figure 14 shows the difference in the final rotation angle under five different leakage clearances. Leakage clearance has no effect on the final stopping time of the sail, which is 18 s. However, with the increase in leakage clearance, the final rotation angle gradually decreases, from 93.7° corresponding to the minimum leakage state (H1) to 92.4° corresponding to the maximum leakage state (H5). This means adverse effects on the control accuracy of the sail will be caused by leakage in reversing valve.
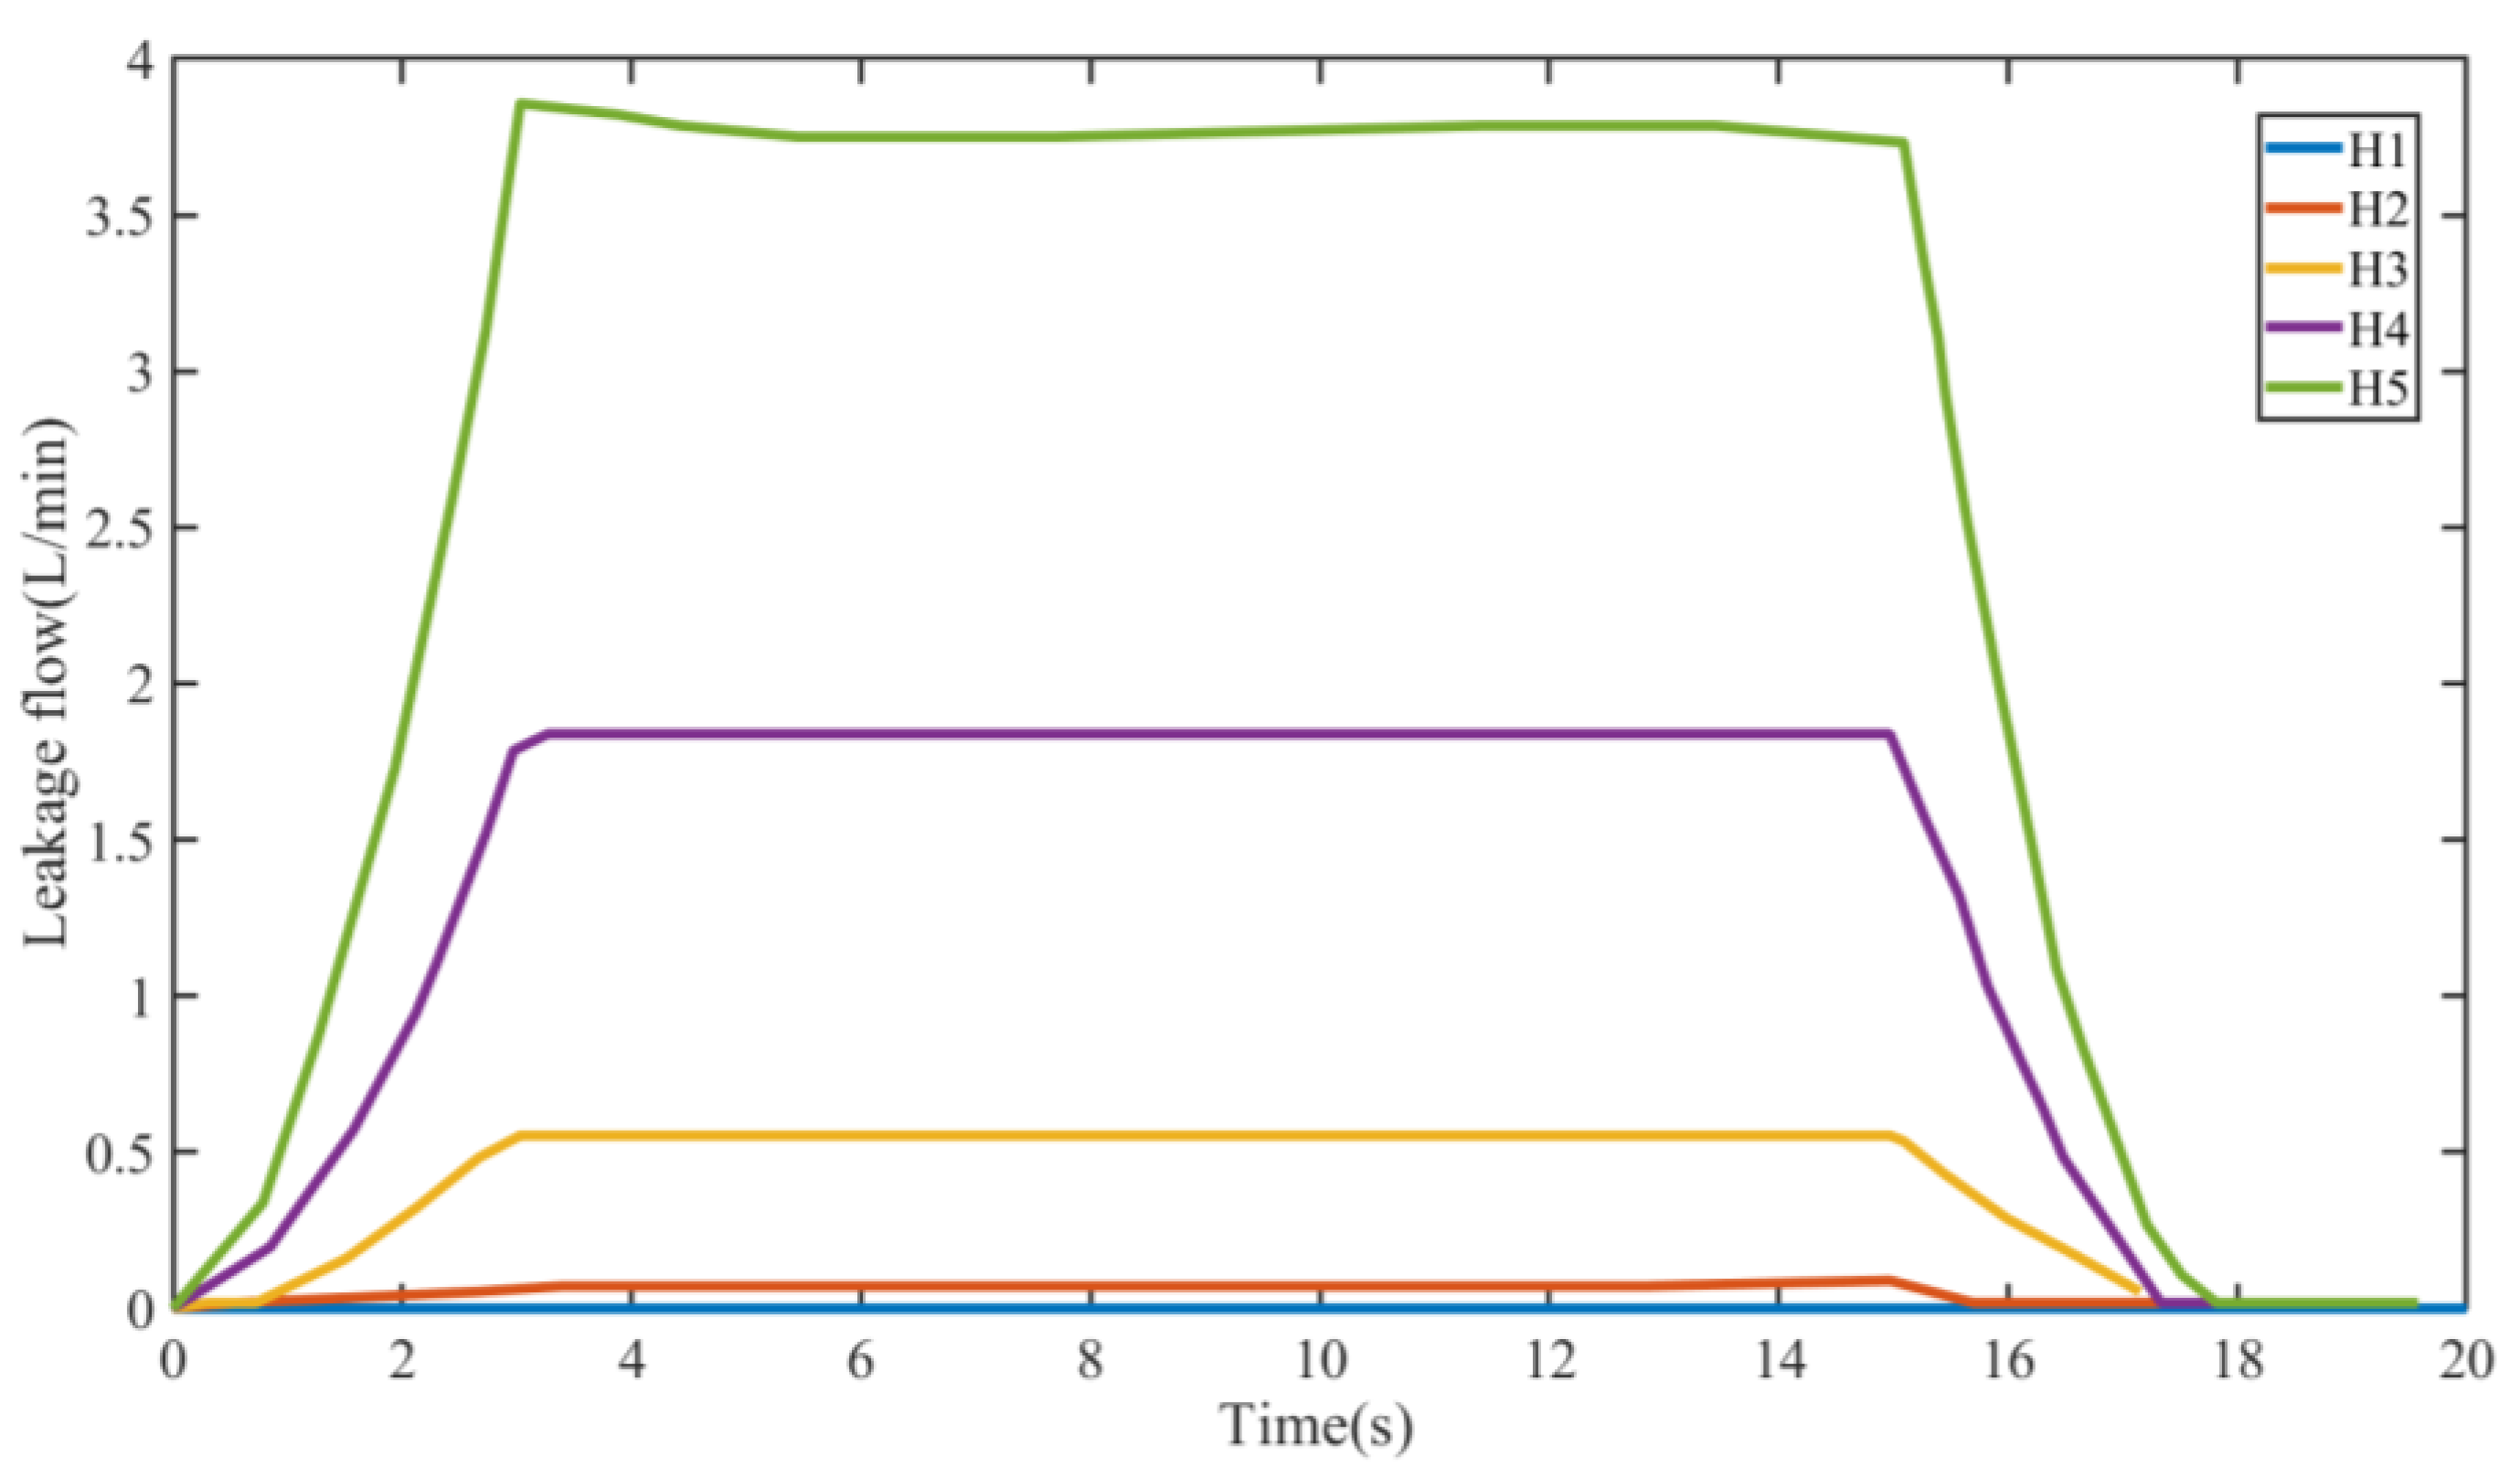
The leakage flow of reversing valve under five leakage clearances is in
Figure 15. In the minimum leakage state (H1), the leakage amount is almost zero, and the sail can normally rotate to the set angle. However, when the clearance increases, the leakage flow will also increase gradually. At this time, the rotation of the sail is greatly affected, and the sail cannot reach the set angle, which will reduce the use effect of the sail.
3.3.2. Speed Regulating Valve
Different radial leakage clearances of speed-regulating valves are set in
Table 5.
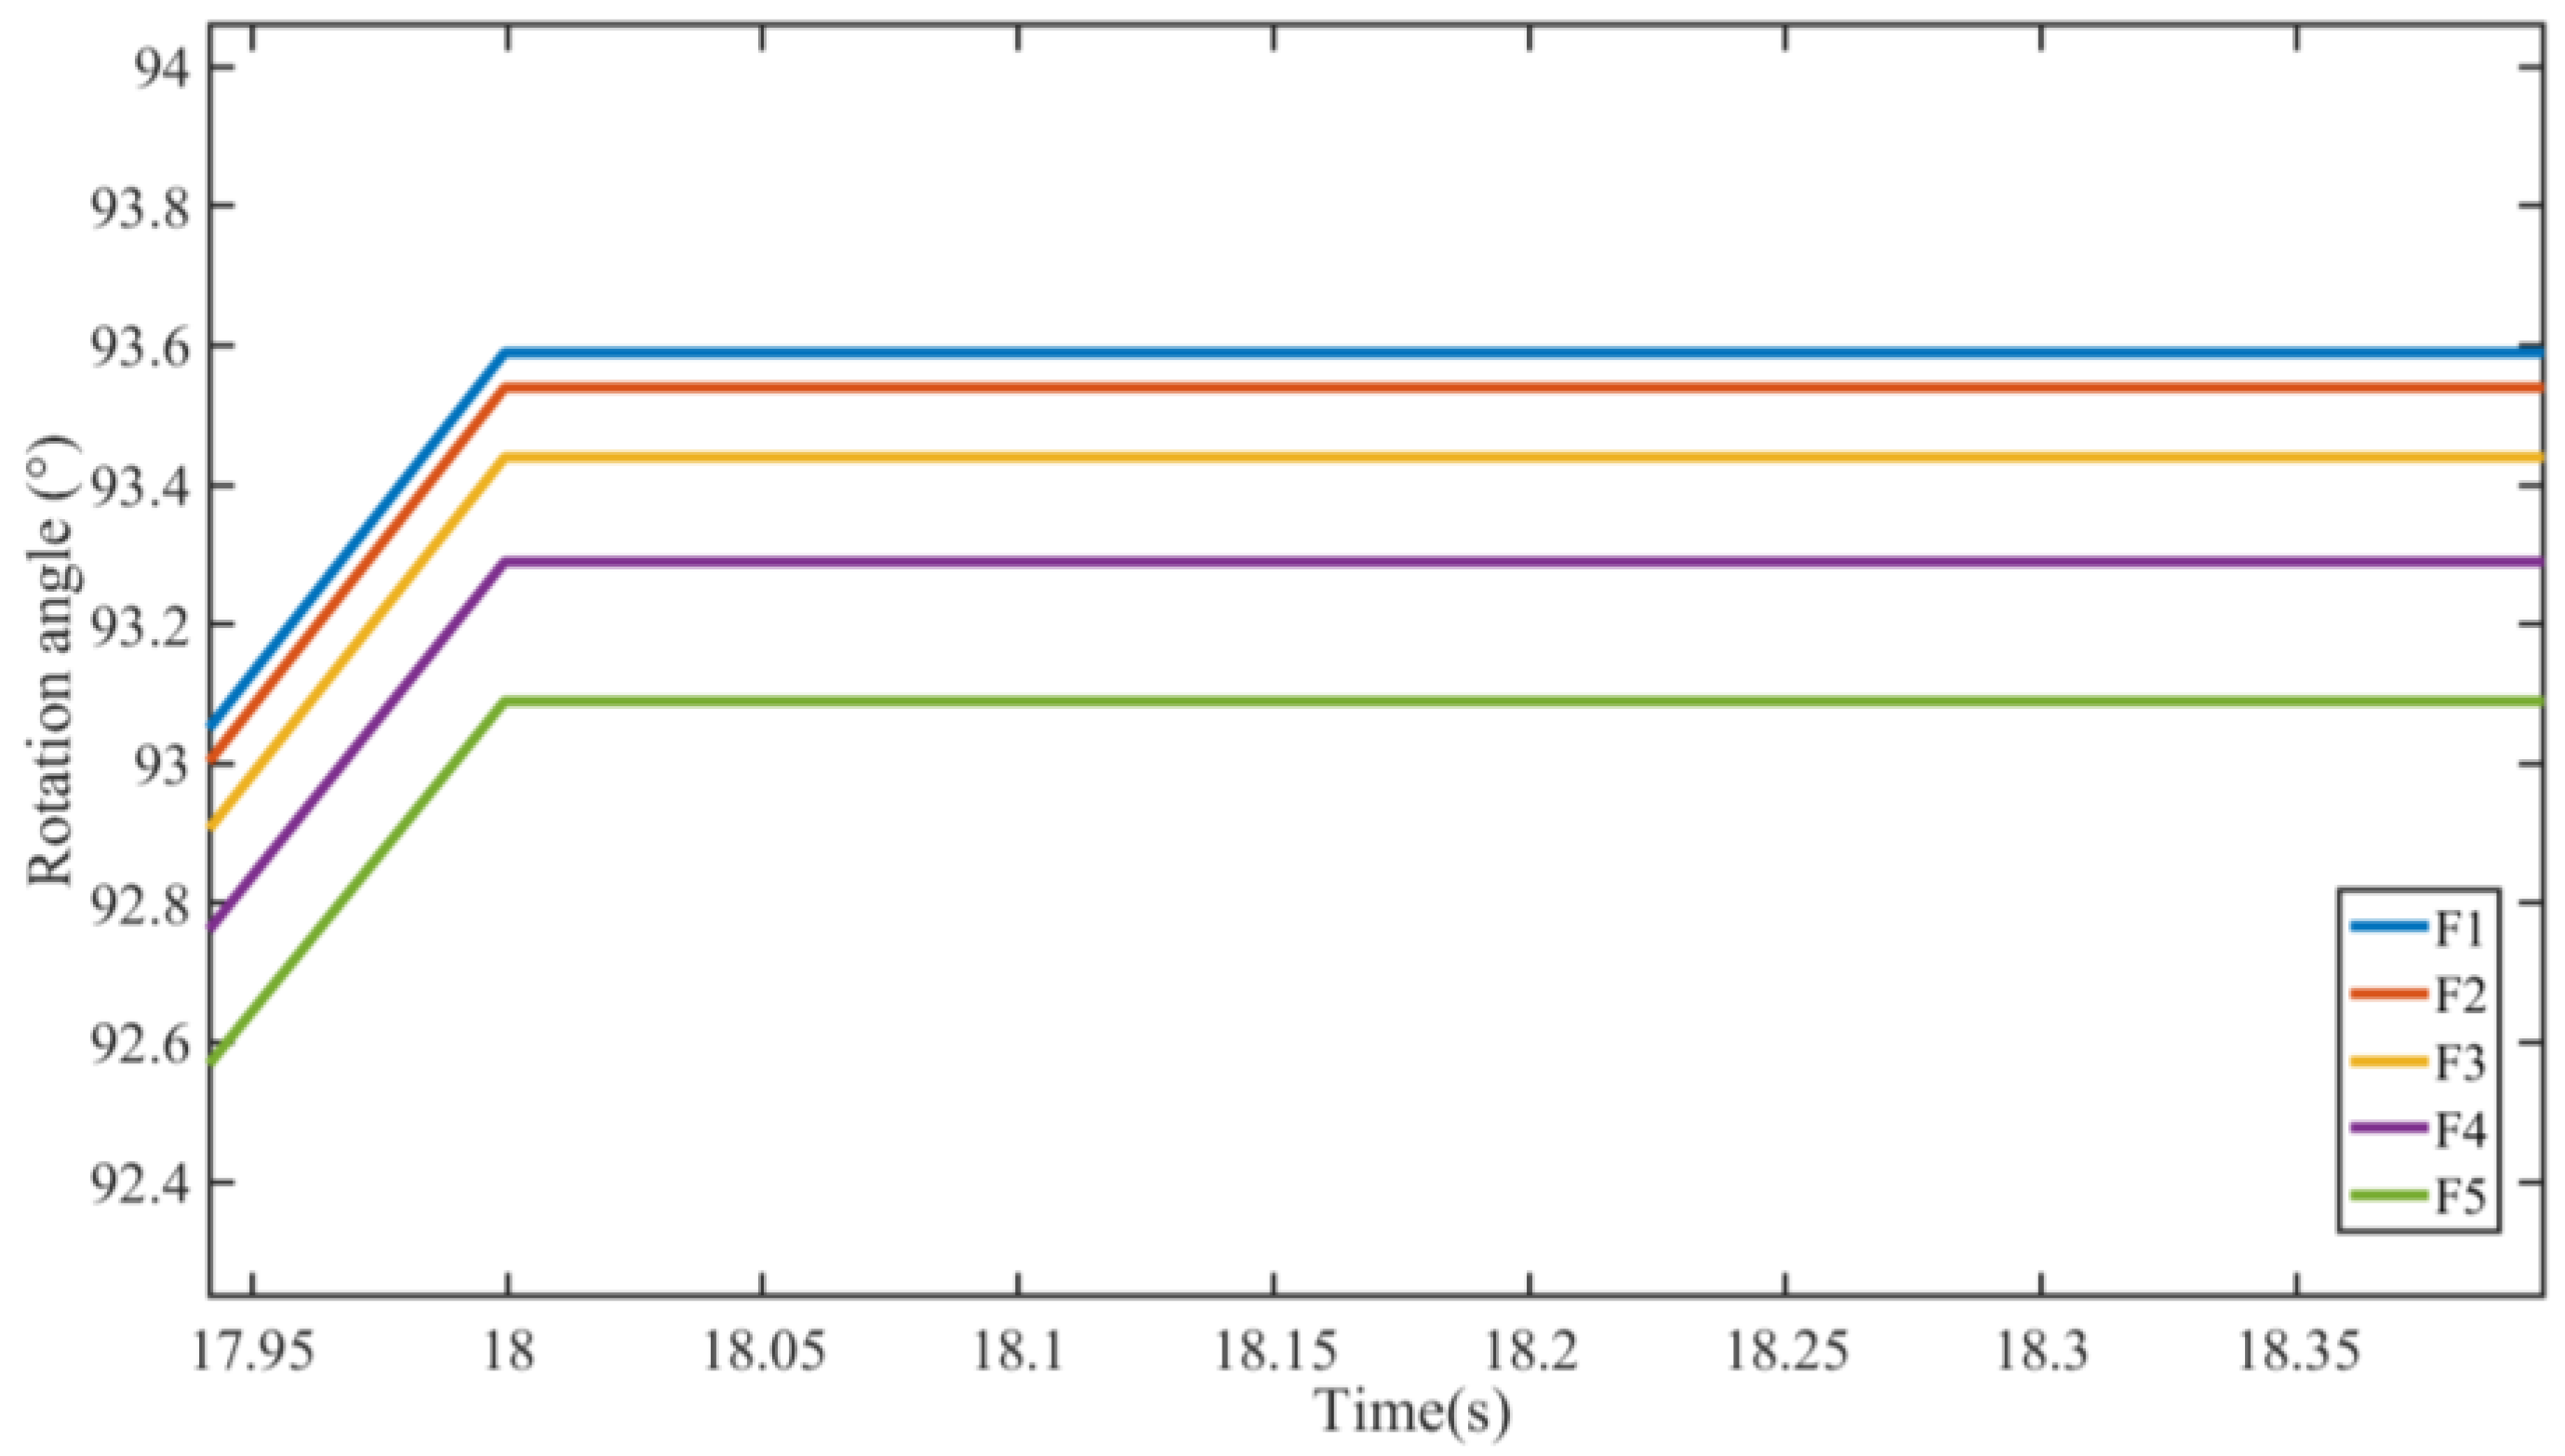
Figure 16 shows the difference in the final rotation angle under five different leakage clearances. Leakage clearance has no effect on the final stopping time of the sail. However, with the increase in leakage clearance, the final rotation angle of the sail in the whole operation process gradually decreases, from 93.6° corresponding to the minimum leakage state (F1) to 93.1° corresponding to the maximum leakage state (F5). This shows that the leakage of the speed regulating valve will also bring adverse effects on the control accuracy of the sail, but not as much as the impact of the reversing valve.
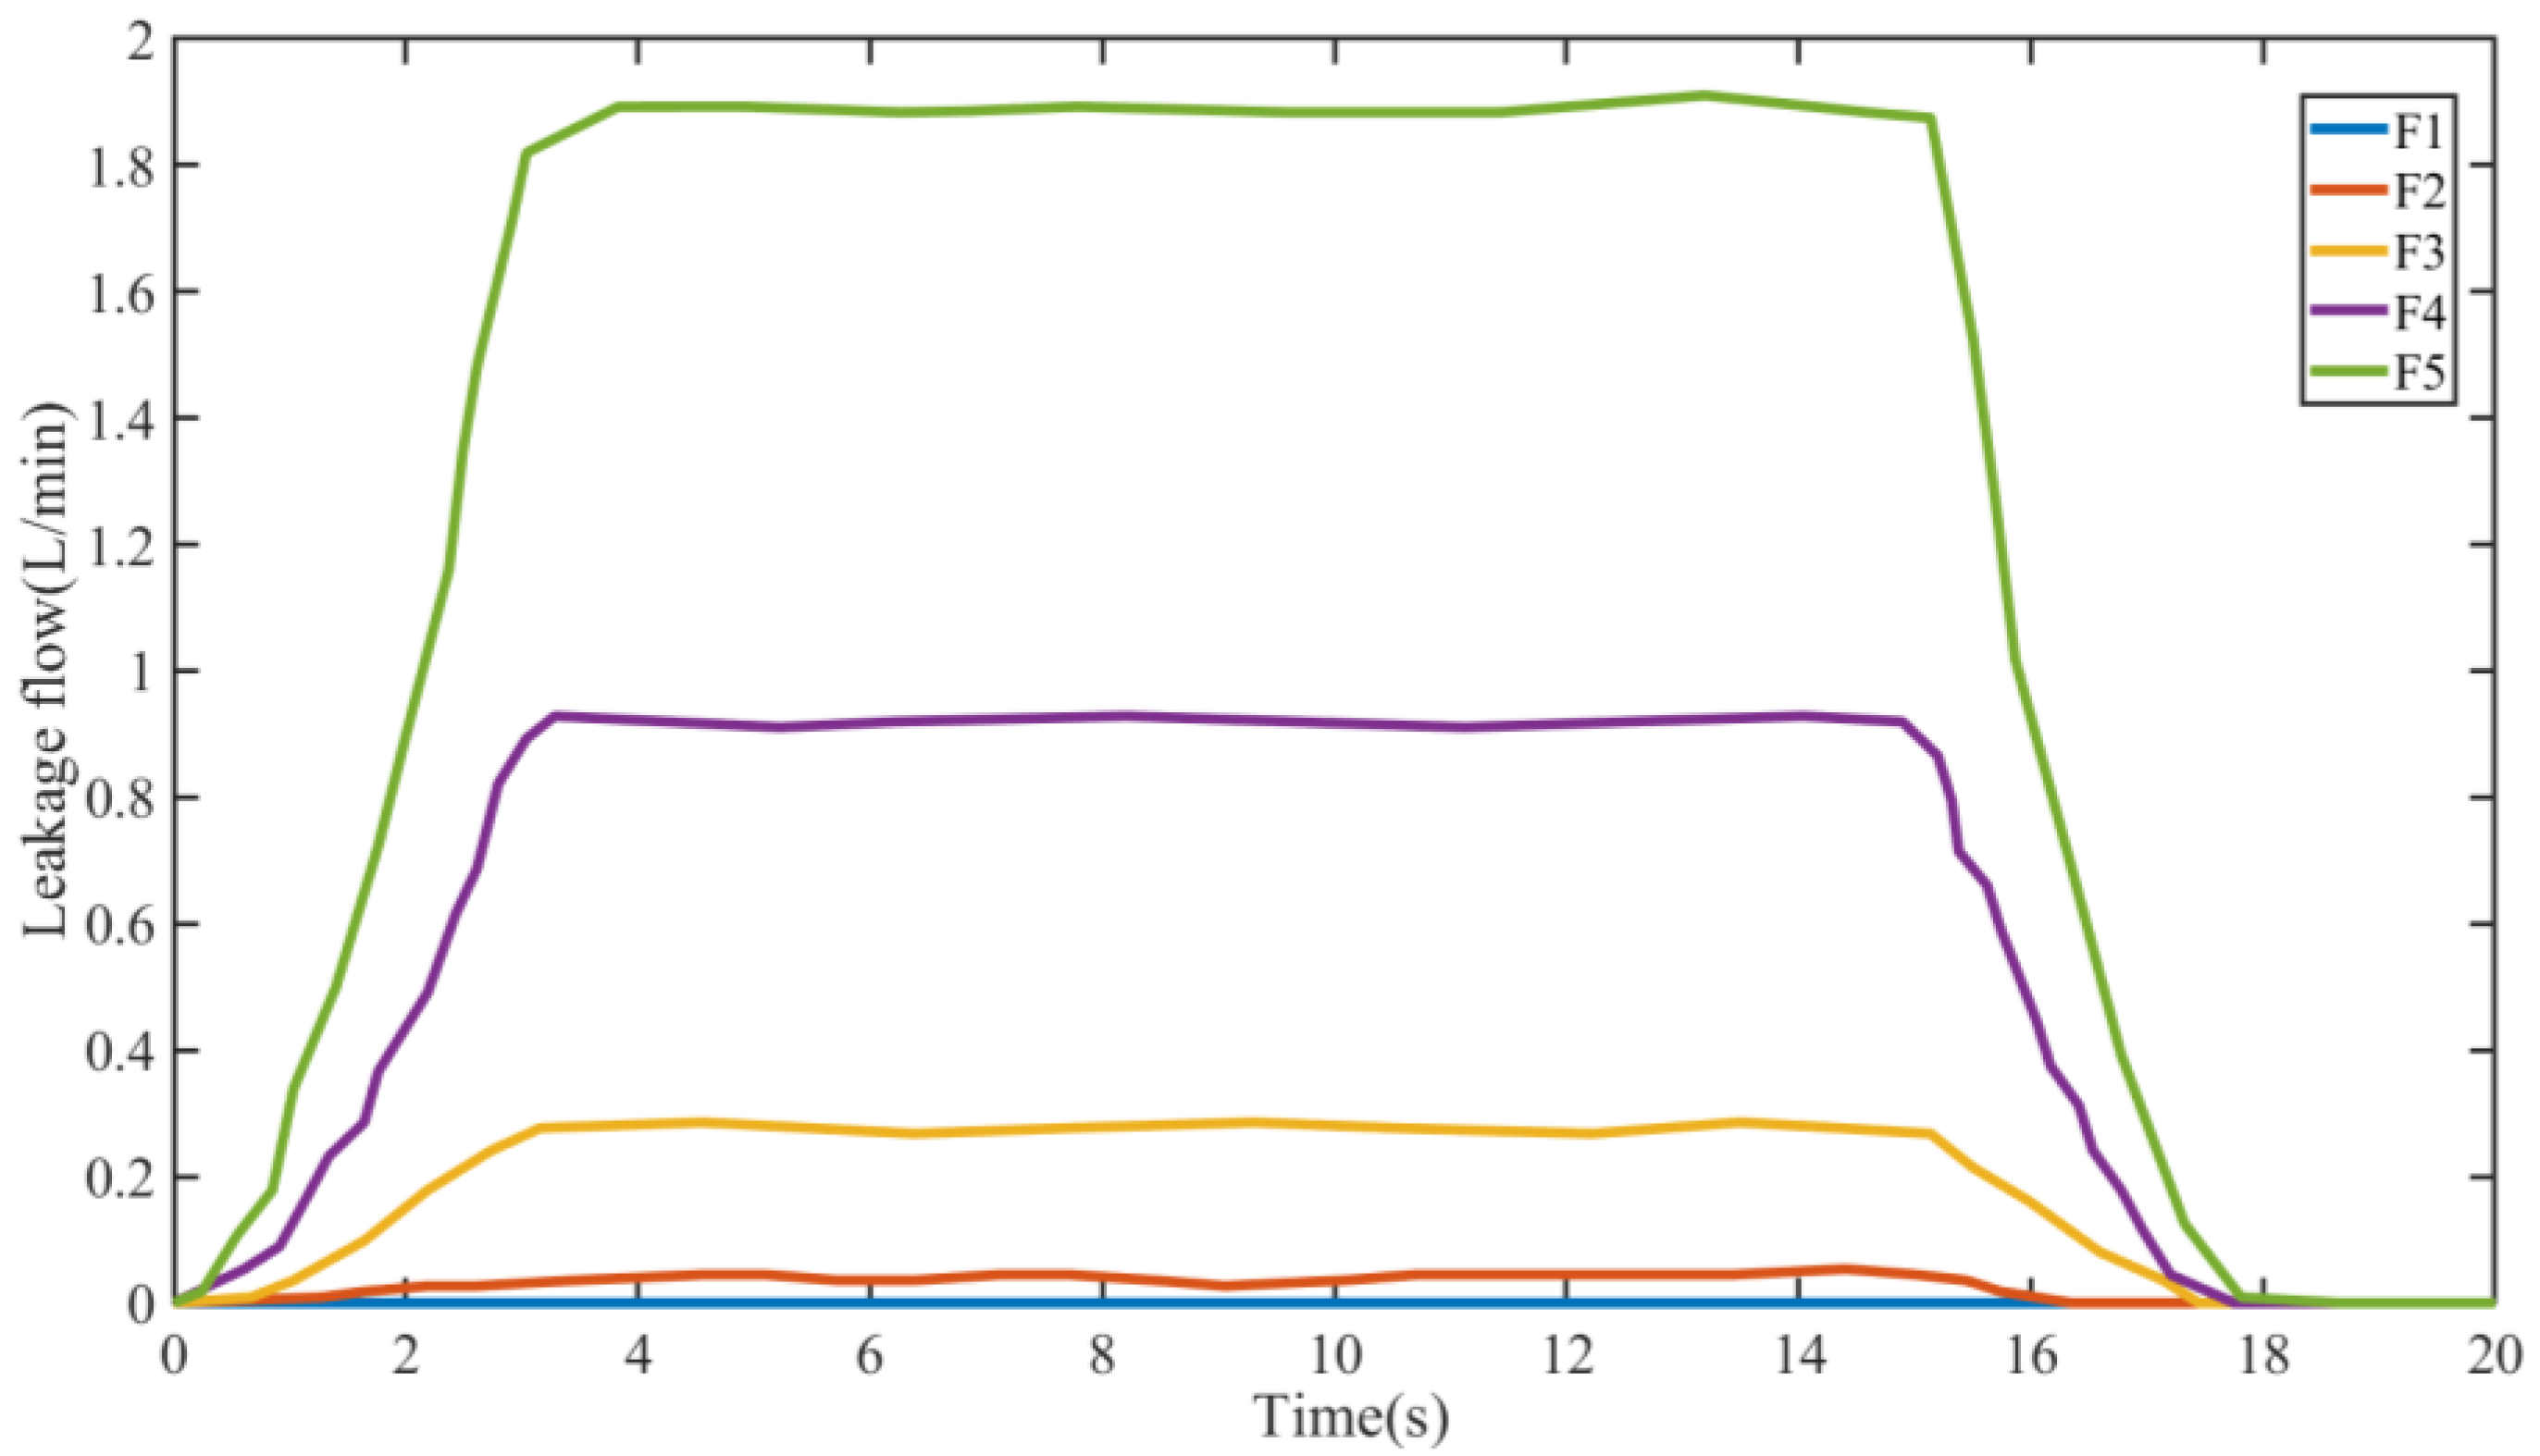
Figure 17 shows the leakage flow of the speed-regulating valve under five leakage clearances. In the minimum leakage state (F1), the leakage amount is almost zero, and the sail can normally rotate to the set angle. When the clearance increases, the leakage flow will gradually increase. At this time, the rotation of the sail is greatly affected, and the sail cannot be rotated to the set position, which will reduce the use effect of the sail. Meanwhile, as for the same clearance, the speed-regulating valve leakage is smaller than the reversing valve leakage, indicating that the influence of the speed-regulating valve leakage on the rotation performance of the sail is less than the reversing valve.
3.3.3. Hydraulic Motor
When the leakage of the hydraulic motor increases gradually due to wear and vibration, its volumetric efficiency will decrease. Therefore, different volumetric efficiencies are set for the hydraulic motor in the model, as shown in
Table 6. In order to facilitate the analysis of the final influence on the rotor rotation process, the simulation time is extended until the motor stops completely.
Figure 18 shows the difference in the final rotation angle under five different volumetric efficiencies. With the increase in hydraulic motor leakage, the time to stop the rotation also extended correspondingly, from 18 s corresponding to the minimum leakage state (M1) to 20 s corresponding to the maximum leakage state (M5), which indicates that the increase in hydraulic motor leakage will lead to hysteresis of the system response. If the control signal also 18 s to stop rotation, the leakage of the hydraulic motor will cause the sail cannot to rotate to the set angle.
3.4. Leakage Fault Feature
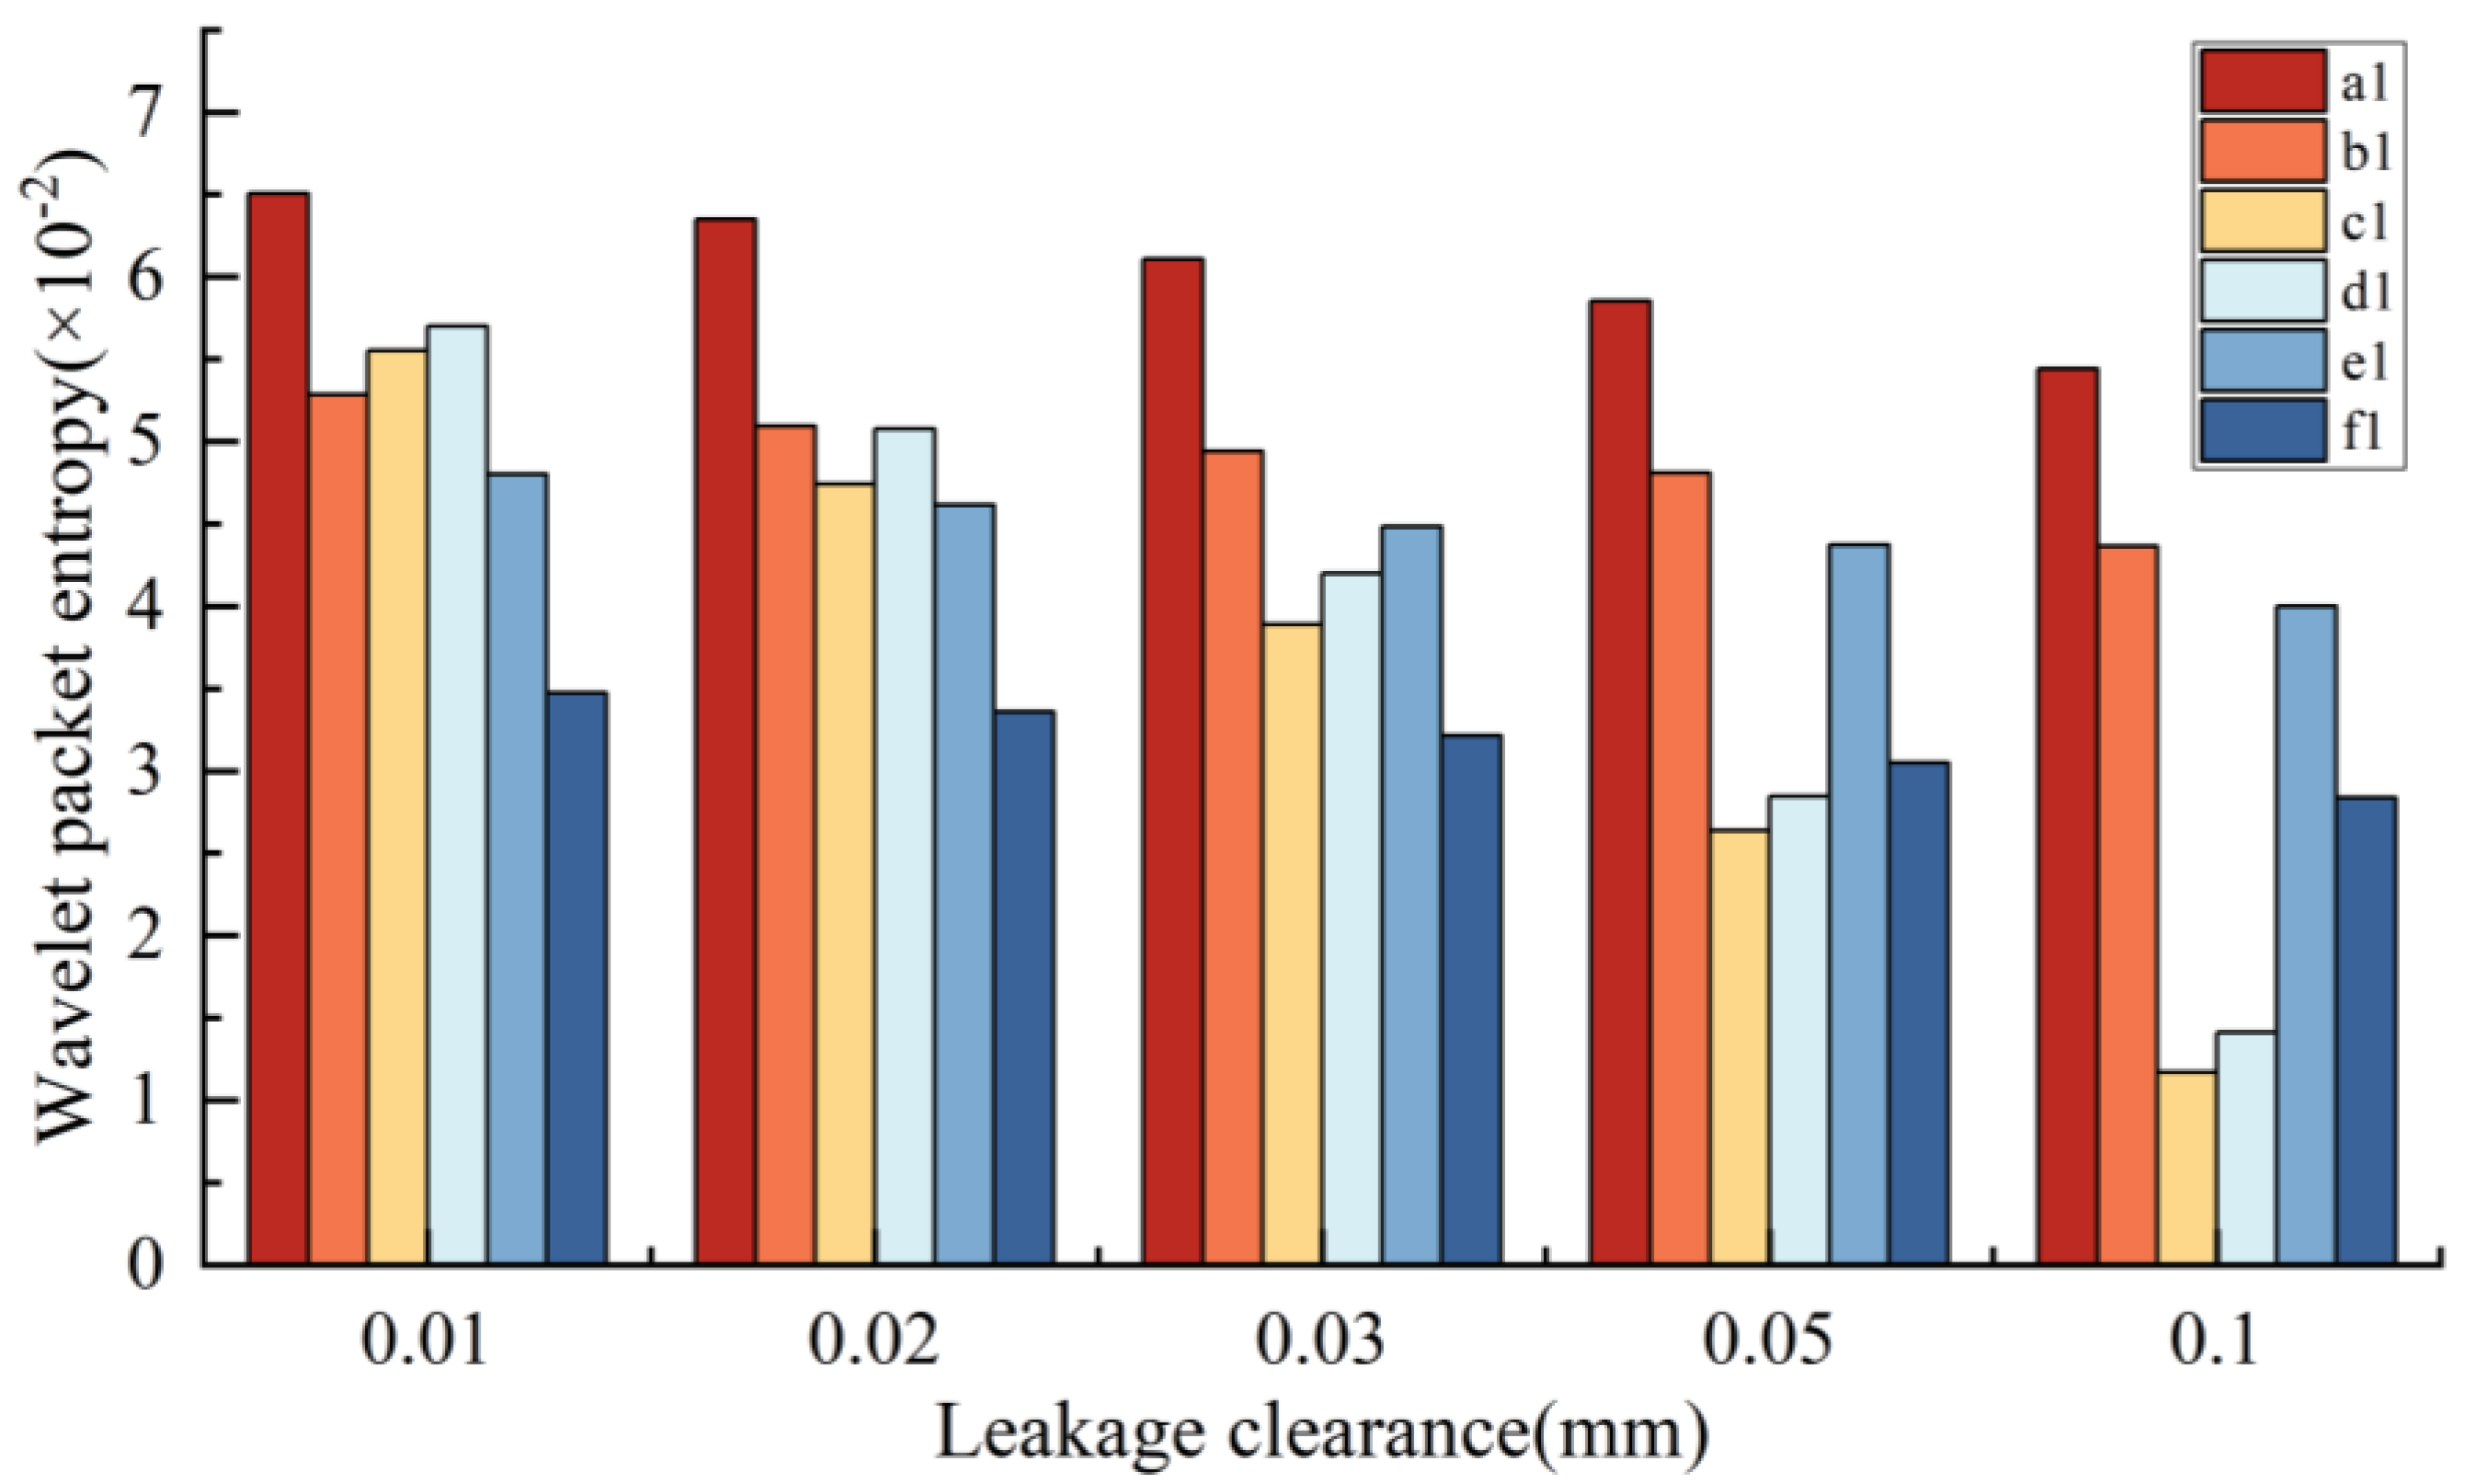
One flow signal and two pressure signals are used in this paper. The energy distribution of the four-layer sub-band of flow and pressure signal of reversing valve, speed regulating valve, and hydraulic motor are extracted under different leakage states, and the db4 and db6 wavelet packet energy entropy are calculated. The fault features of the wavelet packet are shown in
Table 7.
The leakage fault feature group Xi = [ai, bi, ci, di, ei, fi] (i = 1, 2, 3) can be built to perform fault diagnosis.
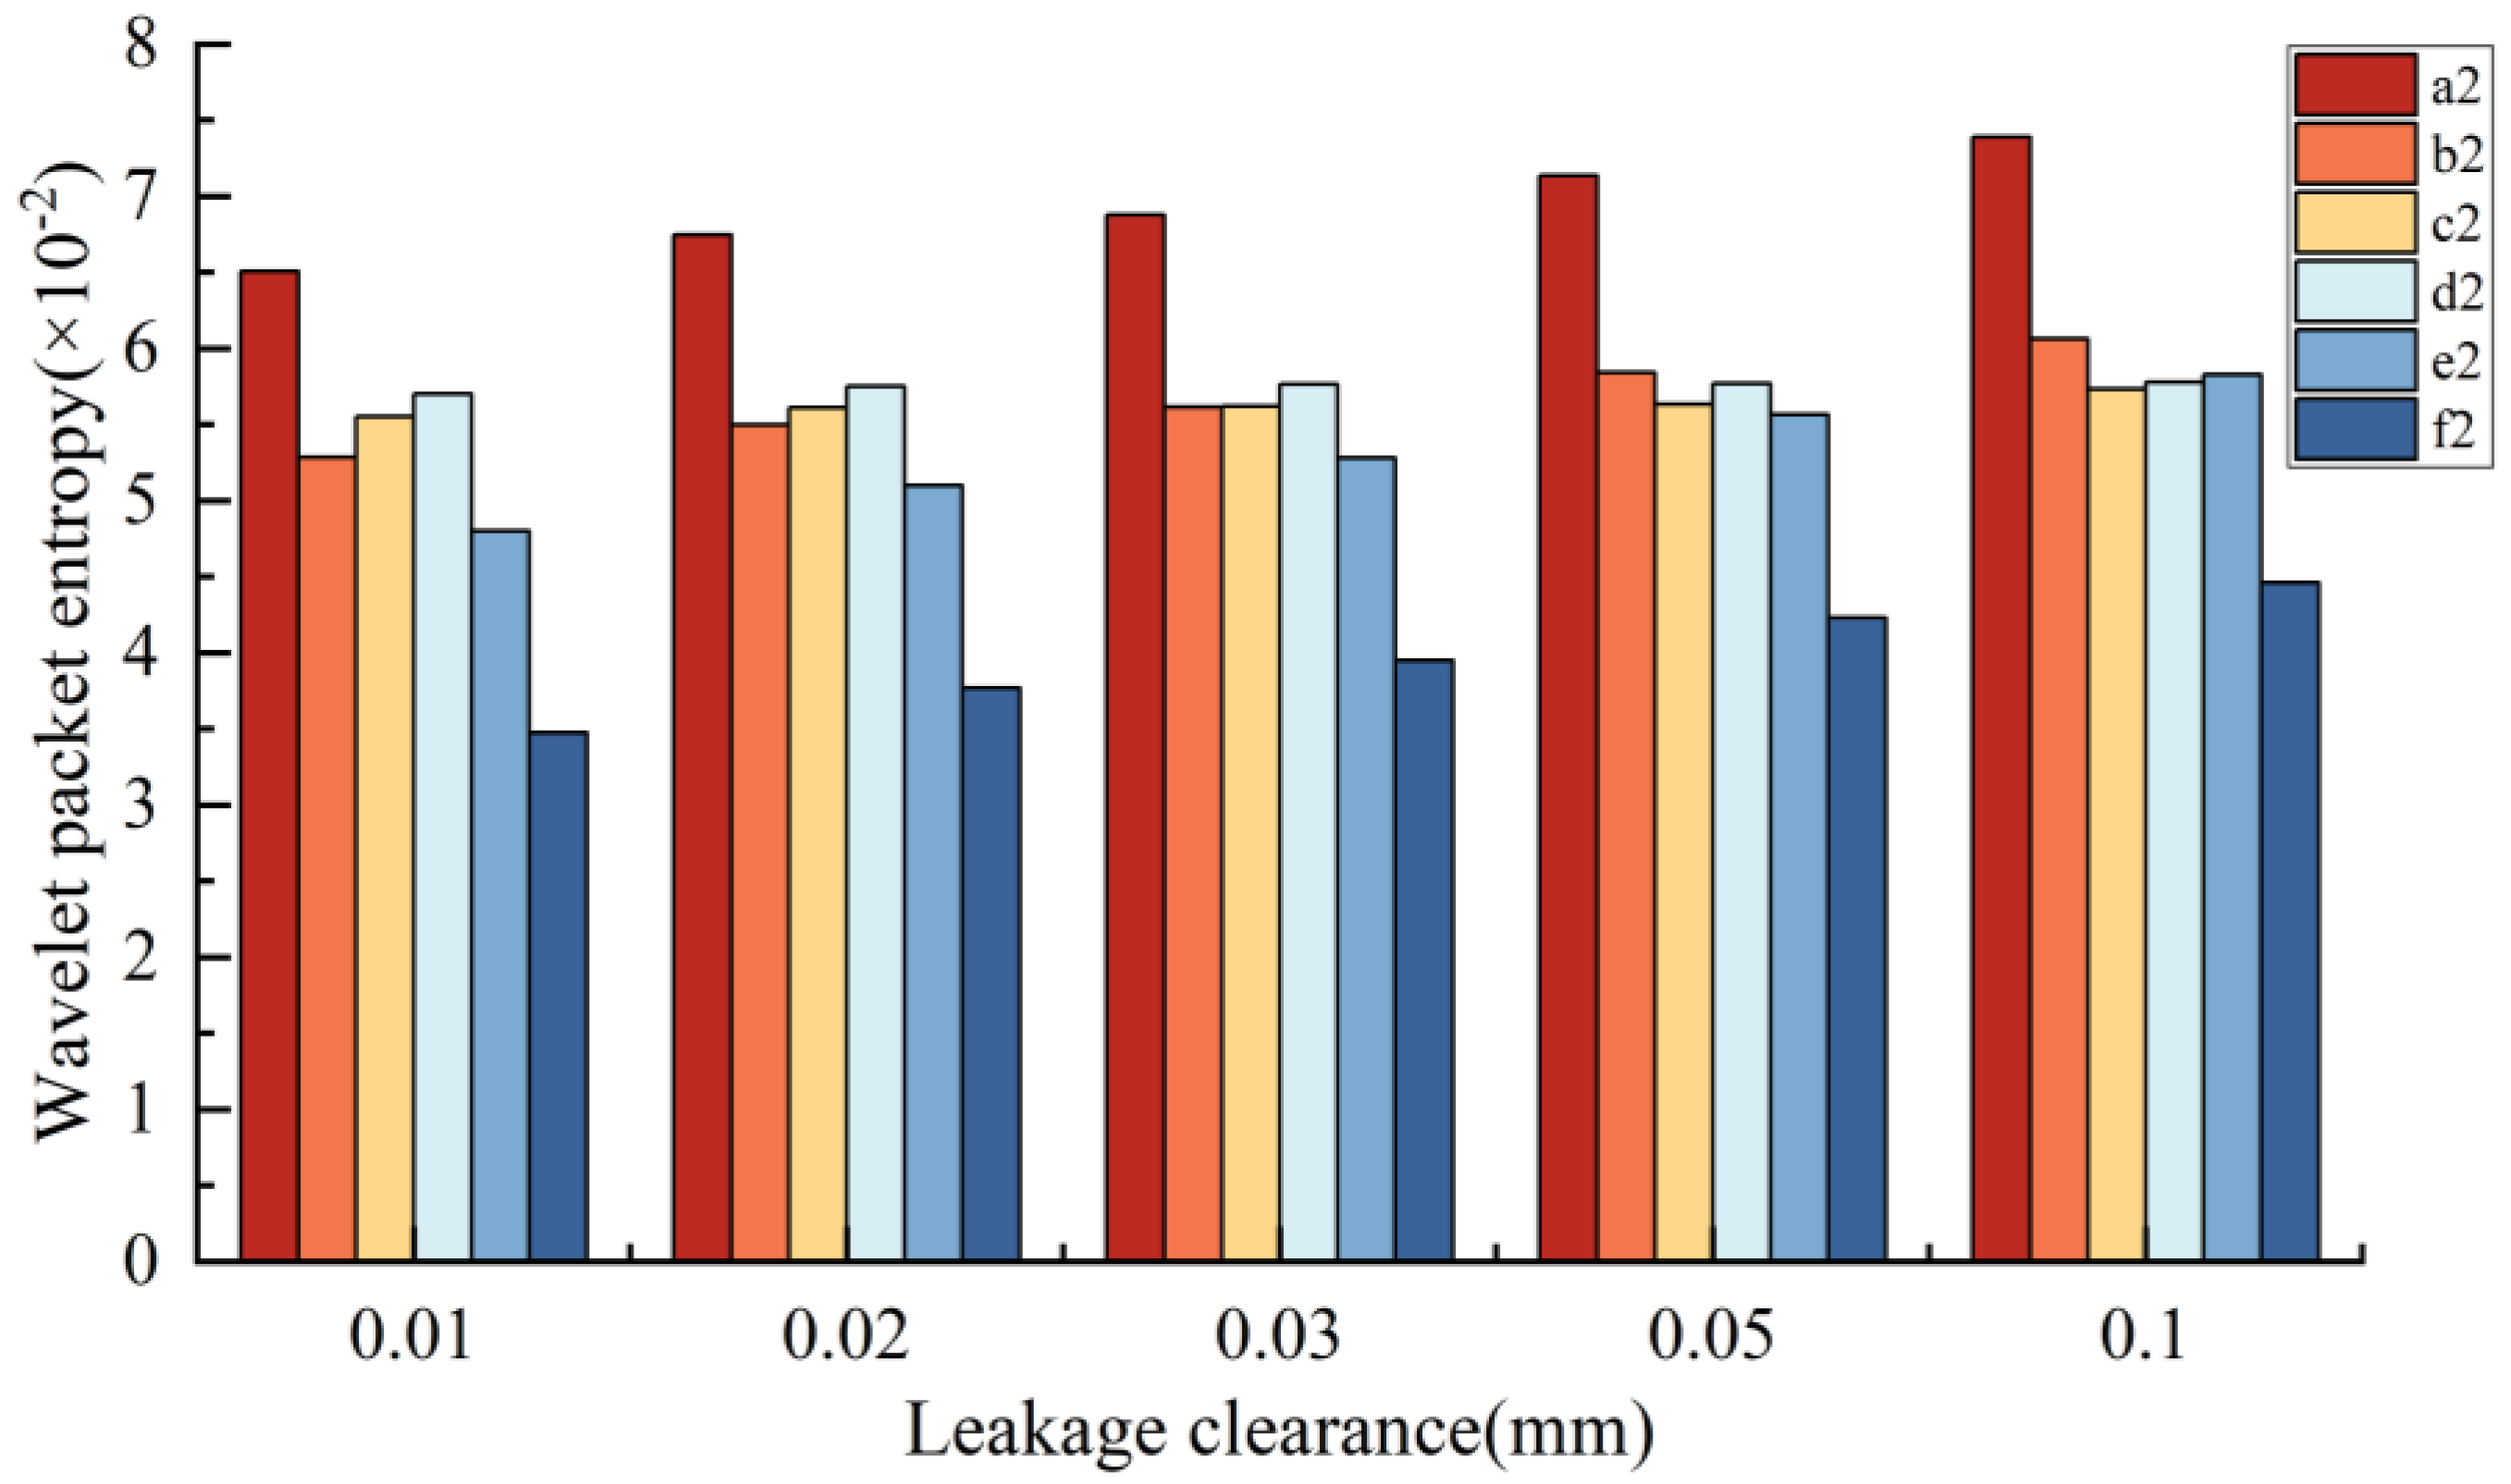
Figure 19 shows the fault feature of the flow signal and pressure signal under five different leakage clearances in reversing valve. Energy entropy on both sides of the hydraulic motor decreases with the increase in leakage clearance, which indicates that wavelet band energy near the hydraulic actuator has a large attenuation degree when the reversing valve leaks.
Figure 20 shows the fault feature of the flow signal and pressure signal under five different leakage clearances in the speed regulating valve. Energy entropy on both sides of the hydraulic motor increases with the increased clearance, which indicates that the leakage will lead to the complicated flow state of hydraulic oil, resulting in a more uneven distribution of the wavelet band energy of flow, pressure, and other signals.
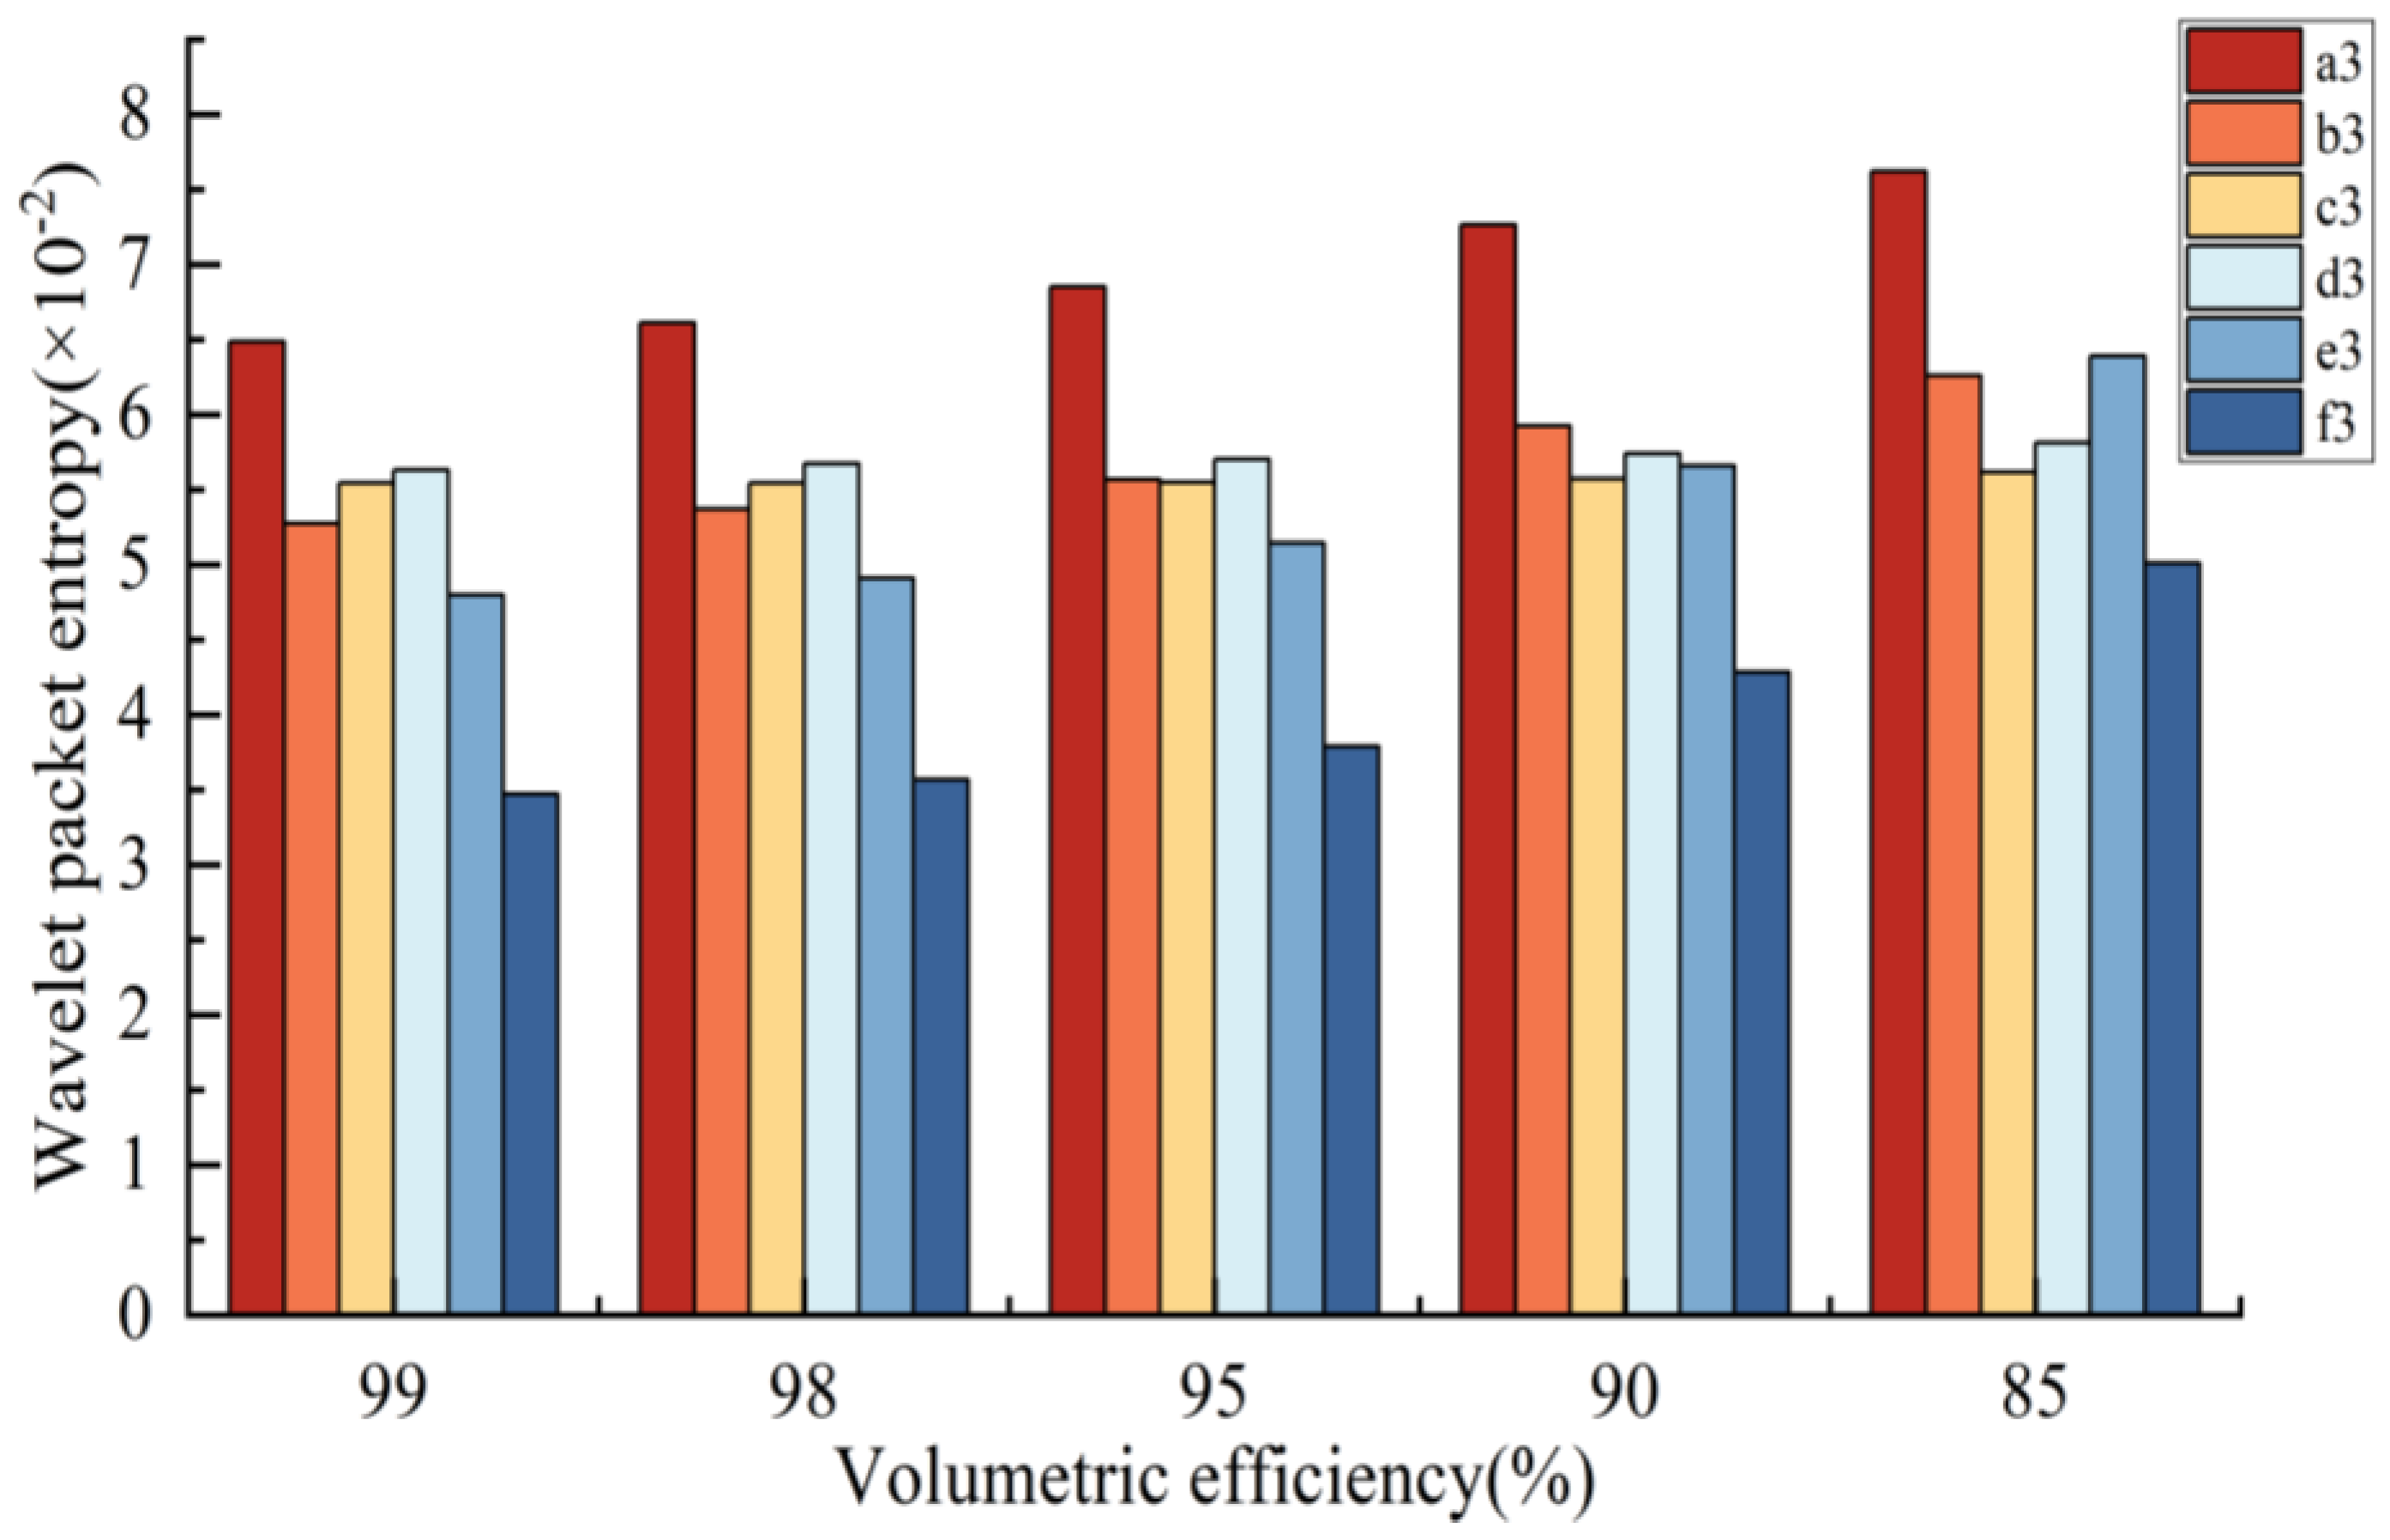
Figure 21 shows the wavelet packet energy entropy of the flow signal and pressure signal under five different leakage clearance sizes in a hydraulic motor. When leakage occurs in the hydraulic motor, the wavelet packet entropy of pressure signals and flow signals on both sides of the hydraulic motor increases to varying degrees with the increase in leakage degree, indicating that leakage of the hydraulic motor has an impact on the flow state of hydraulic oil on both sides, which will aggravate the disorder of energy distribution.
Due to the increased clearance and flow of leakage, the state of the hydraulic oil in the pipeline also changes, and the flow state is more disordered. It shows that the energy entropy is an effective feature of the leakage failure of the sail slewing hydraulic system.
4. Results and Discussion
10 different fault modes are set in this paper, as shown in
Table 8.
According to the FPR method in
Section 2.3, the membership functions of the reversing valve, speed regulating valve, and hydraulic motor, as well as the fuzzy set of the leakage fault mode, are calculated. According to the principle of minimum ambiguity, the median number is selected to calculate its fuzzy set.
For reversing valve and speed regulating valve, the clearance is 0.01 mm for normal mode. The clearance is 0.035 mm for minor leakage mode, the clearance is 0.075 mm for moderate leakage mode, and the clearance is 0. 550 mm for severe leakage mode.
Table 9 and
Table 10 are the membership function and fuzzy set of the reversing valve.
Table 11 and
Table 12 are the membership function and fuzzy set of the speed regulating valve.
For the hydraulic motor, the volumetric efficiency is 97.5% for normal mode. The volumetric efficiency is 92.5% for minor leakage mode, the volumetric efficiency is 85% for moderate leakage mode, and the volumetric efficiency is 40% for severe leakage mode.
Table 13 and
Table 14 are the membership function and fuzzy set of the hydraulic motor.
For the leakage fault to be identified, the six-wavelet packet energy feature groups Xi of the flow and pressure signals under the fault state are obtained, respectively, and the corresponding membership function, as well as the fuzzy set, are calculated. Then, the lattice closeness degree set N under the fuzzy set of leakage faults is to be identified, and the fuzzy set of different leakage states of reversing valve, speed-regulating valve, and the hydraulic motor is calculated. By comparison, the maximum value in the lattice closeness degree set N can be obtained, and the leakage mode pointed by the maximum value is the diagnosis result of the leakage fault to be identified.
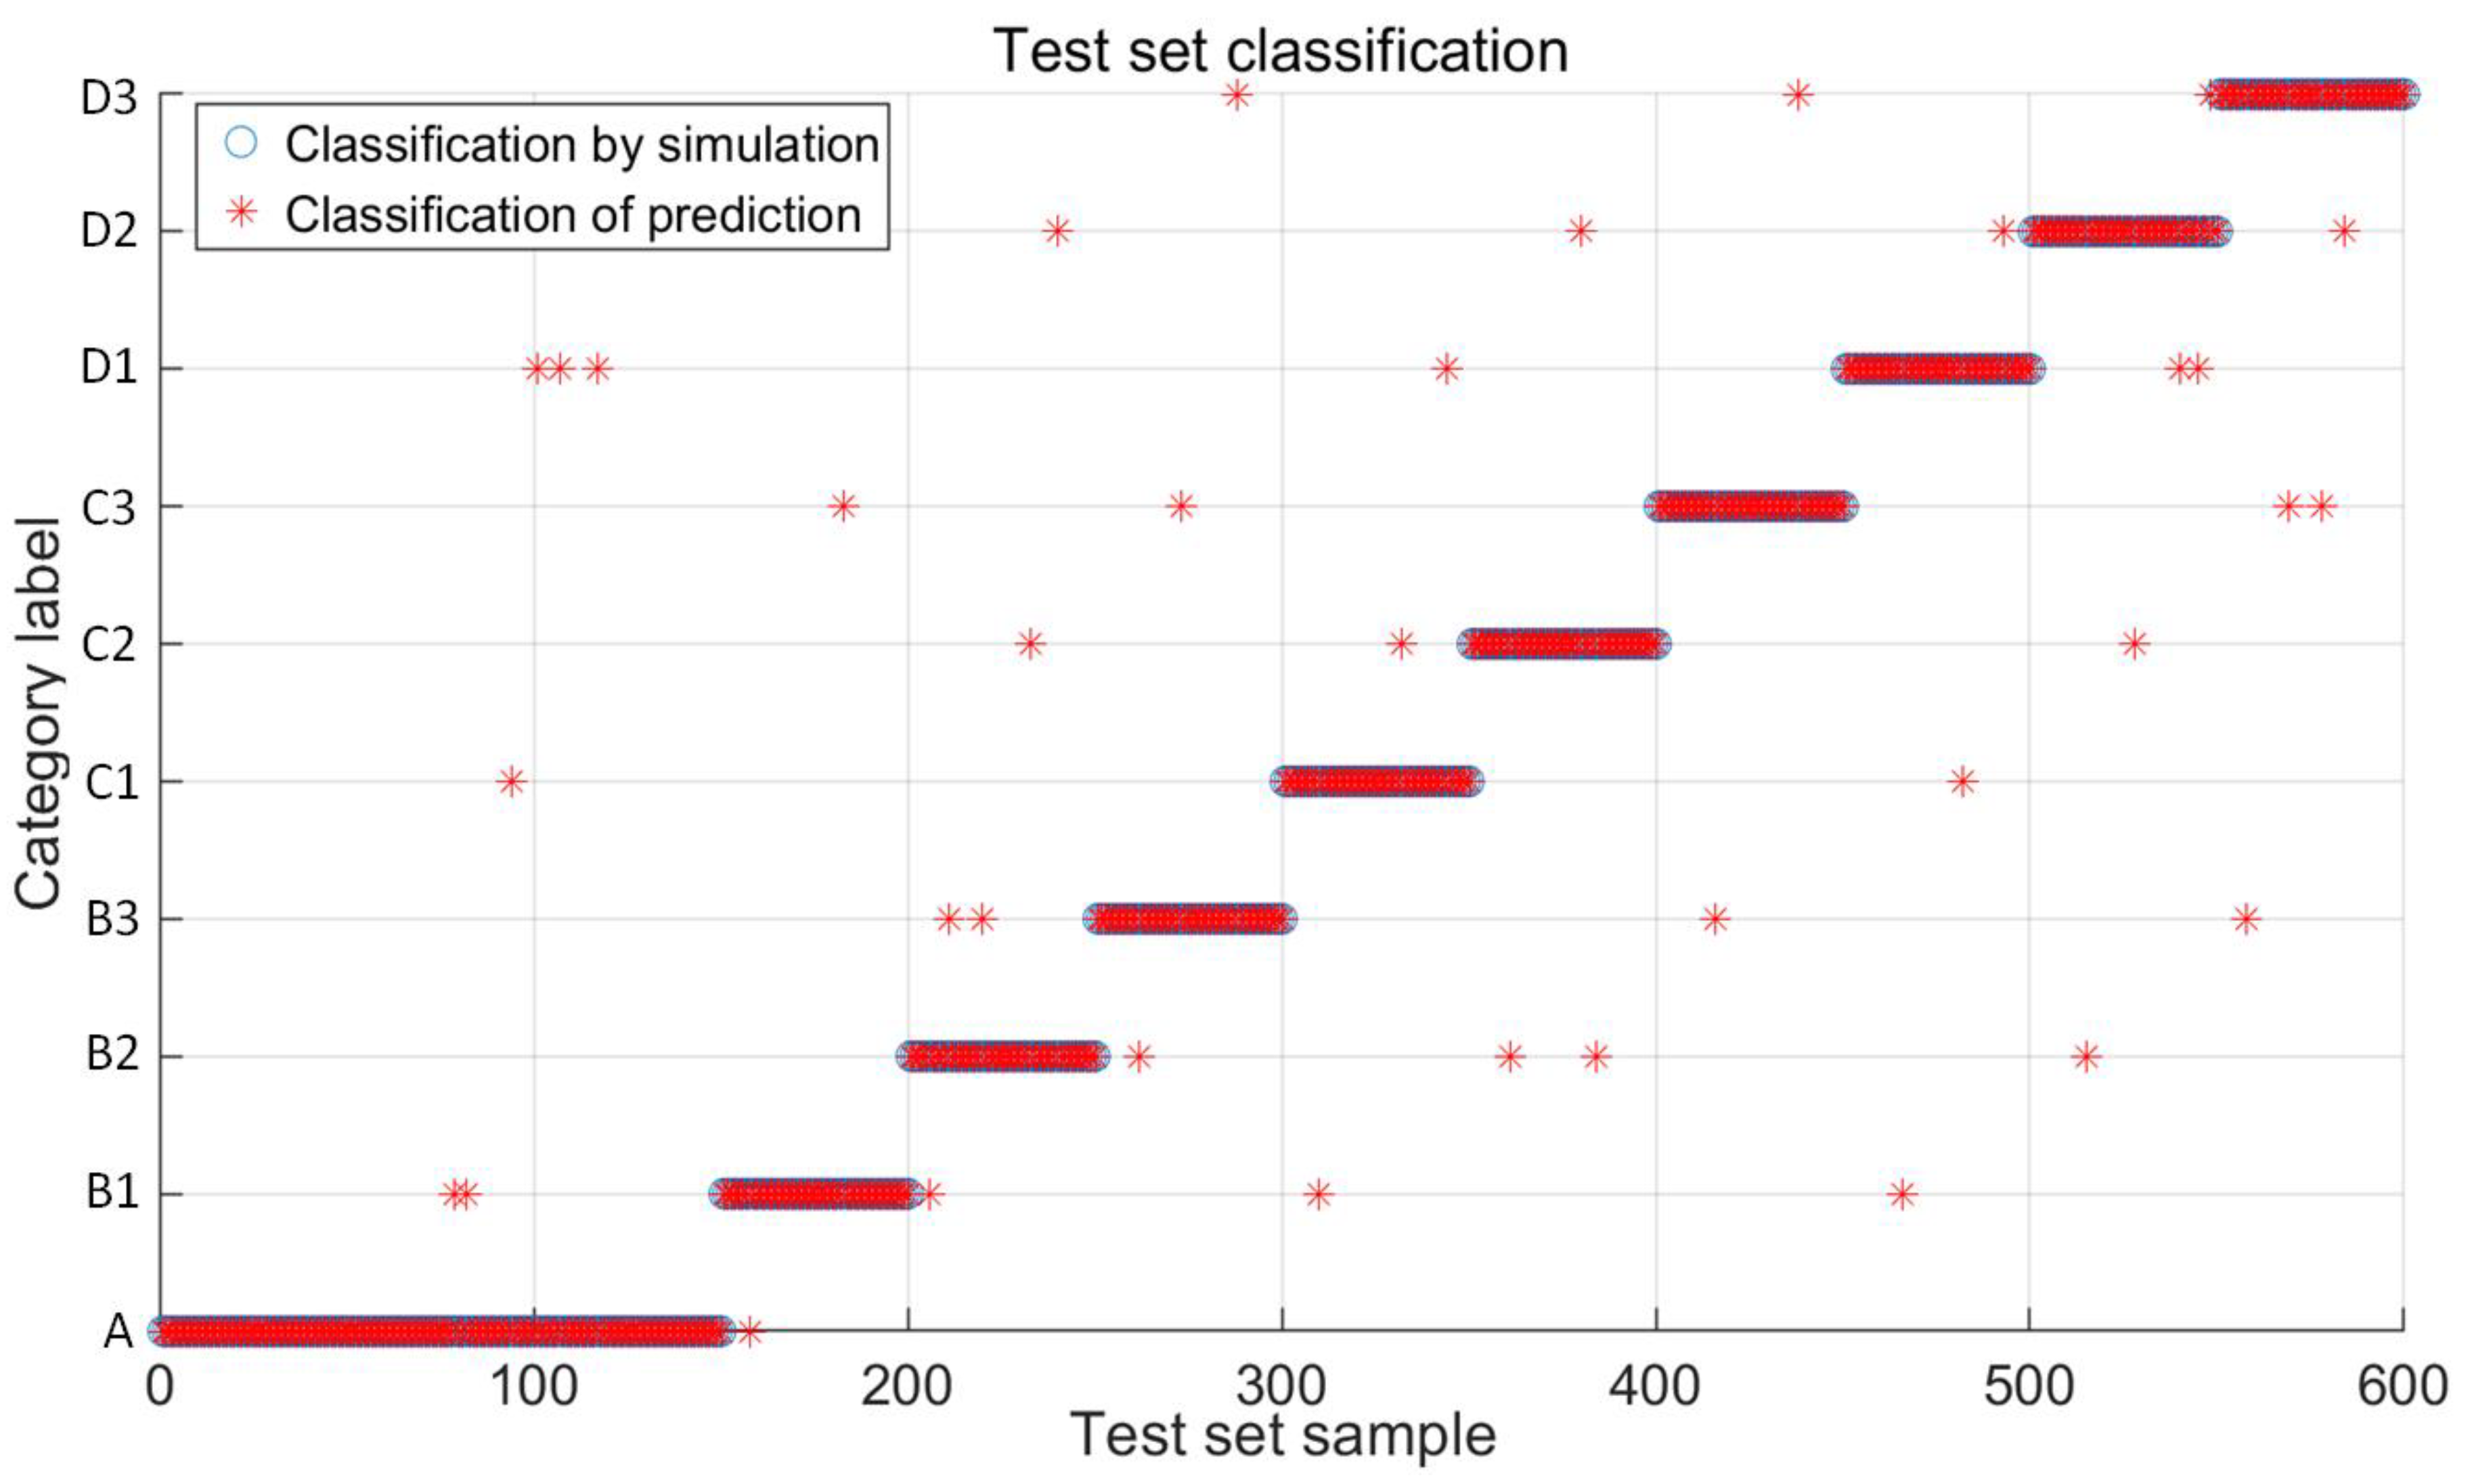
Table 15 shows the leakage fault test set, which is randomly simulated by the model.
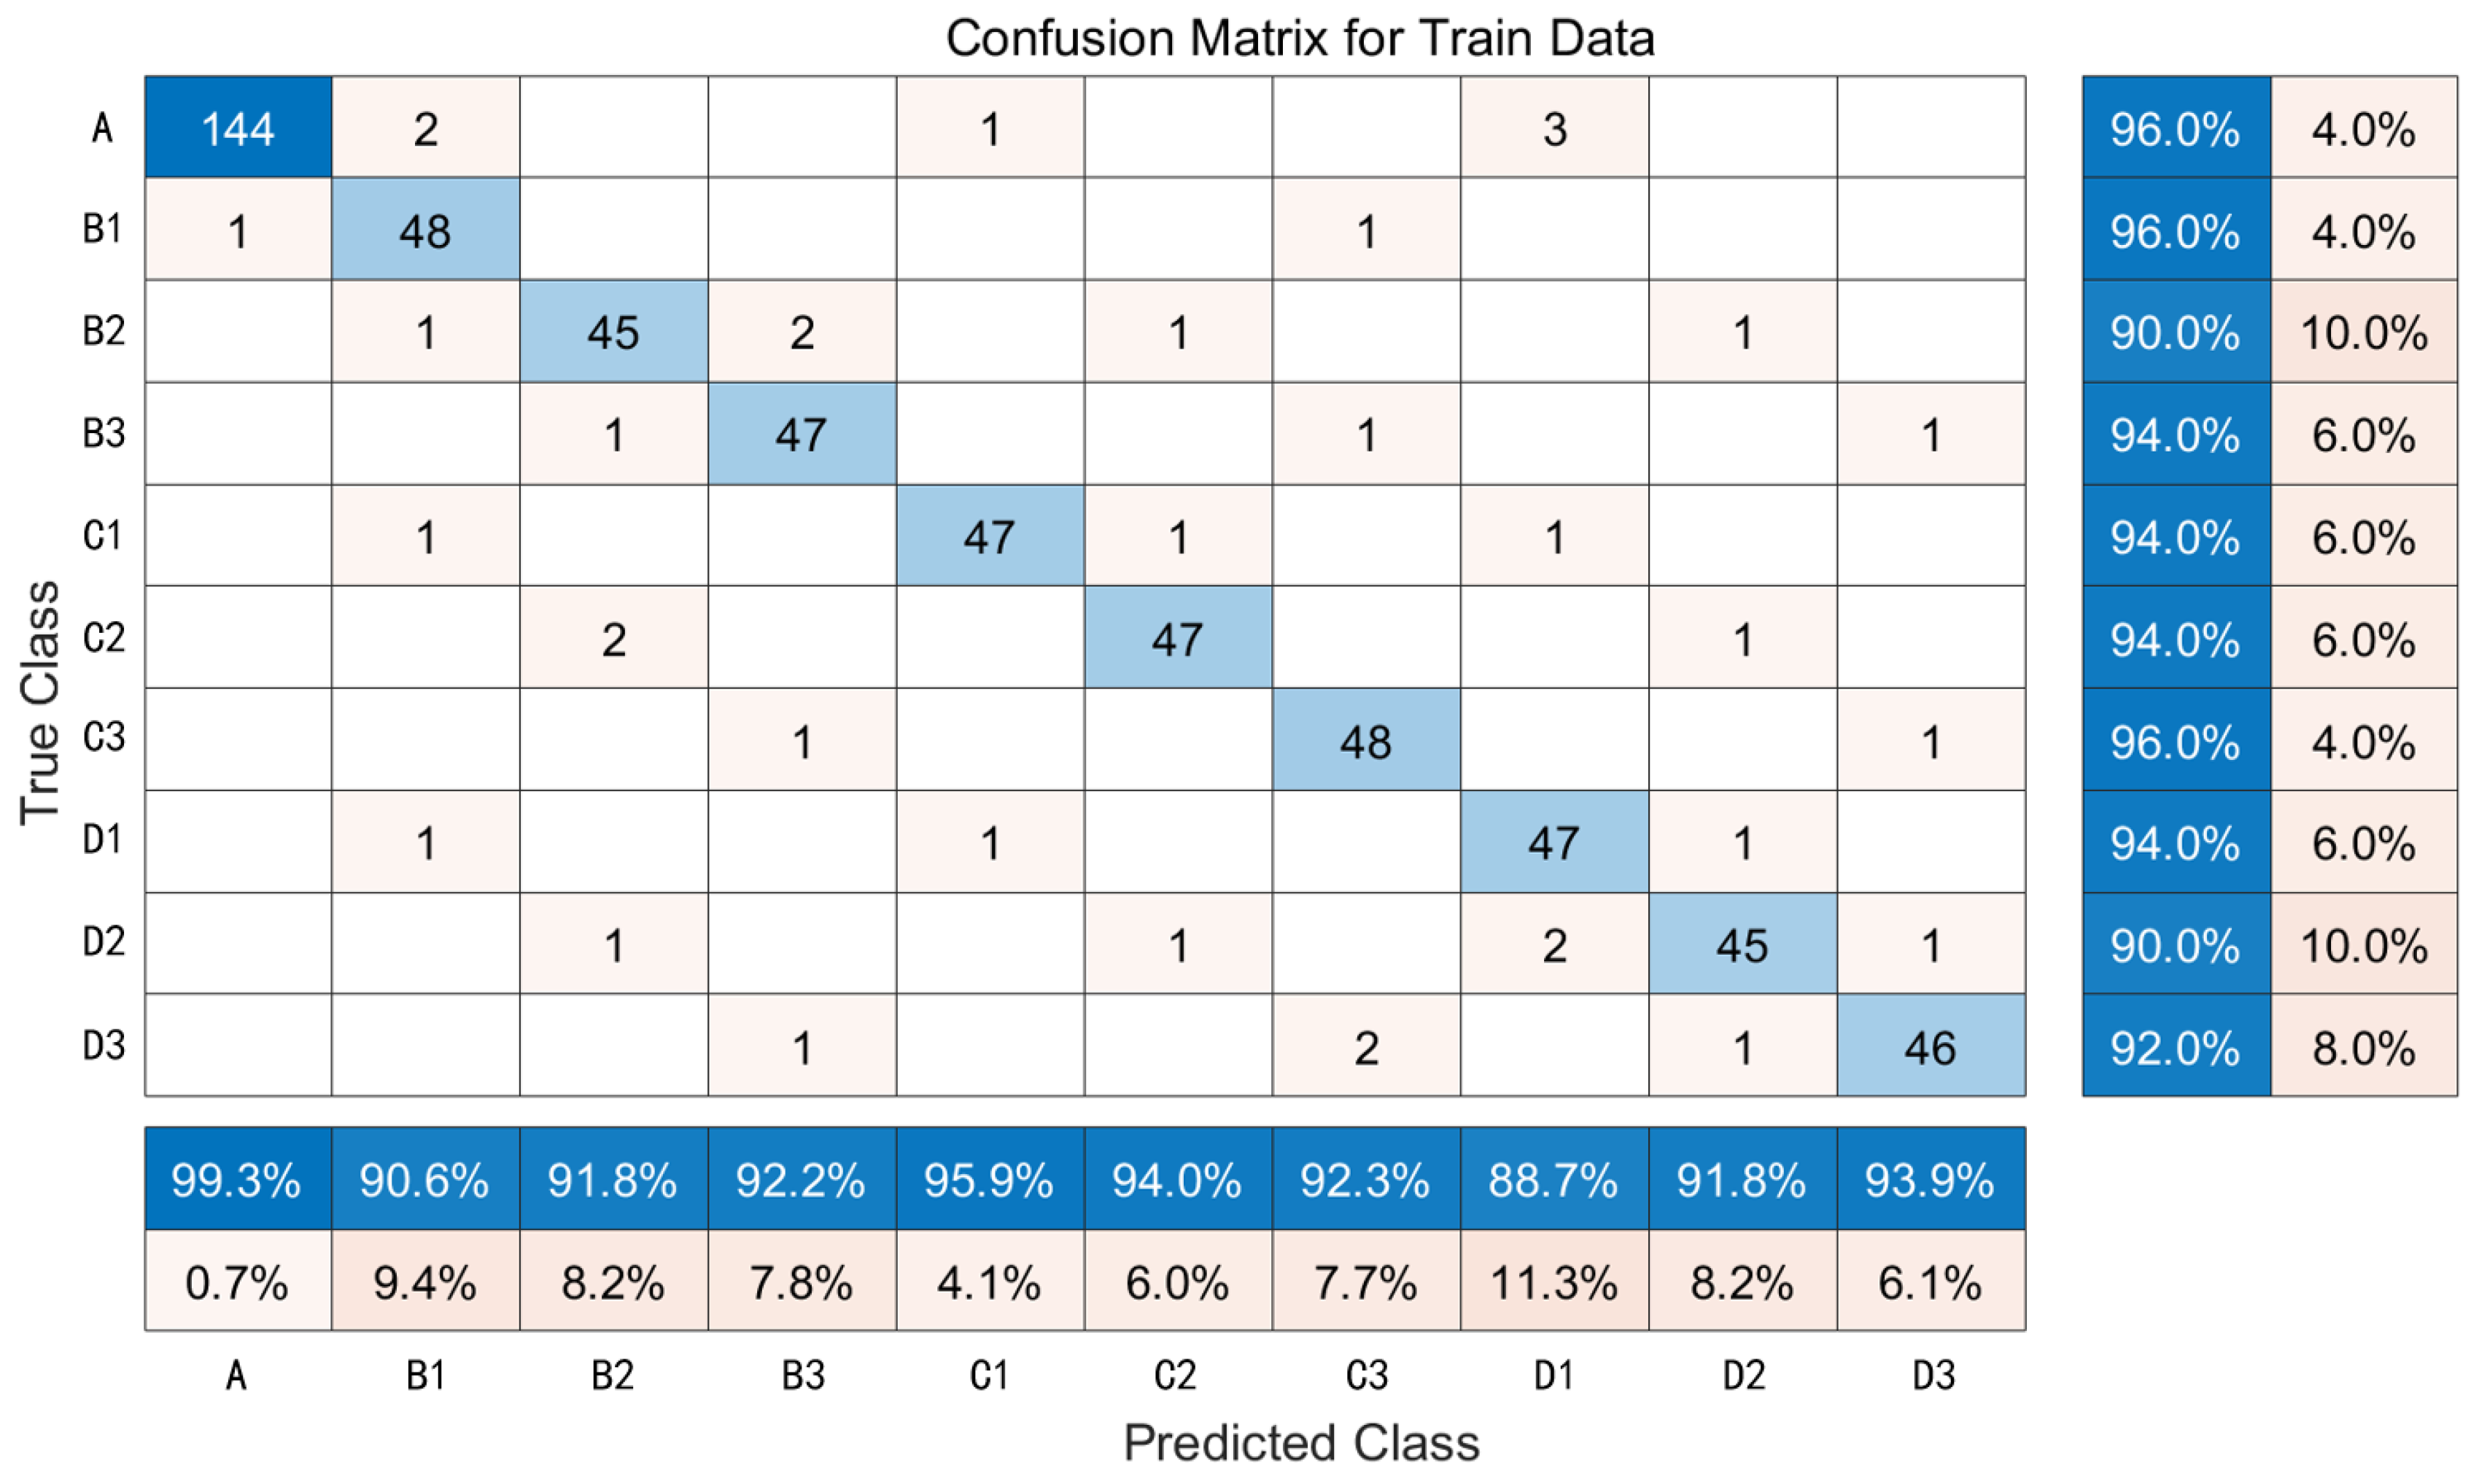
Figure 22 shows the diagnosis results. Only 36 sets are misdiagnosed among 600 leakage sets.
Figure 23 shows the diagnosis distribution and accuracy of the proposed method.
As can be seen from
Figure 23, the no leakage condition of reversing valve, speed regulating valve, and hydraulic motor are categorized to normal mode (A), and only 6 sets are misdiagnosed among 150 sets, with an accuracy of 96%. The same accuracy occurs in minor leakage in reversing valve (B1) and severe leakage in the speed regulating valve (C3); 2 sets are misdiagnosed among 50 sets. For reversing valves, the diagnosis accuracy of moderate leakage (B2) is lower than minor leakage (B1) and severe leakage (B3) because the fault feature of B2 is close to B1 and B3. Its more easily misidentified by the fuzzy pattern recognition method. The same situation occurs for the speed-regulating valve and hydraulic motor. That means the selection of membership function and fuzzy set for different leakage modes is critical to the diagnosis results.
The overall diagnostic accuracy of the entire test set fault mode is 94%. The proposed method is of great significance for practical applications in improving the reliability of the sail slewing hydraulic system. In addition, a small sample of flow and pressure signals is enough for good fault diagnosis results.
This paper also has the following limitations that can be improved: (1) The operation analysis of leakage fault was conducted on a single component. Simultaneous failure of multiple components may occur in the sail slewing hydraulic system, which will result in the coupling of fault characteristics and increase the difficulty of leakage fault feature extraction. (2) A minimum ambiguity method and triangular membership function is selected to construct the fuzzy set of the leaking fault. The diagnosis accuracy of moderate leakage fault mode may be improved by optimizing the selection of membership function and fuzzy set.
5. Conclusions
To effectively diagnose the leakage fault of the sail slewing hydraulic system, a wavelet packet transform-fuzzy pattern recognition method is proposed. A simulation model of the sail slewing hydraulic testbed is established, and the effectiveness of the model is verified by comparing rotational speed, system pressure, and slewing angle between the simulation and the actual testbed. After that, the wavelet packet energy entropy is selected as the fault feature, and the fault feature set was established with a four-layer wavelet packet transform method. Finally, a fuzzy pattern recognition-based fault diagnosis method is proposed by calculating the triangular membership function and fuzzy set of different leakage faults.
The diagnosis results of 600 test sets under four leakage modes for reversing valve, speed regulating valve, and hydraulic motor in the case study show the proposed method has a better diagnosis effect for minor and severe leakage mode than moderate leakage mode, with overall diagnostic accuracy of 94%. The proposed method can diagnose internal leakage faults for sail slewing hydraulic systems with high accuracy. Only a small sample of flow and pressure signals is enough for good fault diagnosis results. The proposed method can be easily applied to sail-assisted ships. Therefore, the proposed method is of great significance to promote the development of green ships by improving the reliability of the sail slewing hydraulic system.
Although the proposed method can effectively achieve the diagnosis of different leakage faults, this paper only applied the triangular membership function to construct a fuzzy set. Some other types of membership functions, such as the trapezoid function or Gaussian function, can be further studied to explore whether the diagnosis accuracy can be improved. Furthermore, the mutual interference between simultaneous faults of multiple components is not fully considered in this paper. Therefore, the coupling of multiple faults occurring at the same time will be considered in future research.


 ,
, 


