Article

Characteristics of Surface Wave on the Unstable Interface in Gas Jet Forming

1
School of Mechatronic Engineering and Automation, Foshan University, Foshan 528001, China
2
School of Mechatronic Engineering, Changchun University of Science and Technology, Changchun 130022, China
3
Ministry of Education Key Laboratory for Cross-Scale Micro and Nano Manufacturing, Changchun 130022, China
*
Author to whom correspondence should be addressed.
Machines 2023, 11(2), 285; https://doi.org/10.3390/machines11020285
Submission received: 20 January 2023 / Revised: 10 February 2023 / Accepted: 10 February 2023 / Published: 14 February 2023
(This article belongs to the Section Advanced Manufacturing)

Abstract

:
The surface accuracy and quality of the mirror blank determine the performance of the optical mirror after coating; therefore, it is crucial to seek a simple and effective method for mirror blank processing. The gas jet forming provides a new idea, which employs a gas jet to impinge on a liquid pool, forms a specific curved surface and solidifies it. However, due to the interface instability that occurred with a specific range of jet velocity, periodical fluctuations appear on the interface and affect the forming of the mirror blank. In this study, the amplitude and transfer period of surface waves in the air gas/dimethyl silicone oil system are taken as the research objects. After conducting orthogonal experiments, this study uses a high-speed camera to record the generation of the surface wave and the fluctuation of the gas–liquid interface during its transfer. Subsequently, this study analyses the influences of jet velocity and viscosity of dimethyl silicone oil on the amplitude and transfer period of the surface wave. In the following experiments, multiple groups of parameters were selected in the range of jet velocity of 11~13 m/s and dimethyl silicone oil viscosity of 500~2000 Pa·s. This study measures the interface morphology with different parameters using the method of image recognition. Finally, using the measured data, this study establishes the calculation model of surface wave amplitude and transfer period, realizing the study of the characteristics of surface waves on the unstable interface. This research can be used to enhance the forming accuracy of the gas jet-forming method.

1. Introduction

Mirror blank is the substrate of the optical mirror coating [1]. Its shape precision and surface quality determine the optical properties of the coated mirror [2]. Nowadays, the primary processing methods of mirror blank include material removal [3], moulding and spin casting. The method of material removal mainly employs grinding and polishing to process the mirror surface, which entails the shortcomings of a long process cycle [4], expensive processing equipment [5] and a large amount of material removal [6]. The moulding method uses the surface precision of the mould to realize the forming of glass- or resin-based mirror blanks [7], but it also possesses the disadvantages of expensive metal moulds [8], a long processing time [9], and inability to change the mirror surface shape flexibly [10]. The spin-casting method can process a specific paraboloid under the centrifugal force by applying a constant rotation speed to the glass melt [11]. However, due to the limitation of its forming principle [12], this method cannot process aspheric shapes [13]. Gas jet forming explored in this study employs a high-pressure gas jet to impinge on a solidifiable liquid pool, on which a concave surface will be formed. This surface shape can be controlled by changing the forming parameters and maintained by solidifying the liquid pool [14].
We find from the experiments that when the nozzle diameter and the nozzle height remain unchanged, periodic surface waves will appear on the liquid pool surface with the increase of gas jet velocity, resulting in interface instability and destroying the expected surface shape of the liquid pool. Our previous study shows that this phenomenon happens due to a significant difference between the densities of the two different fluids, which flow locally in parallel at different speeds. The shear action of airflow and the rate difference between the two fluids lead to the interface instability in gas jet forming [15].
The instability of the shear flow between two layers of fluids belongs to the interfacial hydrodynamics [16]. In the hydrodynamics of incompressible fluids, the transition from the calm to the wave interface is known as the Kelvin–Helmholtz (KH) instability [17,18]. Since Kelvin’s treatise in 1871, in the process of describing the viscosity and dissipation of ordinary fluids, it shows the instability of shear flow, but its correspondence with that in the ideal limit is not straightforward. A vortex sheet creates the tangential velocity discontinuity in the shear flow. In a viscous fluid, a vortex sheet is neither a stable equilibrium state nor a solution of the hydrodynamic equations [19]. In addition, another classical behaviour of the gas–liquid interface is surface waves, and the wave motion in the interface flow is also related to the stability of the gas–liquid interface [20]. However, the above research did not analyse the amplitude and transfer period of the surface wave in a liquid pool when interface instability occurred, which are essential factors affecting the surface shape.
The appearance of surface waves can cause instability in the gas–liquid interface, resulting in the poor optical performance of the mirror blank formed after curing. Therefore, research on the behaviour characteristics of surface waves is of guiding significance for subsequent research on the quality of mirror blank formation. At present, there are studies on surface waves. Miles used the Orr–Sommerfeld equation to describe the generation of surface waves [21]. Wolfe considered the stability of surface wave generation and reported that instability was due to the interaction between the wave and the gas [22]. Dogan discovered the surface wave phenomenon in the oxygen impact on the iron liquid surface [23]. According to the above reports, current surface wave-related reports focus on the interaction between the gas–liquid interface and the mechanism of surface wave generation. However, there is no research on the behaviour characteristics (amplitude, period) of surface waves in high-viscosity fluid surfaces.
Therefore, this study explores the characteristics of surface waves on the unstable interface by conducting orthogonal experiments. In the experiments, we have employed a gas jet to impinge the pool of dimethyl silicone oil at room temperature and used a high-speed camera to capture the formation of the surface waves to reveal its transfer period on the unstable interface. We have also examined the periodic deformation of the wavy interface during the fluctuations by measuring the change of surface wave amplitude. Additionally, by adjusting the jet velocity in the range of 11~13 m/s and adjusting the viscosity of dimethyl silicone oil in the range of 500~2000 Pa·s, we have analysed the influence of the jet velocity and the fluid viscosity on the amplitude and the transfer period of surface waves.

2. Mechanism of the Gas–Liquid Interface Instability in Gas Jet Forming

2.1. The Interface Instability

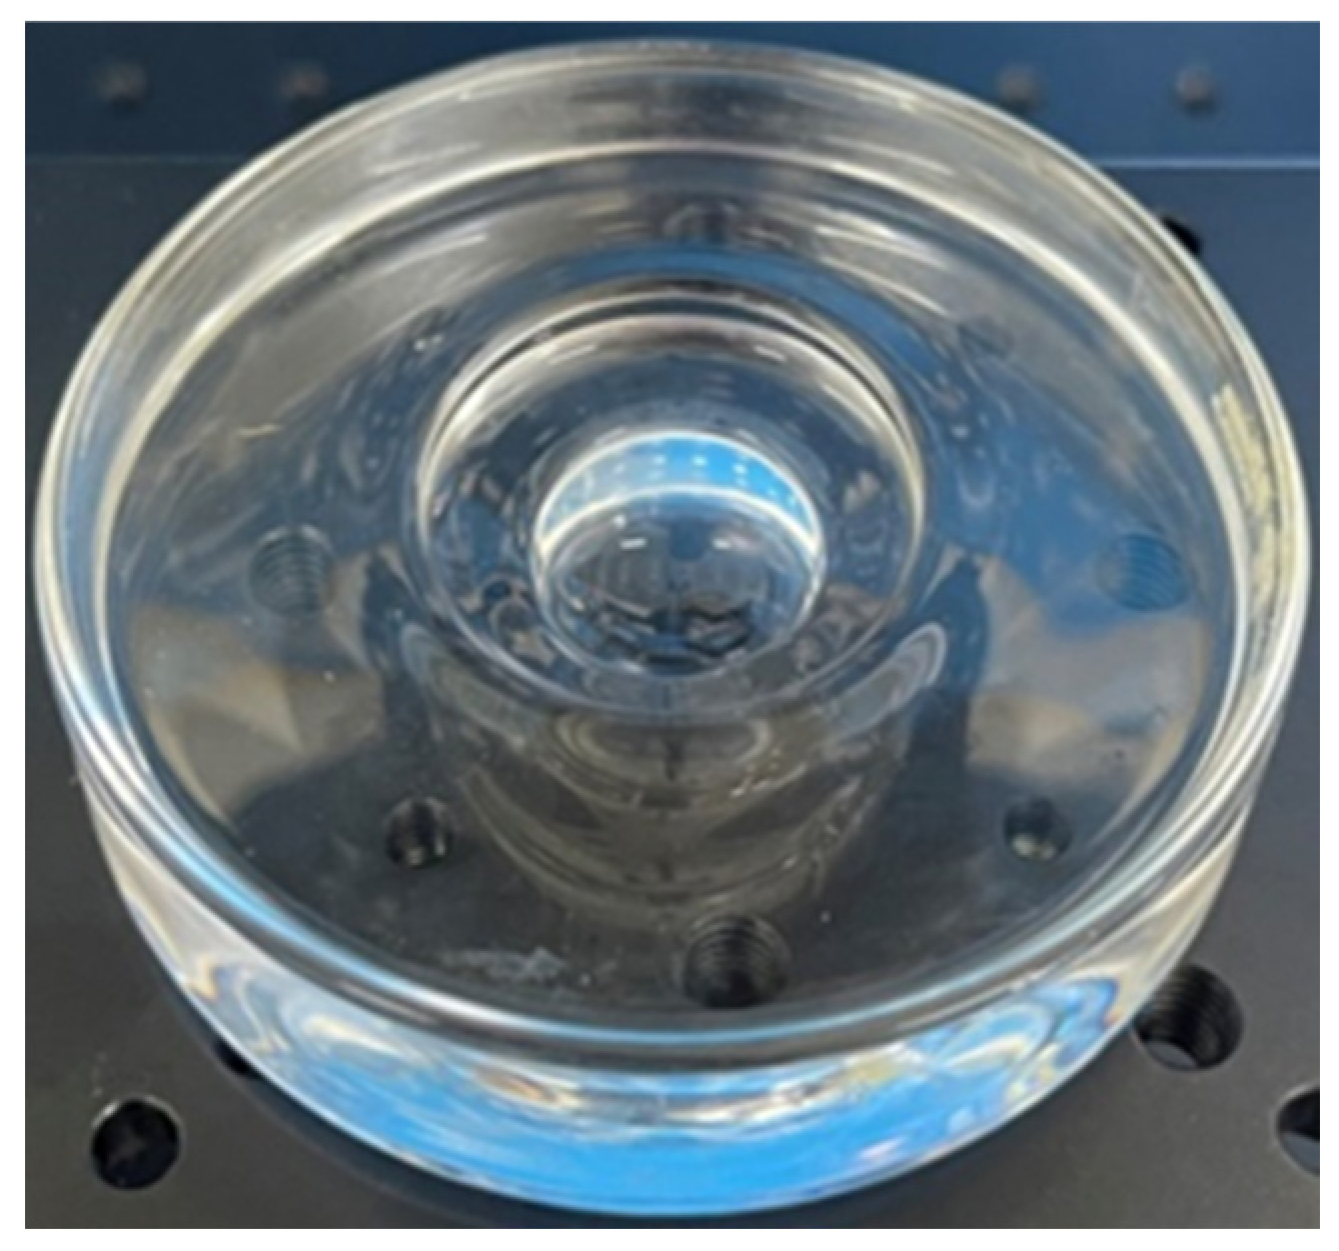
The process of gas jet forming for the non-spherical mirror blank in this article is as follows: Firstly, the desired mirror blank contour is obtained by adjusting the nozzle height and initial velocity of the jet; then, the combination of catalysation and UV exposure solidifies the epoxy resin pool under the action of the airflow; finally, the mould is removed from the solidified epoxy resin to obtain the non-spherical mirror blank. The gas jet-forming process is divided into four stages: material standing, jet forming, pool solidification, and demoulding [24]. In the gas jet-forming experiment, the gas jet impinged on the dimethyl silicone oil pool surface with a viscosity of 500 Pa·s at a speed of 10 m/s at room temperature. After impinging for 52 s, a stable concave surface was formed on the liquid pool, as shown in Figure 1.
Without changing other experimental parameters, when the gas velocity was increased to 11.76 m/s, the stable interface of the liquid surface was destroyed. At this point, a surface wave gradually formed on the wall of the concave surface and propagated periodically along the radial direction of the glass mould (see in Figure 2).
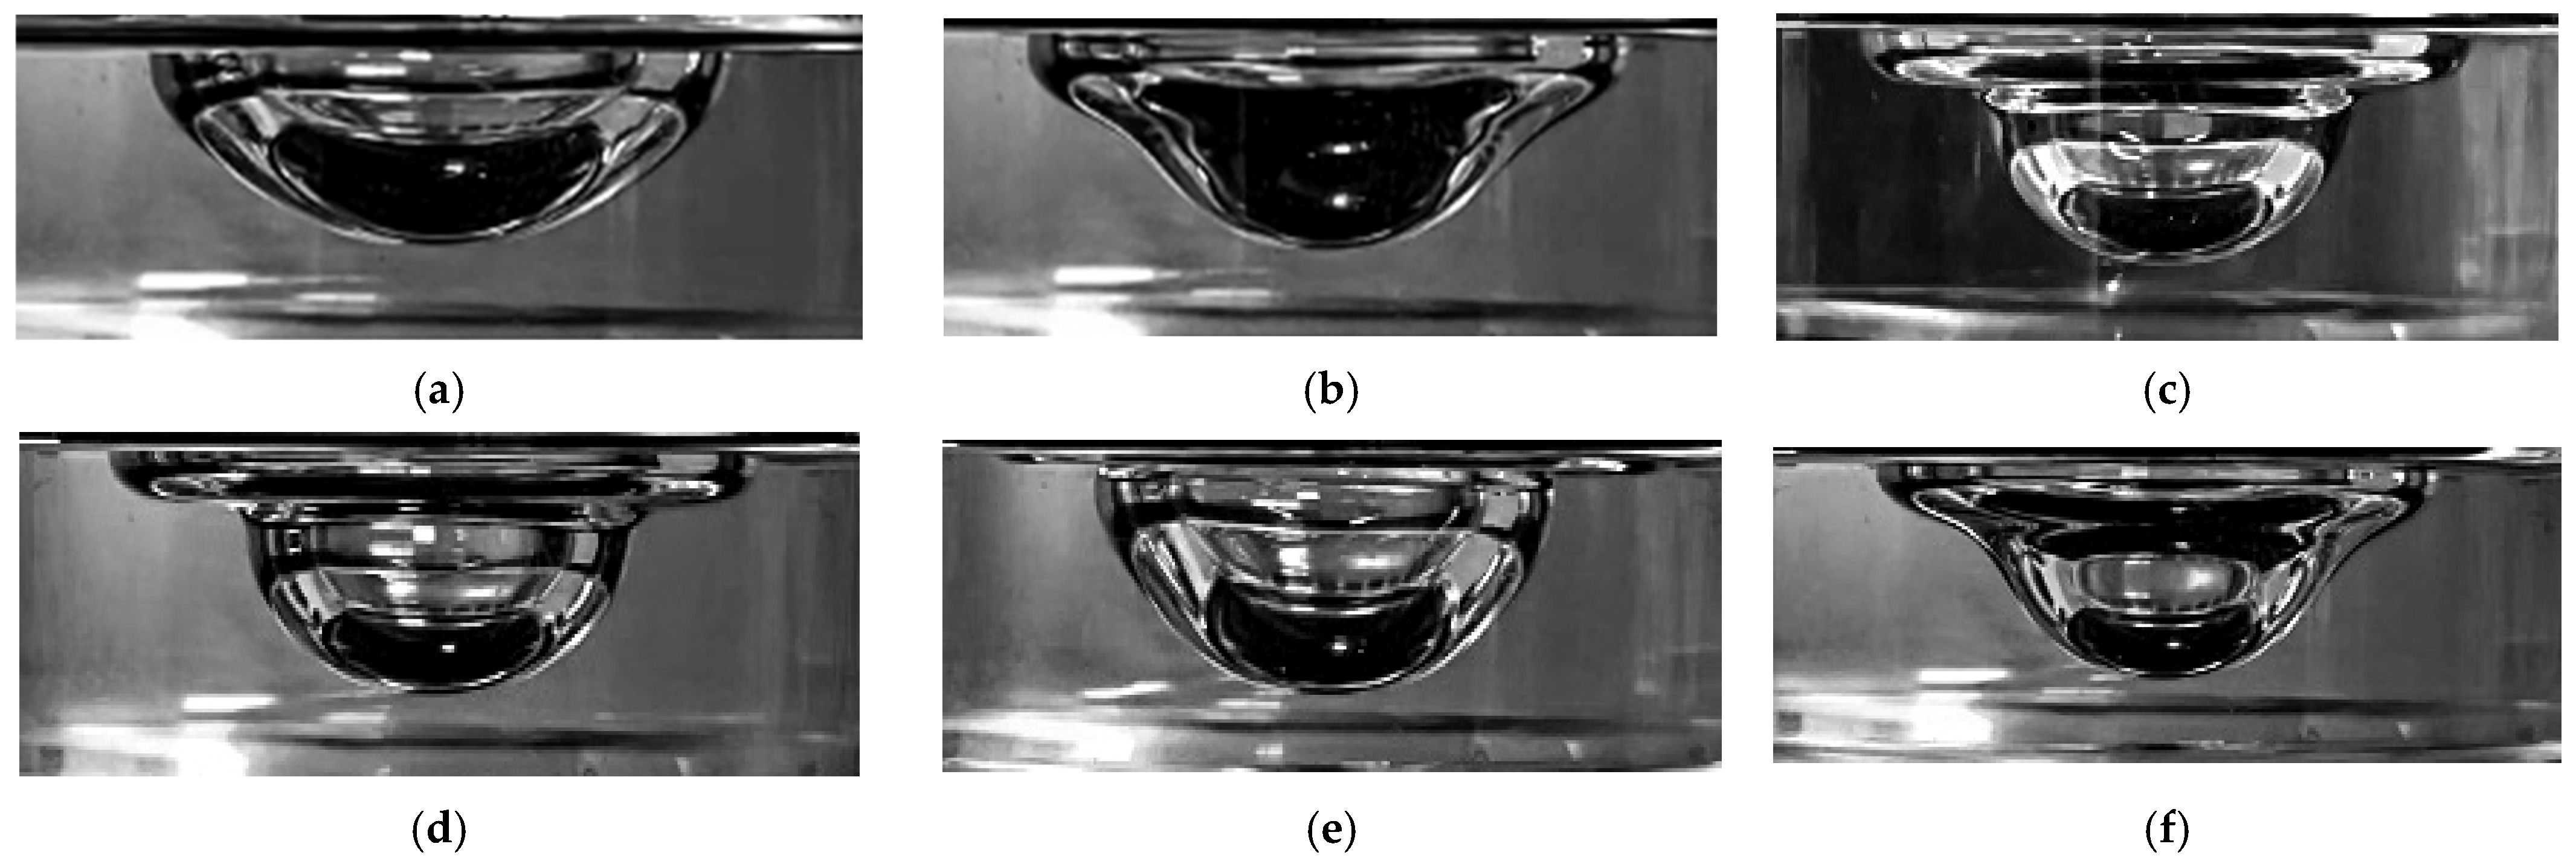
We employed a high-speed camera type Phantom M320S equipped with a Nikon 50 mm lens, which shoots 1600 frames per second to photograph the interface instability process to study this phenomenon. Figure 3 shows the interface shapes at different moments when the dimethyl silicone oil pool with a viscosity of 500 Pa·s impinged via the gas jet at a speed of 11.76 m/s. Specifically, when the gas jet impinged on the liquid pool for 42 s, a stable concave surface was formed on the pool surface (a). When the gas jet continuously impinged on the liquid pool for 62 s, the stable interface was damaged, the instability phenomenon began to appear (b), and the amplitude of the surface wave increased gradually (c). After that, the surface wave amplitude of the unstable interface increased to the maximum when the gas jet impinged for 113 s (d). When impinging for 128 s, the surface wave spread out and gradually disappeared (e). However, with the continuous impinging of the gas jet on the liquid pool, the unstable surface wave appeared again after 139 s (f). The periodic appearance of this phenomenon represents the process through which the gas–liquid interface changes from a steady state to unstable states under the impinging of the gas jet.

2.2. Mechanism of the Instability

According to the Kelvin–Helmholtz instability, two fluids with uniform texture but different densities move relative to each other and parallel to the horizontal interface, as shown in Figure 4. According to the theory of small perturbations in the stability theory of fluid motion, when the surface tension σ at the interface is not considered, the interface is unstable when ρ1 < ρ2, regardless of the value of the velocity difference U1U2 between the two fluids. When the surface tension σ and the gravitational acceleration g are taken into account, the fluid interface motion is destabilised when the velocity difference U1U2 of the two fluids satisfies Equation (1) [25].
U 1 U 2 2 > 2 ρ 1 + ρ 2 ρ 1 ρ 2 σ g ρ 1 + ρ 2

3. The Gas Jet-Forming Experiment

3.1. Experimental Device

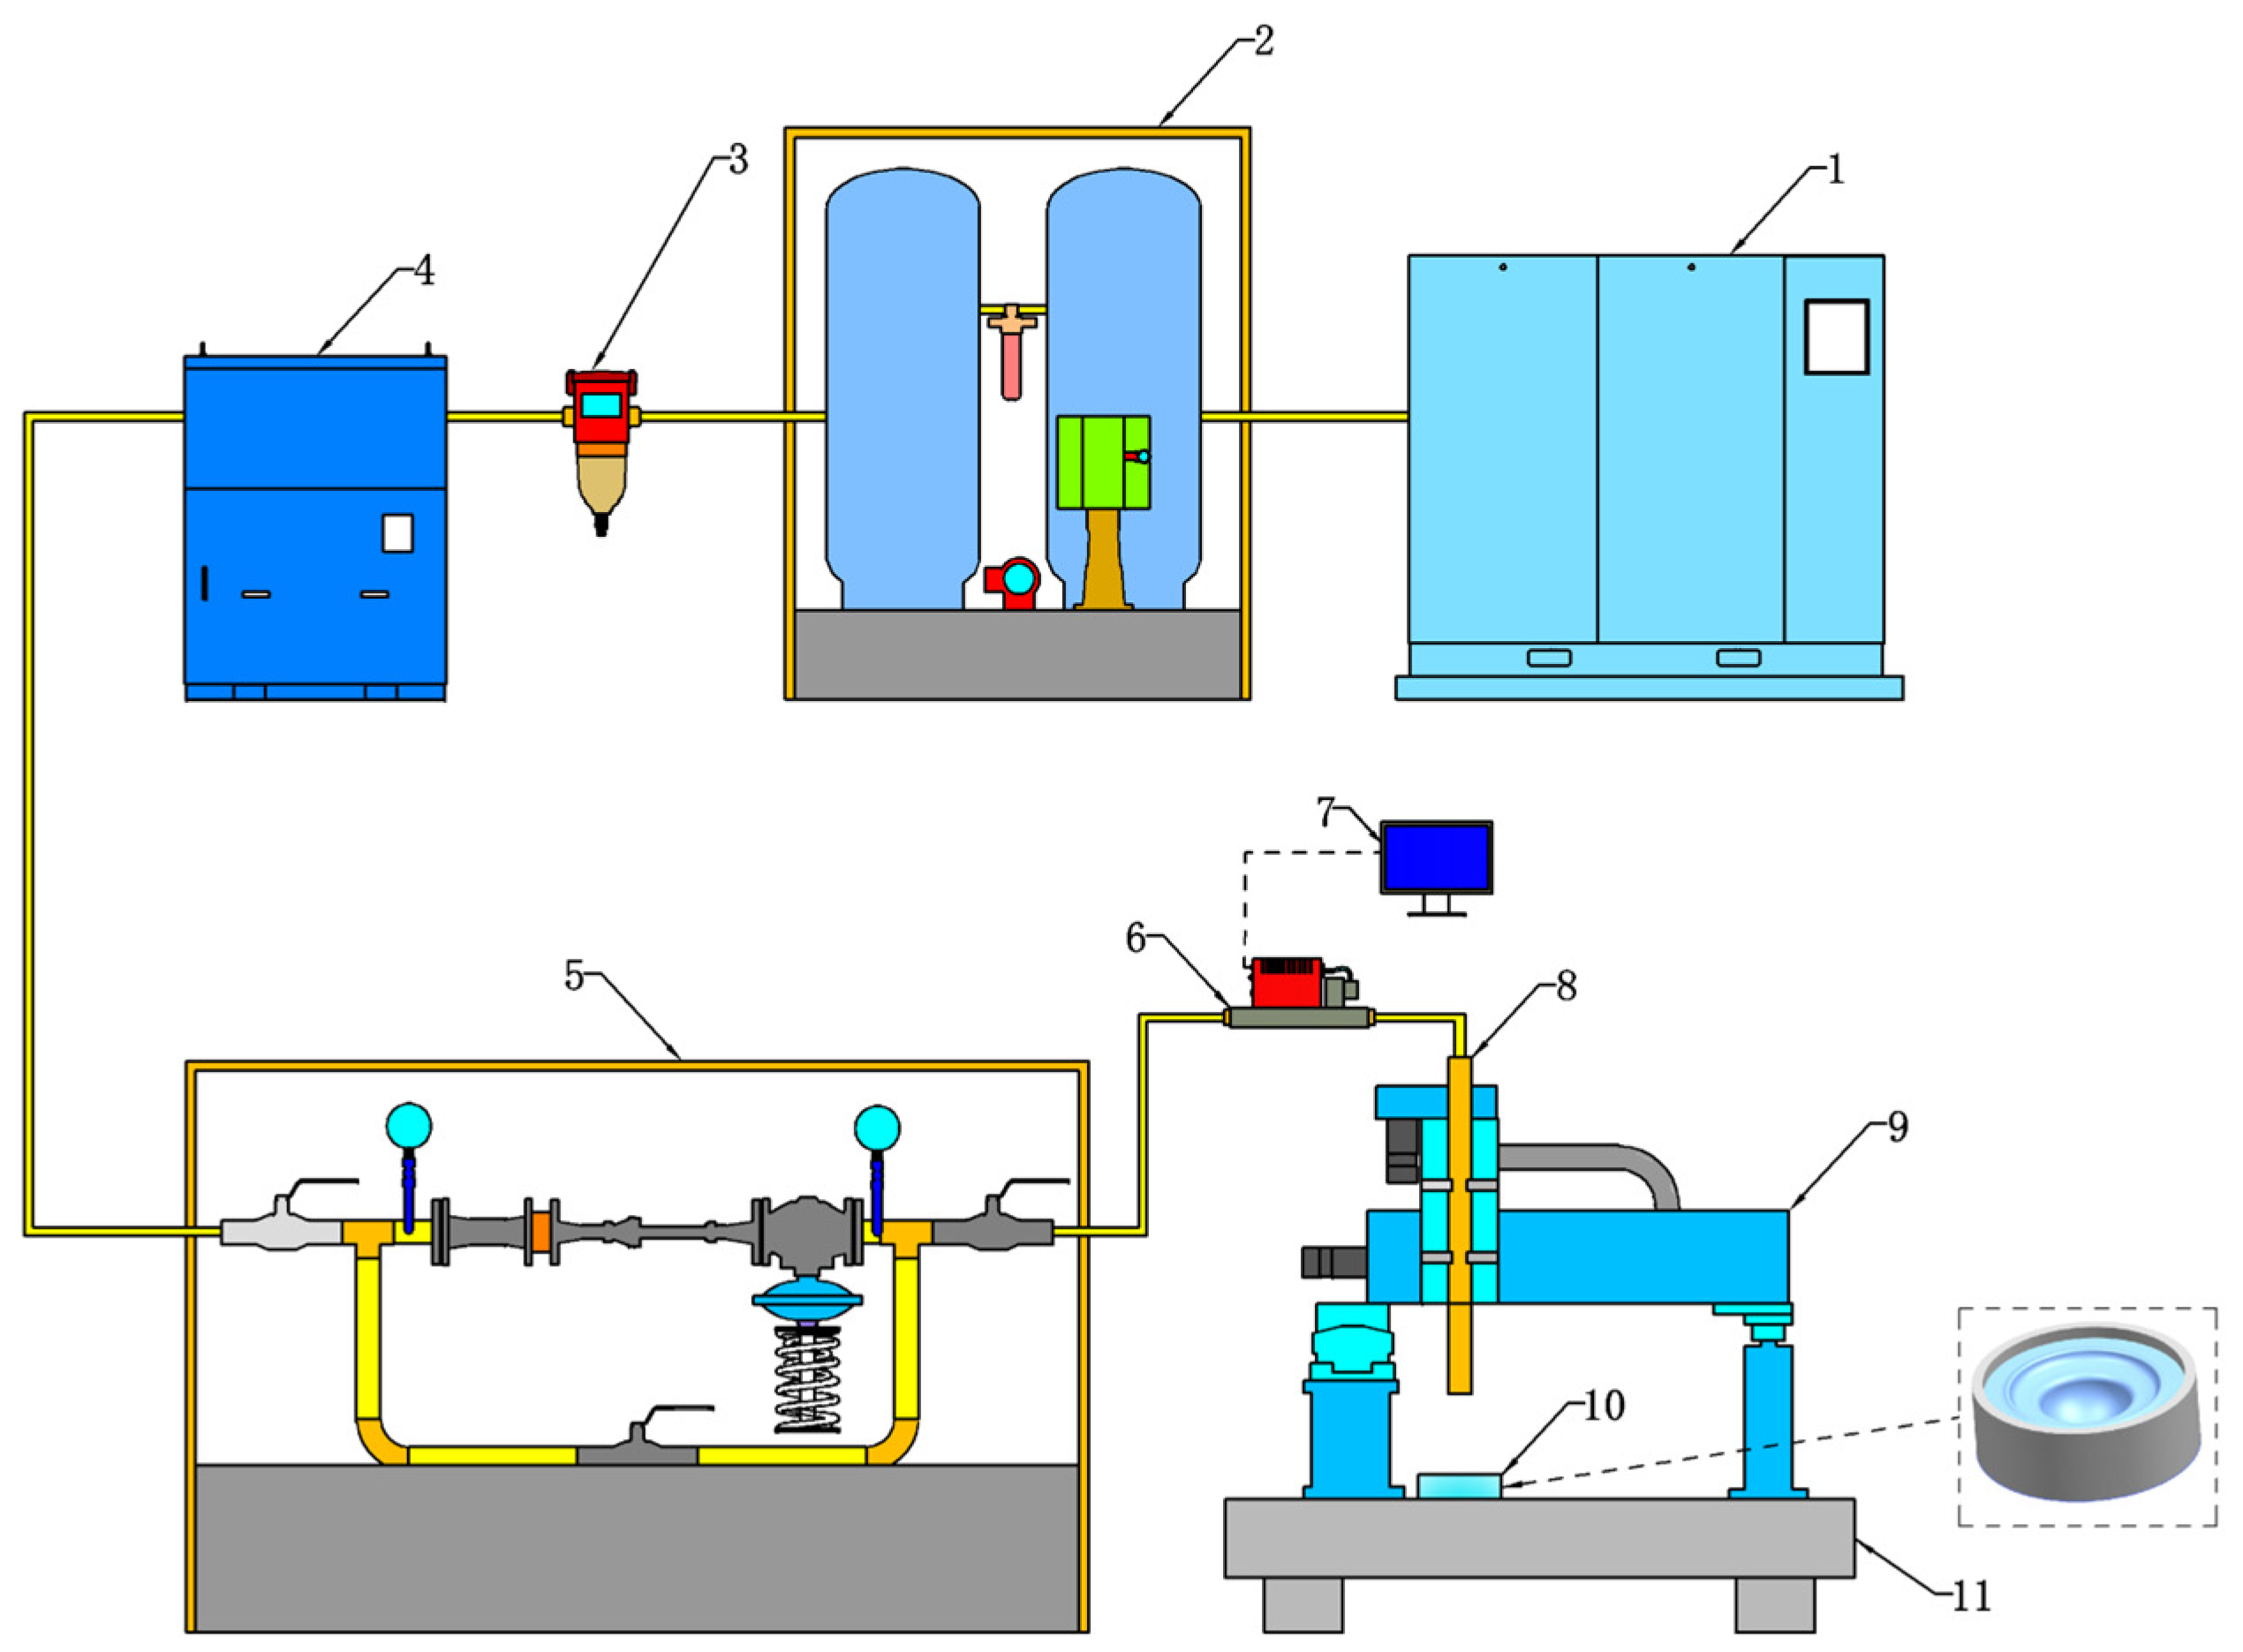
The experiment device is shown in Figure 5. The experimental process can be directly observed through the transparent glass mould and recorded using a high-speed camera.

3.2. Experimental Process

Epoxy resin has the characteristic of gradually solidifying over time, meaning its viscosity increases over time. Therefore, as a material for gas jet moulding, it ensures that the shape formed by the gas jet can be preserved through the solidification of the epoxy resin. This study aims to investigate the fluctuating characteristics of surface waves at the gas–liquid interface and analyse the influence of gas jet velocity and fluid viscosity on the amplitude of the unstable interfacial surface waves and their transfer periods during the interface instability. However, the surface wave phenomenon in this research is a dynamic behaviour, and the gradual solidification characteristic of the epoxy resin causes us to be unable to make a stable observation of the surface wave for a long time. Therefore, in this study, we have selected dimethyl silicone oil, which has similar physical properties, to replace the epoxy resin for the blowing experiments. A comparison of the material properties of dimethyl silicone oil (MaclinR® CAS No.: 63148-62-9; MDL No.: MFCD00132673) and epoxy resin is shown in the Table 1.
Experiments were conducted at the temperature of 26 ± 1 °C and the ambient pressure of 101.3 kPa, and used four kinds of dimethyl silicone oil with different viscosities listed in Table 2. The shape and size of the glass mould remained unchanged, and the volumes of dimethyl silicone oil (Maclin®) used in each experiment were guaranteed to be the same.
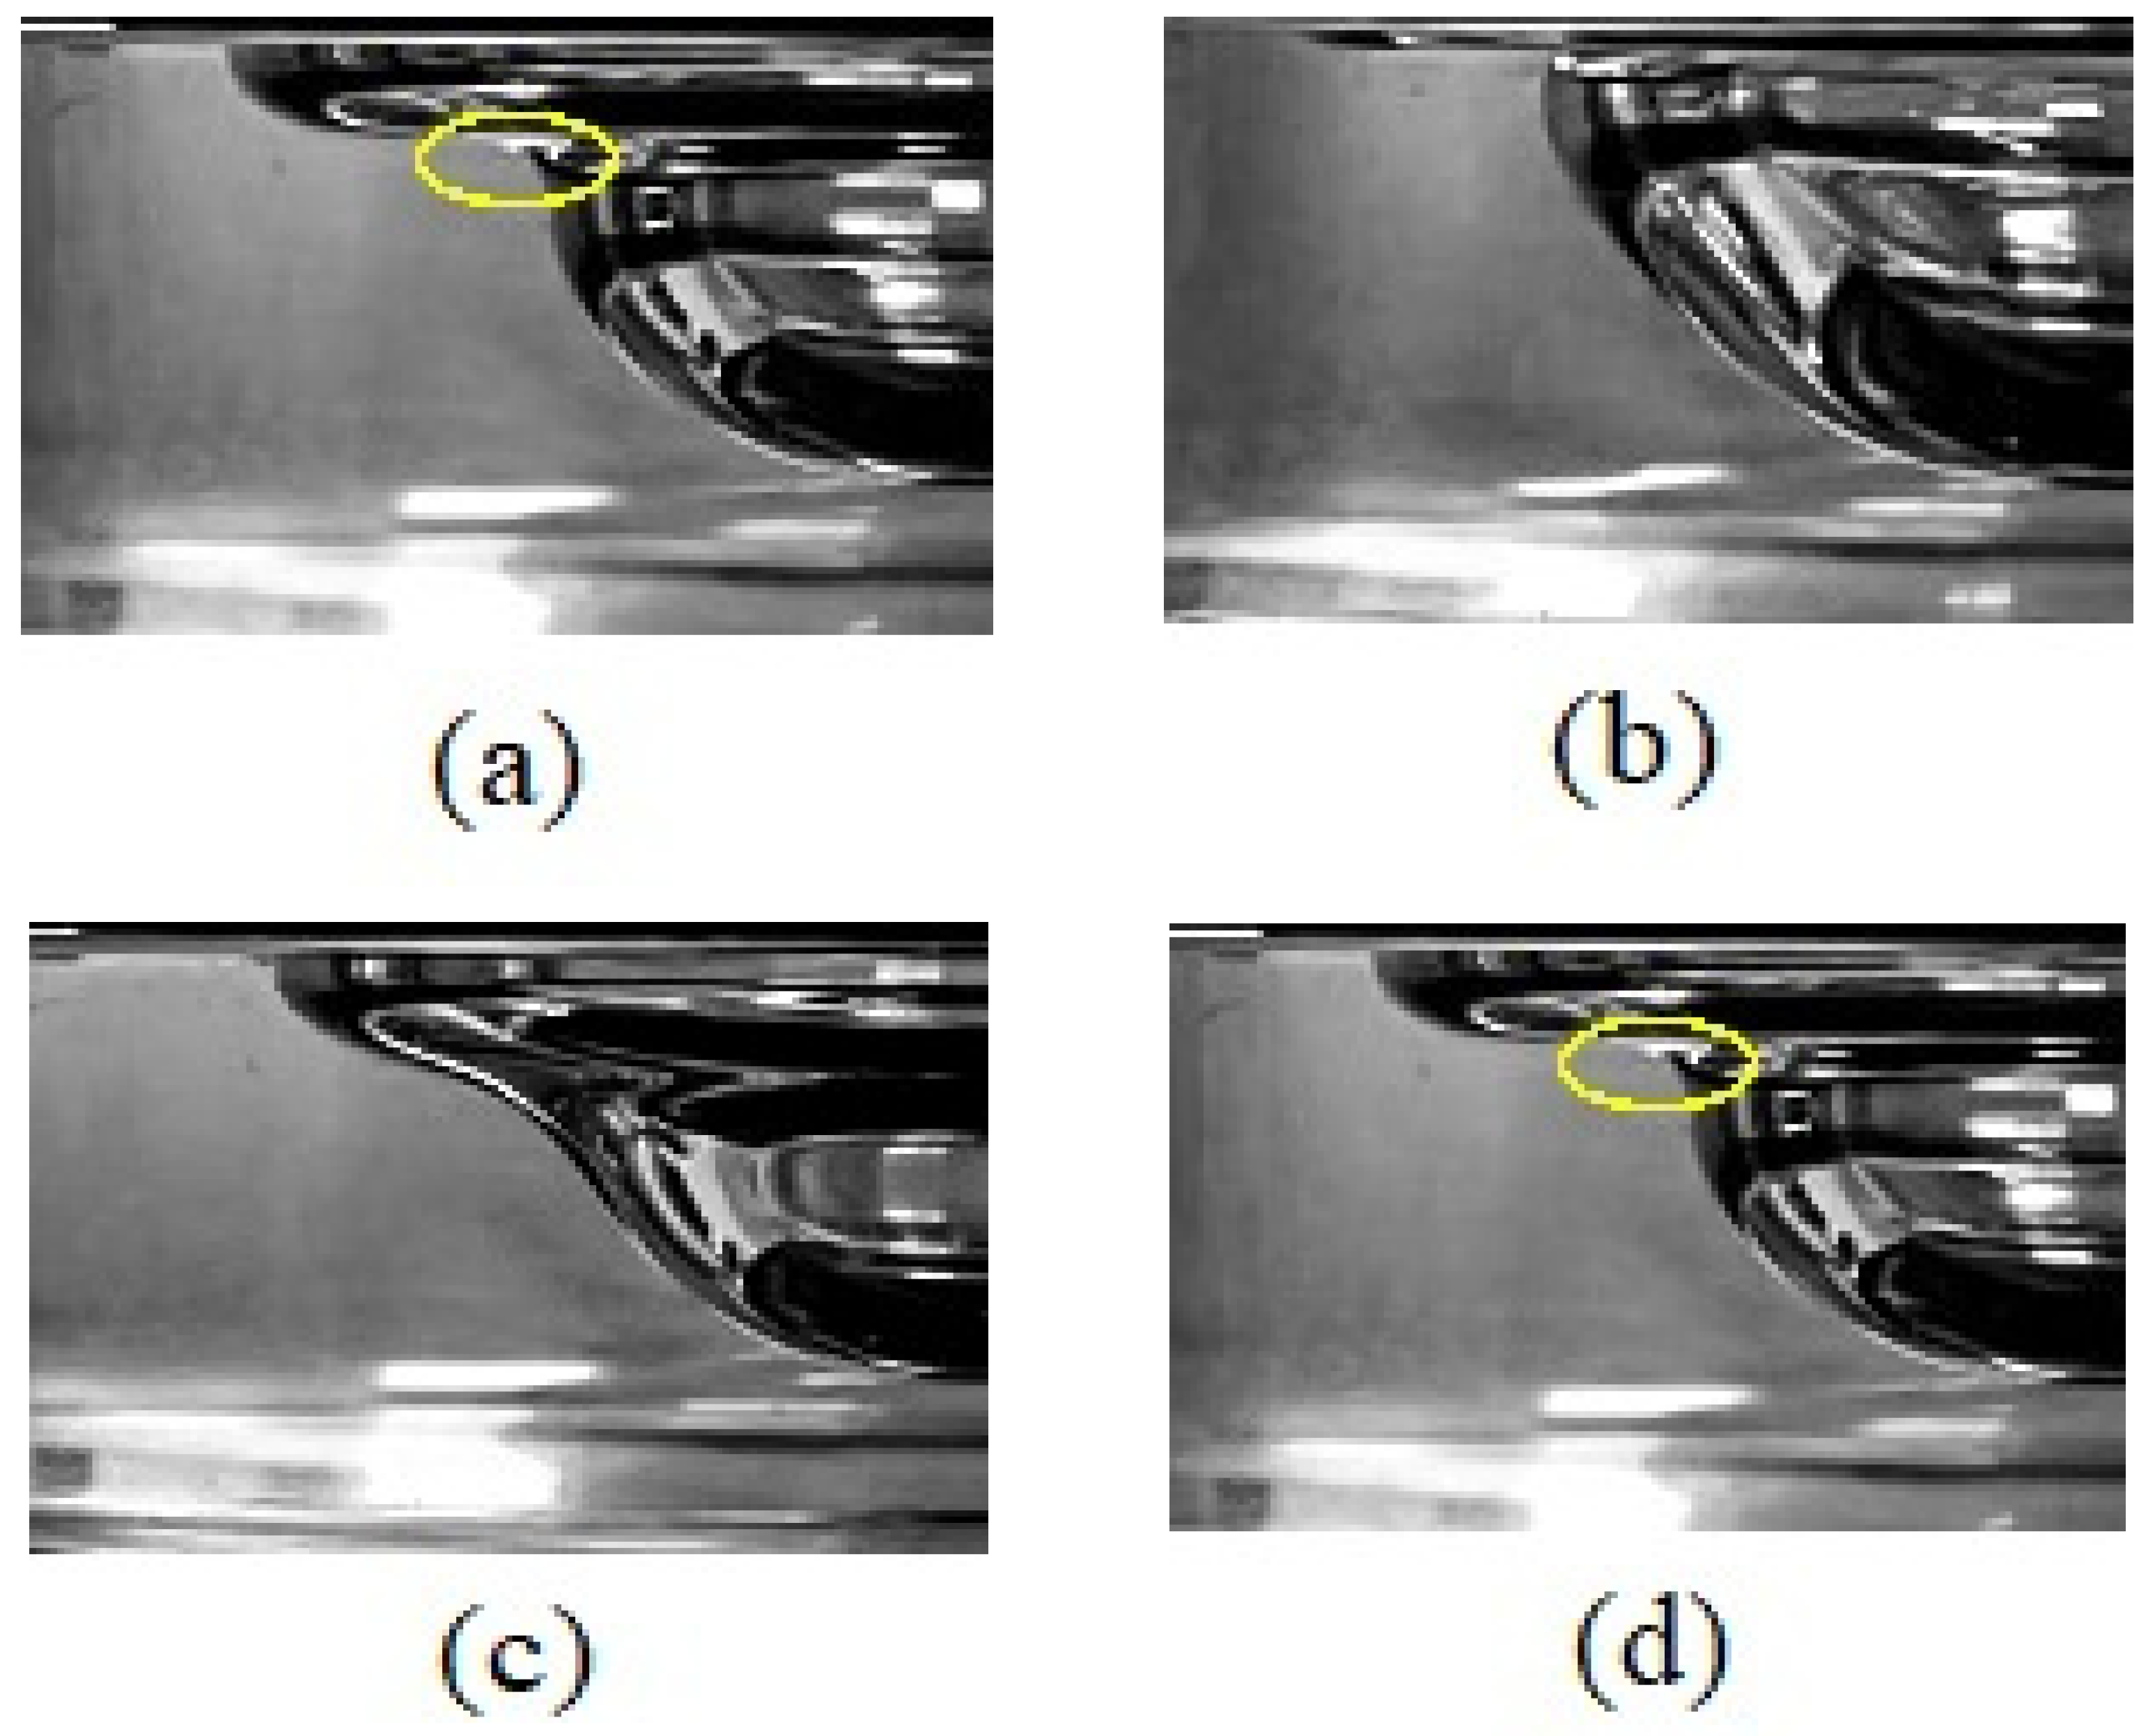
We place the glass mould on a precision lifting table and position it directly beneath the nozzle, controlling the distance between the nozzle and the liquid surface to 10 mm by adjusting the height of the lifting table. The high-pressure gas jet is released through the air valve, and its flow rate can be controlled through the electromagnetic valve. Experimental images captured using a high-speed camera recorded surface waves’ time and transmission process (shown in Figure 6). The back-and-forth swing of the gas–liquid interface formed a surface wave (marked by a yellow circle in Figure 6a), which continued to travel away along with the interface. As time went on, surface waves were continuously generated. The transfer period of the surface wave can be obtained by collecting the time interval when it reached the same position (the time interval between Figure 6a,d).
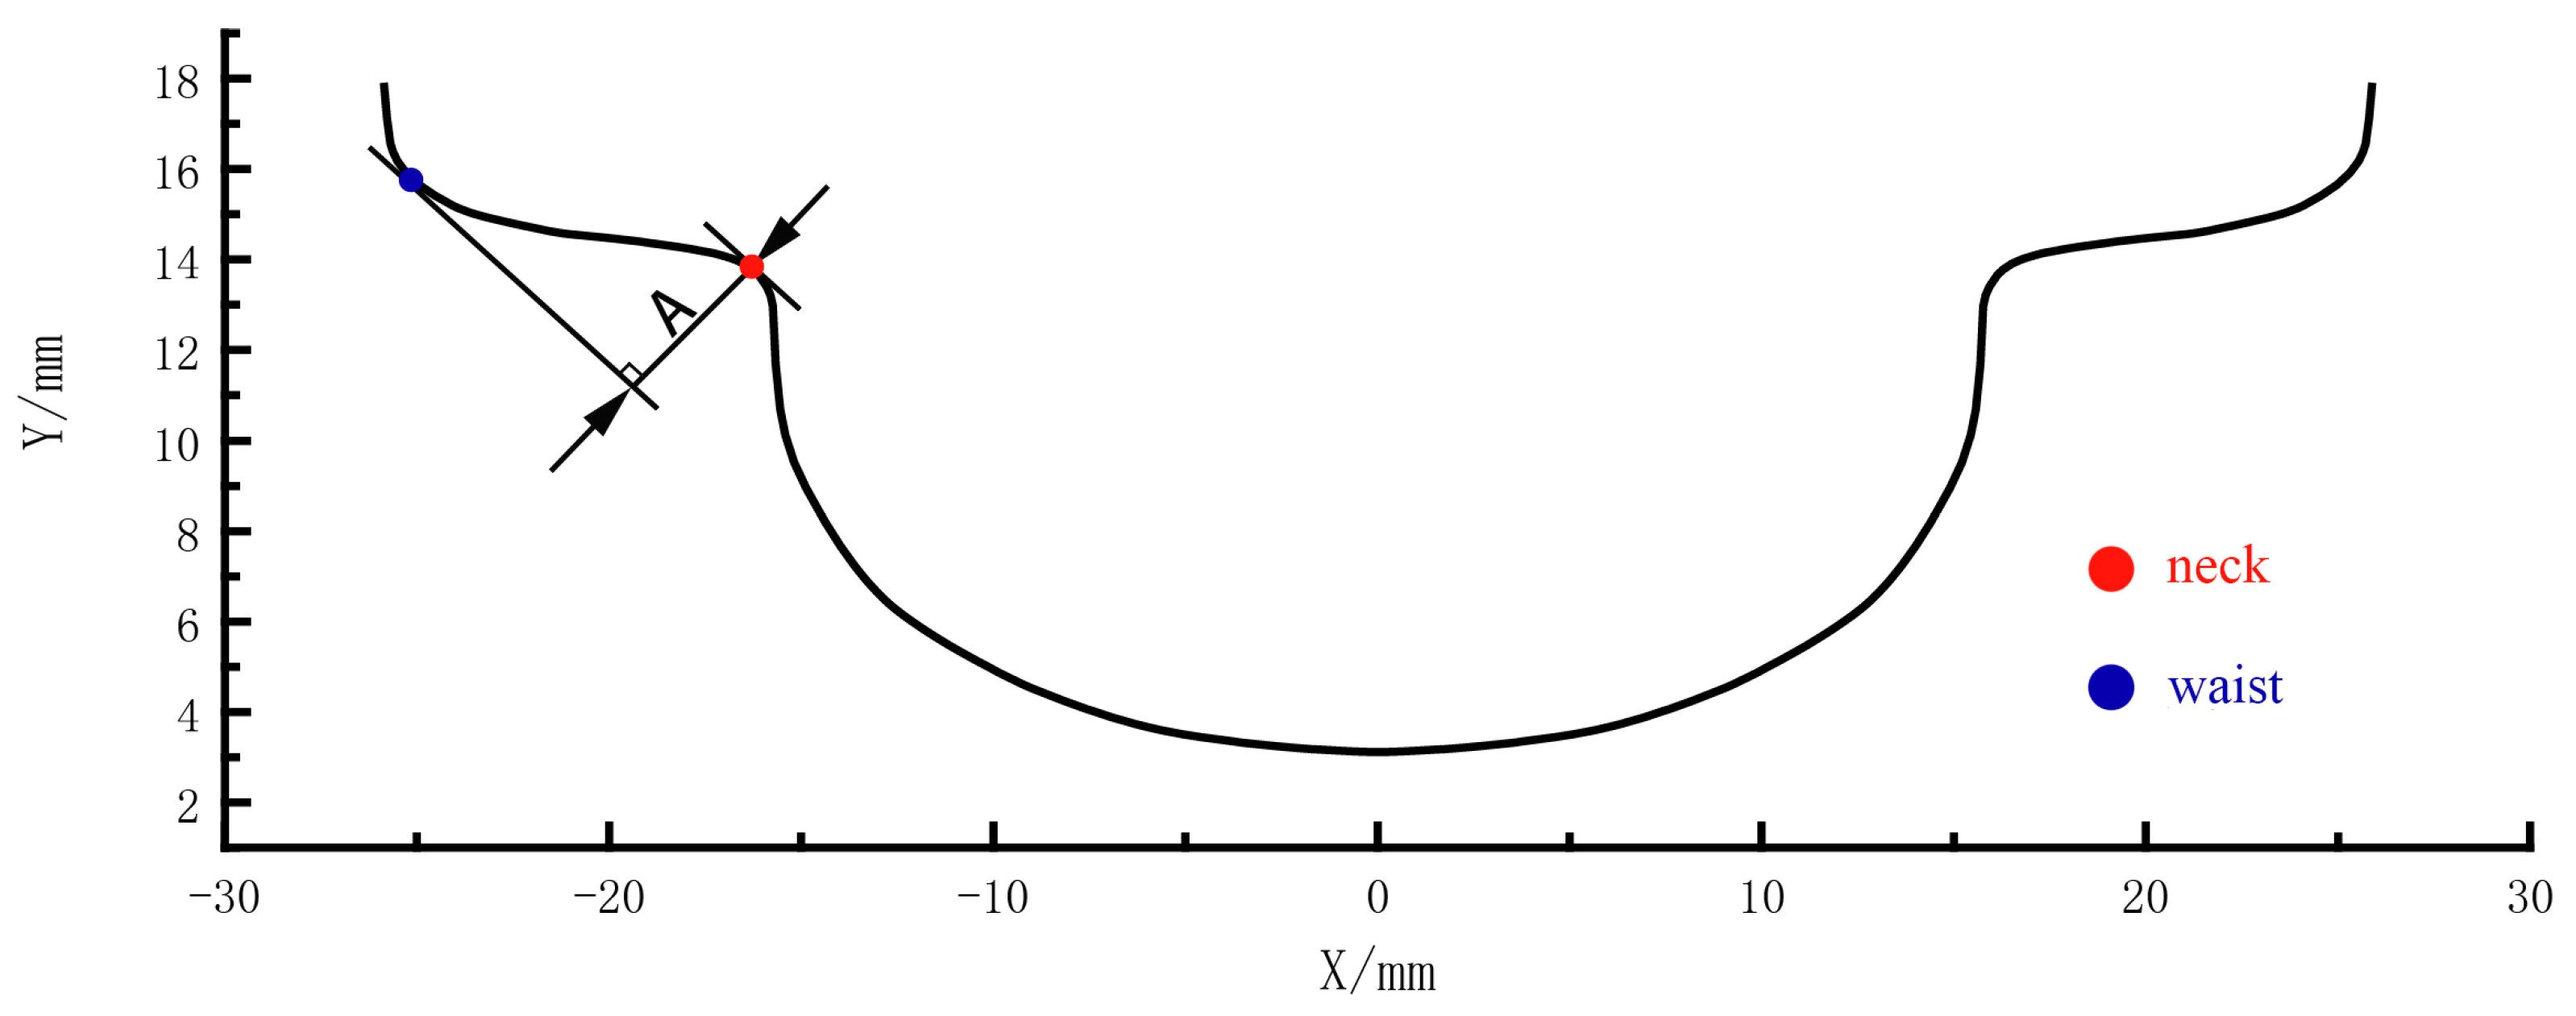
As shown in Figure 7, the waist and neck of the S-shaped interface are regarded as the wave crest and the wave trough. Using the image recognition programme, we marked the number of pixels corresponding to the 1 mm scale line in the figure. After connecting these pixels with lines, these pixels are removed and only the peaks and troughs are retained. After calculating and scaling these numbers, the vertical distance between the tangent lines of the wave crest and trough was obtained, and its absolute value is surface wave amplitude A.

3.3. Experiment Parameters

The experiment mainly studies the influence of the gas jet velocity and the dimethyl silicone oil viscosity on the amplitude and transfer period of the unstable surface wave when the dimethyl silicone oil is impinged using the gas jet perpendicular to the liquid surface. The critical equipment parameters are shown in Table 3.
Therefore, the parameters of jet velocity v = 11 m/s, 11.5 m/s, 12.5 m/s and 13 m/s and viscosity of dimethyl silicone oil η = 500 Pa·s, 1000 Pa·s, 1500 Pa·s and 2000 Pa·s were chosen to be combined in pairs for the experiments. The jet velocity of the gas can be regulated through a gas jet controller. The viscosity of dimethyl siloxane can be customized.
We conducted a total of 20 sets of experiments, and the experimental parameters are shown in Table 4.

3.4. Measuring Method

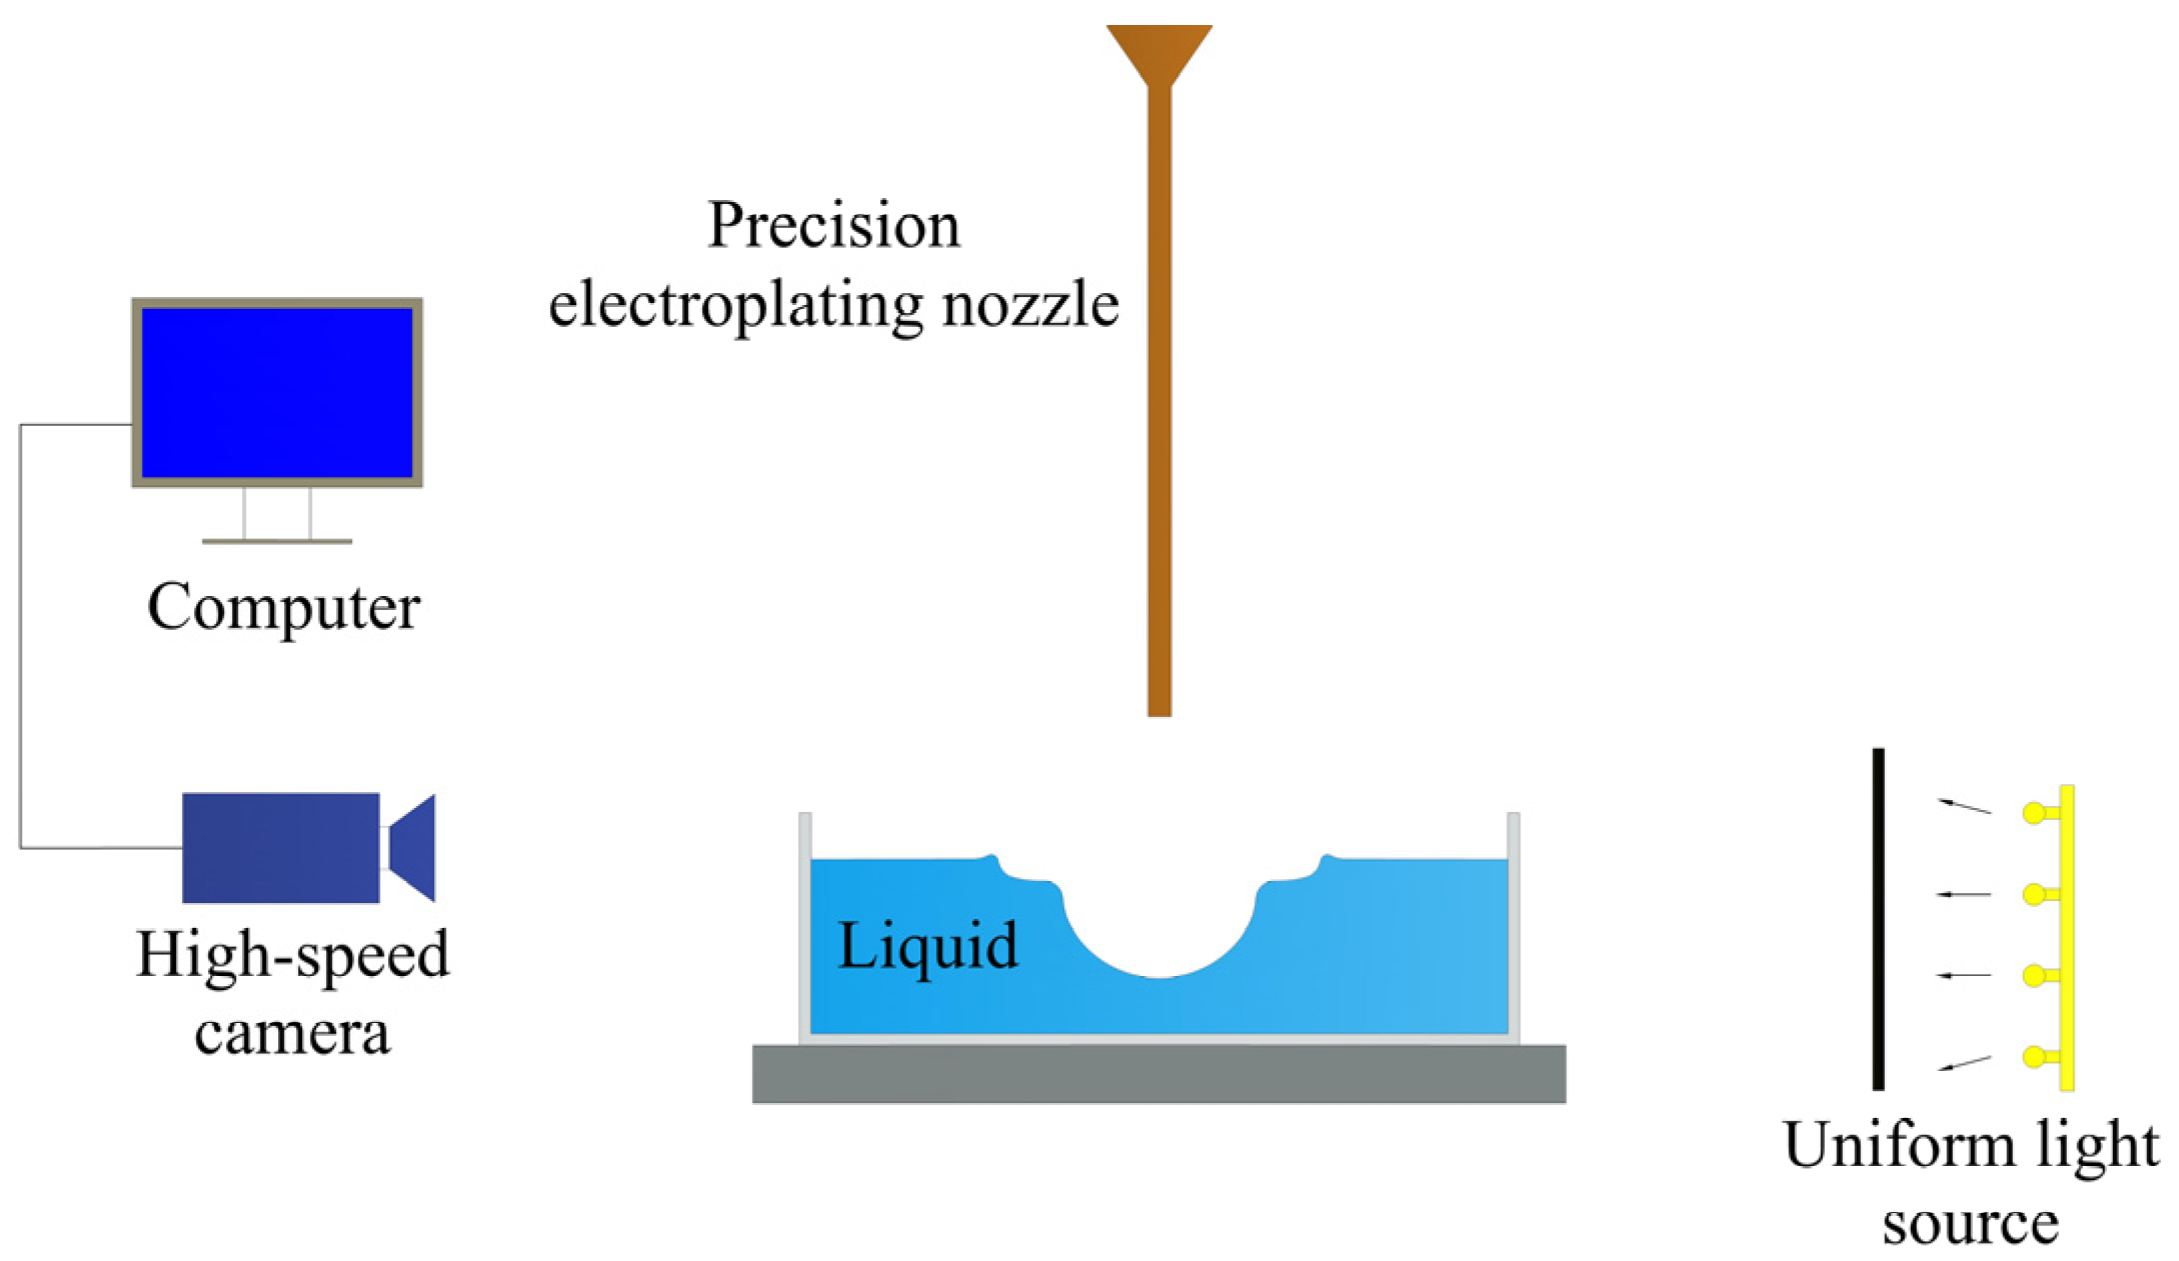
Dimethyl siloxane remains liquid throughout the experiment and continuous gas output from the precision electroplating nozzle is required into the liquid pool; thus, the surface contour of the liquid pool cannot be detected using a surface profilometer. Therefore, the device shown in Figure 8 was used to measure the interface shape of the liquid pool in this study. This device employs a high-speed camera to record the motion state of the unstable surface waves and processes the video into images frame by frame. Then, these images were processed using an image recognition programme to obtain the geometric coordinates of the surface contour.
The surface coordinates of the gas–liquid interface is obtained using the image recognition method. Specifically, each pixel in the image has its corresponding RGB value. A rectangular coordinate system was firstly established by taking the pixel in the bottom left corner of each image as the origin of the coordinate. Then, specific pixel points of the air-liquid interface are marked, and the RGB values of the specific pixels of the air–liquid interface are assigned. Finally, these pixels were extracted, and the corresponding coordinate points were drawn into curves for output.
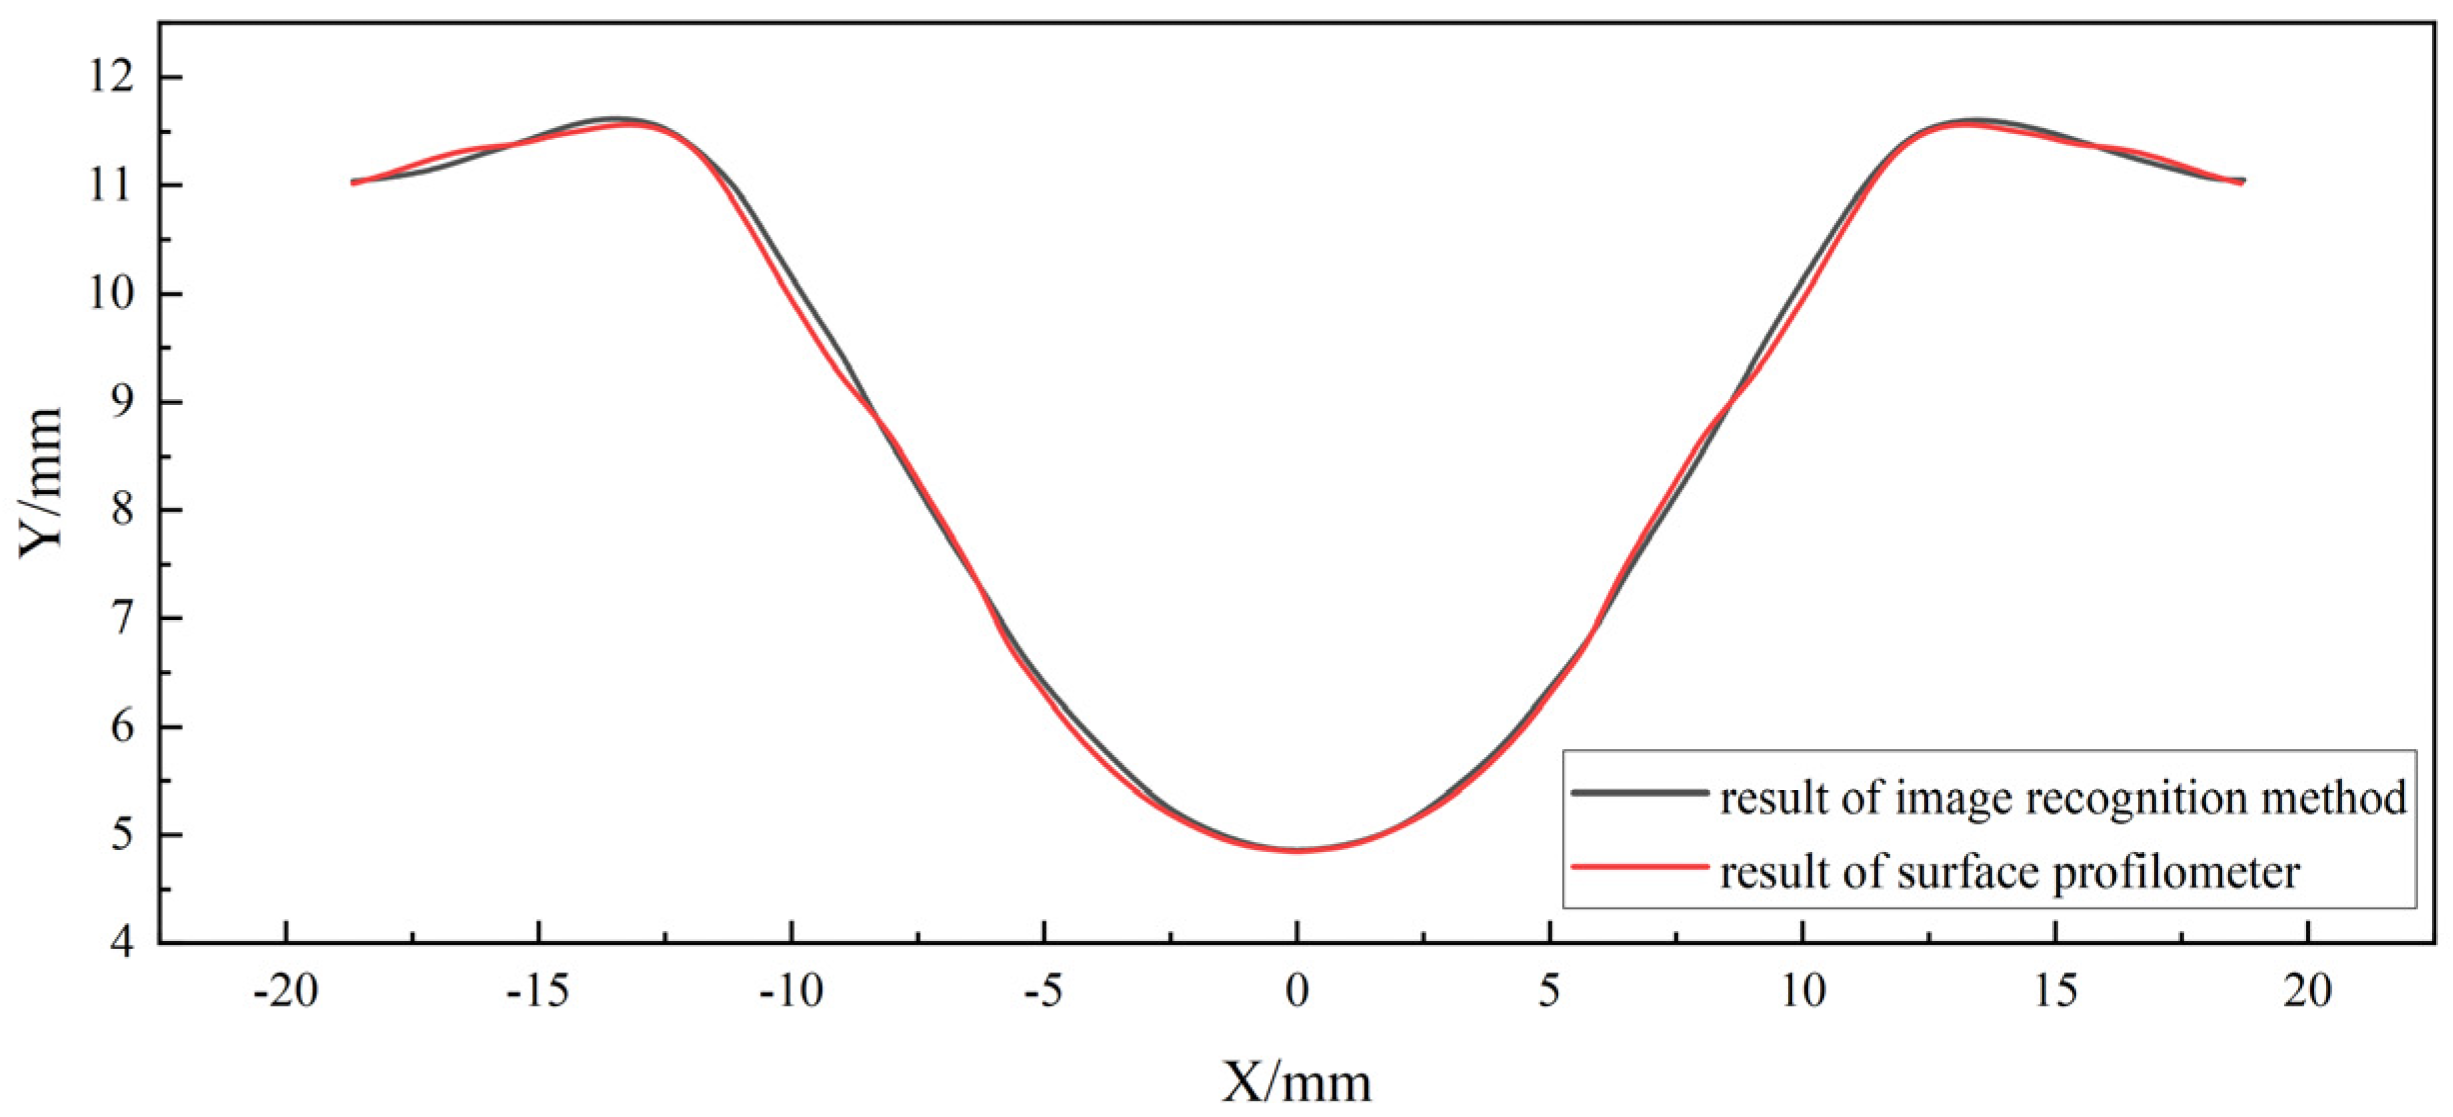
To verify the effectiveness of this measurement method, we adopted the epoxy resin to conduct another gas jet forming experiment. Due to the ability of epoxy resin to cure, the curved surface formed by the gas jet can be measured using a surface profilometer after curing. The surface shape of the solidified epoxy resin was measured by image recognition and surface profilometer, respectively, and the data measured by these two methods were compared. The comparison results are shown in Figure 9.
In contrast, the maximum deviation between the surface shape measurement results obtained via image recognition and the surface profilometer is 0.0006 mm. Therefore, it is concluded that image recognition can be used to obtain surface coordinates of the unstable interface and analyse the surface wave’s motion characteristics.

4. Analysis of Experiment Results

4.1. Experiment Results

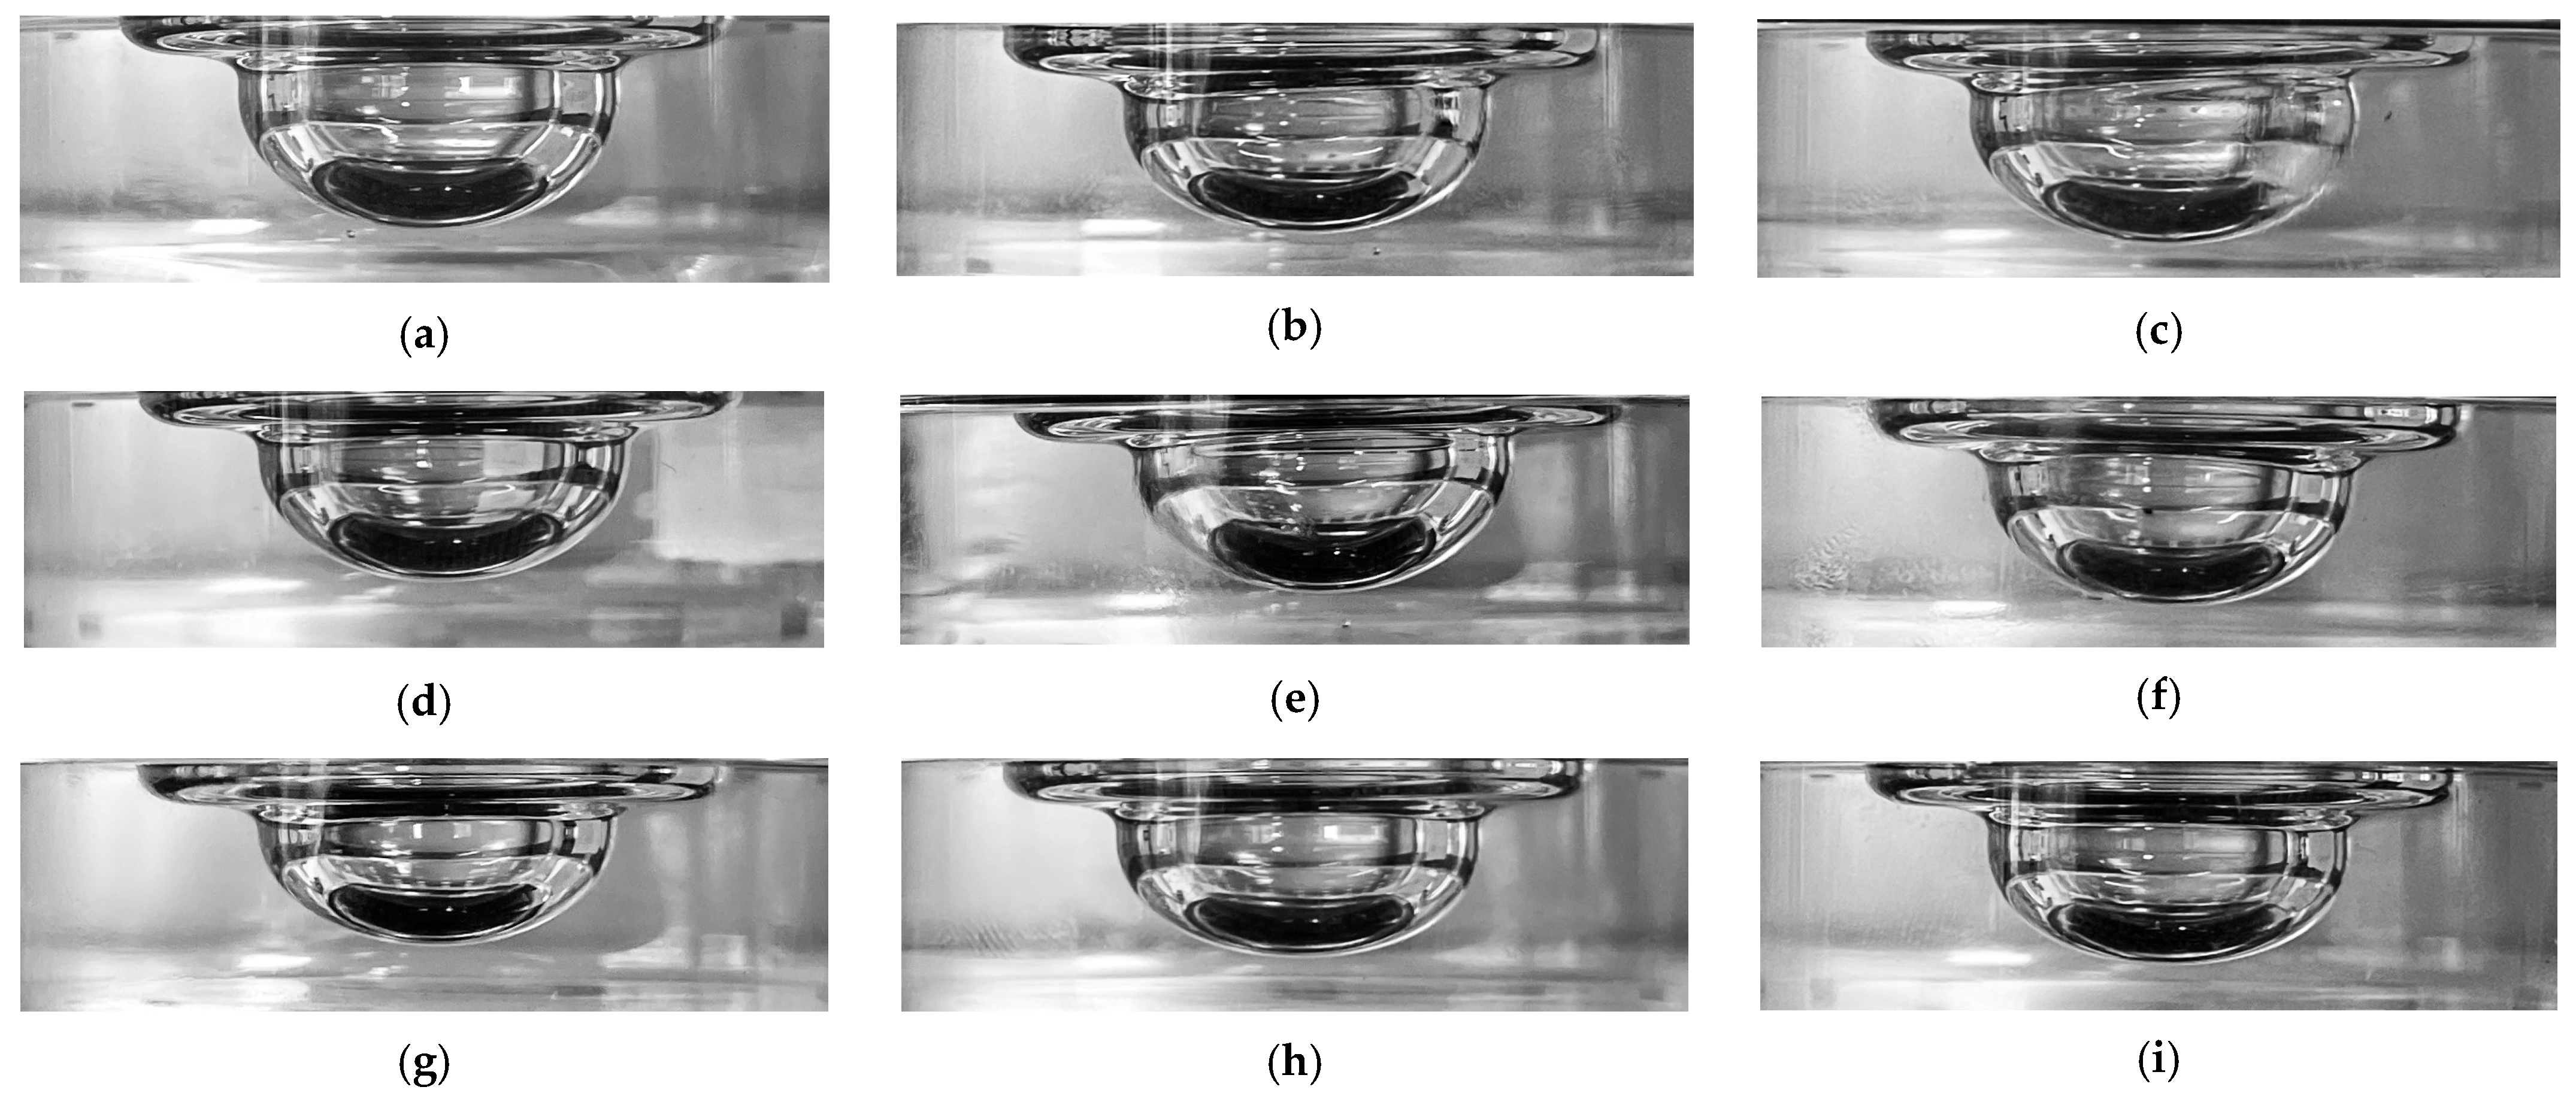
Figure 10 shows the images of some experimental samples taken by the high-speed camera when the surface wave amplitude of the unstable interface reaches its peak. In the images, v represents the jet velocity, and η represents the dimethyl silicone oil viscosity.

4.2. Influence of the Gas Jet Velocity and the Dimethyl Silicone Oil Viscosity on the Amplitude

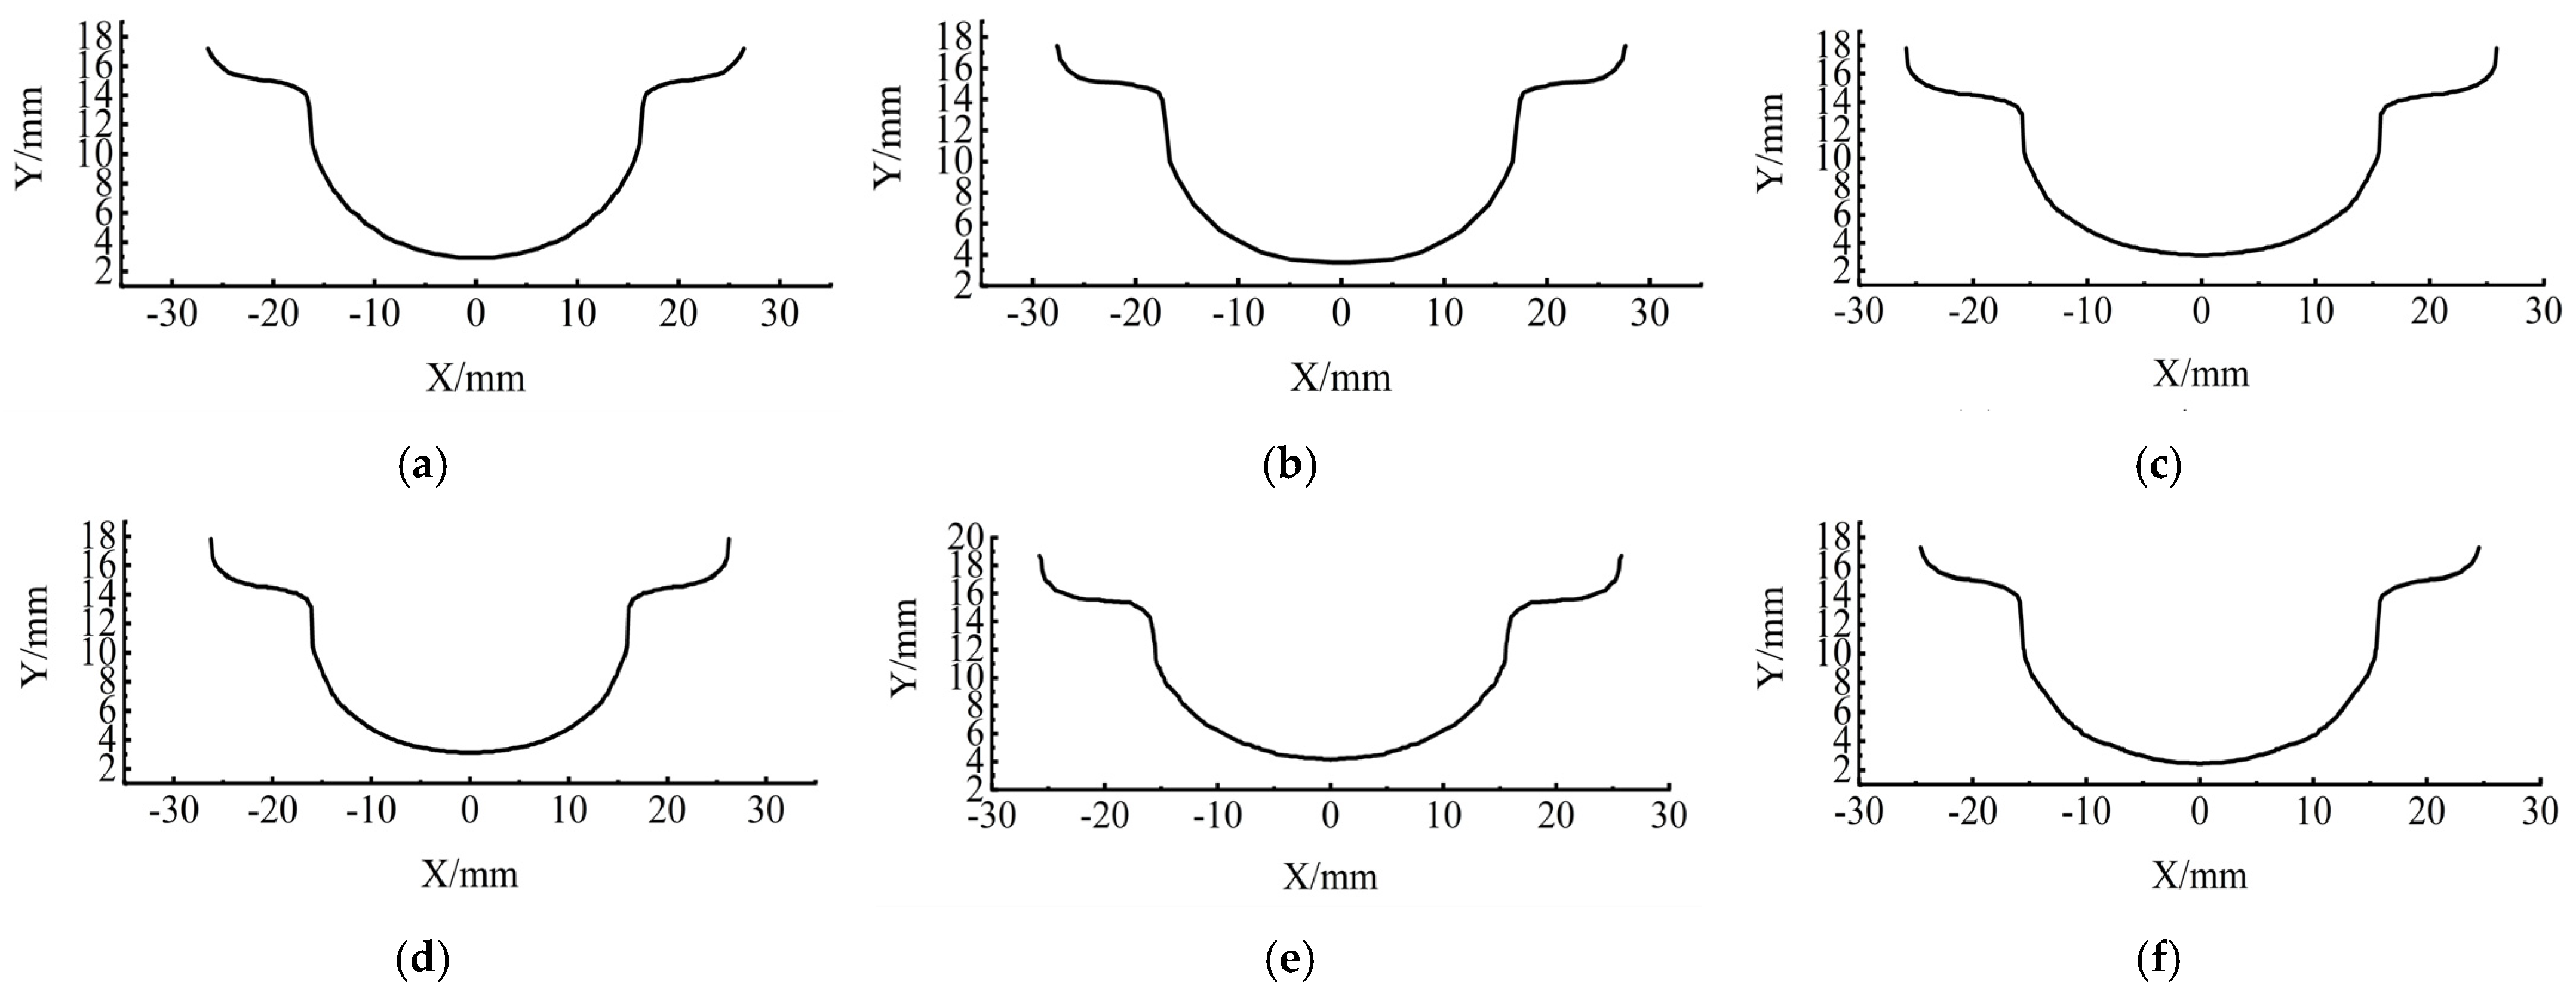
Figure 11 shows the coordinates of some unstable surface shapes when the surface wave amplitude reaches the peak using the method of image recognition.
When setting the nozzle height as h = 15 mm, and setting the viscosity of dimethyl silicone oil as η = 500, 1000, 1500 and 2000 Pa·s, respectively, we measured the amplitudes of the surface waves at a jet velocity of v = 11, 11.5, 12, 12.5 and 13 m/s, respectively, and analysed whether the jet velocity and the dimethyl silicone oil viscosity influences the surface wave amplitude. Using the image recognition method, we obtained the measured values of amplitudes A under different viscosities and different jet velocities, as shown in Table 5.
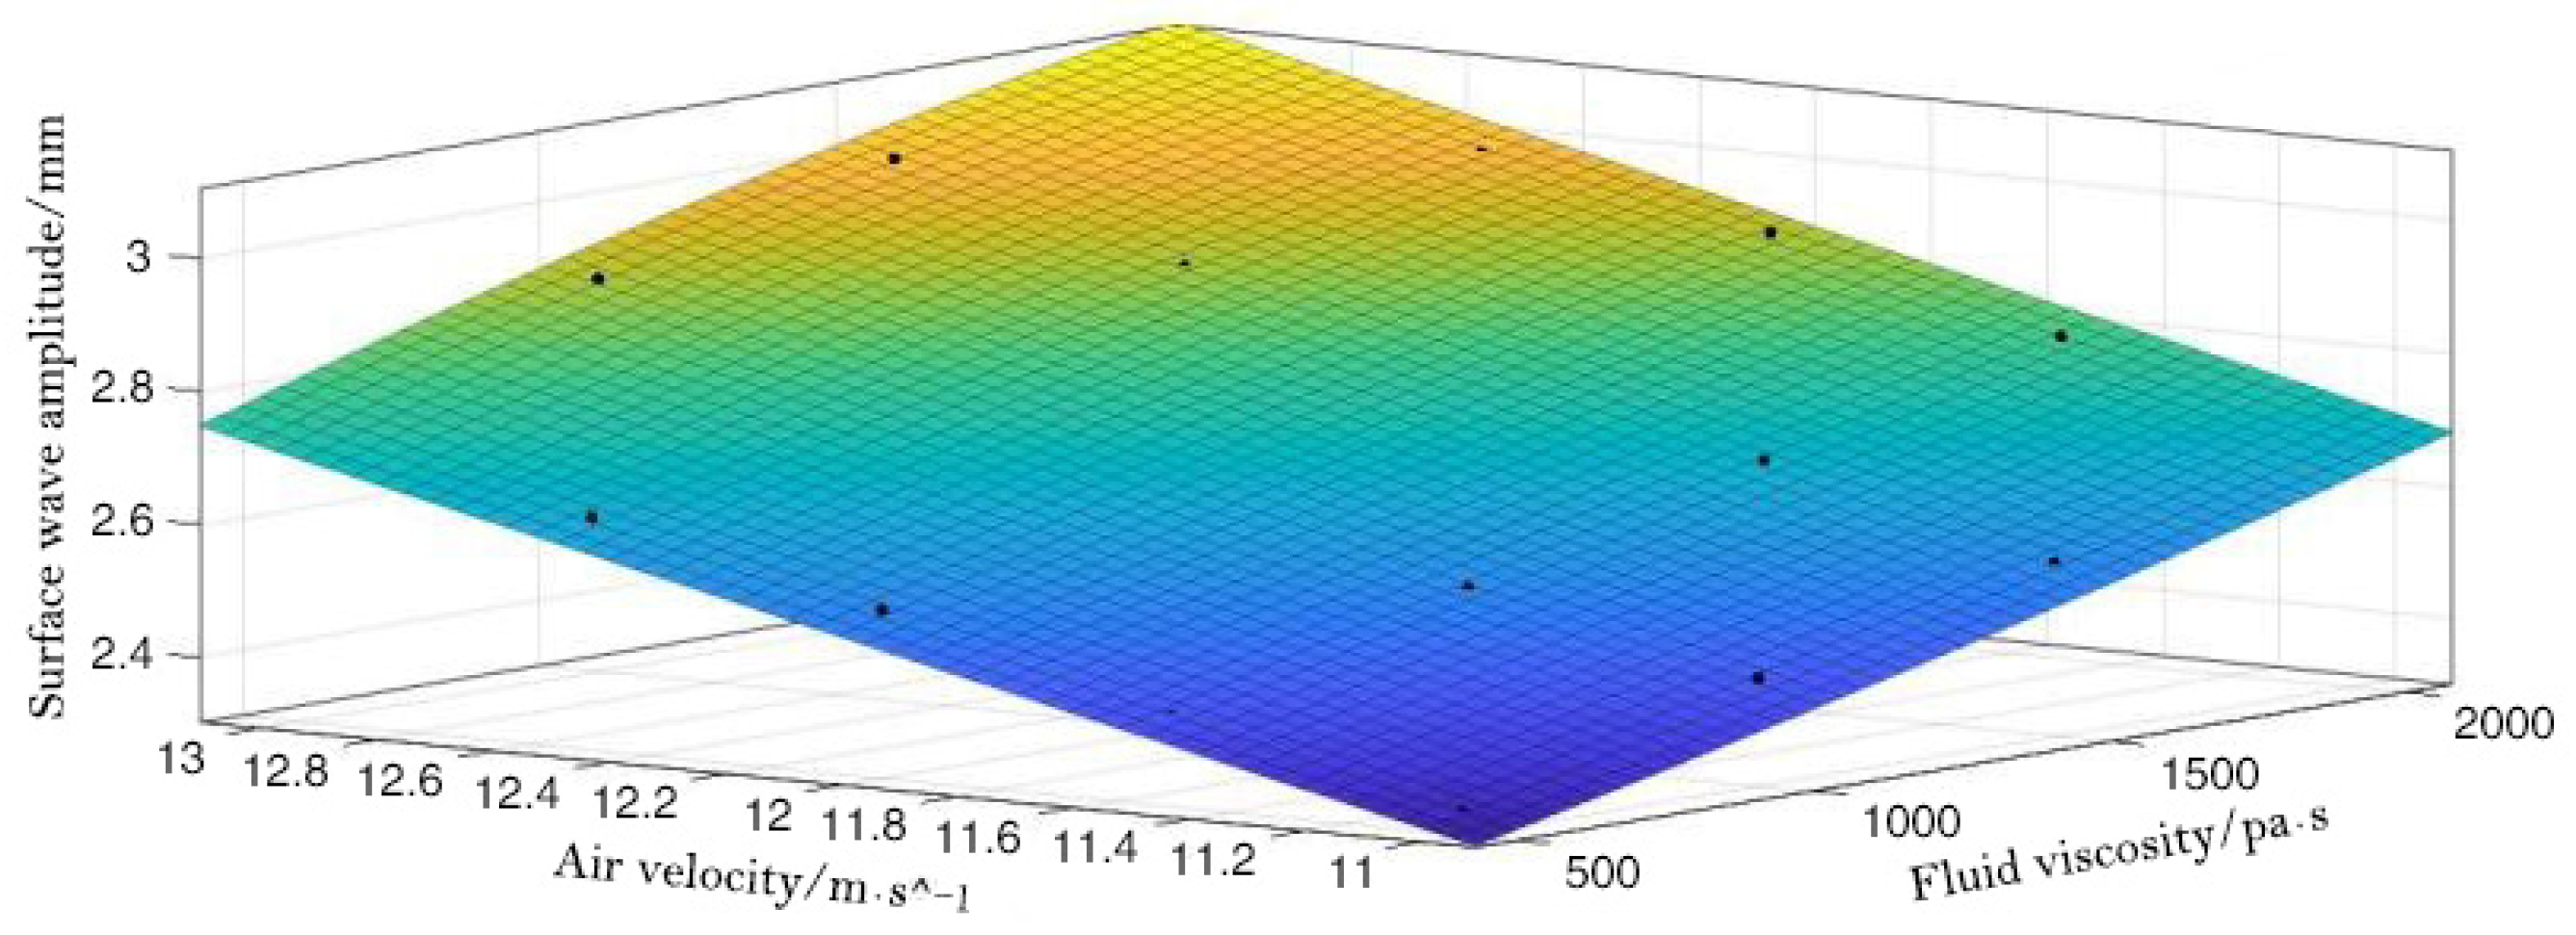
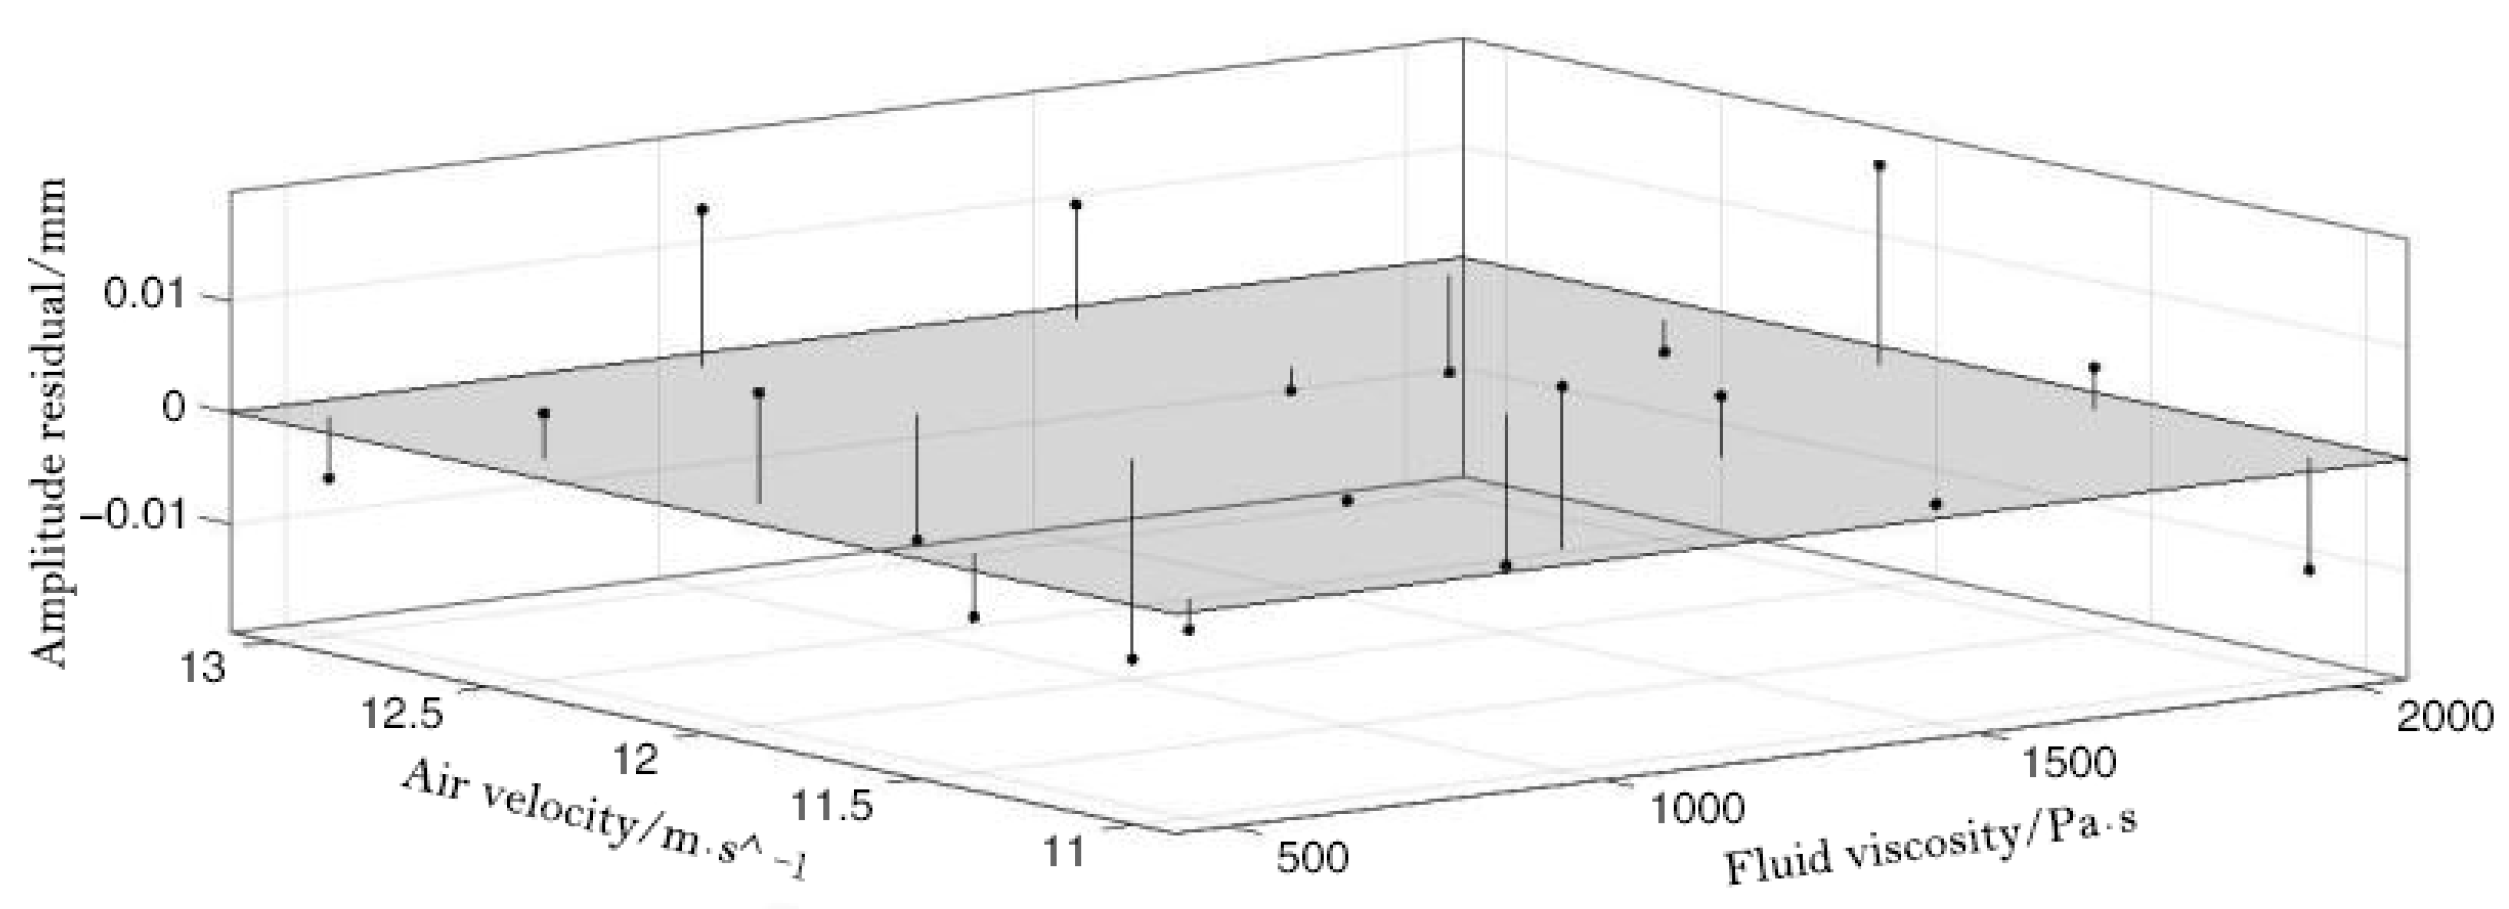
According to the experimental data, when the jet velocity and the dimethyl silicone oil viscosity gradually increase, the amplitude of the surface wave (2.338~3.069 mm) also increases. The minimum amplitude is 2.338 mm and the maximum is 3.069 mm when the jet velocity is between 11 m/s and 13 m/s and the viscosity of dimethylsilicone oil is between 500 Pa·s and 2000 Pa·s. In order to obtain a variation model of the influence of the jet velocity and the dimethyl silicone oil viscosity on the surface wave’s amplitude, the variation range of jet velocity and dimethyl silicone oil viscosity were set as 11~13 m/s and 500~2000 Pa·s in this study. These two sets of values were cross-calculated to obtain the corresponding surface wave amplitude. Then, a polynomial fitting was performed on the data using the specified minimum absolute residual method to obtain the fitting surface (Figure 12). The residual value is shown in Figure 13. The correction coefficient of the corresponding fitting R2adj reaches 0.9962, and the standard fitting deviation is 0.0122.
To ensure that the model equations are streamlined, terms with coefficients of less than 10−10 are ignored in this paper. The streamlined model is shown in Equation (2). The coefficients of the model obtained after the fit are shown in Table 6.
F = a 0 + a 1 η + a 2 v + a 3 η 2 + a 4 η v + a 5 η 2 v     η 500 , 2000 ; v 11 , 13
where F represents the surface wave amplitude, η represents the dimethyl silicone oil viscosity, and v represents the jet velocity.
In order to verify the accuracy of the prediction model of surface wave amplitude, sixteen sets of data were randomly selected; the results calculated by the model were compared with the experimental measurements, and the results of the comparison are shown in Table 7.
The maximum deviation between the calculated results of the prediction model for surface wave amplitude and the experimental results is 0.0144 mm, which has a small deviation. In order to verify that the model is also applicable to gas jet forming of epoxy resins, the following experiments were carried out to verify the validity of the prediction model. A gas flow rate of 13 m/s and viscosities of 510 Pa·s, 520 Pa·s, 530 Pa·s, 540 Pa·s, 550 Pa·s and 560 Pa·s for the epoxy resin were chosen for these experiments. The predicted surface wave amplitudes for the six experimental parameters were 2.7521 mm, 2.7549 mm, 2.7576 mm, 2.7604 mm, 2.7631 mm and 2.7659 mm, respectively. The maximum deviation between the surface wave amplitude prediction model and the experimental results was calculated to be 0.0121 mm, which proves that the surface wave amplitude prediction model is also applicable to gas jet forming of epoxy resins.

4.3. Influence of the Gas Jet Velocity and the Dimethyl Silicone Oil Viscosity on the Transfer Period

The period of the surface waves formed by the gas jet was measured under the same experimental parameters as expressed in Section 4.2, and the results are shown in Table 8.
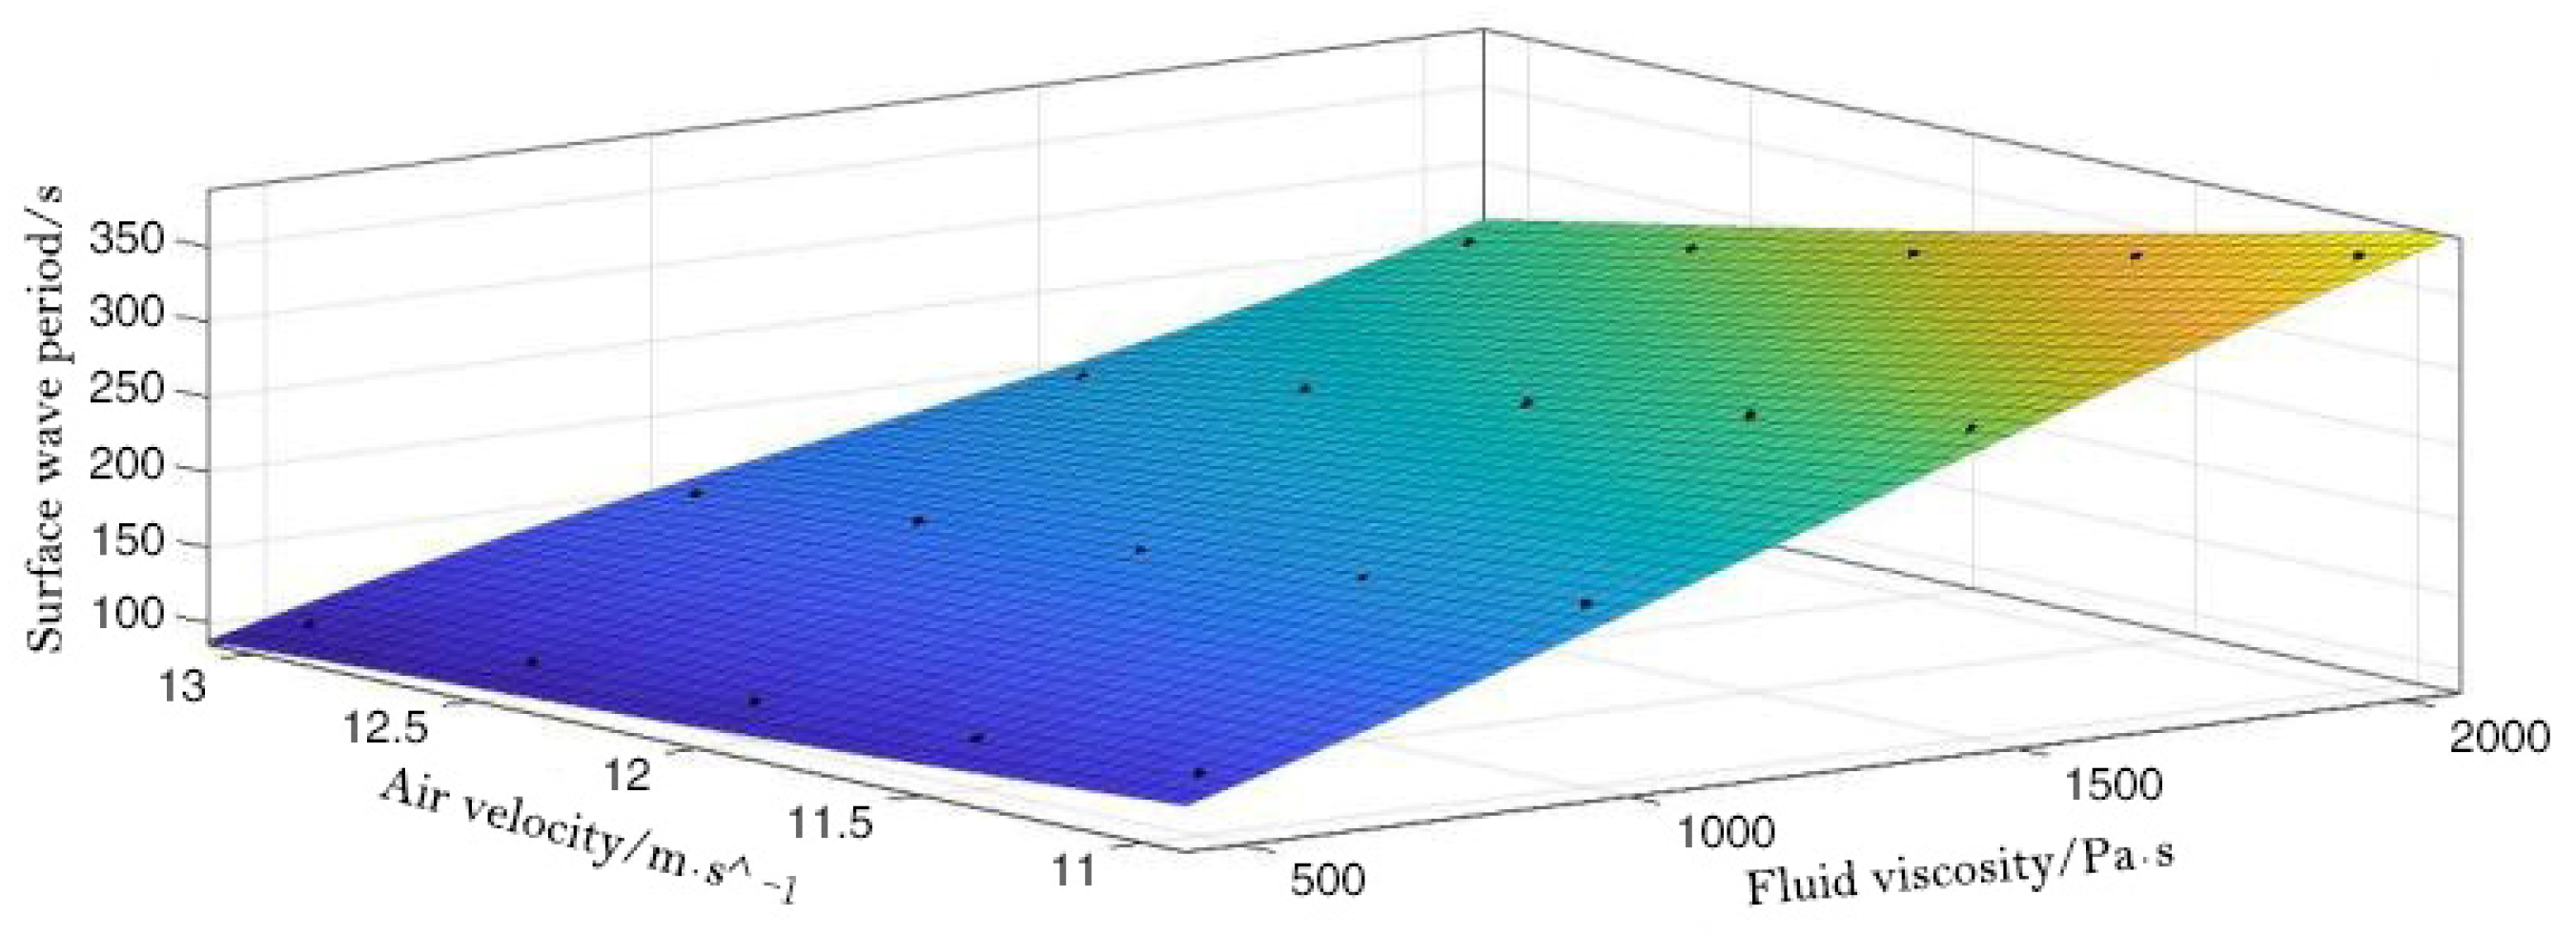
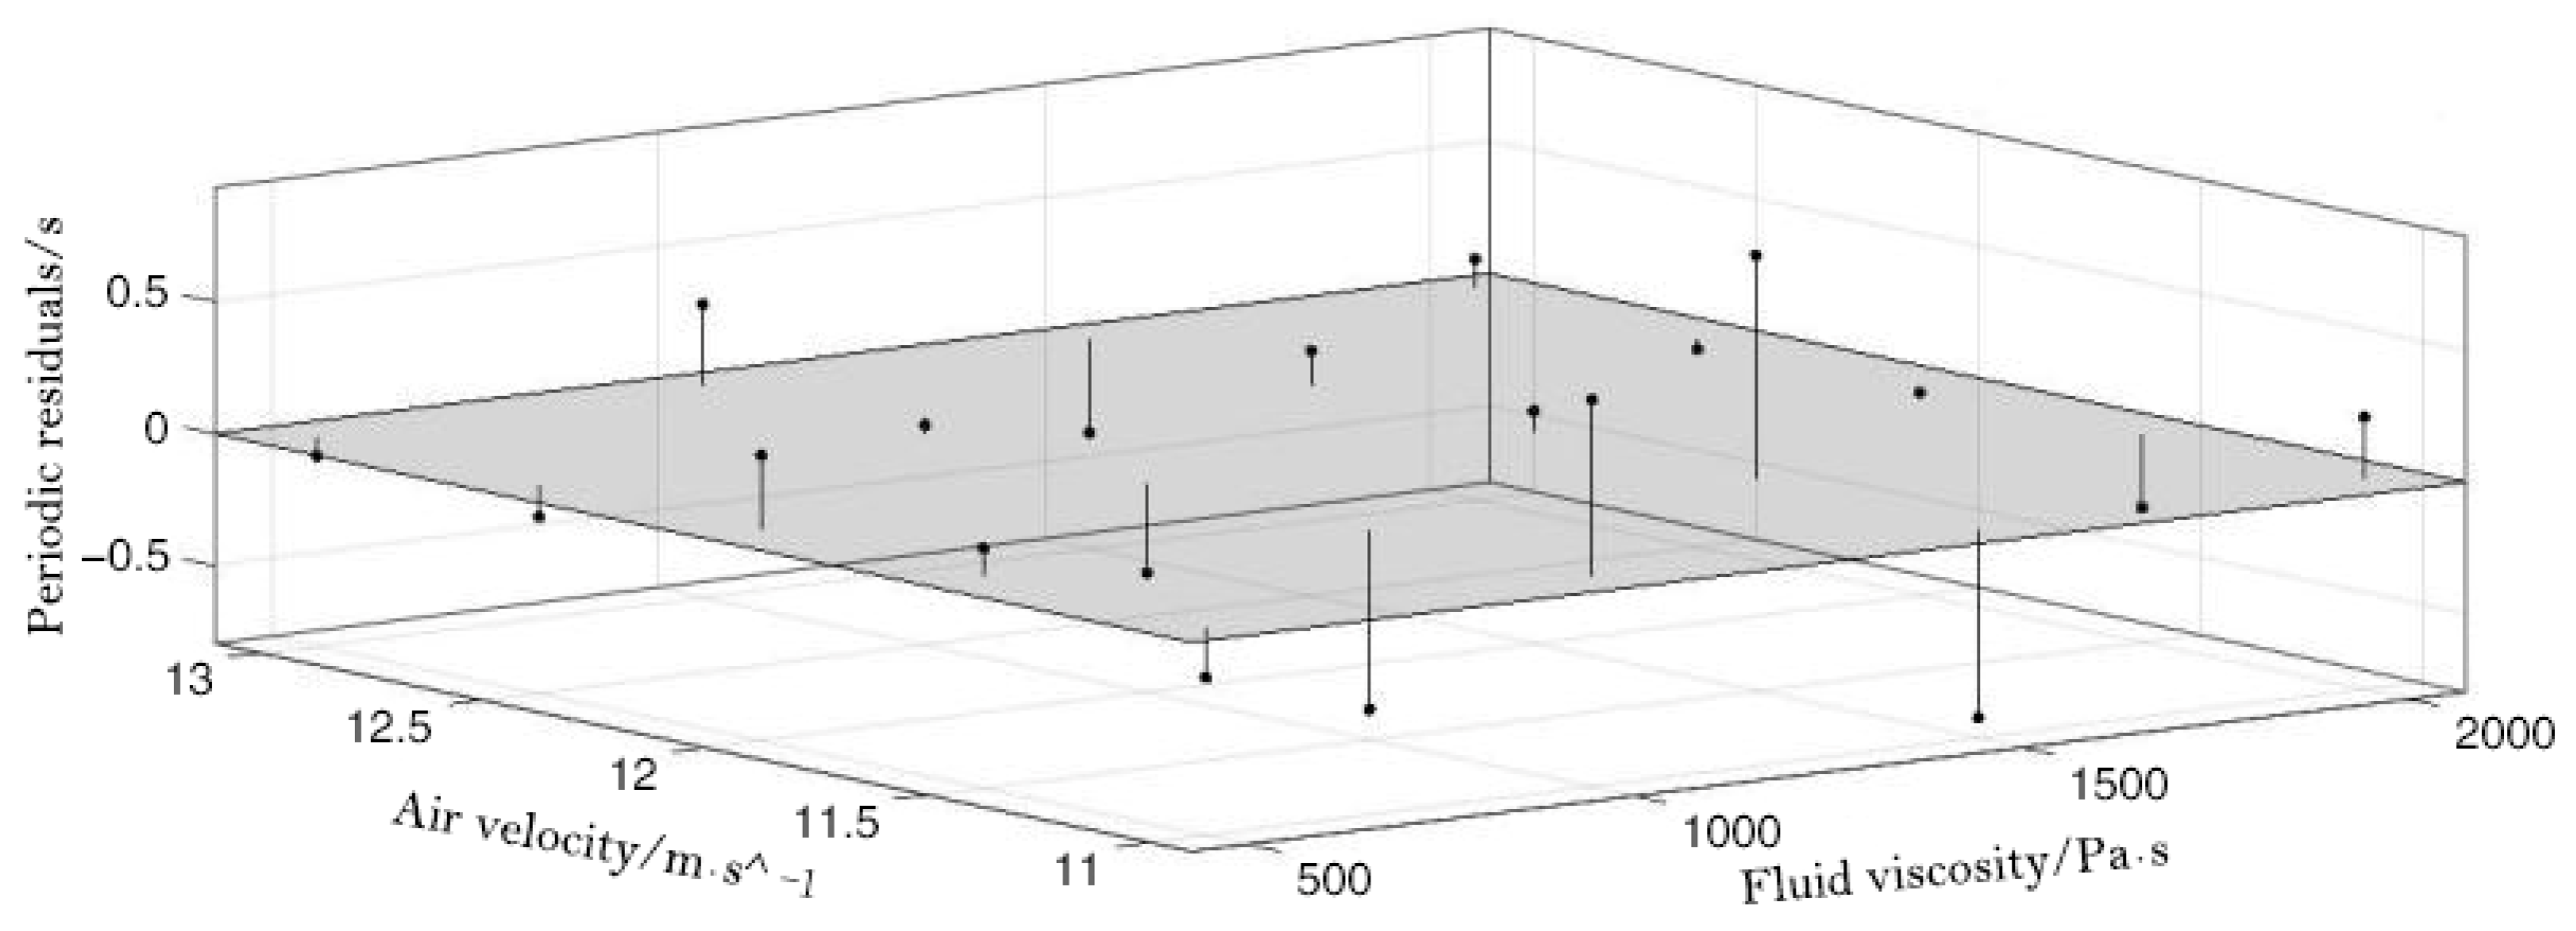
According to the above data, when the jet velocity is constant, the transfer period of the surface wave increases with the dimethyl silicone oil viscosity; when the viscosity is constant, the surface wave period decreases with the increase of the jet velocity. When the gas jet velocity is between 11 m/s and 13 m/s and the viscosity of the dimethyl silicone oil is between 500 Pa-s and 2000 Pa-s, the minimum period of the surface wave formed is 126 s and the maximum period is 257 s. In order to obtain a variation model of the influence of jet velocity and dimethyl silicone oil viscosity on the surface wave’s transfer period, the variation range of jet velocity and dimethyl silicone oil viscosity were set as 11~13 m/s and 500~2000 Pa·s. These two sets of values were cross-calculated to obtain the corresponding surface wave periods. Then, a polynomial fitting was performed on the data using the specified minimum absolute residual method to obtain the fitting surface (Figure 14). The residual value is shown in Figure 15. The correction coefficient of the corresponding fitting R2adj reaches 0.9999, and the standard fitting deviation is 0.6873.
To ensure that the model equations are streamlined, terms with coefficients of less than 10−10 are ignored in this paper. The streamlined model is shown in Equation (3). The coefficients of the model obtained after the fit are shown in Table 9.
T = a 0 + a 1 η + a 2 v + a 3 η 2 + a 4 η v + a 5 v 2 + a 6 η 3 + a 7 η 2 v + a 8 η v 2 + a 9 v 3 + a 10 η 3 v + a 11 η 2 v 2 + a 12 η v 3 + a 13 v 4
In this equation, T represents the transfer period of the surface wave, η is the dimethyl silicone oil viscosity, and v is the jet velocity. η 500 , 2000 ; v 11 , 13 . In order to verify the accuracy of the prediction model of surface wave amplitude, sixteen sets of data were randomly selected; the results calculated by the model were compared with the experimental measurements, and the results of the comparison are shown in Table 10.
The maximum deviation between the calculated results of the prediction model for the transfer period and the experimental results is 0.3 s, which has a slight deviation. In order to verify that the model is also applicable to gas jet forming of epoxy resins, the following experiments were carried out to verify the validity of the prediction model. A gas flow rate of 13 m/s and viscosities of 510 Pa·s, 520 Pa·s, 530 Pa·s, 540 Pa·s, 550 Pa·s and 560 Pa·s for the epoxy resin were chosen for these experiments. The transfer period for the six experimental parameters were 202.7 s, 204.1 s, 205.3 s, 206.6 s, 207.8 s, and 209.0 s, respectively. The maximum deviation between the transfer period prediction model and the experimental results was calculated to be 0.2 s, which proves that the surface wave amplitude prediction model is also applicable to gas jet forming of epoxy resins.

5. Conclusions

In view of the interface instability phenomenon when the gas jet impinges on the dimethyl silicone oil pool, this study examines the amplitude and the transfer period of the surface wave that occurred on the unstable interface by conducting orthogonal experiments, and theoretically calculates and analyses the mechanism of the instable gas–liquid interface. The measurement of the surface wave amplitude reveals the periodic deformation of the gas–liquid interface during the dynamic fluctuation. The results show that, at the same viscosity, the amplitude A increases slightly with jet velocity v. The transfer period T is highly sensitive to the change of jet velocity v; the larger the jet velocity v is, the smaller the transfer period T is. Meanwhile, when at the same gas jet velocity, the amplitude A increases slightly with the viscosity of dimethyl silicone oil η. The viscosity of dimethyl silicone oil η has a significant influence on the transfer period T of the surface wave; the larger the viscosity of dimethyl silicone oil η is, the larger the surface wave transfer period T is. When the gas jet velocity is in the range of 11~13 m/s and the viscosity of dimethyl silicone oil is in the range of 500~2000 Pa·s, we can obtain results showing that the surface wave amplitude is in the range of 2.338~3.069 mm and the surface wave transfer period is in the range of 91~374 s. This research can be used to enhance the forming accuracy of the gas jet-forming method.

Author Contributions

W.F.: conceptualisation, methodology, software, investigation, writing—original draft. X.Z. (Xu Zhang): Software, investigation. M.W.: validation, formal analysis, visualisation, software. X.Z. (Xinming Zhang): validation, formal analysis, visualisation, investigation. All authors have read and agreed to the published version of the manuscript.

Funding

This research was funded by the “Basic and Applied Basic Research Fund of Guangdong Province, grant number 2021A1515110927”, the “Jilin Province Scientific and Technological Development Program, grant number 20200201006JC”, “The Open Project Program of Key Laboratory for Cross-Scale Micro and Nano Manufacturing, Ministry of Education, Changchun University of Science and Technology, grant number CMNM-KF202108”, and the “Scientific Research Project of Education Department of Guangdong Province, grant number 2022KCXTD029”.

Data Availability Statement

Not applicable.

Conflicts of Interest

The authors declare no conflicts interests.

References

  1. Jedamzik, R.; Werner, T.; Westerhoff, T. Production of the 4.26 m ZERODUR mirror blank for the Advanced Technology Solar telescope (ATST). Proc. SPIE 2014, 9151, 311–319. [Google Scholar]
  2. Westerhoff, T.; Schäfer, M.; Thomas, A.; Weissenburger, M.; Werner, T.; Werz, A. Manufacturing of the ZERODUR 1.5-m primary mirror for the solar telescope GREGOR as preparation of light weighting of blanks up to 4-m diameter. Proc. Spie 2010, 7739, 206–214. [Google Scholar]
  3. Yan, G.P.; Zhang, Y.; You, K.; Li, Z.X.; Yuan, Y.K.; Fang, F.Z. Off-spindle-axis spiral grinding of aspheric microlens array mold inserts. Opt. Express 2019, 27, 10873–10889. [Google Scholar] [CrossRef] [PubMed]
  4. Chkhalo, N.I.; Churin, S.A.; Pestov, A.E.; Salashchenko, N.N.; Vainer, Y.A.; Zorina, M.V. Roughness measurement and ion-beam polishing of super-smooth optical surfaces of fused quartz and optical ceramics. Opt. Express 2014, 22, 20094–20106. [Google Scholar] [CrossRef] [PubMed]
  5. Han, J.Y.; Kim, S.W.; Han, I.; Kim, G.H. Evolutionary grinding model for nanometric control of surface roughness for aspheric optical surfaces. Opt. Express 2008, 16, 3786–3797. [Google Scholar] [CrossRef] [PubMed]
  6. Yi, L.Q.; Zhang, X.J.; Hu, H.F.; Zhang, Z.Y.; Zeng, X.F.; Luo, X.; Xue, D.L.; Zhang, G. Equivalent thin-plate method for stressed mirror polishing of an off-axis aspheric silicon carbide lightweight mirror. Opt. Express 2020, 28, 36413–36431. [Google Scholar] [CrossRef] [PubMed]
  7. Yi, A.; Jain, A. Compression molding of aspherical glass lenses-a combined experimental and numerical analysis. J. Am. Ceram. Soc. 2005, 88, 579–586. [Google Scholar] [CrossRef]
  8. Ristok, S.; Roeder, M.; Thiele, S.; Hentschel, M.; Guenther, T.; Zimmermann, A.; Herkommer, A.M.; Giessen, H. Mass-producible micro-optical elements by injection compression molding and focused ion beam structured titanium molding tools. Opt. Lett. 2020, 45, 1184–1187. [Google Scholar] [CrossRef] [PubMed]
  9. Moon, S.D.; Lee, N.; Kang, S. Fabrication of a microlens array using micro-compression molding with an electroformed mold insert. J. Micromech. Microeng. 2002, 13, 98–103. [Google Scholar] [CrossRef]
  10. Yi, A.Y.; Huang, C.; Klocke, F.; Brecher, C.; Pongs, G.; Winterschladen, M.; Demmer, A.; Lange, S.; Bergs, T.; Merz, M. Development of a compression molding process for three-dimensional tailored free-form glass optics. Appl. Opt. 2006, 45, 6511–6518. [Google Scholar] [CrossRef] [PubMed]
  11. Kang, C.G.; Rohatgi, P.K. Transient thermal analysis of solidification in a centrifugal casting for composite materials containing particle segregation. Metall. Mater. Trans. B 1996, 27, 277–285. [Google Scholar] [CrossRef]
  12. Mueller, R.W.; Hoeness, H.W.; Marx, T. Spin-cast Zerodur mirror substrates of the 8-m class and lightweighted substrates for secondary mirrors. Int. Soc. Opt. Photonics 1990, 1236, 723–734. [Google Scholar]
  13. Borra, E.; Ferrari, M.; Girard, L.; Moretto, B.; Tremblay, G. Liquid mirrors. Can. J. Phys. 1995, 73, 109–125. [Google Scholar] [CrossRef]
  14. Fu, W.J.; Zhang, X.M. Experimental and numerical simulation study on gas jet forming of optical mirror blank. Optik 2020, 207, 164451. [Google Scholar] [CrossRef]
  15. Fu, W.J.; Zhang, X.M. Experimental and simulation research on the interface instability in gas jet forming. Optik 2020, 216, 164911. [Google Scholar] [CrossRef]
  16. Kravchenko, I.V.; Sultanov, V.G.; Patlazhan, S.A. Mechanism of stability of the shear flow of a two-layer system of viscous liquids. Dokl. Phys. Chem. 2011, 440, 171–173. [Google Scholar] [CrossRef]
  17. Forbes, L.K.; Chen, M.J.; Trenham, C.E. Computing unstable periodic waves at the interface of two inviscid fluids in uniform vertical flow. J. Comput. Phys. 2007, 221, 269–287. [Google Scholar] [CrossRef]
  18. Evrensel, C.A.; Zhou, L.; Khan, M.R.U. Response of a two-layer compliant slab to inviscid incompressible fluid flow. J. Acoust. Soc. Am. 1985, 101, 2070–2074. [Google Scholar] [CrossRef]
  19. Ohkitani, K. Motion of an interface between two uniform-vorticity regions in two-dimensional inviscid fluids. Tokyo Sugaku Kaisya Zasshi 2007, 58, 121–128. [Google Scholar] [CrossRef]
  20. Liu, Q.; Lin, Z.; Chen, X.P.; Zhu, Z.C.; Cui, B.L. Surface wave generation via a gas-jet penetration into a liquid sheet. Exp. Therm. Fluid Sci. 2018, 97, 1–11. [Google Scholar] [CrossRef]
  21. Miles, J.W. On the generation of surface waves by shear flows. J. Fluid Mech. Digit. Arch. 1957, 3, 185–204. [Google Scholar] [CrossRef]
  22. Young, W.R.; Wolfe, C.L. Generation of surface waves by shear-flow instability. J. Fluid Mech. 2014, 739, 276–307. [Google Scholar] [CrossRef]
  23. Dogan, N.; Brooks, G.A.; Rhamdhani, M.A. Comprehensive model of oxygen steelmaking Part 1: Model development and validation. ISIJ Int. 2011, 51, 1086–1092. [Google Scholar] [CrossRef] [Green Version]
  24. Zhang, X.; Wang, M.; Fu, W. The Variation of Surface Shape in the Gas Jet Forming. Appl. Sci. 2023, 13, 504. [Google Scholar] [CrossRef]
  25. Kim, T.; Song, J. Effects of turbulence enhancement on combustion process using a double injection strategy in direct-injection spark-ignition gasoline engines. Int. J. Heart Fluid Flow 2015, 56, 124–136. [Google Scholar] [CrossRef]
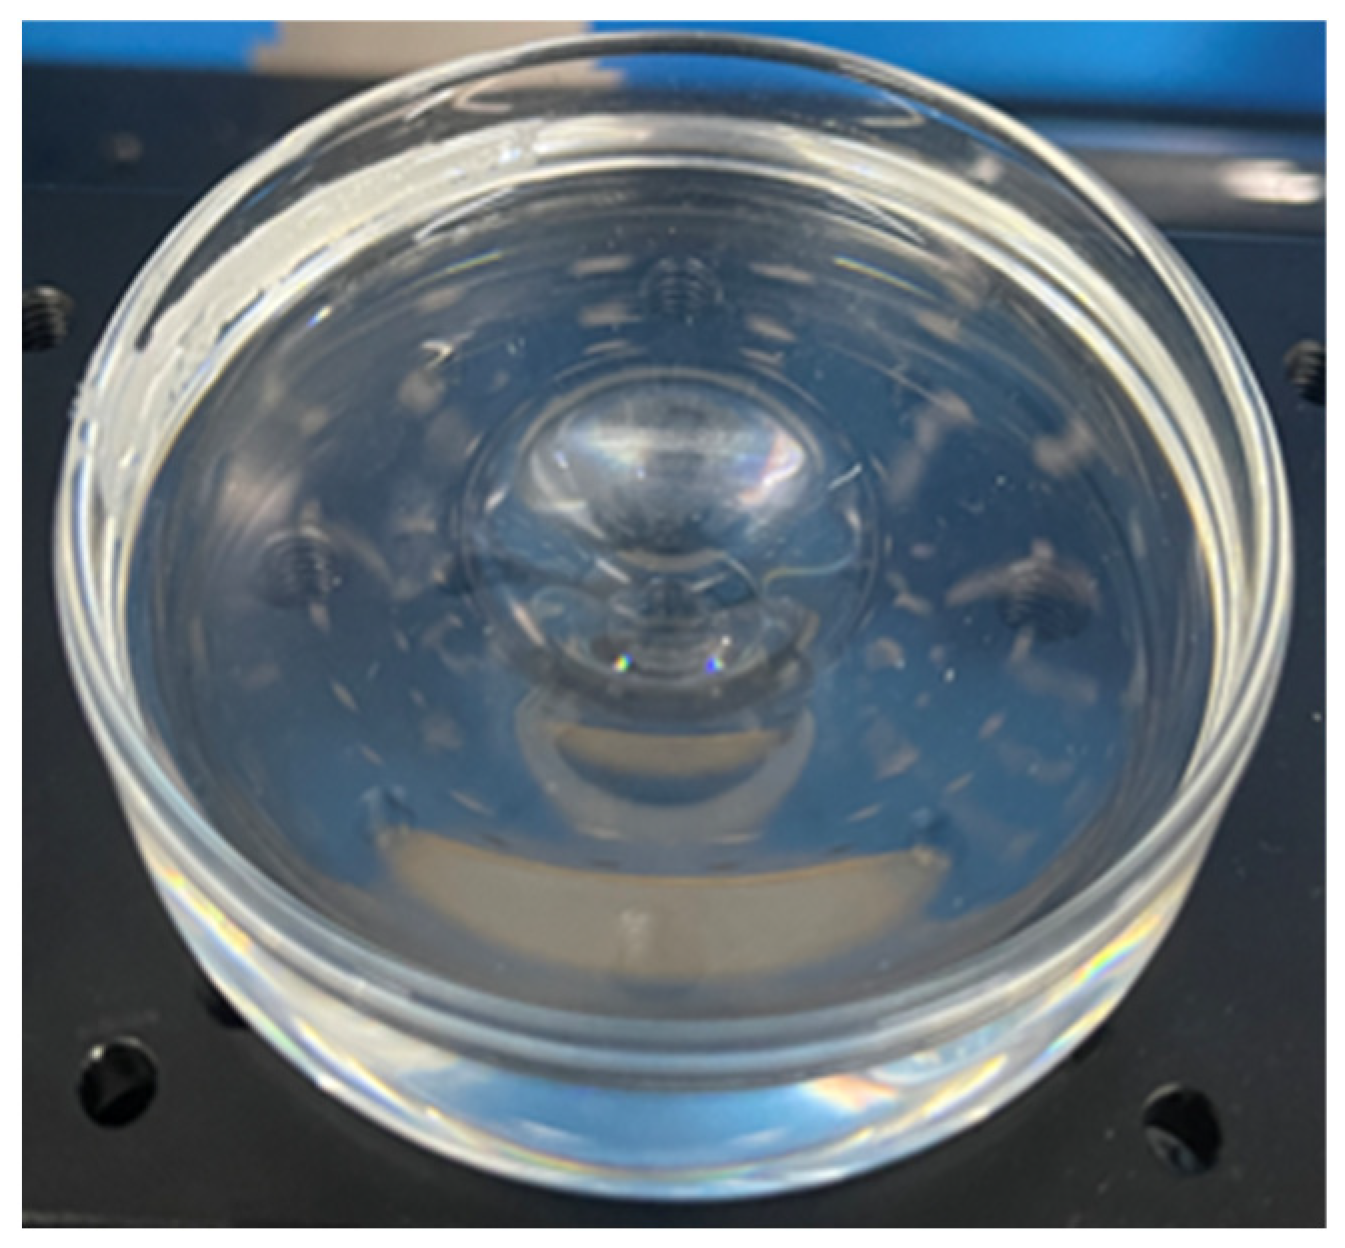
Figure 1. The stable interface.
Machines 11 00285 g001
Figure 2. The instability interface.
Machines 11 00285 g002
Figure 3. Surface fluctuation of the liquid pool at different moments of the gas jet impinging.
Machines 11 00285 g003
Figure 4. Schematic diagram of instability mechanism. (1) precision electroplated nozzle. (2) epoxy resin. (3) glass mould.
Machines 11 00285 g004
Figure 5. The experiment device. (1) air compressor (2) combined gas tanks (3) water–oil separator (4) refrigeration dryer (5) Gas MFC (6) gas jet controller (7) upper computer (8) precision electroplated nozzle (9) precision three-axis moving platform (10) glass mould (11) marble platform.
Machines 11 00285 g005
Figure 6. Transfer process of the surface wave. (a) is the air–liquid interface contour at 68 s, (b) is the air–liquid interface contour at 87 s, (c) is the air–liquid interface contour at 107 s, (d) is the air–liquid interface contour at 118 s.
Machines 11 00285 g006
Figure 7. Schematic diagram of amplitude measurement.
Machines 11 00285 g007
Figure 8. Schematic diagram of the measuring device.
Machines 11 00285 g008
Figure 9. Surface coordinates measured with the two methods.
Machines 11 00285 g009
Figure 10. Comparison of the experimental results. (a) v = 11 m/s, η = 500 Pa·s, (b) v = 12 m/s, η = 500 Pa·s, (c) v = 13 m/s, η = 1000 Pa·s, (d) v = 11 m/s, η = 1000 Pa·s, (e) v = 12 m/s, η = 1000 Pa·s, (f) v = 13 m/s, η = 1000 Pa·s, (g) v = 11 m/s, η = 2000 Pa·s, (h) v = 12 m/s, η = 2000Pa·s, (i) v = 13 m/s, η = 2000 Pa·s.
Machines 11 00285 g010
Figure 11. Surface coordinates under different viscosities. (a) v = 11 m/s η = 500 Pa·s; (b) v = 12 m/s η = 500 Pa·s; (c) v = 13 m/s η = 500 Pa·s; (d) v = 11 m/s η = 1000 Pa·s; (e) v = 12 m/s η = 1000 Pa·s; (f) v = 13 m/s η = 1000 Pa·s; (g) v = 11 m/s η = 2000 Pa·s; (h) v = 12 m/s η = 2000 Pa·s; (i) v = 13 m/s η = 2000 Pa·s.
Machines 11 00285 g011aMachines 11 00285 g011b
Figure 12. Fitting points and the fitting surface between gas jet velocity, dimethyl silicone oil viscosity and surface wave height.
Machines 11 00285 g012
Figure 13. Calculated residuals for the relationship between gas jet velocity, dimethyl silicone oil viscosity and surface wave height.
Machines 11 00285 g013
Figure 14. Fitting points and the fitting surface between gas jet velocity, dimethyl silicone oil viscosity and surface wave period.
Machines 11 00285 g014
Figure 15. Calculated residuals for the relationship between gas jet velocity, dimethyl silicone oil viscosity and surface wave period.
Machines 11 00285 g015
Table 1. Material properties.
Epoxy ResinDimethyl Silicone Oil
Density (kg/m3)980978
Viscosity (Pa·s)500~2000500~2000
Surface tension (N/m)0.02160.0216
Table 2. The viscosity of dimethyl silicone oil.
NumberViscosity (Pa·s)
1500
21000
31500
42000
Table 3. Equipment Parameters.
ParameterValue
the nozzle diameter (mm)500
the inner diameter of glass mould (mm)1000
the height between nozzle and the liquid surface (mm)1500
Table 4. Experimental parameters.
NumbersThe Viscosity of
Dimethyl Silicone Oil (Pa·s)
The Jet Velocity (m/s)NumbersThe Viscosity of
Dimethyl Silicone Oil (Pa·s)
The Jet Velocity (m/s)
150011.0011150011.00
250011.5012150011.50
350012.0013150012.00
450012.5014150012.50
550013.0015150013.00
6100011.0016200011.00
7100011.5017200011.50
8100012.0018200012.00
9100012.5019200012.50
10100013.0020200013.00
Table 5. Comparison of the surface wave amplitudes.
η = 500 Pa·sη = 1000 Pa·sη = 1500 Pa·sη = 2000 Pa·s
v = 11 m/s2.3382.4632.5622.672
v = 11.5 m/s2.4372.5562.6742.785
v = 12 m/s2.5552.6452.7612.898
v = 12.5 m/s2.6512.7592.8792.976
v = 13 m/s2.7432.8922.9983.069
Table 6. Values of the fitting Equation (2).
a0a1a2a3a4a5
0.2586−4.707 × 10−40.18022.976 × 10−76.046 × 10⁻⁵−2.58 × 10⁻⁸
Table 7. Comparison between the calculated results of the prediction model and the experimental results for surface wave amplitudes.
NumberParametersResults of the
Prediction Model
Calculations (mm)
Results of Experimental
Measurements (mm)
1v = 11.3 m/s η = 500 Pa·s2.40262.390
2v = 11.3 m/s η = 600 Pa·s2.42452.413
3v = 11.3 m/s η = 700 Pa·s2.44652.436
4v = 11.3 m/s η = 800 Pa·s2.46862.458
5v = 11.7 m/s η = 900 Pa·s2.57632.563
6v = 11.7 m/s η = 1000 Pa·s2.59912.586
7v = 11.7 m/s η = 1100 Pa·s2.62182.610
8v = 11.7 m/s η = 1200 Pa·s2.64442.630
9v = 12.3 m/s η = 1300 Pa·s2.79592.784
10v = 12.3 m/s η = 1400 Pa·s2.81782.804
11v = 12.3 m/s η = 1500 Pa·s2.83922.828
12v = 12.3 m/s η = 1600 Pa·s2.86022.850
13v = 12.7 m/s η = 1700 Pa·s2.99392.980
14v = 12.7 m/s η = 1800 Pa·s3.01653.005
15v = 12.7 m/s η = 1900 Pa·s3.03863.026
16v = 12.7 m/s η = 2000 Pa·s3.06033.049
Table 8. Comparison of surface wave periods.
η = 500 Pa·sη = 1000 Pa·sη = 1500 Pa·sη = 2000 Pa·s
v = 11 m/s126207291374
v = 11.5 m/s118192269342
v = 12 m/s111179245312
v = 12.5 m/s105167223284
v = 13 m/s99154200257
Table 9. Values of the fitting Equation (3).
a0a1a2a3a4a5a6
−3.105 × 10⁴−2.3671.077 × 1041.261 × 10−30.4563−1385−2.051 × 10⁻⁷
a7a8a9a10a11a12a13
−1.483 × 10⁻⁴−0.0268678.671.76 × 10−83.429 × 10−65.333 × 10−4−1.667
Table 10. Comparison between the calculated results of the prediction model and the experimental results for the transfer period of the surface wave.
NumberParametersResults of the
Prediction Model
Calculations (s)
Results of Experimental
Measurements (s)
1v = 11.3 m/s η = 500 Pa·s202.5202.3
2v = 11.3 m/s η = 600 Pa·s217.4217.5
3v = 11.3 m/s η = 700 Pa·s232.5232.8
4v = 11.3 m/s η = 800 Pa·s247.8247.6
5v = 11.7 m/s η = 900 Pa·s258.4258.2
6v = 11.7 m/s η = 1000 Pa·s272.6272.9
7v = 11.7 m/s η = 1100 Pa·s286.8286.5
8v = 11.7 m/s η = 1200 Pa·s300.9301.0
9v = 12.3 m/s η = 1300 Pa·s300.0299.9
10v = 12.3 m/s η = 1400 Pa·s311.7311.5
11v = 12.3 m/s η = 1500 Pa·s323.4323.3
12v = 12.3 m/s η = 1600 Pa·s335.3335.1
13v = 12.7 m/s η = 1700 Pa·s332.5332.8
14v = 12.7 m/s η = 1800 Pa·s344.0343.9
15v = 12.7 m/s η = 1900 Pa·s356.0356.2
16v = 12.7 m/s η = 2000 Pa·s368.8368.6
Disclaimer/Publisher’s Note: The statements, opinions and data contained in all publications are solely those of the individual author(s) and contributor(s) and not of MDPI and/or the editor(s). MDPI and/or the editor(s) disclaim responsibility for any injury to people or property resulting from any ideas, methods, instructions or products referred to in the content.