Article

Hybrid Model Feature Selection with the Bee Swarm Optimization Method and Q-Learning on the Diagnosis of Coronary Heart Disease

Department of Informatics, Universitas Sebelas Maret, Surakarta 57126, Indonesia
*
Author to whom correspondence should be addressed.
Information 2023, 14(1), 15; https://doi.org/10.3390/info14010015
Submission received: 1 November 2022 / Revised: 15 December 2022 / Accepted: 23 December 2022 / Published: 28 December 2022
(This article belongs to the Section Artificial Intelligence)

Abstract

:
Coronary heart disease is a type of cardiovascular disease characterized by atherosclerotic plaque, which causes myocardial infarction or sudden cardiac death. Since this sudden heart attack has no apparent symptoms, the early detection of the risk factors for coronary heart disease is required. Many studies have been conducted to diagnose heart disease, including studies that tested various classifiers, feature selection and detection models on several coronary heart disease datasets. As a result, this research aims to learn about the effect of the bee swarm optimization algorithm combined with Q-learning for optimizing the feature selection in improving the prediction of heart disease. This detection model was tested against various classification methods and evaluated against multiple performance measures, such as accuracy, precision, recall and the area under curve (AUC), to identify the best model for heart disease prediction and the benefit of the medical community. The test results show that the proposed method outperforms the existing process regarding the feature selection.

1. Introduction

Coronary heart disease is a type of cardiovascular disease in which there is atherosclerotic plaque in the coronary arteries, resulting in myocardial infarction or sudden cardiac death [1]. Coronary heart disease is a complex disease in which the genetic architecture and the influence of environmental factors both contribute to the disease’s development. Smoking, alcohol consumption, a lack of physical activity, a high-calorie diet high in fat, cholesterol and sugar, infections, environmental chemicals and pollutants, and stress are all ecological risk factors for heart disease. High blood pressure, high cholesterol, height, diabetes, overweight or obesity are all risk factors [2]. Since this unexpected heart attack occurs without obvious symptoms, the early detection of the risk factors for coronary heart disease is required.
Heart disease detection depends on the variation chosen and the number of risk factor variables used. The clinical data that is uncertain and irregular will be challenging to use in the detection system. This detection system will later help doctors diagnose diseases. If the data processing is inadequate, the classification process will perform poorly. The selection of the features can be considered so that the detection system’s performance receives an accurate prediction. Irrelevant or redundant features can reduce the accuracy and increase the computational costs unnecessarily [1].
Many studies have been conducted to improve the prediction accuracy by optimizing the classification process by removing irrelevant features. Verma et al. [1] used a classification technique to build a predictive model for identifying coronary artery disease (CAD) cases, considering all aspects of the patient’s clinical data. The data from Indira Gandhi Medical College (IGMC) in Shimla, India, was used. There were 26 features in the data. However, not all the features were always significant. Some were irrelevant and redundant and contributed little to the prediction. The feature selection techniques typically reduced the feature space dimensions and eliminated the redundant, outside or noisy data. The reduction in the features impacted the modeling framework regarding the data mining algorithm speed, data quality, performance and understanding of the mining results. The best feature subset included at least a few features that contributed significantly to the accuracy and efficiency. As a result, Verma et al. proposed a hybrid model for detecting coronary heart disease that combined the correlation-based feature subset selection (CFS) algorithm with a particle swarm pptimization (PSO) as a search method and k-means clustering. The model was validated using a 10-fold cross-validation and employed a supervised learning classification algorithm such as MLP, MLG, FURIA and C4.5. The proposed method results were tested on the coronary heart disease dataset, specifically the Cleveland and Indira Gandhi Medical College (IMGC) datasets. The data achieved an accuracy of 0.92 and 0.88, respectively.
Tama et al. [3] improved the model of detecting infectious diseases by employing a two-tiered classification algorithm. During this study, the features were chosen using the correlation-based feature subset selection (CFS) method and the particle swarm optimization technique (PSO). The dataset was obtained from the UCI machine learning repository. The datasets used were Z-Alizadeh Sani, Statlog, Cleveland and Hungary. According to the feature selection results, the PSO with 20 particles provided the best predictive performance on the Z-Alizadeh Sani dataset with an accuracy of 0.84 using a set of 27 features. The best classification accuracy was obtained using the same number of particles in the Statlog dataset, which produced a set of 8 elements with a prediction accuracy of 0.77. The following step was to create a two-level ensemble to build a classification model using random forest (RF), gradient boosting machine (GBM) and extreme gradient boosting machine (XGBoost). The proposed method’s accuracy on the z-Alizadeh Sani and Statlog datasets was 0.98% and 0.94, respectively.
According to Alqahtani et al. [4], machine learning research aims for a classification model that can predict cardiovascular disease. An ensemble-based approach used machine learning and deep learning models with six classification algorithms for detecting cardiovascular disease. The random forest provided extracts of the essential features. The machine learning ensemble model obtained an accuracy score of 88.70%.
Many optimization algorithms, including genetic algorithms [5,6] and swarm intelligence algorithms such as particle swarm optimization (PSO) [1,3] and artificial bee colony (ABC) [7], have been discovered to solve the relevant feature selection problems. However, the bee swarm optimization algorithm was successfully applied to various optimization problems [8,9]. The bee swarm optimization algorithm is an intelligent swarm algorithm inspired by the foraging behavior of natural bees. According to Sadeg et al. [9], the bee swarm optimization algorithm outperformed other optimization algorithms. A swarm intelligence algorithm inspired by natural bee foraging behavior is used to find the best feature subset that maximizes the classification accuracy. A classification problem includes diagnosing diseases from many patients using data from different categories of a specific disease. The heart disease classification data will be significant, so the diagnosis will be able to be classified more accurately with the help of bee search optimization algorithms.
As the data increases, metaheuristic methods for solving the optimization problems become more complex. Sadeg et al. [
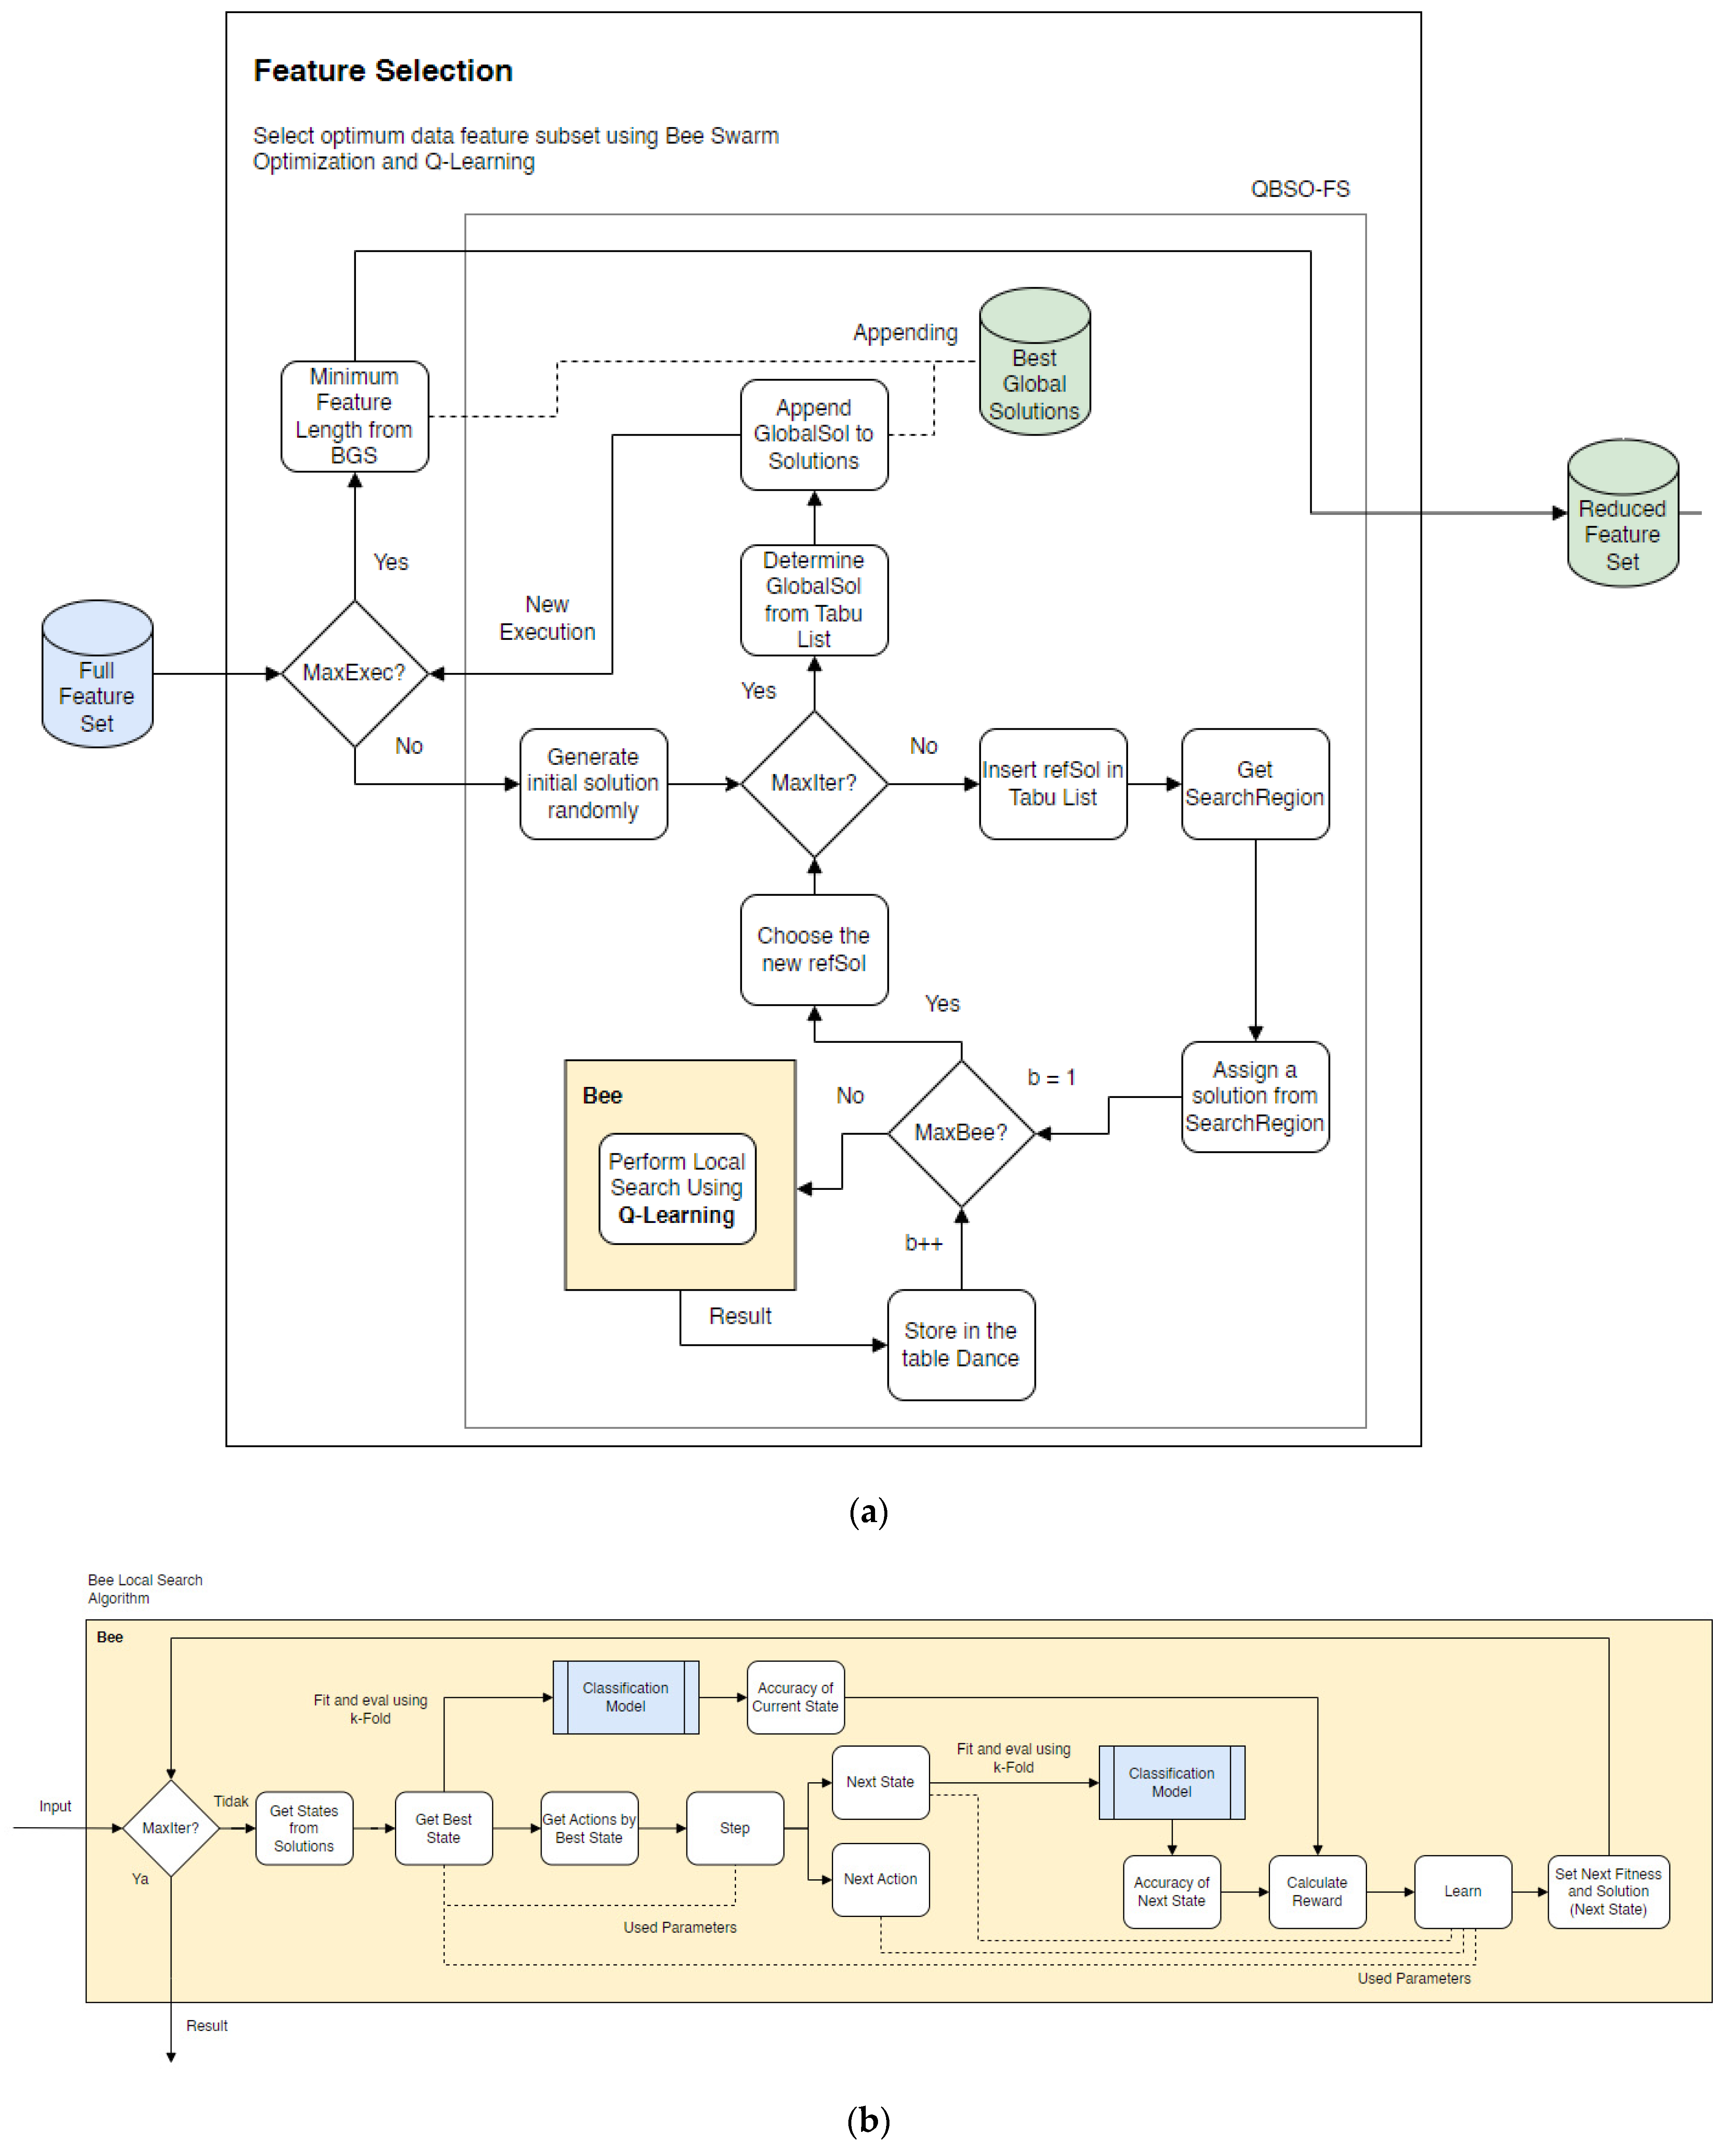
10] proposed a hybrid method to complete the feature selection by incorporating a reinforcement learning algorithm into bee swarm optimization (BSO). Q-learning was used during the search method process of the BSO to make the search process more adaptive and efficient. The integration of Q-learning into the bee swarm optimization algorithm helped improve the bee search performance. Q-learning is used to accelerate the convergence so that less execution time is required to achieve the same level of accuracy. On 20 well-known datasets, the bee swarm optimization and Q-learning (QBSO) performance were evaluated and compared to the BSO and other methods. The results show that the QBSO-feature selection outperformed the BSO-feature selection for large cases and produced outstanding results compared to recently published algorithms.
Based on the previous research, this study proposes for the bee swarm optimization algorithm to be combined with the Q-learning algorithm as a feature selection search algorithm. The Q-learning algorithm, also known as reinforcement learning, is used to improve the effectiveness of the feature search process. This feature selection model is intended to improve the classification process for detecting heart disease. This feature selection model is expected to produce results that identify the best subset of features for improving the classification accuracy in the detection of coronary heart disease.

2. Materials and Methods

2.1. Data Collection and Analysis

In In this study, we used publicly accessible heart disease datasets from the University of California at Irvine (UCI) machine-learning repositories [11], such as Z-Alizadeh Sani, Cleveland and Statlog (Heart) datasets and cardiovascular diseases data [4]. All 303 data points in the Z-Alizadeh Sani dataset consist of 55 characteristics. Four categories of information from the dataset were identified: (1) demographic; (2) symptoms and examination; (3) ECG; and (4) laboratory and echo [12]. The Cleveland and Statlog datasets each included 303 data points over 14 characteristics. The dataset was broken down into five categories: (1) symptoms; (2) risk factors; (3) ECG; (4) scintigraphy; and (5) angiography. There were three types of input features in the cardiovascular disease data objective from the factual information, an examination from the results of the medical examination and the subjective information from the patient. There are 70,000 samples in the dataset and 12 attributes.
In the Z-Alizadeh Sani dataset, which consisted of 55 attributes containing one trait, namely the blood-brain barrier (BBB), it was found that the blood-brain barrier (BBB) function was removed from the dataset before the algorithm was run [13]. Consequently, features unrelated to coronary artery disease (CAD) were also removed from the dataset in this study. So, the Z-Alizadeh Sani dataset used 54 attributes. The Statlog dataset comprised 75 attributes, but all the experiments used 13 features to predict heart disease. The Cleveland dataset consisted of 76 points, but only 13 were used in the investigation to predict disease. The cardiovascular disease data consisted of 70,000 samples, but only 8684 models with 11 feature sets were used in the experiment to predict disease.
Furthermore, preprocessing the data was required before training a model. Addressing the various dataset characteristics, handling the missing values, scaling and standardization were addressed during the preprocessing stage. Managing the small, large and noisy datasets, overcoming overfitting, dealing with the class imbalance and label encoding were all part of this. This study recommends using preprocessing approaches such as eliminating anomalies (outliers) and applying a standard scaler to the dataset to demonstrate the model’s efficiency and obtain an acceptable and dependable accuracy for disease prediction.

2.2. Models for Selecting Optimum Data Feature Subset

In this section, we designed a model construction through feature selection utilizing bee swarm optimization and Q-learning. By establishing the minimal feature length for all the best solutions, this feature selection chose optimal and not excessive features. A wrapper method was used in the feature selection model. A classification method was used in this technique to test the best-selected feature subset. The support vector machine, random forest, light gradient boosting machine and extreme gradient boosting were the classification algorithms employed.

2.2.1. Bee Swarm Optimization

Bee swarm optimization is a swarm intelligence system inspired by natural bee foraging behavior that has successfully been applied to various optimization issues [9]. Honeybees exhibit intelligence by collecting, digesting and advertising nectar. When worker bees find an excellent foraging spot, they will return to the hive and dance to inform the rest of the population that they have discovered food. The bee conveys to its comrades the distance, direction and riches of the food source visited [9,14].
Initially, a bee would fly about the hive randomly, searching for new food sources, with little understanding of the environment. Then they teach the observer bees about the environment and newly found food sources and promote them on the dance floor. Bees are more likely to choose good food sources since they supply information. A bee flies to discover the food source, remembers the food supply’s position and subsequently begins to exploit it.
Bee swarm optimization can be divided into four phases: (1) the initial solution phase, (2) the parameter initialization phase, (3) the fitness function creation phase and (4) the updating the bee phase.
  • Initial solution phase: The first phase is when a bee searches for a solution with good characteristics, which we named refSol, and from which a collection of solutions from the search space is generated. The SearchRegion refers to the collection of these solutions. As a starting point in the search, each bee will evaluate a solution from the SearchRegion.
  • Parameter initialization phase: Some parameters, such as the number of bees (nBees), the maximum number of iterations (max iterations) and the initialization function in the search space, which is related to a random position of the bee, must be initialized during this phase.
  • Fitness function creation phase: The first criterion evaluated in determining the reference solution is quality and the solution with the most significant fitness function value is chosen. The reference solution is chosen using the intensification and diversification principles to maintain a good balance between exploitation and exploration. The intensification seeks reasonable solutions by utilizing promising search regions, whereas the diversification allows for thorough search space coverage by visiting new areas.
  • Updating the bee phase: After completing its search, each bee transmits the best-visited answer to its companions via a table called Dance. In the following process iteration, one of the solutions in this table will become the new reference solution. The reference solution is saved in a prohibited list each time to avoid loops. The algorithm’s stopping condition discovers the optimal solution or completing the maximum number of iterations.

2.2.2. Q-Learning

Reinforcement learning is a type of learning in which each circumstance with an action is selected to maximize the reward received. Specifically, the agent and the interaction environment each time t = 0 , 1 , 2 , 3 , and each time the t agent obtains a state S t   S ^ , where S is the set of potential states. The agent then chooses the action A t   A ^ ( S t ) , where A ^ ( S t ) represents the states set of actions. The agent will be rewarded R t , creating a new state S t + 1 [15]. The Markov decision process (MDP), Monte Carlo (MC) and temporal difference are three reinforcement learning techniques (TD). Q-learning develops the temporal difference. The action-value function is updated via Q-learning.
Q ( s , a ) = ( 1 α ) Q ( s , a ) + α ( r ( s , a ) + γ   m a x Q ( δ ( s , a ) , a )
The value of Q ( s , a ) is an action-value function after acting on a t from the state s t , as shown in Equation (1). Every a t   action done for the state s t will result in a r t reward. The parameter α   [ 0 ,   1 ] represents the learning rate. The discount argument has value 0 γ 1 . If γ is near to 0 ; the agent is more likely to pick an instant prize. If γ is near to 1, agents are more likely to consider long-term rewards [10]. In the next stage, Q-learning will update the value function based on the best action–value function.

2.2.3. Support Vector Machine

The support vector machine is a learning procedure that employs a fictitious space of linear functions in a high-dimensional feature space. The SVM classification aims to locate the optimum hyperplane in the input space that acts as a separator of two data classes [16]. The optimal dividing hyperplane between the two classes may be identified by measuring the hyperplane margin and locating its most significant point. The distance between the hyperplane and the nearest data from each class is defined as the margin. The most comparable data are referred to as the support vector.

2.2.4. Random Forest

Random forest is a decision tree-based ensemble learning system. This technique uses bootstrap data to generate many decision trees and randomly picks a subset of variables in each decision tree [17]. The following phases can be used to produce a random forest:
  • From the data, create an n-tree bootstrap sample.
  • For each bootstrap dataset, create a tree. Select an entry variable to divide at random in each tree node, then build the tree so that each terminal node has no less than a node size case.
  • Classify new data by aggregating the information from n-tree trees using a majority vote.
  • Determine the out-of-bag (OOB) error rate using data that was not included in the bootstrap sample.

2.2.5. Light Gradient Boosted Machine

The LightGBM adds an automated feature selection type and focuses on upgrading the cases with more considerable gradients to construct a gradient enhancement technique. The gradient-based one-side sampling (GOSS) and exclusive feature bundling (EFB) are two new techniques added to the LightGBM [18]. These strategies are intended to improve the efficiency and scalability of the GBDT considerably. The GOSS improved the gradient enhancement approach by focusing on the training instances that yield more significant gradients, which can speed up learning and minimize the computing complexity. The EFB combines exclusives with uncommon (usually zero) characteristics.

2.2.6. Extreme Gradient Boosting

The XGboost is a boosting approach that employs a series of decision trees, the construction of which is dependent on the preceding tree. By initializing the probability and then updating the weights on each tree that is produced, the XGboost produces a robust collection of classification trees. Sum up all the weights in each tree and then enter that number into the logistic function. The objective function will be minimized using the XGboost, as shown in Equation (2).
L ( t ) = i = 1 n l ( y i , y i ^ ( t + 1 ) + f t ( x i ) ) + Ω ( f t )
The log loss can be used as a loss function in a binary response class categorization. The omega equation is a regularization parameter that causes the model to prevent overfitting. The gain value may be calculated to find the splitting node—the formula for determining the gain value, as shown in Equation (3).
L s p l i t = 1 2 [ ( i I L g i ) 2 i I L h i + λ + ( i I R g i ) 2 i I L h R + λ ( i I g i ) 2 i I h i + λ   ] γ
In the XGboost, the values of g i and h i are the first and second derivatives of the loss function [19].

2.2.7. The Proposed Hybrid Algorithm

The feature selection procedure is aimed to significantly increase the detection system’s performance by selecting the ideal subset of characteristics. The feature selection approach employed the QBSO-FS model. First, the model’s input data was placed in a row with the column characteristics in each dataset. A binary vector of length n, where n is the number of original features, represented the answer. If the convenient feature was selected, the vector position was set to 1. Otherwise, it was set to 0. The BSO randomly generated the starting population and performed a series of operations to find a solution, a search region process and a local search.
The accuracy of the model’s convergence can significantly improve the use of the classification method and the balancing of the data using standardized ways on the classification model using StandardScaler. StandardScaler standardizes a feature by removing the mean and then scaling it to the unit variance [20]. The unit variance is calculated by dividing all the values by the standard deviation, as shown in Equation (4).
z = ( x u ) / s
Q-learning can efficiently obtain an optimal subset of the data to find a globally optimal solution with lower computational costs. According to previous studies, eight variables were initially selected, including flip, MaxChance, nBees, max iterations, LocIterations, α, ϒ and ϵ. The parameter value is shown in Table 1.
Figure 1 shows the flowchart for the proposed QBSO-FS models that use bee swarm optimization and Q-learning to select the optimal subset of the data features. The first step of the proposed model determined the feature selection methodology, followed by an optimization search process algorithm using bee swarm optimization integrated into the Q-learning algorithm. Finally, the essential features were selected. In BSO for the feature selection, a binary vector of length n was the number of input features. The BSO assigned a random initial solution named reference solution (refSol) and used it to determine a set of n solutions named the SearchRegion. Then, in each iteration of BSO, the best solutions of the parameter set were determined based on the prediction performance BSO-FS. At the final iteration of BSO, the optimal solutions of these parameters were obtained for the selected features. Then, these optimal solutions were used for classification using the test dataset. The termination criteria of QBSO-FS wass satisfied when the maximum number of iterations was reached.
BSO specifies how the search region was derived from the reference solutions by flipping n/flip bits in refSol. Flip is a practical value that influences the performance of the research process because it determines the distance between refSol and the solutions search region. The parameter MaxChances specifies the number of opportunities a search region is given before moving on to another. Its function is to prevent the stock from entering the local optima. Utilizing prudent intensification and diversification principles, MaxChances ensures a healthy equilibrium between exploitation and exploration. Each bee solution was then used as a starting point for a local search. After the search, the result was saved to the table Dance. In the next iteration, one of the solutions will be chosen as the new reference solution. The reference solutions are stored in the Taboo list in order to prevent cycles. Using BSO, it is possible to reduce the number of features to improve the classification accuracy.
The local search action in Figure 1b entailed adding or removing a feature from the current subset, which required flipping in the current solution. The reward rt associated with a pair (st, at) was computed using the classification accuracy as the primary criterion and the size of the subset of features as the secondary criterion. Only the actions that preserved the similarities between the current and optimal solutions were considered to reduce the search space. The adaptive search of the Q-learning algorithm capitalized on evaluating the previous solutions, causing the algorithm to converge at a local maximum.
The feature selection aimed to choose the best data by updating the minimum feature length from BestGlobal Solution. Algorithm 1 described the procedure for selecting the features using the QBSO-FS model. With a complete set of parameters, we generated a random initial reference solution, referred to as refSol. Lines 4–7 display the refSol embedding and a solution wass assigned to each bee for each refSol,. We used the local search with Q-learning to learn the action, state and reward representations for lines 8–20. In the classification model, the solutions were fitted and evaluated. Line 12 calculated the cost function of the solutions. The procedure ended when the solutions converged or whenthe maximum number of iterations was reached.
In addition, we designed a novel cost-aware solution based on an accuracy check. In contrast to the fitness solution that calculated the accuracy, we embeded the sampling of the data weight into the feature, which provided additional information. Cost-aware considers the fitness value and the subset of features to determine the evaluation function, as shown in Equation (5).
F C s = F s θ C s
There are relative options for evaluating the rewards from a cost-aware function. With the addition of these solutions, we can obtain improved evaluation solutions.
Algorithm 1: The algorithm of QBSO-FS model
    Input: A full feature set of heart datasets
    Output: Minimum feature length from the BestGlobal solution
  • Initially, all the parameters related
  • whilethe bestGlobalSol is not convergeddo
  •  Generate the initial solution randomly   refSol
  • for each refSol do
  •     Insert the refSol into the taboo list
  •     Determine the SearchRegion from the refSol
  •     Assign a solution from the SearchRegion to each bee
  •     for each bee b do
  •     Perform a local search using Q-Learning
  •     while not stopping criterion do
  •      for each state from solutions do
  •       Fit an evaluated model using a k-fold in classification model   cost function
  •      end for
  •      Observe the state, s, to get action, a
  •      Receive the reward, r
  •      Observe the new state
  •      Update the state
  •     end while
  •     Store the result in the table Dance
  •     end for
  •     Create the new refSol
  • end for
  •  Determine the bestGlobalSol from taboo list
  •  Append the GlobalSol to the solutions
  • end while
  • Store the BestGlobal solutions
  • Return the bestGlobalSol

2.3. Model Validation and Evaluation

A statistical approach called cross-validation split the dataset into many parts, one for testing and the rest for training. Each chunk was chosen for testing one of the folds, ensuring that all pieces were used for training and testing [21]. The model’s performance was evaluated using a 10-fold cross-validation. The 10-fold cross-validation randomly split all the data into ten pieces before reserving 10% of the data for testing. The testing process was also carried out with four classification models: the support vector machine, random forest, light gradient boosting machine and extreme gradient boosting. The best searching hyperparameters of each classifier were obtained using a grid search by trying out all the possible values. The area under the ROC (AUC) was used as a stopping metric for the investigation. The accuracy of the processing results were calculated using a confusion matrix to test the performance outcomes.
The confusion matrix contained information about the predictions and actual classification within system classification. True positive (TP) is defined as how many times the model correctly classified a positive case. True negative (TN) is defined as how many times the model correctly classified a negative point. False positive (FP) indicates how many negative cases our model wrongly predicted as positive cases. False negative (FN) indicates how many positive cases did our model wrongly predict as harmful. A confusion matrix was used to evaluate the system performance and define the value of the accuracy calculated using Equation (6). The precision is defined as how many of those predicted positives turned out to be actual positive cases, as illustrated in Equation (7). Recall defines how often the points were positive given that the issue was genuinely positive, as shown in Equation (8).
A c c u r a c y = T P + T N T P + T N + F P + F N
P r e c i s i o n = T P T P + F P
R e c a l l = T P T P + F N

3. Experiments and Results

In this section, we present the results of all the experiments, starting with the feature selection results and evaluate the classification of coronary heart disease detection, comparing the proposed approach to the existing one. All the experiments were carried out using the Python 3 programming language on a computer with an Intel(R) Xeon(R) CPU running at 2.30 GHz.

3.1. Results of Feature Selection

The feature selection approach of bee swarm optimization and Q-learning (QBSO-FS) generated several characteristics that were useful to the prediction model. Table 1 contains the hyperparameter parameters for the prediction model. When attempting to predict the results, the data distribution was critical. The expected attribute target distributions for the heart disease datasets are shown in Figure 2 and Figure 3.
From these datasets, 216 people in the Z-Alizadeh Sani dataset had coronary heart disease and 139 people in the Cleveland dataset had coronary heart disease. In the Statlog dataset, 119 patients suffered from coronary heart disease. In the cardiovascular dataset, 4260 people had coronary heart disease. Consequently, the datasets were almost evenly distributed in terms of target. The proposed feature selection algorithm, based on the QBSO-FS, recognized the features that can be selected for model training, as listed in Table 2, as the number of the features chosen for each dataset with the most significant classification accuracy.
All the datasets were successfully selected using the bee swarm optimization and Q-learning (QBSO-FS) approaches. The SVM classification yielded the most significant classification accuracy results in the feature selection, as shown in Table 2. The Z-Alizadeh Sani dataset yielded 24 characteristics with a 0.927 accuracy. The Cleveland dataset yielded six characteristics with a 0.845 accuracy. With an accuracy of 0.856, the Statlog dataset generated seven parts and the cardiovascular dataset obtained four elements, producing an accuracy of 0.730.
Table 3 analyzes the performance of the prediction model outcomes when the feature selection was combined with the SVM classification approach. These results indicate that the QBSO-FS feature selection can improve the prediction model performance with more features. When employing the QBSO-FS technique rather than the BSO-FS approach, the Z-Alizadeh dataset contained more characteristics and the execution time was quicker. Q-learning was used to speed up the convergence for more features. The QBSO-FS model outperformed BSO-FS when the results of the specified features were included in the calculated expenses. The examination cost given by the clinical laboratory for the specified characteristics was used to compute the estimated cost.
Figure 4 shows that the model may still train and be better and more accurate for up to ten executions. For ten iterations on ten executions, the average and most excellent accuracy results were nearly identical and steady.

3.2. Evaluation of the Classification of Coronary Heart Disease Detection

The best model’s selected characteristics were utilized in the model testing step for each classification technique. The grid search selected the best hyperparameter for the classification model and the cross-validation technique was used in the testing phase, with a 10-fold validation. The AUC parameter value was used to evaluate the prediction model’s performance. The purpose of the assessment was to examine the effectiveness of the QBSO-FS feature selection method in identifying the relevant characteristics.
The performance of the feature selection prediction model utilizing the SVM classification approach is compared in Table 4. These findings suggested that the QBSO-FS feature selection can improve the prediction model performance with additional characteristics and the AUC value. In the Z-Alizadeh dataset, the difference in performance between the model without the feature selection and the model with the feature selection had an incredible range of 0.181. As a result, the prediction model based on the SVM classification was superior for the detection system.
Table 5 compares the performance of the feature selection prediction model with and without the random forest classification approach. The results show that the Cleveland dataset feature selection model outperformed the model without the feature selection.
The performance of the feature selection prediction model utilizing the LightGBM classification approach is compared in Table 6. The results show that the feature selection model outperformed the model without the feature selection for the datasets with fewer characteristics.
The performance of the feature selection prediction model employing the XGBoost classification approach is compared in Table 7. The results indicate that the feature selection model outperformed the model without the feature selection for the Cleveland dataset.
Furthermore, in terms of the accuracy, AUC and quantity of the selected features, our proposed model was compared with some prior studies, as shown in Table 8, Table 9, Table 10 and Table 11. The model was tested using the Z-Alizadeh Sani dataset in Table 8. Our proposed QBSO-FS-SVM model selected a fewer number of features. Regarding the AUC, the proposed model performed better with a value of 0.941. In Table 9, our proposed model was still comparable in the Cleveland datasets. It performed better than MFFSA-AFSA [20] in terms of the accuracy and AUC. The best classification accuracy on the Cleveland and Stalog were found using the Chi-Square-SVM method. Table 11 shows the best classification accuracy on the cardiovascular dataset for the ML ensemble method.
The Z-Alizadeh Sani dataset yielded the best accuracy, precision and recall values, as shown in Table 12. Our proposed QBSO-FS-SVM model for the Z-Alizadeh Sani dataset, which includes more characteristics, performed better and more consistently.

4. Discussion and Limitations

Compared with recently published works based on the wrapper approach, the results showed that the proposed study reached better accuracies with minor subsets of the features. We noticed that the datasets with the most significant numbers were much more efficient than BSO-FS. Therefore, our work will positively impact optimizing the reduced number of features. Nevertheless, when using smaller datasets to detect heart disease, our proposed model’s time complexity increased slightly. The runtime was slightly increased as the depth values of the tuning parameter were increased. If we use larger datasets in the future, the time complexity may vary depending on the size of the data, resulting in either a decreasing or increasing mode depending on the model used.

5. Conclusions

The proposed study presented a methodology for diagnosing heart disease through a feature subset of dimensionality reduction. To reduce the dimensions of the feature set by performing a feature selection. The feature selection method using bee swarm optimization and Q-learning (QBSO-FS) produced the best feature subset and classification through the SVM. The prediction model was validated for the Z-Alizadeh Sani, Statlog and Cleveland datasets. The evaluation measured the accuracy, precision and recall to see the improvements in the prediction results. In this study, the QBSO-FS model worked well for predicting heart disease.
For future works, we will further study to apply a feature selection model for larger datasets with an emphasis on reducing the execution time by picking the parameters to achieve the best outcomes. The performance can be improved by combining large datasets with hybrid classification models embedded in search algorithms on heart disease datasets.

Author Contributions

Conceptualization, Y.A.Z.A.F. and W.W.; methodology, Y.A.Z.A.F. and W.W.; writing—original draft preparation, Y.A.Z.A.F.; writing—review and editing, W.W. and E.S.; supervision, W.W. and E.S. All authors have read and agreed to the published version of the manuscript.

Funding

This research received no external funding.

Institutional Review Board Statement

Not applicable.

Informed Consent Statement

Not applicable.

Data Availability Statement

The data that support the findings of this study are available at UCI Machine Learning Repository.

Conflicts of Interest

The authors declare no conflict of interest.

References

  1. Verma, L.; Srivastava, S.; Negi, P.C. A Hybrid Data Mining Model to Predict Coronary Artery Disease Cases Using Non-Invasive Clinical Data. J. Med. Syst. 2016, 40, 178. [Google Scholar] [CrossRef] [PubMed]
  2. Kolukisa, B.; Hacilar, H.; Goy, G.; Kus, M.; Bakir-Gungor, B.; Aral, A.; Gungor, V.C. Evaluation of Classification Algorithms, Linear Discriminant Analysis and a New Hybrid Feature Selection Methodology for the Diagnosis of Coronary Artery Disease. In Proceedings of the 2018 IEEE International Conference on Big Data (Big Data), Seattle, WA, USA, 10–13 December 2018; IEEE: Seattle, WA, USA, 2018; pp. 2232–2238. [Google Scholar]
  3. Tama, B.A.; Im, S.; Lee, S. Improving an Intelligent Detection System for Coronary Heart Disease Using a Two-Tier Classifier Ensemble. BioMed Res. Int. 2020, 2020, 9816142. [Google Scholar] [CrossRef] [PubMed]
  4. Alqahtani, A.; Alsubai, S.; Sha, M.; Vilcekova, L.; Javed, T. Cardiovascular Disease Detection using Ensemble Learning. Comput. Intell. Neurosci. 2022, 2022, 5267498. [Google Scholar] [CrossRef] [PubMed]
  5. Amin, S.U.; Agarwal, K.; Beg, R. Genetic neural network based data mining in prediction of heart disease using risk factors. In Proceedings of the 2013 IEEE Conference on Information and Communication Technologies, Thuckalay, India, 11–12 April 2013; IEEE: Thuckalay, India, 2013; pp. 1227–1231. [Google Scholar]
  6. Arabasadi, Z.; Alizadehsani, R.; Roshanzamir, M.; Moosaei, H.; Yarifard, A.A. Computer aided decision making for heart disease detection using hybrid neural network-Genetic algorithm. Comput. Methods Programs Biomed. 2017, 141, 19–26. [Google Scholar] [CrossRef] [PubMed]
  7. Subanya, B.; Rajalaxmi, R.R. Feature selection using Artificial Bee Colony for cardiovascular disease classification. In Proceedings of the 2014 International Conference on Electronics and Communication Systems (ICECS), Coimbatore, India, 13–14 February 2014; IEEE: Coimbatore, India, 2014; pp. 1–6. [Google Scholar]
  8. Sadeg, S.; Drias, H. A selective approach to parallelise Bees Swarm Optimisation metaheuristic: Application to MAX-W-SAT. IJICA 2007, 1, 146. [Google Scholar] [CrossRef]
  9. Sadeg, S.; Hamdad, L.; Benatchba, K.; Habbas, Z. BSO-FS: Bee Swarm Optimization for Feature Selection in Classification. In Advances in Computational Intelligence; Rojas, I., Joya, G., Catala, A., Eds.; Lecture Notes in Computer Science; Springer International Publishing: Cham, Switzerland, 2015; Volume 9094, pp. 387–399. ISBN 978-3-319-19257-4. [Google Scholar]
  10. Sadeg, S.; Hamdad, L.; Remache, A.R.; Karech, M.N.; Benatchba, K.; Habbas, Z. QBSO-FS: A Reinforcement Learning Based Bee Swarm Optimization Metaheuristic for Feature Selection. In Advances in Computational Intelligence; Rojas, I., Joya, G., Catala, A., Eds.; Lecture Notes in Computer Science; Springer International Publishing: Cham, Switzerland, 2019; Volume 11507, pp. 785–796. ISBN 978-3-030-20517-1. [Google Scholar]
  11. Dua, D.; Graff, C. UCI Machine Learning Repository. 2017. Available online: https://archive.ics.uci.edu/ml/index.php (accessed on 5 April 2022).
  12. Alizadehsani, R.; Habibi, J.; Hosseini, M.J.; Mashayekhi, H.; Boghrati, R.; Ghandeharioun, A.; Bahadorian, B.; Sani, Z.A. A data mining approach for diagnosis of coronary artery disease. Comput. Methods Programs Biomed. 2013, 111, 52–61. [Google Scholar] [CrossRef] [PubMed]
  13. Dipto, I.C.; Islam, T.; Rahman, H.M.M.; Rahman, M.A. Comparison of Different Machine Learning Algorithms for the Prediction of Coronary Artery Disease. JDAIP 2020, 08, 41–68. [Google Scholar] [CrossRef] [Green Version]
  14. Akbari, R.; Mohammadi, A.; Ziarati, K. A powerful bee swarm optimization algorithm. In Proceedings of the 2009 IEEE 13th International Multitopic Conference, Islamabad, Pakistan, 14–15 December 2009; IEEE: Islamabad, Pakistan, 2009; pp. 1–6. [Google Scholar]
  15. Ardiansyah, A.; Rainarli, E. Implementasi Q-Learning dan Backpropagation pada Agen yang Memainkan Permainan Flappy Bird. J. Nas. Tek. Elektro Dan Teknol. Inf. (JNTETI) 2017, 6, 1–7. [Google Scholar] [CrossRef] [Green Version]
  16. Nugroho, A.S.; Witarto, A.B.; Handoko, D. Teori dan Aplikasinya dalam Bioinformatika1. 2003. Available online: http://asnugroho.net/papers/ikcsvm.pdf (accessed on 9 April 2022).
  17. Ali, J.; Khan, R.; Ahmad, N.; Maqsood, I. Random Forests and Decision Trees. Int. J. Comput. Sci. Issues (IJCSI) 2012, 9, 272. [Google Scholar]
  18. Ke, G.; Meng, Q.; Finley, T.; Wang, T.; Chen, W.; Ma, W.; Ye, Q.; Liu, T.-Y. LightGBM: A Highly Efficient Gradient Boosting Decision Tree. In Advances in Neural Information Processing Systems; Guyon, I., Luxburg, U.V., Bengio, S., Wallach, H., Fergus, R., Vishwanathan, S., Garnett, R., Eds.; Curran Associates, Inc.: Red Hook, NY, USA, 2017; Volume 30. [Google Scholar]
  19. Chen, T.; Guestrin, C. XGBoost: A Scalable Tree Boosting System. In Proceedings of the 22nd ACM SIGKDD International Conference on Knowledge Discovery and Data Mining, San Francisco, CA, USA, 13–17 August 2016; pp. 785–794. [Google Scholar]
  20. Kuhn, M.; Johnson, K. Applied Predictive Modeling; Springer: New York, NY, USA, 2013; ISBN 978-1-4614-6848-6. [Google Scholar]
  21. Ali, S.A.; Raza, B.; Malik, A.K.; Shahid, A.R.; Faheem, M.; Alquhayz, H.; Kumar, Y.J. An Optimally Configured and Improved Deep Belief Network (OCI-DBN) Approach for Heart Disease Prediction Based on Ruzzo–Tompa and Stacked Genetic Algorithm. IEEE Access 2020, 8, 65947–65958. [Google Scholar] [CrossRef]
  22. Nandakumar, P.; Narayan, S. Cardiac disease detection using cuckoo search enabled deep belief network. Intell. Syst. Appl. 2022, 16, 200131. [Google Scholar]
  23. Shahid, A.H.; Singh, M.P. A Novel Approach for Coronary Artery Disease Diagnosis using Hybrid Particle Swarm Optimization based Emotional Neural Network. Biocybern. Biomed. Eng. 2020, 40, 1568–1585. [Google Scholar] [CrossRef]
  24. Gupta, A.; Arora, H.S.; Kumar, R.; Raman, B. DMHZ: A Decision Support System Based on Machine Computational Design for Heart Disease Diagnosis Using Z-Alizadeh Sani Dataset. In Proceedings of the 2021 International Conference on Information Networking (ICOIN), Jeju Island, Republic of Korea, 13–16 January 2021; IEEE: Jeju Island, Republic of Korea, 2021; pp. 818–823. [Google Scholar]
  25. Shah, S.M.S.; Shah, F.A.; Hussain, S.A.; Batool, S. Support Vector Machines-based Heart Disease Diagnosis using Feature Subset, Wrapping Selection and Extraction Methods. Comput. Electr. Eng. 2020, 84, 106628. [Google Scholar] [CrossRef]
  26. Sarra, R.R.; Dinar, A.M.; Mohammed, M.A.; Abdulkareem, K.H. Enhanced Heart Disease Prediction Based on Machine Learning and χ2 Statistical Optimal Feature Selection Model. Designs 2022, 6, 87. [Google Scholar] [CrossRef]
Figure 1. A flowchart of the proposed QBSO-FS models. (a) the bee swarm optimization approach; (b) the Q-learning approach.
Information 14 00015 g001
Figure 2. Heart disease classes. (a) the Z-Alizadeh Sani dataset; (b) the Cleveland dataset.
Information 14 00015 g002
Figure 3. Heart disease classes. (a) the Statlog dataset; (b) the cardiovascular dataset.
Information 14 00015 g003
Figure 4. Accuracies of the ten solutions obtained on 10 executions on the Z-Alizadeh Sani dataset.
Information 14 00015 g004
Table 1. The selection of the parameters value.
ParameterValue
BSO 1Flip5
MaxChance3
nBees10
maxIterations10
LocIterations10
Q-learningα0.9
ϒ0.1
ϵ0.1
1 BSO: the bee swarm optimization approach.
Table 2. Number of selected features for each heart disease dataset using the SVM classification.
DatasetFeaturesSelected FeaturesFeature Name
Z-Alizadeh Sani5424Age, weight, sex, diabetes mellitus, hypertension, current smoker, family history, chronic renal failure, cerebrovascular accident, congestive heart failure, dyslipidemia, pulse rate ppm, weak peripheral pulse, typical chest pain, dyspnea, nonanginal chest pain, low threshold angina, Q-wave, ST elevation, T-inversion, left ventricular hyperthrophy, poor R-wave progression, triglyceride mg/dL, hemoglobin g/dL, K (Potassium), white blood cell, region with RWMA, valvular heart disease.
Cleveland136Chest pain type, serum cholestoral, resting electrocardiographic results, the slope of the peak ST segment, number of major vessels, thalium stress test result.
Statlog137Age, chest pain type, resting blood pressure, maximum heart rate, exercise-induced angina, number of major vessels, defect type
Cardiovascular118Age, height, weight, systolic blood pressure, cholesterol, glucose, smoking, physical activity
Table 3. Comparison method between QBSO-FS and BSO-FS.
DatasetQBSO-FS 1BSO-FS 2
AccSelected FeaturesExecution TimeEstimated CostAccSelected FeaturesExecution TimeEstimated Cost
Z-Alizadeh Sani0.92724.03740.20725,930.00.93128.05659.90769,080.0
Cleveland0.8456.0179.6111,085,000.00.8456.0110.4111,085,000.0
Statlog0.8567.0155.6611,020,000.00.8567.074.6811,020,000,0
Cardiovascular0.7308.012,591.23184,100.00.7308.06021.55184,100.0
1 QBSO-FS: the bee swarm optimization and Q-learning feature selection. 2 BSO-FS: the bee swarm optimization feature selection.
Table 4. Performance accuracy using the SVM classification.
Datasetwithout Feature Selectionwith Feature SelectionAUC
Z-Alizadeh Sani0.720.9010.941
Cleveland0.780.8440.901
Statlog0.790.8480.881
Cardiovascular0.730.7300.789
Table 5. Performance accuracy using the random forest classification.
Datasetwithout Feature Selectionwith Feature SelectionAUC
Z-Alizadeh Sani0.860.8650.926
Cleveland0.840.8540.912
Statlog0.840.8330.880
Cardiovascular0.730.7240.766
Table 6. Performance accuracy using the LightGBM classification.
Datasetwithout Feature Selectionwith Feature SelectionAUC
Z-Alizadeh Sani0.890.8780.931
Cleveland0.830.8610.918
Statlog0.860.8410.908
Cardiovascular0.730.7280.790
Table 7. Performance accuracy using the XGBoost classification.
Datasetwithout Feature Selectionwith Feature SelectionAUC
Z-Alizadeh Sani0.870.8650.894
Cleveland0.830.8450.884
Statlog0.830.8150.874
Cardiovascular0.730.7240.767
Table 8. Proposed model comparative analysis with the current state-of-the-art methods using the Z-Alizadeh Sani dataset.
StudyTechniqueSelected Features AccuracyAUC
[22]DBN + CSANot Reported0.8980.87
[23]PSO-EmNN220.883Not Reported
[24]PCA   MCA + RFPCA = 12, MCA = 700.9470.923
ProposedQBSO-FS 240.9010.941
Table 9. Proposed model comparative analysis with the current state-of-the-art methods using the Cleveland dataset.
StudyTechniqueSelected Features AccuracyAUC
[22]DBN + CSANot Reported0.8930.88
[23]PSO-EmNN70.84Not Reported
[25]MFFSA-AFSA90.8290.885
[26]Chi-square-SVM60.8950.900
ProposedQBSO−FS60.8440.901
Table 10. Proposed model comparative analysis with the current state-of-the-art methods using the Statlog dataset.
StudyTechniqueSelected Features AccuracyAUC
[22]DBN + CSANot Reported0.8910.87
[23]PSO-EmNN80.852Not Reported
[26]Chi-square-SVM60.8970.910
ProposedQBSO-FS70.8480.881
Table 11. Proposed model comparative analysis with the current state-of-the-art methods using the cardiovascular dataset.
StudyTechniqueSelected Features AccuracyAUC
[4]ML ensembleNot Reported0.8870.930
ProposedQBSO-FS80.7300.796
Table 12. Confusion matrix result.
DatasetAccuracyPrecisionRecallAUC
Z-Alizadeh Sani0.9010.940.930.941
Cleveland0.8440.860.800.901
Statlog0.8480.870.780.881
Cardiovascular0.7300.760.680.789
Disclaimer/Publisher’s Note: The statements, opinions and data contained in all publications are solely those of the individual author(s) and contributor(s) and not of MDPI and/or the editor(s). MDPI and/or the editor(s) disclaim responsibility for any injury to people or property resulting from any ideas, methods, instructions or products referred to in the content.

