
Effect of Oil Type Used in Neapolitan Pizza TSG Topping on Its Physical, Chemical, and Sensory Properties

 , , ,
, , ,  and
and 
Abstract
1. Introduction
2. Materials and Methods
2.1. Sampling
2.2. Topping Ingredient Analyses
2.3. Pizza Topping Mix and Pizza Sample Analyses
2.3.1. Pizza Topping Mix Qualitative Analyses
2.3.2. Determination of Volatile Compounds of Pizza Samples
2.3.3. Lipid Extraction
2.3.4. Determination of Polar Compounds
2.3.5. Sensory Analysis of Pizza Samples
2.4. Statistical Analysis
3. Results
3.1. Topping Ingredient Analyses
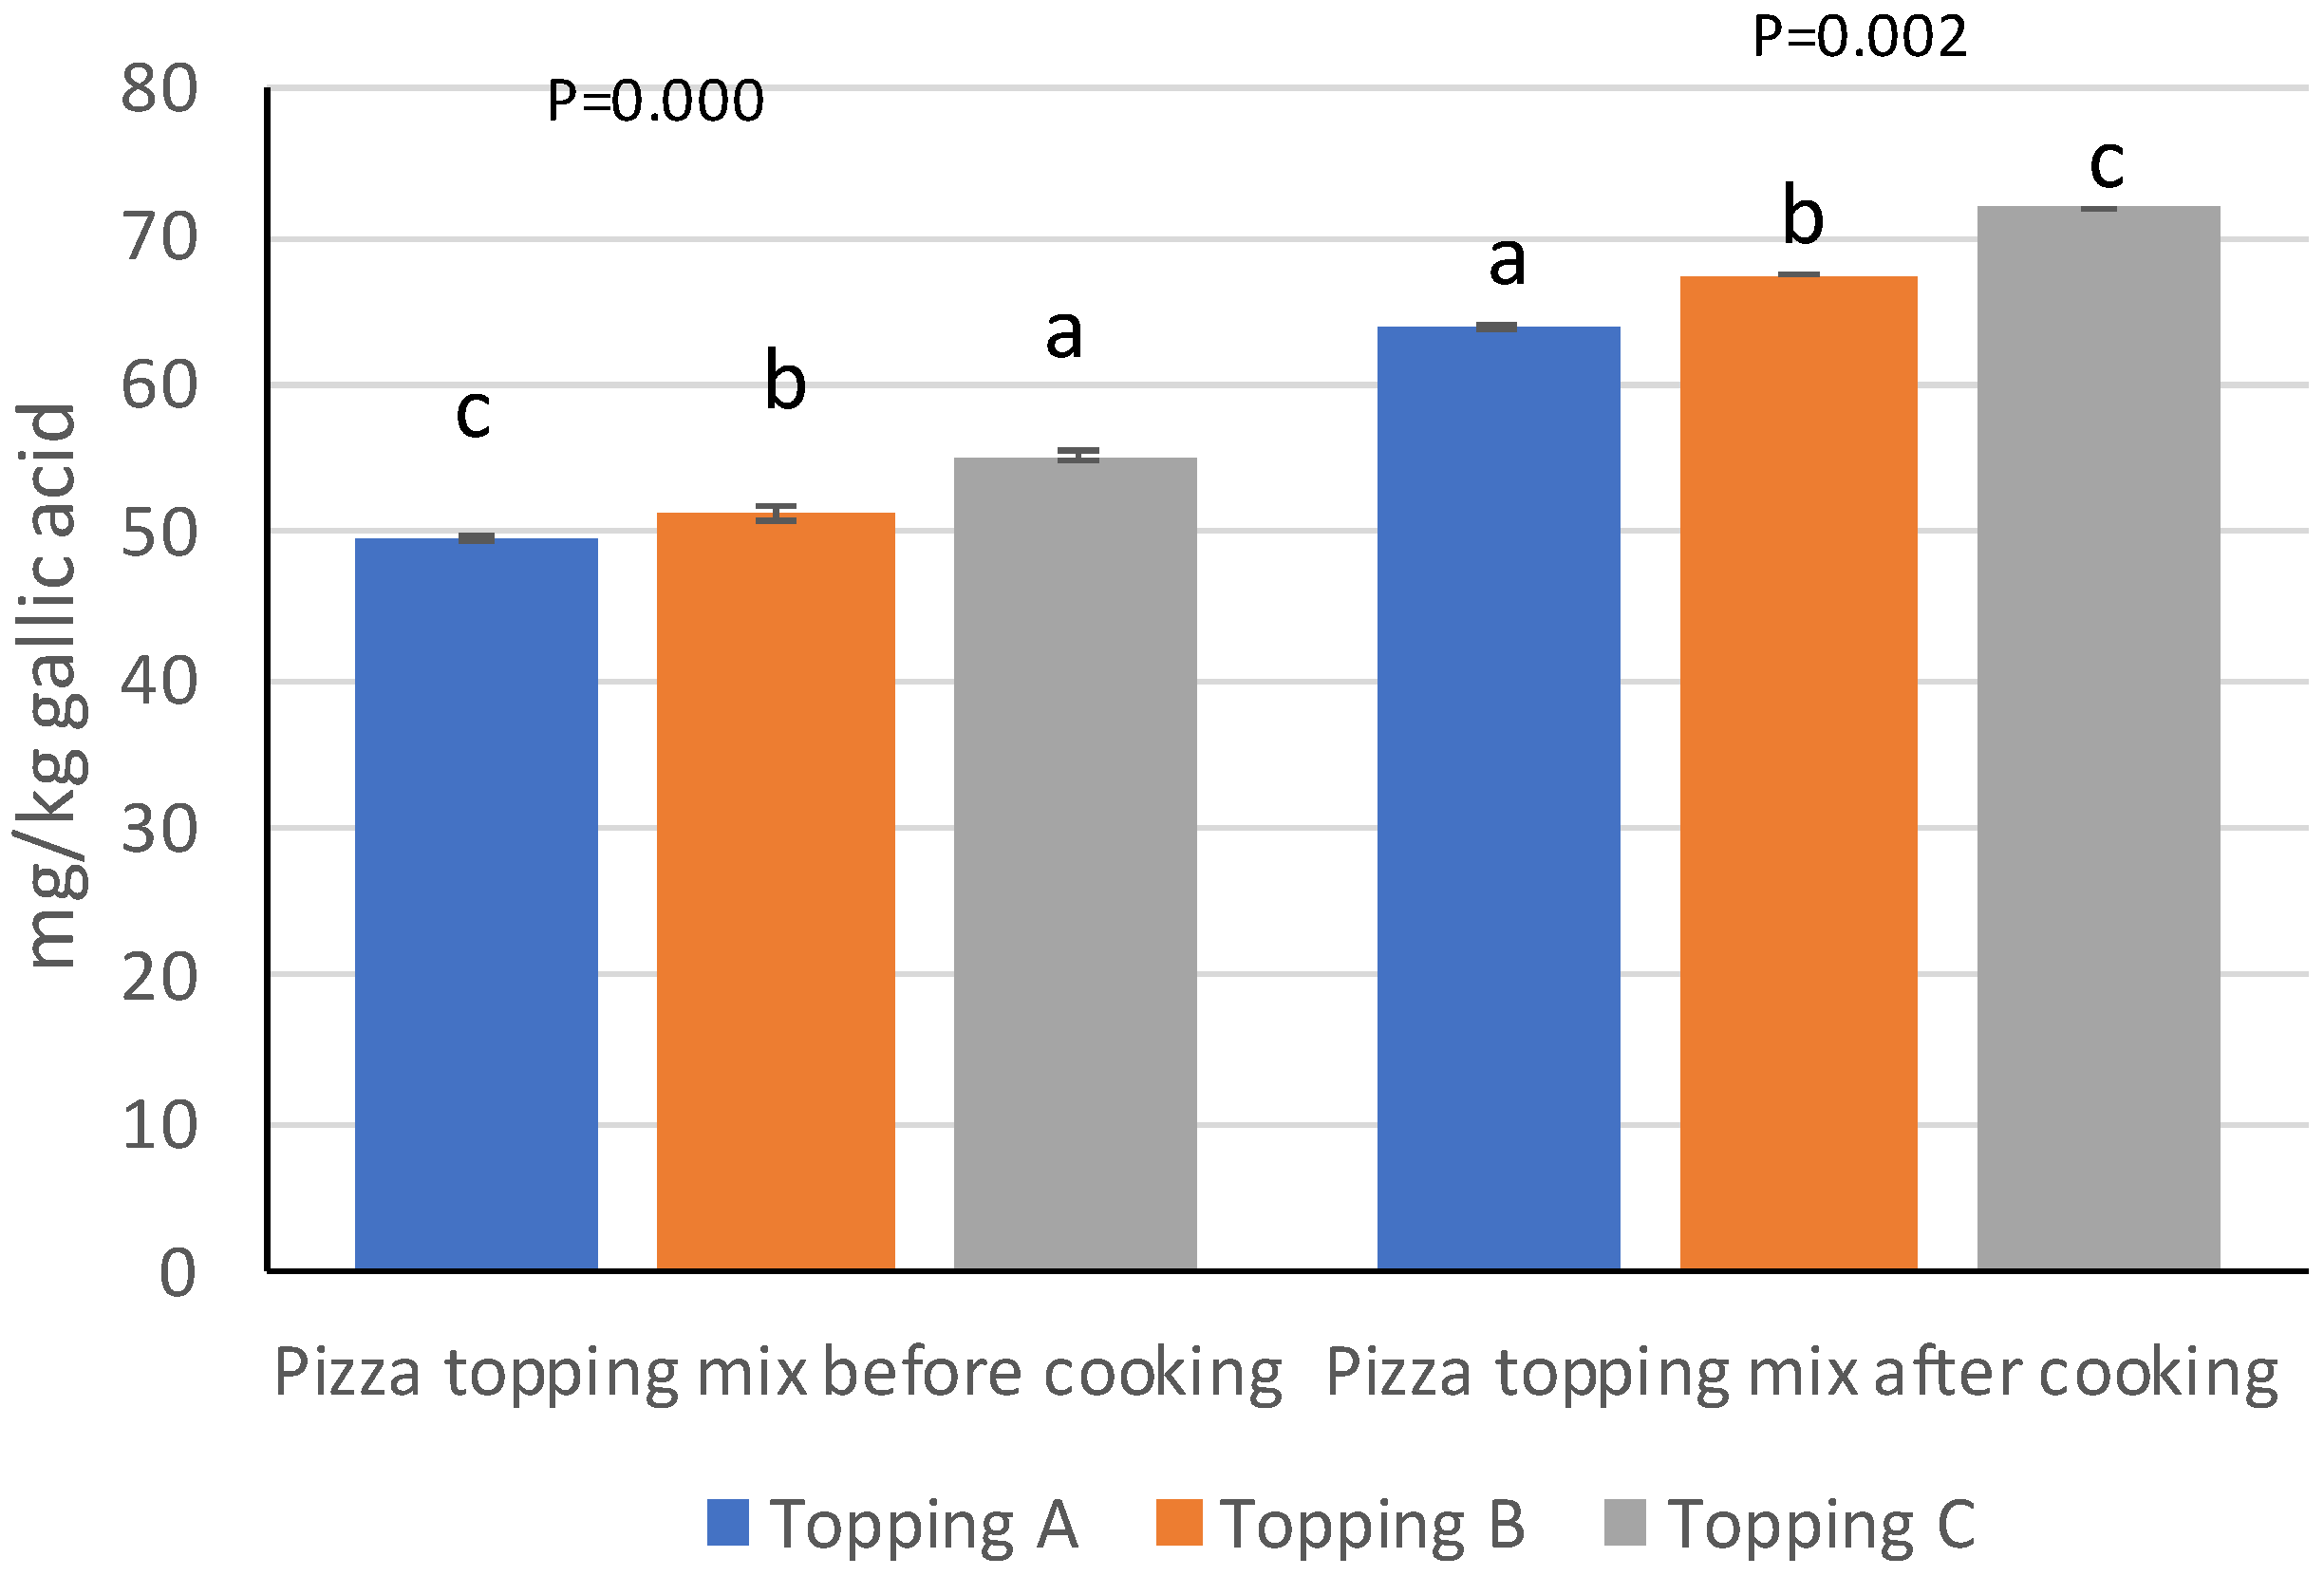
3.2. Pizza Topping Mix Analyses
3.3. Volatile Compounds of Pizza Samples
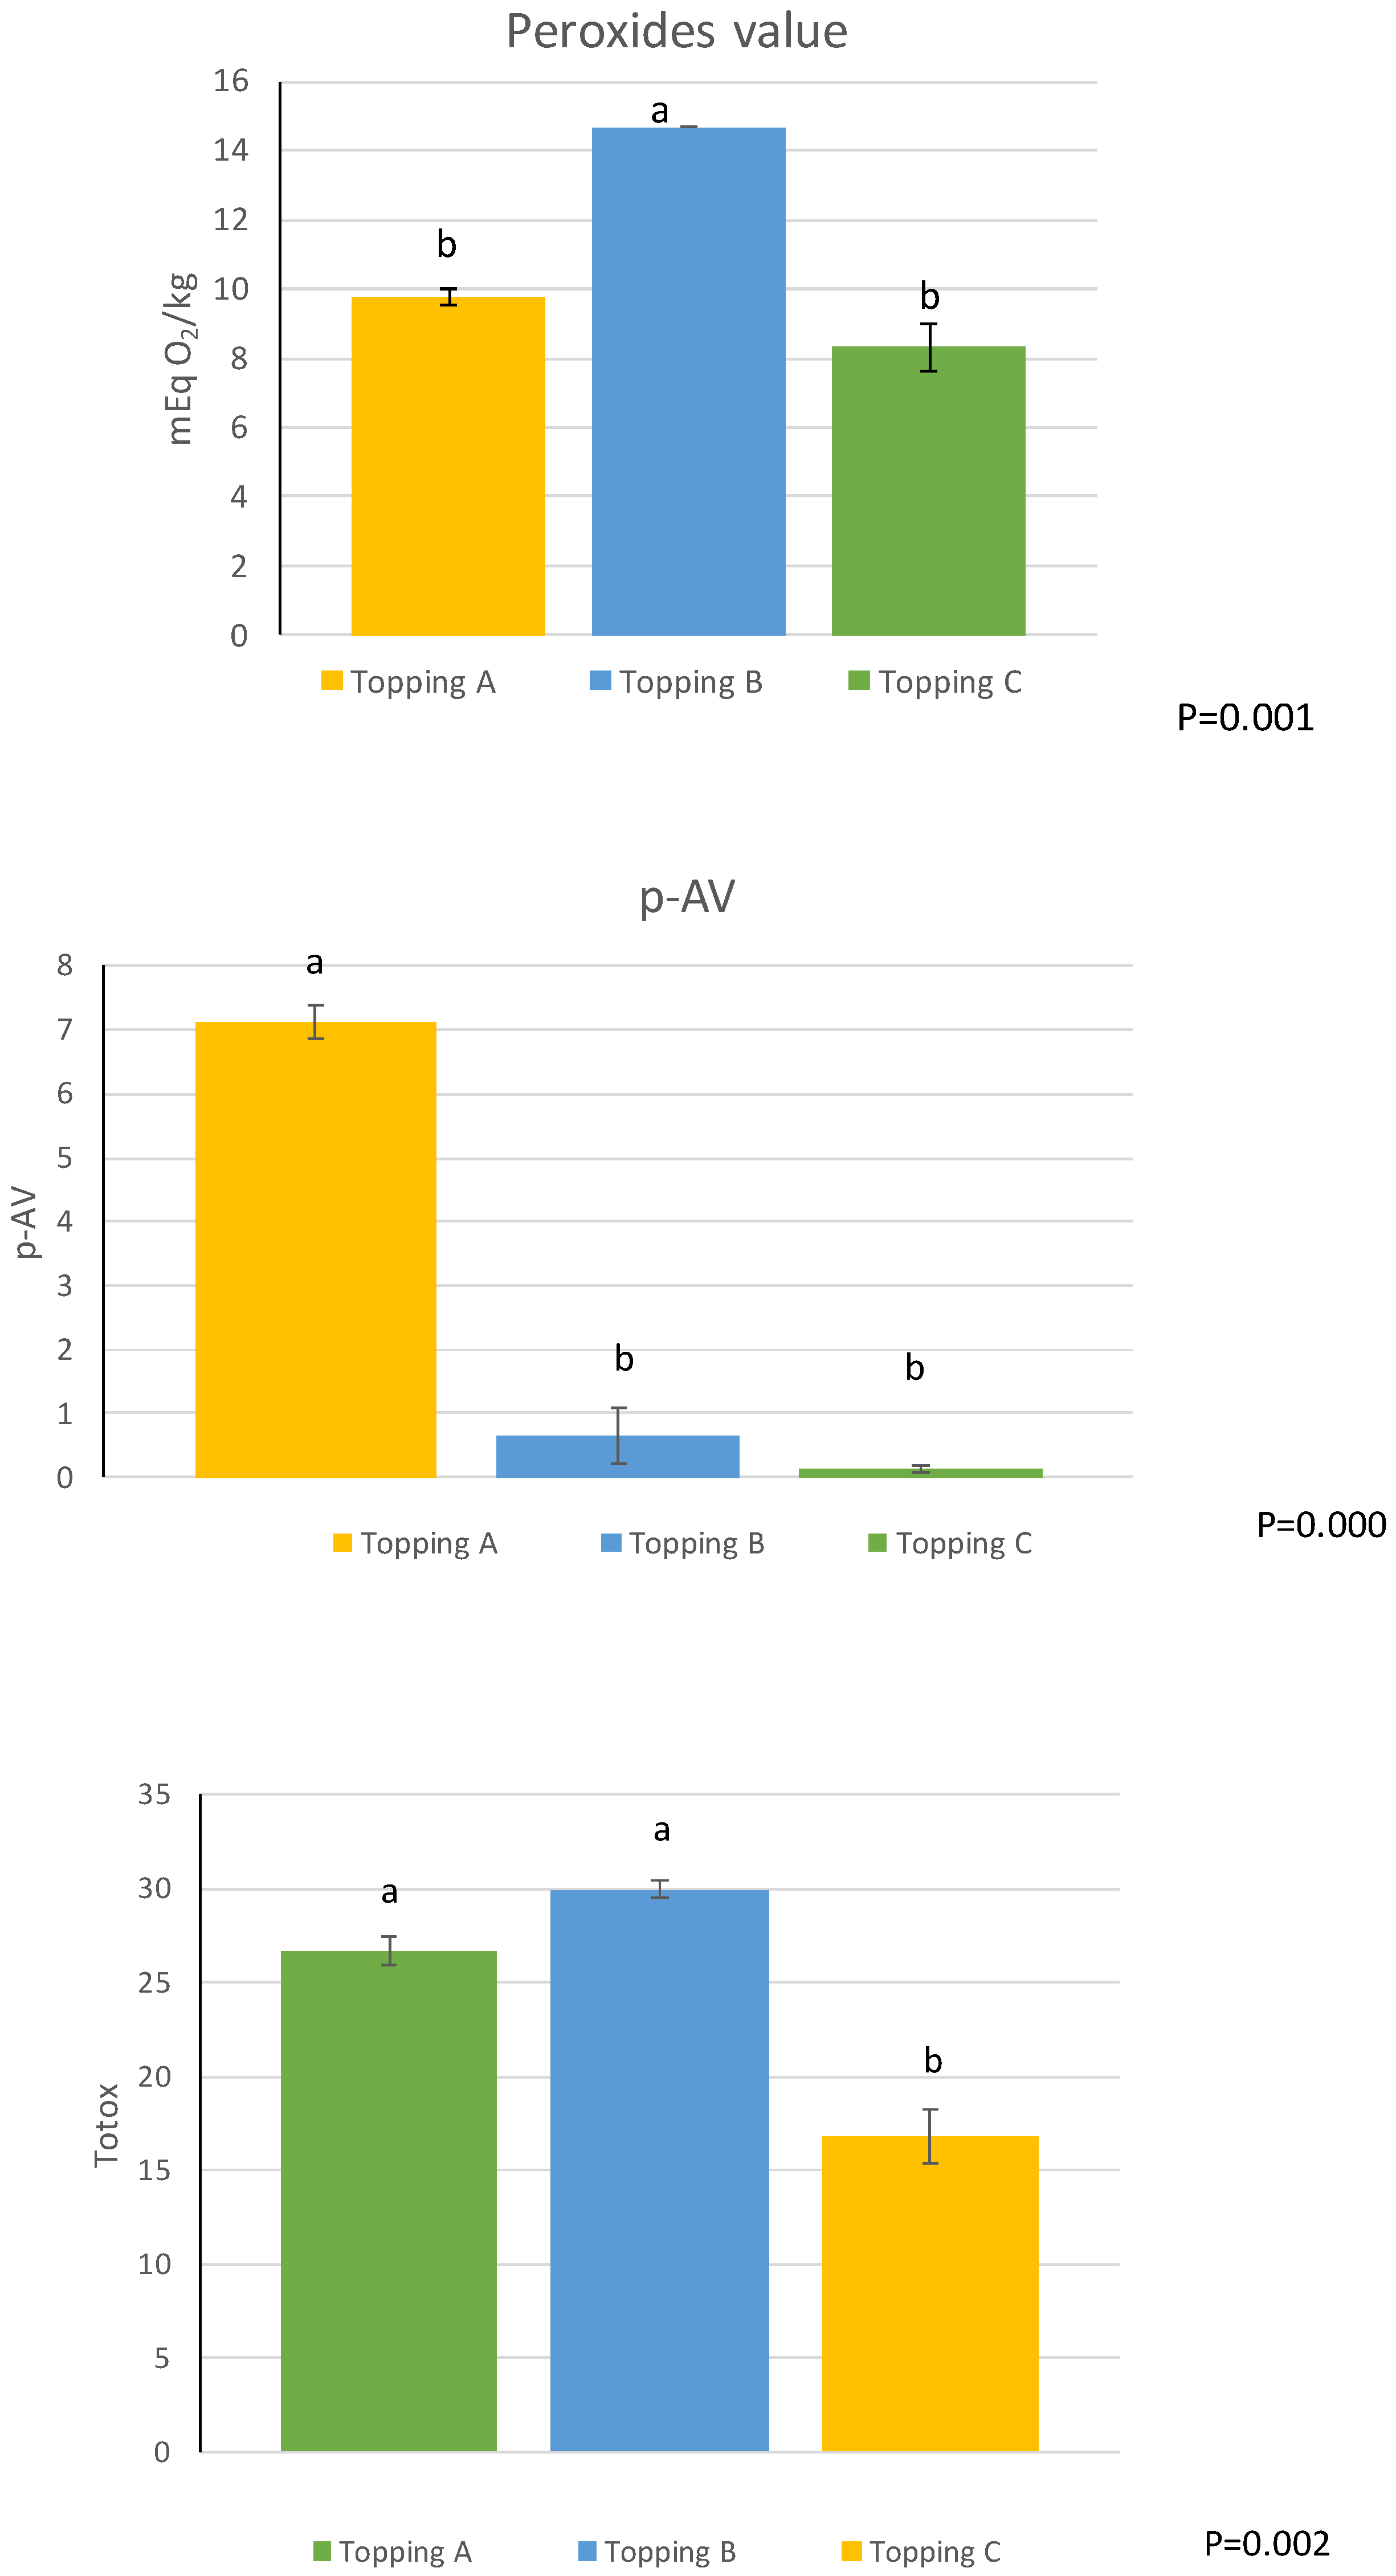
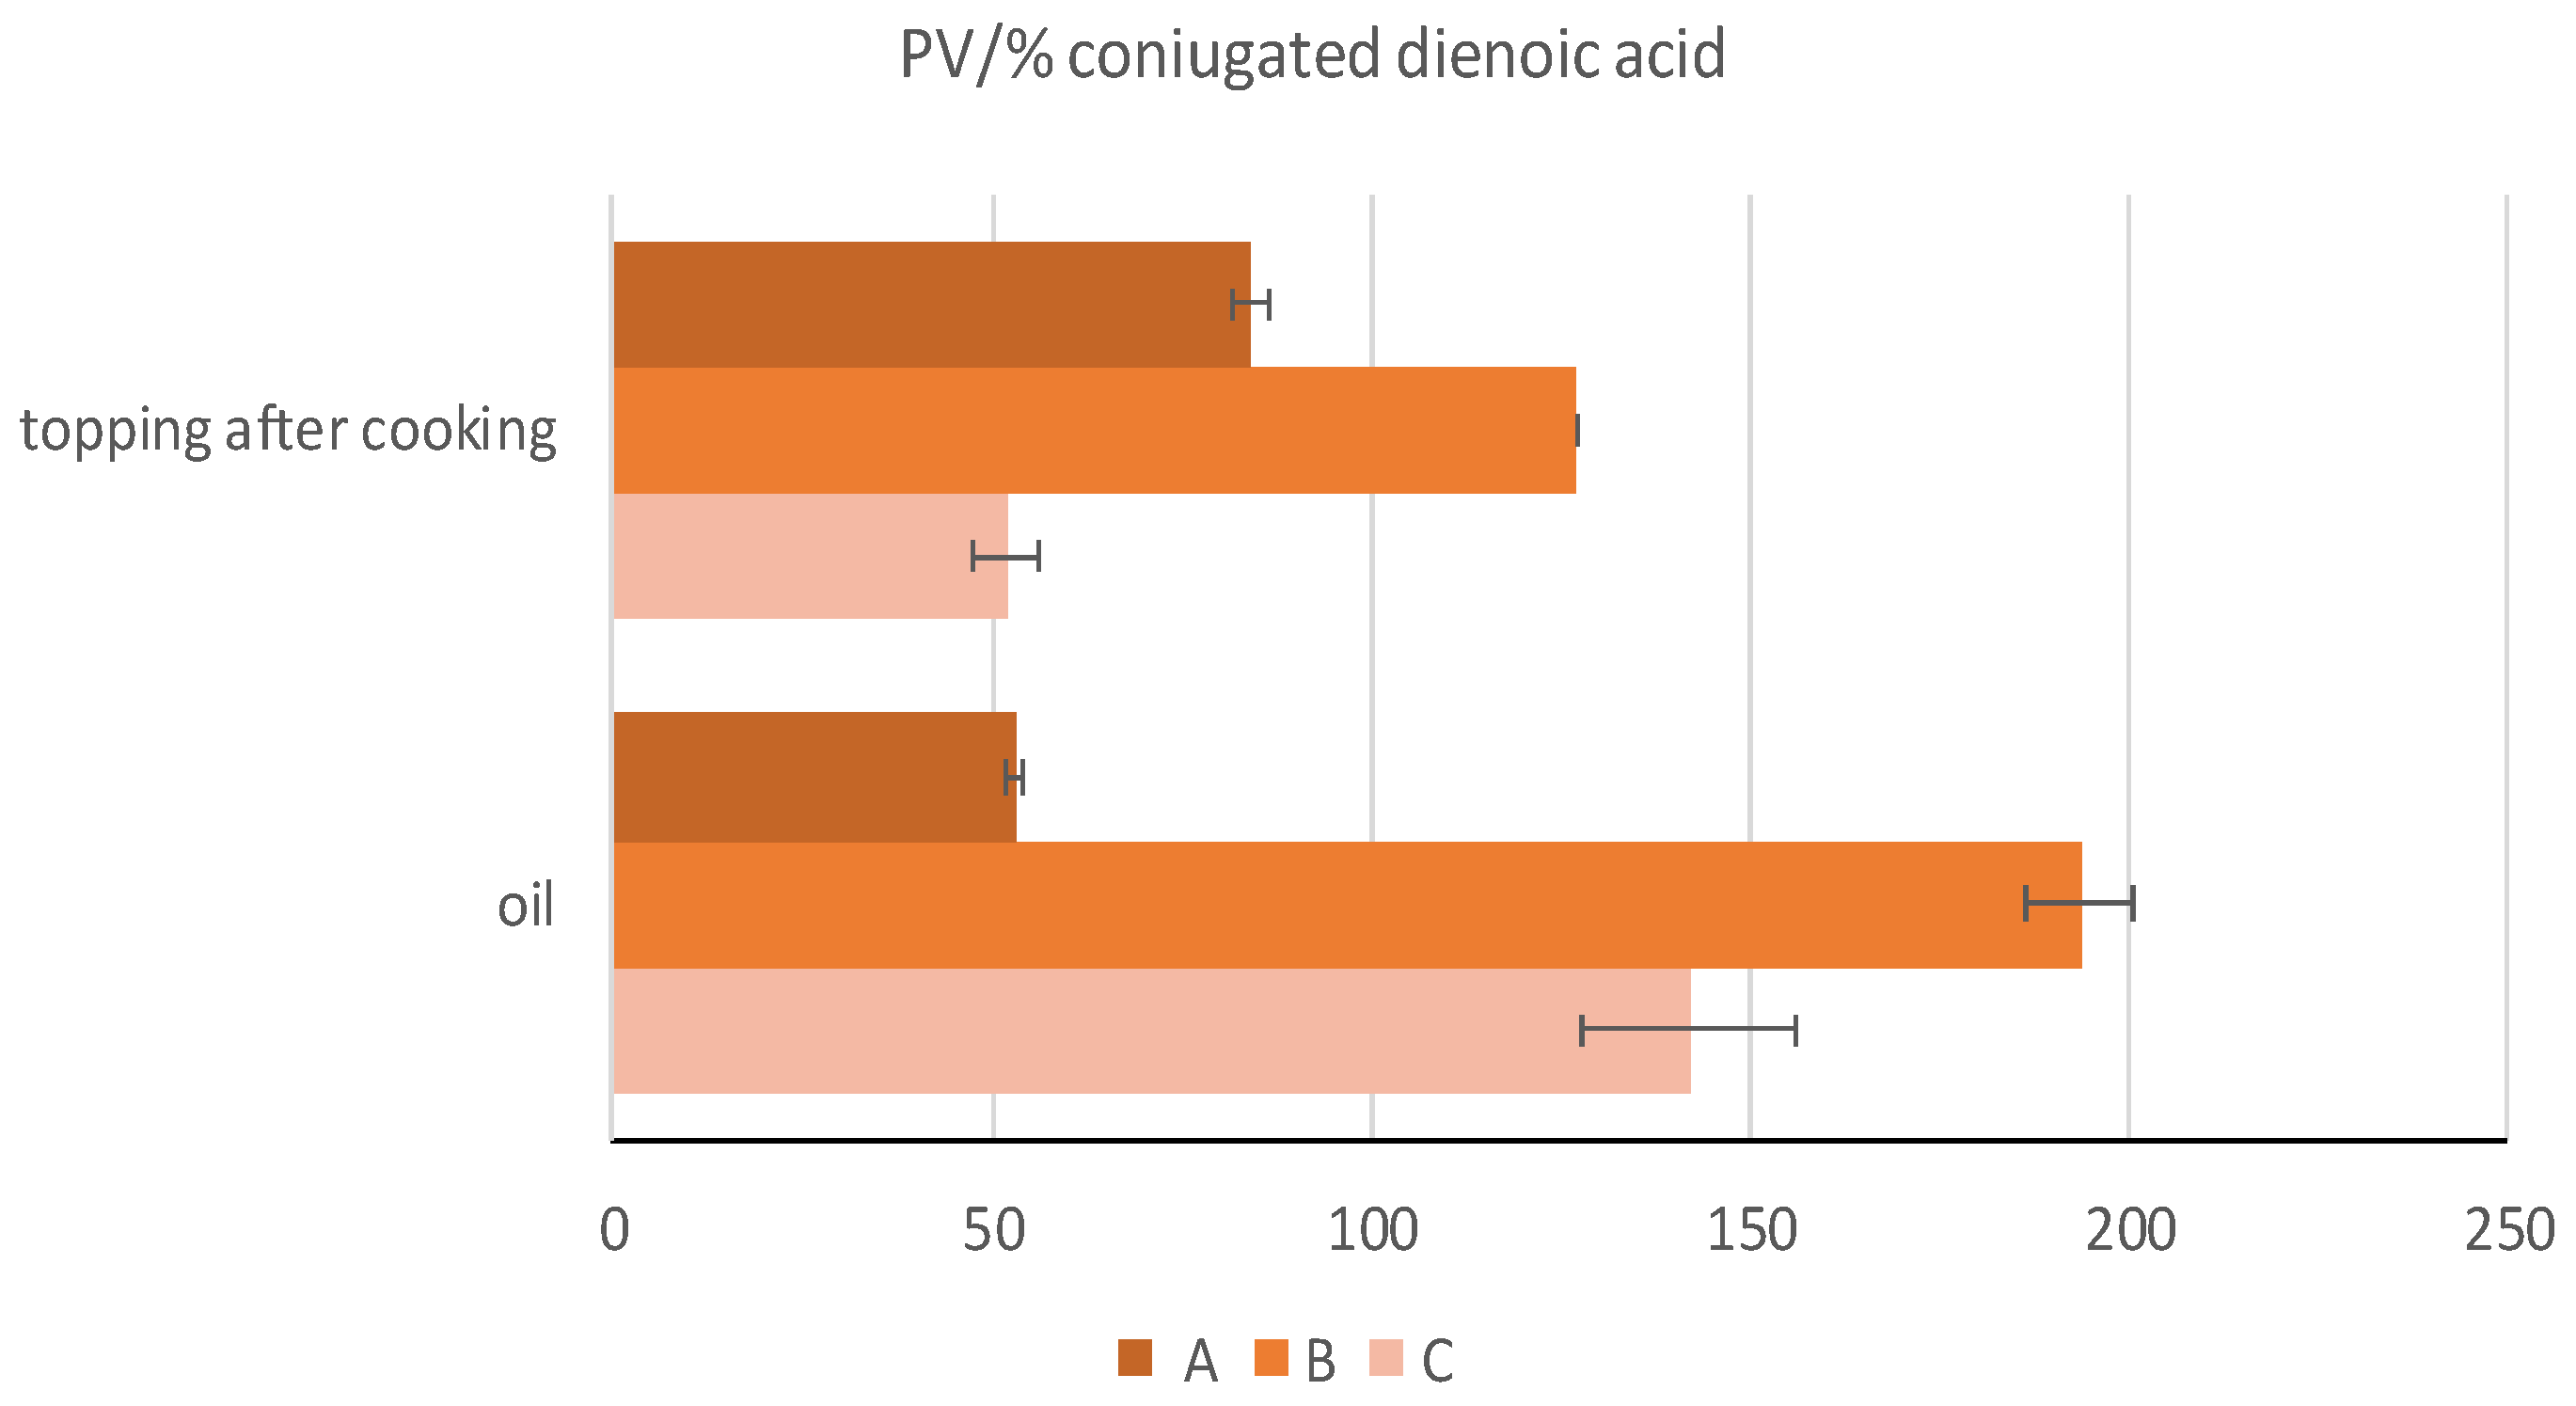
3.4. Polar Compounds of the Oil and Pizza
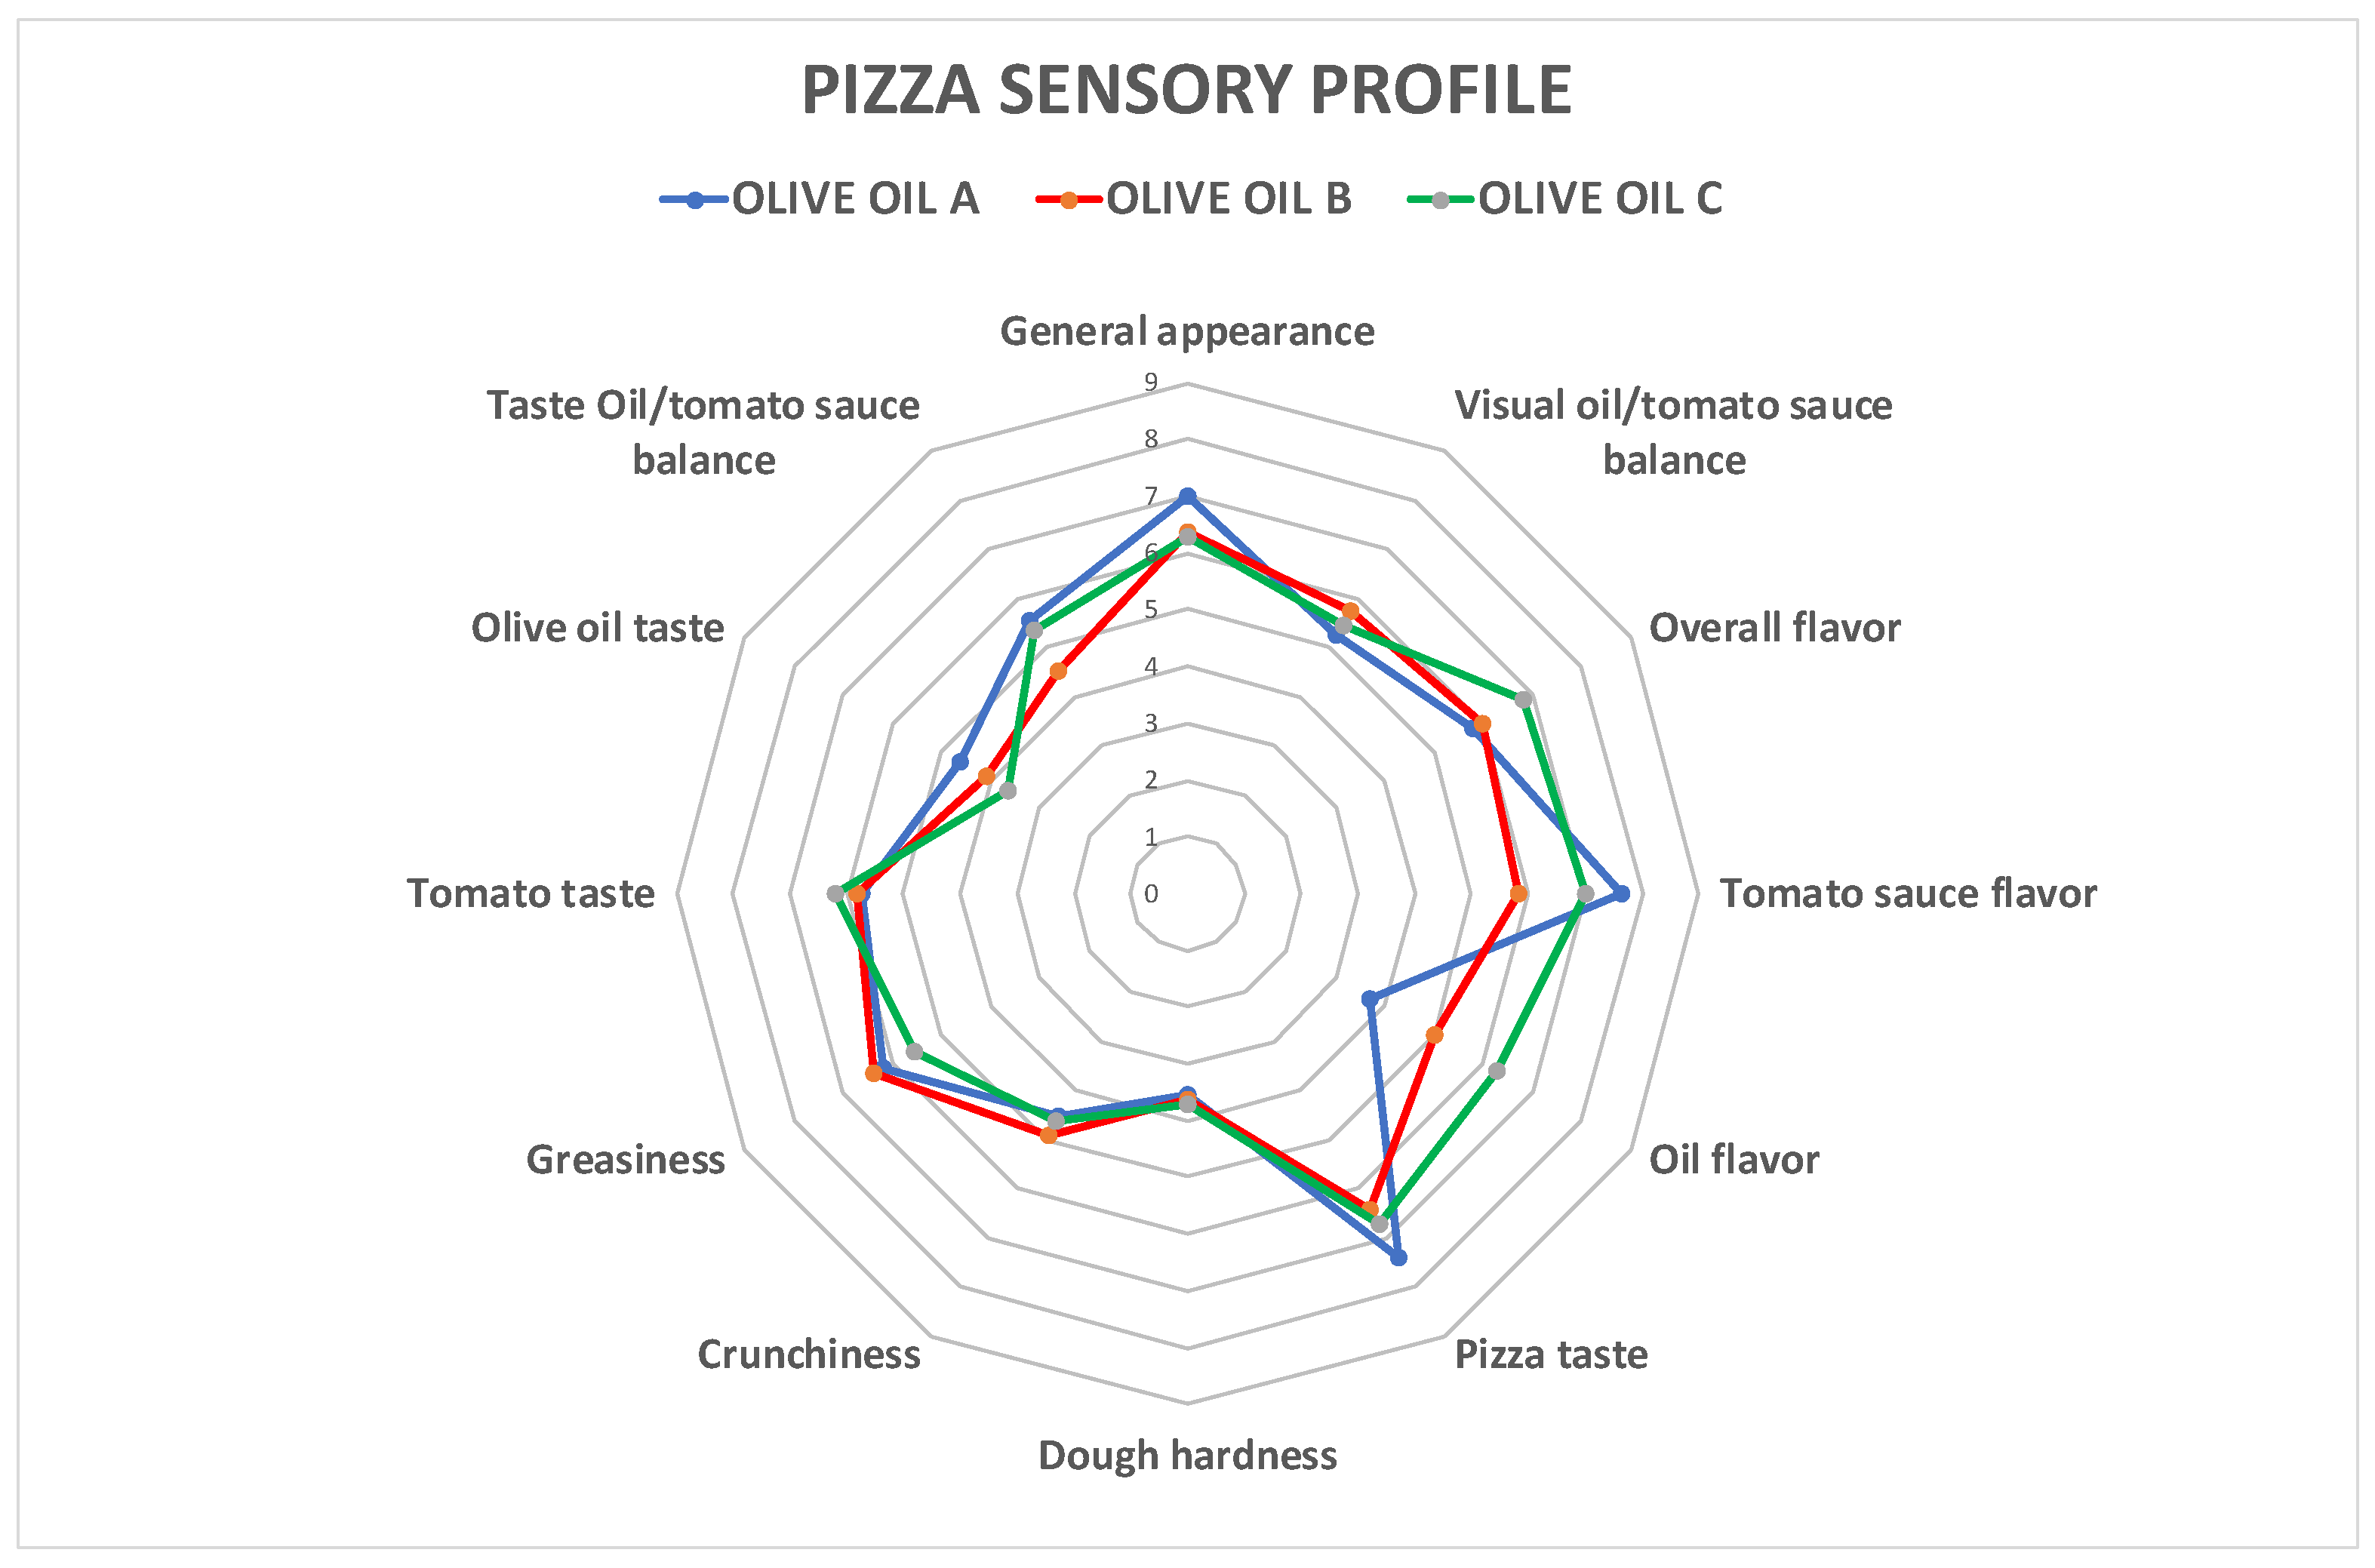
3.5. Sensory Analysis
4. Conclusions
Author Contributions
Funding
Data Availability Statement
Acknowledgments
Conflicts of Interest
References
- Mattozzi, A.; Pizza, D. Una storia napoletana. In Pizzerie e Pizzaiuoli Tra Fine Settecento e Inizio Novecento; Slow Food Editore: Cuneo, Italy, 2022. [Google Scholar]
- EC. Commission Regulation (EU) No. 97/2010, entering a name in the register of traditional SPECIALITIES guaranteed [Pizza Napoletana (TSG)]. Off. J. Eur. Union 2010, 34, 5. [Google Scholar]
- Drewnowski, A. Sensory properties of fats and fat replacements. Nutr. Rev. 2009, 50, 17–20. [Google Scholar] [CrossRef] [PubMed][Green Version]
- Sandrou, D.K.; Arvanitoyannis, I.S. Low-fat/calorie foods: Current state and perspectives. Crit. Rev. Food. Sci. Nutr. 2000, 40, 427–447. [Google Scholar] [CrossRef] [PubMed]
- Choe, E.; Min, D.B. Mechanisms of Antioxidants in the Oxidation of Foods. Compr. Rev. Food Sci. Food Saf. 2009, 8, 345–358. [Google Scholar] [CrossRef]
- Obied, H.K. Biography of biophenols: Past, present and future. Funct. Foods Health Dis. 2013, 3, 230–241. [Google Scholar] [CrossRef]
- Piscopo, A.; Zappia, A.; De Bruno, A.; Poiana, M. Effect of the Harvesting Time on the Quality of Olive Oils Produced in Calabria. Eur. J. Lipid Sci. Technol. 2018, 120, 1700304. [Google Scholar] [CrossRef]
- Caponio, F.; Alloggio, V.; Gomes, T. Phenolic compounds of virgin olive oil: Influence of paste preparation techniques. Food Chem. 1999, 64, 203–209. [Google Scholar] [CrossRef]
- Fogliano, V.; Monti, S.M.; Ritieni, A.; Gallo, M.; Della, M.D.; Ambrosino, M.L.; Sacchi, R. Antioxidant activity of virgin olive oil phenolic compounds in a micellar system. J. Sci. Food Agric. 1999, 37, 1458–1465. [Google Scholar] [CrossRef]
- Piscopo, A.; Mafrica, R.; De Bruno, A.; Romeo, R.; Santacaterina, S.; Poiana, M. Characterization of Olive Oils Obtained from Minor Accessions in Calabria (Southern Italy). Foods 2021, 10, 305. [Google Scholar] [CrossRef]
- Mafrica, R.; Piscopo, A.; De Bruno, A.; Pellegrino, P.; Zappia, A.; Zappia, R.; Poiana, M. Integrated Study of Qualitative Olive and Oil Production from Three Important Varieties Grown in Calabria (Southern Italy). Eur. J. Sci. Technol. 2019, 121, 1900147. [Google Scholar] [CrossRef]
- European Union Commission. Commission Regulation No. 61/2011 of 24 January 2011. Off. J. Eur. Union 2011, 23, 1–14. [Google Scholar]
- European Union Commission. Commission Implementing Regulation No. 348/2013 of 17 December 2013. Off. J. Eur. Union 2013, 338, 31–67. [Google Scholar]
- Baiano, A.; Gambacorta, G.; Terracone, C.; Previtali, M.A.; Lamacchia, C.; La Notte, E. Changes in phenolic content and antioxidant activity of italian extravirgin olive oils during storage. J. Food. Sci. 2009, 74, 177–183. [Google Scholar] [CrossRef] [PubMed]
- Pasqualone, A.; Caponio, F.; Pagani, M.A.; Summo, C.; Paradiso, V.M. Effect of salt reduction on quality and acceptability of durum wheat bread. Food Chem. 2019, 289, 575–581. [Google Scholar] [CrossRef] [PubMed]
- Caponio, F.; Gomes, T.; Pasqualone, A.; Summo, C. Use of the high performance size exclusion chromatography analysis for the measurement of the degree of hydrolytic and oxidative degradation of the lipid fraction of biscuits. Food Chem. 2007, 102, 232–236. [Google Scholar] [CrossRef]
- Thompson, B. Printing Materials Science and Technology, 2nd ed.; Pira International: Surrey, UK, 2004. [Google Scholar]
- Folch, J.; Lees, M.; Sloane Stanley, G.H. A simple method for the isolation and purification of total lipides from animal tissues. J. Biol. Chem. 1957, 226, 497–509. [Google Scholar] [CrossRef] [PubMed]
- AOCS. Official Methods and Recommended Practices of the American Oil Chemists’ Society, 4th ed.; AOCS: Champaign, IL, USA, 1995. [Google Scholar]
- Wai, W.T.; Saad, B.; Lim, B.P. Determination of TOTOX value in palm oleins using a FI-potentiometric analyser. Food Chem. 2009, 113, 285–290. [Google Scholar] [CrossRef]
- Kiritsakis, A. Studies in Photooxidation of Olive Oil. J. Am. Oil Chem. Soc. 1985, 62, 892–896. [Google Scholar] [CrossRef]
- Mohdaly, A.A.; Sarhan, M.A.; Smetanska, I.; Mahmoud, A. Antioxidant properties of various solvent extracts of potato peels, sugar beet pulp, and sesame cake. J. Sci. Food. Agric. 2010, 90, 218–226. [Google Scholar] [CrossRef]
- Bachari-Saleh, Z.; Ezzatpanah, H.; Aminafshar, M.; Safafar, H. The Effect of Refining Process on the Conjugated Dienes in Soybean Oil. J. Agric. Sci. Technol. 2013, 15, 1185–1193. [Google Scholar]
- Houhoula, D.P.; Oreopoulou, V.; Tzia, C. A Kinetic Study of Oil Deterioration during Frying and a Comparison with Heating. J. Am. Oil Chem. Soc. 2002, 79, 133–137. [Google Scholar] [CrossRef]
- Al-Kahtani, H. Survey of quality of used frying oils from restaurants. J. Am. Oil Chem. Soc. 1991, 68, 857–862. [Google Scholar] [CrossRef]
- Sicari, V.; Giuffrè, A.M.; Piscopo, A.; Poiana, M. Effect of “Ottobratica” variety ripening stage on the phenolic profile of the obtained olive oil. Riv. Ital. Delle Sostanze Grasse 2009, 86, 215–219. [Google Scholar]
- Žanetić, M.; Špika, M.J.; Ožić, M.M.; Bubola, K.B. Comparative study of volatile compounds and sensory characteristics of dalmatian monovarietal virgin olive oils. Plants 2021, 10, 1995. [Google Scholar] [CrossRef]
- Lukić, I.; Carlin, S.; Horvat, I.; Vrhovsek, U. Combined targeted and untargeted profiling of volatile aroma compounds with comprehensive two-dimensional gas chromatography for differentiation of virgin olive oils according to variety and geographical origin. Food Chem. 2019, 270, 403–414. [Google Scholar] [CrossRef]
- Tomé-Rodríguez, S.; Ledesma-Escobar, C.A.; Penco-Valenzuela, J.M.; Priego-Capote, F. Cultivar influence on the volatile components of olive oil formed in the lipoxygenase pathway. LWT 2021, 147, 111485. [Google Scholar] [CrossRef]
- Kalua, C.M.; Allen, M.S.; Bedgood, D.R., Jr.; Bishop, A.G.; Prenzler, P.D.; Robards, K. Olive oil volatile compounds, flavour development and quality: A critical review. Food Chem. 2007, 100, 273–286. [Google Scholar] [CrossRef]
- Angerosa, F.; Servili, M.; Selvaggini, R.; Taticchi, A.; Esposto, S.; Montedoro, G. Volatile compounds in virgin olive oil: Occurrence and their relationship with the quality. J. Chromatogr. A 2004, 1054, 17–31. [Google Scholar] [CrossRef]
- Kiritsakis, A.K. Flavor components of olive oil—A review. J. Am. Oil Chem. Soc. 1998, 75, 673–681. [Google Scholar] [CrossRef]
- Gong, Y.; Kerrihard, A.L.; Pegg, R.B. Characterization of the volatile compounds in raw and roasted Georgia pecans by HS-SPME-GC-MS. J. Food Sci. 2018, 83, 2753–2760. [Google Scholar] [CrossRef]
- Angerosa, F. Influence of volatile compounds on virgin olive oil quality evaluated by analytical approaches and sensor panels. Eur. J. Lipid Sci. Technol. 2002, 104, 639–660. [Google Scholar] [CrossRef]
- Morales, M.T.; Luna, G.; Aparicio, R. Comparative study of virgin olive oil sensory defects. Food Chem. 2005, 91, 293–301. [Google Scholar] [CrossRef]
- Zullo, B.A.; Cioccia, G.; Ciafardini, G. Effects of some oil-born yeasts on the sensory characteristics of Italian virgin olive oil during its storage. Food Microbiol. 2013, 36, 70–78. [Google Scholar] [CrossRef] [PubMed]
- Vallverdú-Queralt, A.; Medina-Remón, A.; Casals-Ribes, I.; Andres-Lacueva, C.; Waterhouse, A.L.; Lamuela-Raventos, R.M. Effect of tomato industrial processing on phenolic profile and hydrophilic antioxidant capacity. Food Sci. Technol. 2012, 47, 154–160. [Google Scholar] [CrossRef]
- Pernice, R.; Vitaglione, P.; Sacchi, R.; Fogliano, V. Phytochemicals in Mediterranean Diet: The Interaction Between Tomato and Olive Oil Bioactive Compounds. In Handbook of Food Products Manufacturing; John Wiley & Sons, Inc.: Hoboken, NJ, USA, 2007; pp. 55–65. [Google Scholar]
- Gahler, S.; Konrad, O.; Bohm, V. Alterations of vitamin C, total phenolics, and antioxidant capacity as affected by processing tomatoes to different products. J. Agric. Food Chem. 2003, 51, 7962–7968. [Google Scholar] [CrossRef]
- Ganeshpurkar, A.; Saluja, A.K. The Pharmacological Potential of Rutin. Saudi Pharm. J. 2017, 25, 149–164. [Google Scholar] [CrossRef]
- Kalua, C.M.; Bedgood, D.R.; Bishop, A.G.; Prenzler, P.D. Discrimination of storage conditions and freshness in virgin olive oil. J. Agric. Food Chem. 2006, 54, 7144–7151. [Google Scholar] [CrossRef]
- Gobbetti, M.; Simonetti, M.S.; Corsetti, A.; Santinelli, F.; Rossi, J.; Damiani, P. Volatile compound and organic acid productions by mixed wheat sour dough starters: Influence of fermentation parameters and dynamics during baking. Food Microbiol. 1995, 12, 497–507. [Google Scholar] [CrossRef]
- Cosmai, L.; Summo, C.; Caponio, F.; Paradiso, V.M.; Gomes, T. Influence of the thermal stabilization process on the volatile profile of canned tomato-based food. J. Food Sci. 2013, 78, C1865–C1870. [Google Scholar] [CrossRef]
- Sabatini, N.; Mucciarella, M.R.; Marsilio, V. Volatile compounds in uninoculated and inoculated table olives with Lactobacillus plantarum (Olea europaea L., cv. Moresca and Kalamata). Food Sci. Technol. 2008, 41, 2017–2022. [Google Scholar] [CrossRef]
- Kim, K.; Kurata, T.; Fujimaki, M. Identification of flavor constituents in carbonyl, non-carbonyl neutral and basic fractions of aqueous smoke condensates. Agric. Biol. Chem. 1974, 38, 53–63. [Google Scholar] [CrossRef]
- Pripis-Nicolau, L.; Revel, D.G.; Bertrand, A.; Maujean, A. Formation of flavor components by the reaction of amino acid and carbonyl compounds in mild conditions. J. Agric. Food Chem. 2000, 48, 3761–3766. [Google Scholar] [CrossRef] [PubMed]
- Xu, D.; Zhang, H.; Xi, J.; Jin, Y.; Chen, Y.; Guo, L.; Jin, Z.; Xu, X. Improving bread aroma using low-temperature sourdough fermentation. Food Biosci. 2020, 37, 100704. [Google Scholar] [CrossRef]
- Bartkiene, E.; Jomantaite, I.; Mockus, E.; Ruibys, R.; Baltusnikiene, A.; Santini, A.; Zokaityte, E. The Contribution of Extruded and Fermented Wheat Bran to the Quality Parameters of Wheat Bread, Including the Profile of Volatile Compounds and Their Relationship with Emotions Induced for Consumers. Foods 2021, 10, 2501. [Google Scholar] [CrossRef] [PubMed]
- Bilancia, M.T.; Caponio, F.; Sikorska, E.; Pasqualone, A.; Summo, C. Correlation of triacylglycerol oligopolymers and oxidised triacylglycerols to quality parameters in extra virgin olive oil during storage. Food Res. Int. 2007, 40, 855–861. [Google Scholar] [CrossRef]
- Caponio, F.; Gomes, T.; Summo, C.; Pasqualone, A. Influence of the type of olive-crusher used on the quality of extra virgin olive oils. Eur. J. Lipid Sci. Technol. 2003, 105, 201–206. [Google Scholar] [CrossRef]
- Billek, G. Health aspects of thermoxidized oils and fats. Eur. J. Lipid Sci. Technol. 2000, 102, 587–593. [Google Scholar] [CrossRef]
- Caponio, F.; Summo, C.; Pasqualone, A.; Bilancia, M.T. Effect of kneading and baking on the degradation of the lipid fraction of biscuits. J. Cereal Sci. 2008, 48, 407–412. [Google Scholar] [CrossRef]
- Pasqualone, A.; Haider, N.N.; Summo, C.; Coldea, T.E.; George, S.S.; Altemimi, A.B. Biscuit contaminants, their sources and mitigation strategies: A review. Foods 2021, 10, 2751. [Google Scholar] [CrossRef]
- Caponio, F.; Pasqualone, A.; Gomes, T. Effects of conventional and microwave heating on the degradation of olive oil. Eur. Food Res. Technol. 2002, 215, 114–117. [Google Scholar] [CrossRef]
- Vurro, F.; Summo, C.; Squeo, G.; Caponio, F.; Pasqualone, A. The Use of Durum Wheat Oil in the Preparation of Focaccia: Effects on the Oxidative Stability and Physical and Sensorial Properties. Foods 2022, 11, 2679. [Google Scholar] [CrossRef] [PubMed]


| Category | Descriptor | Definition |
|---|---|---|
| Appearance | General appearance | Overall appearance of pizza |
| Oil–tomato sauce balance | Visual balance between oil and tomato sauce on pizza | |
| Aroma | Overall flavor | Product flavor intensity |
| Tomato sauce flavor | Intensity of sauce flavor | |
| Oil flavor | Intensity of oil flavor | |
| Taste/pizza texture | Pizza taste | Product typical taste intensity |
| Dough hardness | Overall hardness of cooked base | |
| Crunchiness | Teeth cutting resistance intensity | |
| Greasiness | Mouthfeel greasiness intensity | |
| Taste/topping texture | Tomato taste | Typical tomato taste intensity |
| Olive oil taste | Typical olive oil taste intensity | |
| Oil–tomato sauce balance | Taste balance between olive oil and tomato sauce |
| Samples | A | B | C | Sign. |
|---|---|---|---|---|
| FA (oleic acid %) | 0.17 ± 0.05 c | 0.30 ± 0.03 b | 0.49 ± 0.00 a | ** |
| PV (mEq O2/kg) | 5.94 ± 0.04 c | 17.85 ± 0.81 a | 11.29 ± 0.13 b | ** |
| PV/%CDA | 53.05 ± 1.09 c | 193.62 ± 6.89 a | 142.08 ± 14.15 b | ** |
| p-AV | 9.10 ± 0.06 c | 9.67 ± 0.07 b | 10.53 ± 0.00 a | ** |
| TOTOX | 20.98 ± 0.14 c | 45.38 ± 1.55 a | 33.11 ± 0.26 b | ** |
| ΔK | 0.06 ± 0.00 | 0.00 ± 0.00 | 0.00 ± 0.00 |
| Phenolic Compounds (mg/kg) | A | B | C | Sign. |
|---|---|---|---|---|
| Hydroxytyrosol | 2.74 ± 0.02 c | 9.13 ± 0.02 b | 37.28 ± 0.02 a | ** |
| Tyrosol | 1.87 ± 0.05 c | 7.67 ± 0.04 b | 35.45 ± 0.07 a | ** |
| Omovanillic acid | 2.08 ± 0.03 a | 1.88 ± 0.02 b | 1.88 ± 0.03 b | ** |
| p-Coumaric acid | 0.23 ± 0.01 | 0.19 ± 0.01 | 0.19 ± 0.01 | ns |
| Pinoresinol | 1.18 ± 0.01 c | 4.09 ± 0.02 b | 11.44 ± 0.01 a | ** |
| Oleuropein | 0.00 ± 0.00 c | 4.08 ± 0.02 a | 2.74 ± 0.01 b | ** |
| Apigenin | 0.32 ± 0.01 c | 1.60 ± 0.03 b | 2.18 ± 0.03 a | ** |
| TPC | 12.63 ± 1.57 c | 109.39 ± 2.38 b | 179.01 ± 10.23 a | ** |
| Volatile Compound (µg/g) | Type of Oil | ||
|---|---|---|---|
| A | B | C | |
| Alcohols | |||
| 1-Hexanol | 0.80 ± 0.06 c | 1.50 ± 0.01 b | 7.26 ± 0.77 a |
| (Z)-3-Hexen-1-ol | 1.75 ± 0.21 c | 7.34 ± 0.10 b | 24.82 ± 2.36 a |
| Aldehydes | |||
| 2-Methylbutanal | 0.20 ± 0.02 b | 0.77 ± 0.07 a | n.d. |
| 3-Methylbutanal | 1.21 ± 0.12 a | 0.92 ± 0.10 b | n.d. |
| Pentanal | n.d. | 4.32 ± 0.50 | n.d. |
| Hexanal | 1.52 ± 0.18 ab | 1.82 ± 0.14 a | 1.43 ± 0.14 b |
| (E)-2-Hexenal | 4.07 ± 0.51 c | 11.25 ± 0.64 b | 65.55 ± 4.00 a |
| Octanal | n.d. | 0.97 ± 0.13 | n.d. |
| Nonanal | 0.05 ± 0.02 c | 0.60 ± 0.10 a | 0.32 ± 0.02 b |
| 2,4-Hexadienal | 0.13 ± 0.02 c | 0.67 ± 0.14 b | 4.33 ± 0.32 a |
| Benzaldehyde | 0.28 ± 0.01 b | 0.50 ± 0.08 a | 0.31 ± 0.08 ab |
| Ketones | |||
| 3-Pentanone | n.d. | 0.75 ± 0.03 b | 1.99 ± 0.12 a |
| 2-Octanone | 0.11 ± 0.01 | n.d. | n.d. |
| 6-Methyl-5-hepten-2-one | 0.43 ± 0.04 c | 1.32 ± 0.16 b | 4.82 ± 0.47 a |
| 2-Nonanone | 0.04 ± 0.01 c | 0.44 ± 0.02 a | 0.35 ± 0.02 b |
| Carboxylic acids | |||
| Acetic acid | 0.71 ± 0.06 a | 0.72 ± 0.05 a | 0.04 ± 0.01 b |
| Esters | |||
| Methyl acetate | 1.47 ± 0.14 b | 2.64 ± 0.57 a | n.d. |
| Ethyl acetate | n.d. | 1.69 ± 0.04 a | 0.45 ± 0.03 b |
| Hexyl acetate | 0.89 ± 0.05 c | 2.74 ± 0.05 b | 3.67 ± 0.48 a |
| San Marzano PDO Tomato | |
|---|---|
| Total acidity (% citric acid) | 0.43 ± 0.02 |
| pH | 4.17 ± 0.01 |
| SST (°Brix) | 7.75 ± 0.21 |
| L * | 45.46 ± 0.49 |
| a * | 6.02 ± 0.71 |
| b * | 6.70 ± 0.60 |
| Chroma | 9.01 ± 0.15 |
| TPC (mg/kg gallic acid) | 48.62 ± 0.10 |
| Protocatechuic acid (mg/kg) | 10.89 ± 0.04 |
| Chlorogenic acid (mg/kg) | 12.01 ± 0.06 |
| Ferulic acid (mg/kg) | 2.74 ± 0.08 |
| Rutin (mg/kg) | 9.09 ± 0.08 |
| Topping before Cooking | Sign. | Topping after Cooking | Sign. | |||||
|---|---|---|---|---|---|---|---|---|
| A | B | C | A | B | C | |||
| Protocatechuic acid | 9.92 ± 0.02 | 9.90 ± 0.21 | 9.58 ± 0.12 | ns | 10.51 ± 0.09 | 10.79 ± 0.16 | 10.51 ± 0.05 | ns |
| Chlorogenic acid | 9.57 ± 0.10 | 9.77 ± 2.72 | 9.35 ± 0.08 | ns | 9.71 ± 0.04 | 9.58 ± 0.03 | 9.72 ± 0.10 | ns |
| Ferulic acid | 2.72 ± 0.03 | 2.72 ± 0.03 | 2.76 ± 0.01 | ns | 2.02 ± 0.03 b | 2.44 ± 0.12 b | 2.99 ± 0.02 a | ** |
| Rutin | 7.42 ± 0.03 b | 8.20 ± 0.07 a | 7.72 ± 0.01 b | ** | 8.42 ± 0.09 a | 7.53 ± 0.09 b | 8.23 ± 0.08 a | ** |
| Volatile Compound (µg/g) | Type of Pizza | ||
|---|---|---|---|
| A | B | C | |
| Alcohols | |||
| Ethanol | 23.04 ± 1.78 a | 22.39 ± 2.19 a | 25.10 ± 1.05 a |
| 2-Methyl-1-propanol | 6.03 ± 0.13 c | 8.02 ± 0.09 b | 8.83 ± 0.14 a |
| 3-Methyl-1-butanol | 13.66 ± 1.31 ab | 10.62 ± 1.06 b | 14.93 ± 1.49 a |
| 1-Hexanol | 0.98 ± 0.06 c | 1.30 ± 0.04 b | 3.48 ± 0.38 a |
| (Z)-3-Hexen-1-ol | 0.97 ± 0.05 c | 3.88 ± 0.06 b | 6.93 ± 0.05 a |
| Aldehydes | |||
| 2-Methylbutanal | 10.62 ± 0.32 a | 10.42 ± 0.24 a | 10.96 ± 0.11 a |
| 3-Methylbutanal | 2.14 ± 0.11 a | 2.40 ± 0.27 a | 1.66 ± 0.20 b |
| Hexanal | 4.52 ± 0.14 a | 4.86 ± 0.19 a | 2.12 ± 0.09 b |
| (E)-2-Hexenal | 0.09 ± 0.03 c | 3.43 ± 0.33 b | 10.26 ± 1.51 a |
| (E,E)-2,4-Hexadienal | n.d. | 1.48 ± 0.03 a | 0.46 ± 0.08 b |
| Nonanal | 1.91 ± 0.37 a | 1.70 ± 0.22 a | 0.54 ± 0.04 b |
| 2-Furancarboxaldehyde | 11.68 ± 1.21 b | 18.35 ± 0.95 a | 11.29 ± 1.14 b |
| Benzaldehyde | 3.33 ± 0.36 ab | 3.86 ± 0.34 a | 3.02 ± 0.26 b |
| 5-methyl-2-furancarboxaldehyde | 1.77 ± 0.15 b | 3.55 ± 0.35 a | 1.39 ± 0.12 b |
| Ketones | |||
| Acetone | 3.28 ± 0.38 a | 2.77 ± 0.30 ab | 2.46 ± 0.28 b |
| 3-Hydroxy-2-butanone | 8.87 ± 0.78 a | 7.10 ± 2.62 a | 8.34 ± 3.02 a |
| 5-Hepten-2-one-6-methyl | 9.42 ± 2.15 a | 7.66 ± 3.81 a | 8.55 ± 2.67 a |
| 2-Nonanone | 0.09 ± 0.01 b | 0.22 ± 0.03 a | 0.22 ± 0.03 a |
| Acids | |||
| Acetic acid | 15.57 ± 3.30 a | 20.60 ± 1.70 a | 16.86 ± 1.13 a |
| Propanoic acid | n.d. | 0.77 ± 0.22 a | 0.50 ± 0.32 ab |
| Pentanoic acid | 1.30 ± 0.25 b | 2.86 ± 0.27 a | 1.02 ± 0.09 b |
| Hexanoic acid | 0.54 ± 0.05 a | 0.09 ± 0.01 b | 0.10 ± 0.01 b |
| Esters | |||
| Ethyl acetate | 2.16 ± 0.25 b | 3.27 ± 0.39 a | 1.96 ± 0.49 b |
| 3-Hexen-1-ol, acetate | 1.31 ± 0.07 c | 5.87 ± 0.60 a | 3.62 ± 0.08 b |
| Pyrazines | |||
| Pyrazine | 1.71 ± 0.14 b | 2.67 ± 0.35 a | 0.16 ± 0.14 c |
| Methylpyrazine | 4.93 ± 0.42 a | 4.67 ± 0.28 a | 1.13 ± 0.09 b |
| Ethylpyrazine | 4.42 ± 1.11 a | 2.84 ± 0.15 b | 2.11 ± 0.12 c |
| Furans | |||
| 1-(2-furanyl)-Ethanone | 0.91 ± 0.18 b | 1.36 ± 0.08 a | 0.80 ± 0.03 b |
| 2-Pentylfuran | 0.23 ± 0.03 b | 1.06 ± 0.21 a | 0.42 ± 0.07 b |
| 2-Furanmethanol | 1.14 ± 0.19 b | 2.82 ± 0.15 a | 1.37 ± 0.37 b |
| Polar Compound (g/100 g) | A | B | C |
|---|---|---|---|
| Uncooked oil | |||
| TAGP | 0.16 ± 0.01 aB | 0.09 ± 0.01 bB | 0.05 ± 0.01 bB |
| Ox-TAG | 0.61 ± 0.01 bB | 0.73 ± 0.03 aB | 0.49 ± 0.02 cB |
| DAG | 1.96 ± 0.08 aB | 1.62 ± 0.05 bB | 1.74 ± 0.07 abB |
| Pizza * | |||
| TAGP | 0.29 ± 0.01 aA | 0.21 ± 0.01 bA | 0.11 ± 0.01 cA |
| Ox-TAG | 1.51 ± 0.01 aA | 1.05 ± 0.02 bA | 0.89 ± 0.02 cA |
| DAG | 4.39 ± 0.09 aA | 3.02 ± 0.01 bA | 2.36 ± 0.03 cA |
| Descriptor | A | B | C | Sig. |
|---|---|---|---|---|
| Appearance | ||||
| General appearance | 7.00 ± 1.21 a | 6.50 ± 1.83 a | 6.33 ± 1.50 a | ns |
| Oil/tomato sauce balance | 5.17 ± 1.64 a | 5.58 ± 1.31 a | 5.33 ± 1.16 a | ns |
| Aroma | ||||
| Overall flavor | 6.00 ± 1.81 a | 6.17 ± 1.59 a | 6.83 ± 1.12 a | ns |
| Tomato sauce flavor | 7.67 ± 1.16 a | 6.00 ± 2.45 b | 7.08 ± 1.83 ab | ** |
| Oil flavor | 3.58 ± 1.44 a | 4.92 ± 1.88 ab | 5.92 ± 2.28 b | ** |
| Taste/pizza texture | ||||
| Pizza taste | 6.92 ± 2.50 a | 6.67 ± 1.56 a | 6.92 ± 2.15 a | ns |
| Dough hardness | 3.50 ± 1.31 a | 3.58 ± 1.68 a | 3.58 ± 1.88 a | ns |
| Crunchiness | 4.42 ± 2.11 a | 4.75 ± 2.73 a | 4.50 ± 2.75 a | ns |
| Greasiness | 6.00 ± 1.81 a | 6.25 ± 2.60 a | 5.25 ± 2.56 a | ns |
| Taste/topping texture | ||||
| Tomato taste | 5.58 ± 2.19 a | 5.67 ± 2.15 a | 6.00 ± 2.34 a | ns |
| Olive oil taste | 4.33 ± 1.97 a | 3.75 ± 2.77 a | 3.42 ± 2.50 a | ns |
| Oil/tomato sauce balance | 5.42 ± 1.83 a | 4.50 ± 2.02 a | 5.25 ± 1.87 a | ns |
Disclaimer/Publisher’s Note: The statements, opinions and data contained in all publications are solely those of the individual author(s) and contributor(s) and not of MDPI and/or the editor(s). MDPI and/or the editor(s) disclaim responsibility for any injury to people or property resulting from any ideas, methods, instructions or products referred to in the content. |
© 2022 by the authors. Licensee MDPI, Basel, Switzerland. This article is an open access article distributed under the terms and conditions of the Creative Commons Attribution (CC BY) license (https://creativecommons.org/licenses/by/4.0/).
Share and Cite
Piscopo, A.; Zappia, A.; Mincione, A.; Silletti, R.; Summo, C.; Pasqualone, A. Effect of Oil Type Used in Neapolitan Pizza TSG Topping on Its Physical, Chemical, and Sensory Properties. Foods 2023, 12, 41. https://doi.org/10.3390/foods12010041
Piscopo A, Zappia A, Mincione A, Silletti R, Summo C, Pasqualone A. Effect of Oil Type Used in Neapolitan Pizza TSG Topping on Its Physical, Chemical, and Sensory Properties. Foods. 2023; 12(1):41. https://doi.org/10.3390/foods12010041
Chicago/Turabian StylePiscopo, Amalia, Angela Zappia, Antonio Mincione, Roccangelo Silletti, Carmine Summo, and Antonella Pasqualone. 2023. "Effect of Oil Type Used in Neapolitan Pizza TSG Topping on Its Physical, Chemical, and Sensory Properties" Foods 12, no. 1: 41. https://doi.org/10.3390/foods12010041
APA StylePiscopo, A., Zappia, A., Mincione, A., Silletti, R., Summo, C., & Pasqualone, A. (2023). Effect of Oil Type Used in Neapolitan Pizza TSG Topping on Its Physical, Chemical, and Sensory Properties. Foods, 12(1), 41. https://doi.org/10.3390/foods12010041