

Barriers to the Expansion of Sugarcane Bioelectricity in Brazilian Energy Transition
by
 , ,
, ,
Munir Younes Soares
1,*,
Dorel Soares Ramos
1,
Margareth de Oliveira Pavan
2 and
Fabio A. Diuana
3 1
Department of Energy Engineering and Electrical Automation, Polytechnic School of the University of São Paulo, São Paulo 05508-010, Brazil
2
Production Engineering Department, Polytechnic School of the University of São Paulo, São Paulo 05508-010, Brazil
3
Energy Planning Program, Graduate School of Engineering, Universidade Federal do Rio de Janeiro, Centro de Tecnologia, Bloco C, Sala 211, Cidade Universitaria, Ilha do Fundão, Rio de Janeiro 21941-972, Brazil
*
Author to whom correspondence should be addressed.
Energies 2023, 16(2), 955; https://doi.org/10.3390/en16020955
Submission received: 18 November 2022
/
Revised: 6 January 2023
/
Accepted: 10 January 2023
/
Published: 14 January 2023
(This article belongs to the Special Issue Renewable Energy Planning and Energy Management Systems)
Abstract
:This article evaluated bioelectricity’s evolving competitiveness and systemic complementarity benefits, both in comparison with other renewable sources. To do so, the results of several energy auctions were analysed, and a modelling exercise was developed using an optimisation model based on stochastic dual dynamic programming. The results indicate that wind and solar energies became the least cost expansions, and sugarcane bioelectricity lost significance and competitiveness in this environment. At the same time, the study shows that wind power’s potential to be complementary to hydropower generation is greater than bioenergy in Brazil. These findings have relevant policy implications regarding the power sector and whether bioelectricity from sugarcane should still be incentivised along with wind power sources. It is worthwhile to point out that although the Brazilian case is explored in the article, it can be used as an example by other countries, especially developing ones, that can take advantage of Brazilian expertise on biomass exploitation aiming at integration with the power sector.
1. Introduction
Renewable sources contributed to 48.4% of the Brazilian energy mix in 2020 [1]. Bioenergy is the primary renewable source in the Brazilian energy system, contributing to 33.6% of the national energy supply [1] and 9% of electricity production in 2020 [2]. The industrial sector is the largest consumer of bioenergy (44.8%), followed by the transportation (23.8%) and energy sectors (17.1%) [1]. Most of the bioelectricity available to the Brazilian electric system is derived from sugarcane by-products [3]. Water saving in the hydroelectric reservoirs due to bioelectricity generation during the dry season and the production locations close to the most significant power consumption centres are considered important features of this source [4,5,6].
Brazil has developed a set of policies and regulatory measures focusing on promoting bioelectricity and other renewable energy sources, mostly wind, solar, small hydroelectric generators, and bioelectricity (Table 1). It is worth mentioning that the social aspect associated with those energy sources is not explored in Table 1 because it is not the focus of the current work. Regardless, some studies suggest that investments in renewable energy are associated with GDP growth, employment growth, increase in welfare, and reduction of atmospheric pollution and greenhouse gases [7,8,9,10,11,12,13,14].
The Brazilian Electricity Production and Transmission System (SIN, in its Portuguese acronym) is predominantly hydroelectric, consisting of four interconnected subsystems (South, South-East/Mid-West, North-East, and North) organised around 16 hydrographic basins [23,25].
In recent decades, the SIN transformed due to the construction of run-of-river power plants in the North region, thus increasing wind power and bioelectricity contributions, giving rise to the proliferation of interconnections among the subsystems, and developing thermal power plants to accommodate hydrologic behaviour and the lack of new energy reservoirs. In 2006, 84.9% of Brazil’s installed generation capacity was hydroelectric [26]. In 2020, 59% of the power generated was hydroelectric, 24.4% was from thermal power stations driven by fossil fuels and biomass, 9.8% was from wind, and 1.9% was from solar energy [2].
This time, bioelectricity generation increased in both the South-East and Mid-West regions. As for the North-East region, capacity expansion occurred because of several wind power projects; currently, 38.1% of the installed capacity of this region is from wind power projects, with 98.8% of these projects starting from 2009 onward [27].
The electric energy consumption in the country was significantly affected by the national economic crisis of 2015. The energy demand, which grew by 2.5% from 2013 to 2014, did not recover to 2014 levels until 2018, and nonetheless, industrial consumption remained 5.3% lower than in 2014 [28,29]. In 2020, the preceding crisis was aggravated by the COVID-19 pandemic impacts [30,31,32,33].
Most of the bioelectricity is generated by the sugar-energy sector in Brazil, accounting for 81.5% of the marketed bioelectricity, amounting to 26.3 TWh in 2018 [3]. This electricity surplus results from the combined cycles of sugarcane processing for sugar and ethanol production. The bagasse resulting from sugarcane crushing is used as fuel for thermal and electric energy generation [5,34,35]. In addition, recovered sugarcane straw is processed for energy production [36].
Nonetheless, much of the export potential offered by bioelectricity to the grid has not yet been explored. On the basis of the amount of bagasse available in the 2016/2017 harvest, the estimated technical potential is 9.5 GWavg, 239% more than bioelectricity generation in 2017 [3,37]. With the possibility of recovered sugarcane straw and end fragments, 6.2 GWavg could be added to that power [37], yielding a cumulative value of 15.7 GWavg. This great potential could be explored to supply electricity to the grid, whether it presents competitive prices or systemic advantages for the power system. Further information about bioelectricity generation potential can be found in the Supplementary Material.
Under the Paris Agreement, Brazil structured its National Determined Contribution around the main goal of reducing GHG emissions in 2025 and 2030 by 37 and 50%, respectively [38], compared to 2005 levels of 2.4 GtCO2eq [39]. Brazil has recently committed to a net-zero greenhouse gas emission in 2050.
The energy sector is not the main source of CO2eq emissions in Brazil. In 2020, the energy sector represented 18.2% of Brazilian emissions accounting for an absolute value of 2.1 GtCO2eq [40], with power energy generation emitting approximately 49.0 MtCO2eq [2]. However, to meet Brazil’s commitments under the Paris Agreement, this carbon emission amount needs to be reduced or kept at the same levels nowadays.
Bioelectricity is also an important component of energy systems with low greenhouse gas (GHG) emissions [41,42,43]. The National Biofuel Policy (RenovaBio), the latest Brazilian policy focusing on biofuels, aims to increase biofuel’s role to meet the Paris Agreement’s national commitments [44]. It is not a bioelectricity-dedicated policy, but it might boost investments in the sector.
However, despite the importance of bioelectricity in the decarbonisation process and its power generation potential, this source has become less competitive than other options [45]. Several studies have identified insufficient market signals due to variations in the energy auction ceiling prices and significant reduction of solar and wind bid prices in energy auctions as the main reason for this effect [46,47]. This effect is more relevant considering the additional cost of recovering sugarcane straw [48,49,50].
Few studies have evaluated the barriers to expanding sugarcane bioelectricity in the context of market conditions, ongoing transformations in electric systems, commitments under the Paris Agreement, and the sugar-energy sector approach. One study [5] reported the need for deeper evaluations of the existing barriers in the power sector and the many challenges in the value chain of the sugar and ethanol industries. Studies in other developing countries have prioritised identifying national or regional potentials, different technological options for bioelectricity generation, and incentive policies to increase its use [51,52,53,54].
This study focused on the performance of bioelectricity in Brazilian energy auctions, and it aims to evaluate the possible benefits of bioelectricity for the Brazilian power system. The outcomes presented here can contribute to ongoing efforts if it makes sense to keep offering incentives to promote bioelectricity. The findings can help figure out if it makes sense to keep offering incentives to promote bioelectricity. Moreover, the results can help other developing countries build policies focused on bioelectricity incentives by taking advantage of the Brazilian experience.
The analyses were performed by evaluating two relevant dimensions. One of them was the evolving competitiveness of bioelectricity compared to other renewable sources. The other analysis was its systemic complementarity benefits using the NEWAVE hydrothermal dispatch optimisation model. The methodological approach is detailed in the second section, followed by results presented in the third section; the fourth section discusses the results, and finally, the conclusions and policy implications of the research are shown in the last section.
2. Materials and Methods
This study used quantitative methods based on primary data development from system modelling and secondary data collection, systematisation, and analysis [55,56]. An analytical framework was developed to explore two important dimensions to explain bioelectricity participation in the Brazilian electricity matrix. The first dimension is the bioelectricity performance in energy auctions. This dimension considers the bioelectricity success when competing with other energy sources such as wind and solar especially, it is the bioelectricity competitiveness. The second dimension considers the bioelectricity systemic benefit due to its complementing hydropower generation potential. This dimension is important because this attribute can justify special treatment for a biomass power source in the energy auctions if there is a systemic benefit associated with this source that is not being considered.
2.1. Competitiveness of Bioelectricity in Energy Auctions
The Brazilian energy market is divided into two environments. In the regulated contracting environment (regulated or captive market), customers with a demand load of less than 2.5 MW can buy energy only through electric energy distribution companies [57], and here, bioelectricity capacity is enabled through energy contracting auctions [37,45]. In contrast, in the free contracting environment (free market), energy consumers with a demand load equal to or higher than the threshold have greater freedom to choose their supplier(s). To stimulate RE development, customers who consume more than 500 kW have been granted access to the free contracting environment but can buy only from RE projects, thus increasing the market share of these sources.
The two most common types of direct incentives for RE were the Reserve Energy Auctions (LER), created to procure sufficient energy to ensure the structural security of SIN [23], and the Alternative Energy Source Auctions (LFA) of additional installed capacity acquisition restricted to RE. Various studies explain these auctions’ operations [23,58,59,60,61]. As shown in Table 1, bioelectricity, like other renewable sources, has benefited from several policy incentives, and the auctions were particularly motivating because they reserved capacity in the energy mix for RE sources.
The analysis of bioelectricity competitiveness in the energy auctions was based on secondary data collected and systematised from all auctions through October 2019 (a total of 12 auctions) run by the Chamber of Commercialization of Electric Energy (CCEE in its Portuguese acronym) [62]. The data included registered projects, procured volume, initial maximum price, average procurement prices, and investment prices. All costs were adjusted to 2019 levels [62,63].
2.2. Evaluation of the Systemic Benefit Produced by Sugarcane Bioelectricity
The bioelectricity benefit to the Brazilian power system is associated with its capacity to complement the seasonal hydroelectricity profile. To this end, simulation cases were created on the basis of the multi-stage NEWAVE model of hydrothermal dispatch optimisation [64,65] to evaluate if the bioelectricity seasonal profile generates positive impacts on selected systemic indicators.
NEWAVE is one of the official model tools used by the System Operator (ONS) and CCEE to support the mid/long-term power plant dispatch planning and define the price of electricity in the Brazilian power sector [66]. In order to reduce the system’s overall operating cost during the planning horizon, NEWAVE calculates an optimised monthly dispatch for the interconnected system’s hydro and thermal generating plants [67].
NEWAVE is developed by the Electric Energy Research Center (CEPEL—Portuguese acronym). It is based on a stochastic dual dynamic programming approach (SDDP) that is implemented in order to minimise the expected value of the total operation cost (future cost plus immediate cost) during the planning period [68]. Then, NEWAVE is capable of dealing with uncertainty regarding the compromise decision between depleting (using water) and not depleting (using thermoelectric plants) the reservoirs [69]. NEWAVE optimisation decisions are based on the total cost for the whole simulated period.
NEWAVE aggregates hydropower plants into equivalent reservoirs in each subsystem, while the thermal power plants are individually represented. Other power sources, such as wind and bioelectricity, are not modelled explicitly; the expected generation of these sources is subtracted from the total load, which means that the hydro and thermal power generation must supply the netload.
In the original NEWAVE, the wind generation is treated deterministically. In this work, some cases approached wind generation stochastically following the methodology developed in [70]. It addresses wind farms as run-of-river hydropower in which energy inflows are associated with wind speed.
To reach the goals of this study, a couple of NEWAVE runs were developed on the basis of different scenarios. All scenarios are built by modifying the NEWAVE version used by the Brazilian ISO in [71] that modelled the period between 2019 and 2023. It is important to mention that during this period, there were no representative changes in the Brazilian power sector thus far, and therefore the most recent modelling exercise would not lead to divergent results.
In the reference scenario, no changes were applied on the model, despite the addition of a stochastic representation of wind power plant generation. There were two scenarios in which the South-East/Mid-West submarket and sugarcane bioelectricity generation load were manually increased by 10% and 20%, respectively. Those scenarios were done to make the bioelectricity impacts in the system more noticeable. The values of 10% and 20% were chosen because they were already providing a substantial increase in the bioelectricity share that was capable of making the proposed comparison effective.
Moreover, this boost was applied in the selected subsystem because most of the sugarcane bioelectricity capacity is located in the southeast. The fourth scenario was based on 10% load and bioelectricity increase in the Southeast region but with a deterministic wind power representation.
All scenarios were developed for a standard and a critical hydrology condition. The hydropower plant reservoir level and water inflow initial conditions were represented by 2019 data in the standard analysis and by 2015 data in the critical analysis.
The seasonal aspect of the bioelectricity generation curve was adjusted in all previous scenarios to evaluate if it added value to the system. The bioelectricity seasonal profile represents the variations in the bioelectricity-aggregated capacity factors following the procedures adopted by the Brazilian System Operator [72]. In the sensitivity analysis, bioelectricity had the same energy volume but a flat profile.
Moreover, the last scenario was developed on the basis of the 10% load and bioelectricity increase with the addition that wind generation was artificially flattened instead of the biomass, which was kept seasonal. It is conducted to check if the wind seasonality was more or less important to the system than the biomass power generation profile.
It is important to highlight that the balance of the system was not altered. As explained above, the generation curves of both bioelectricity and wind power were altered to a flat profile without annual intermittence, but the energy volume was kept the same.
Table 2 summarizes all scenarios and the sensitivity analysis associated with them.
The simulations used and adapted some of the NEWAVE parameters for an interconnected system defined by the National Electric System Operator in its Monthly Operation Program from January 2019 to December 2023 [71,73]. Table 3 presents the input generation system condition or characteristics described to evaluate sugarcane bioelectricity’s seasonal benefits.
Although NEWAVE is the official model used in Brazil, it still has some flaws, with most being associated with the fact that it is a mid-term optimisation model. Some studies indicate that NEWAVE tends to be somewhat optimistic when forecasting the hydro resource availability [72,73]. Nonetheless, this characteristic of the model does not affect the obtained findings of this study.
3. Results
3.1. Performance of Sugarcane Bioelectricity in Energy Auctions
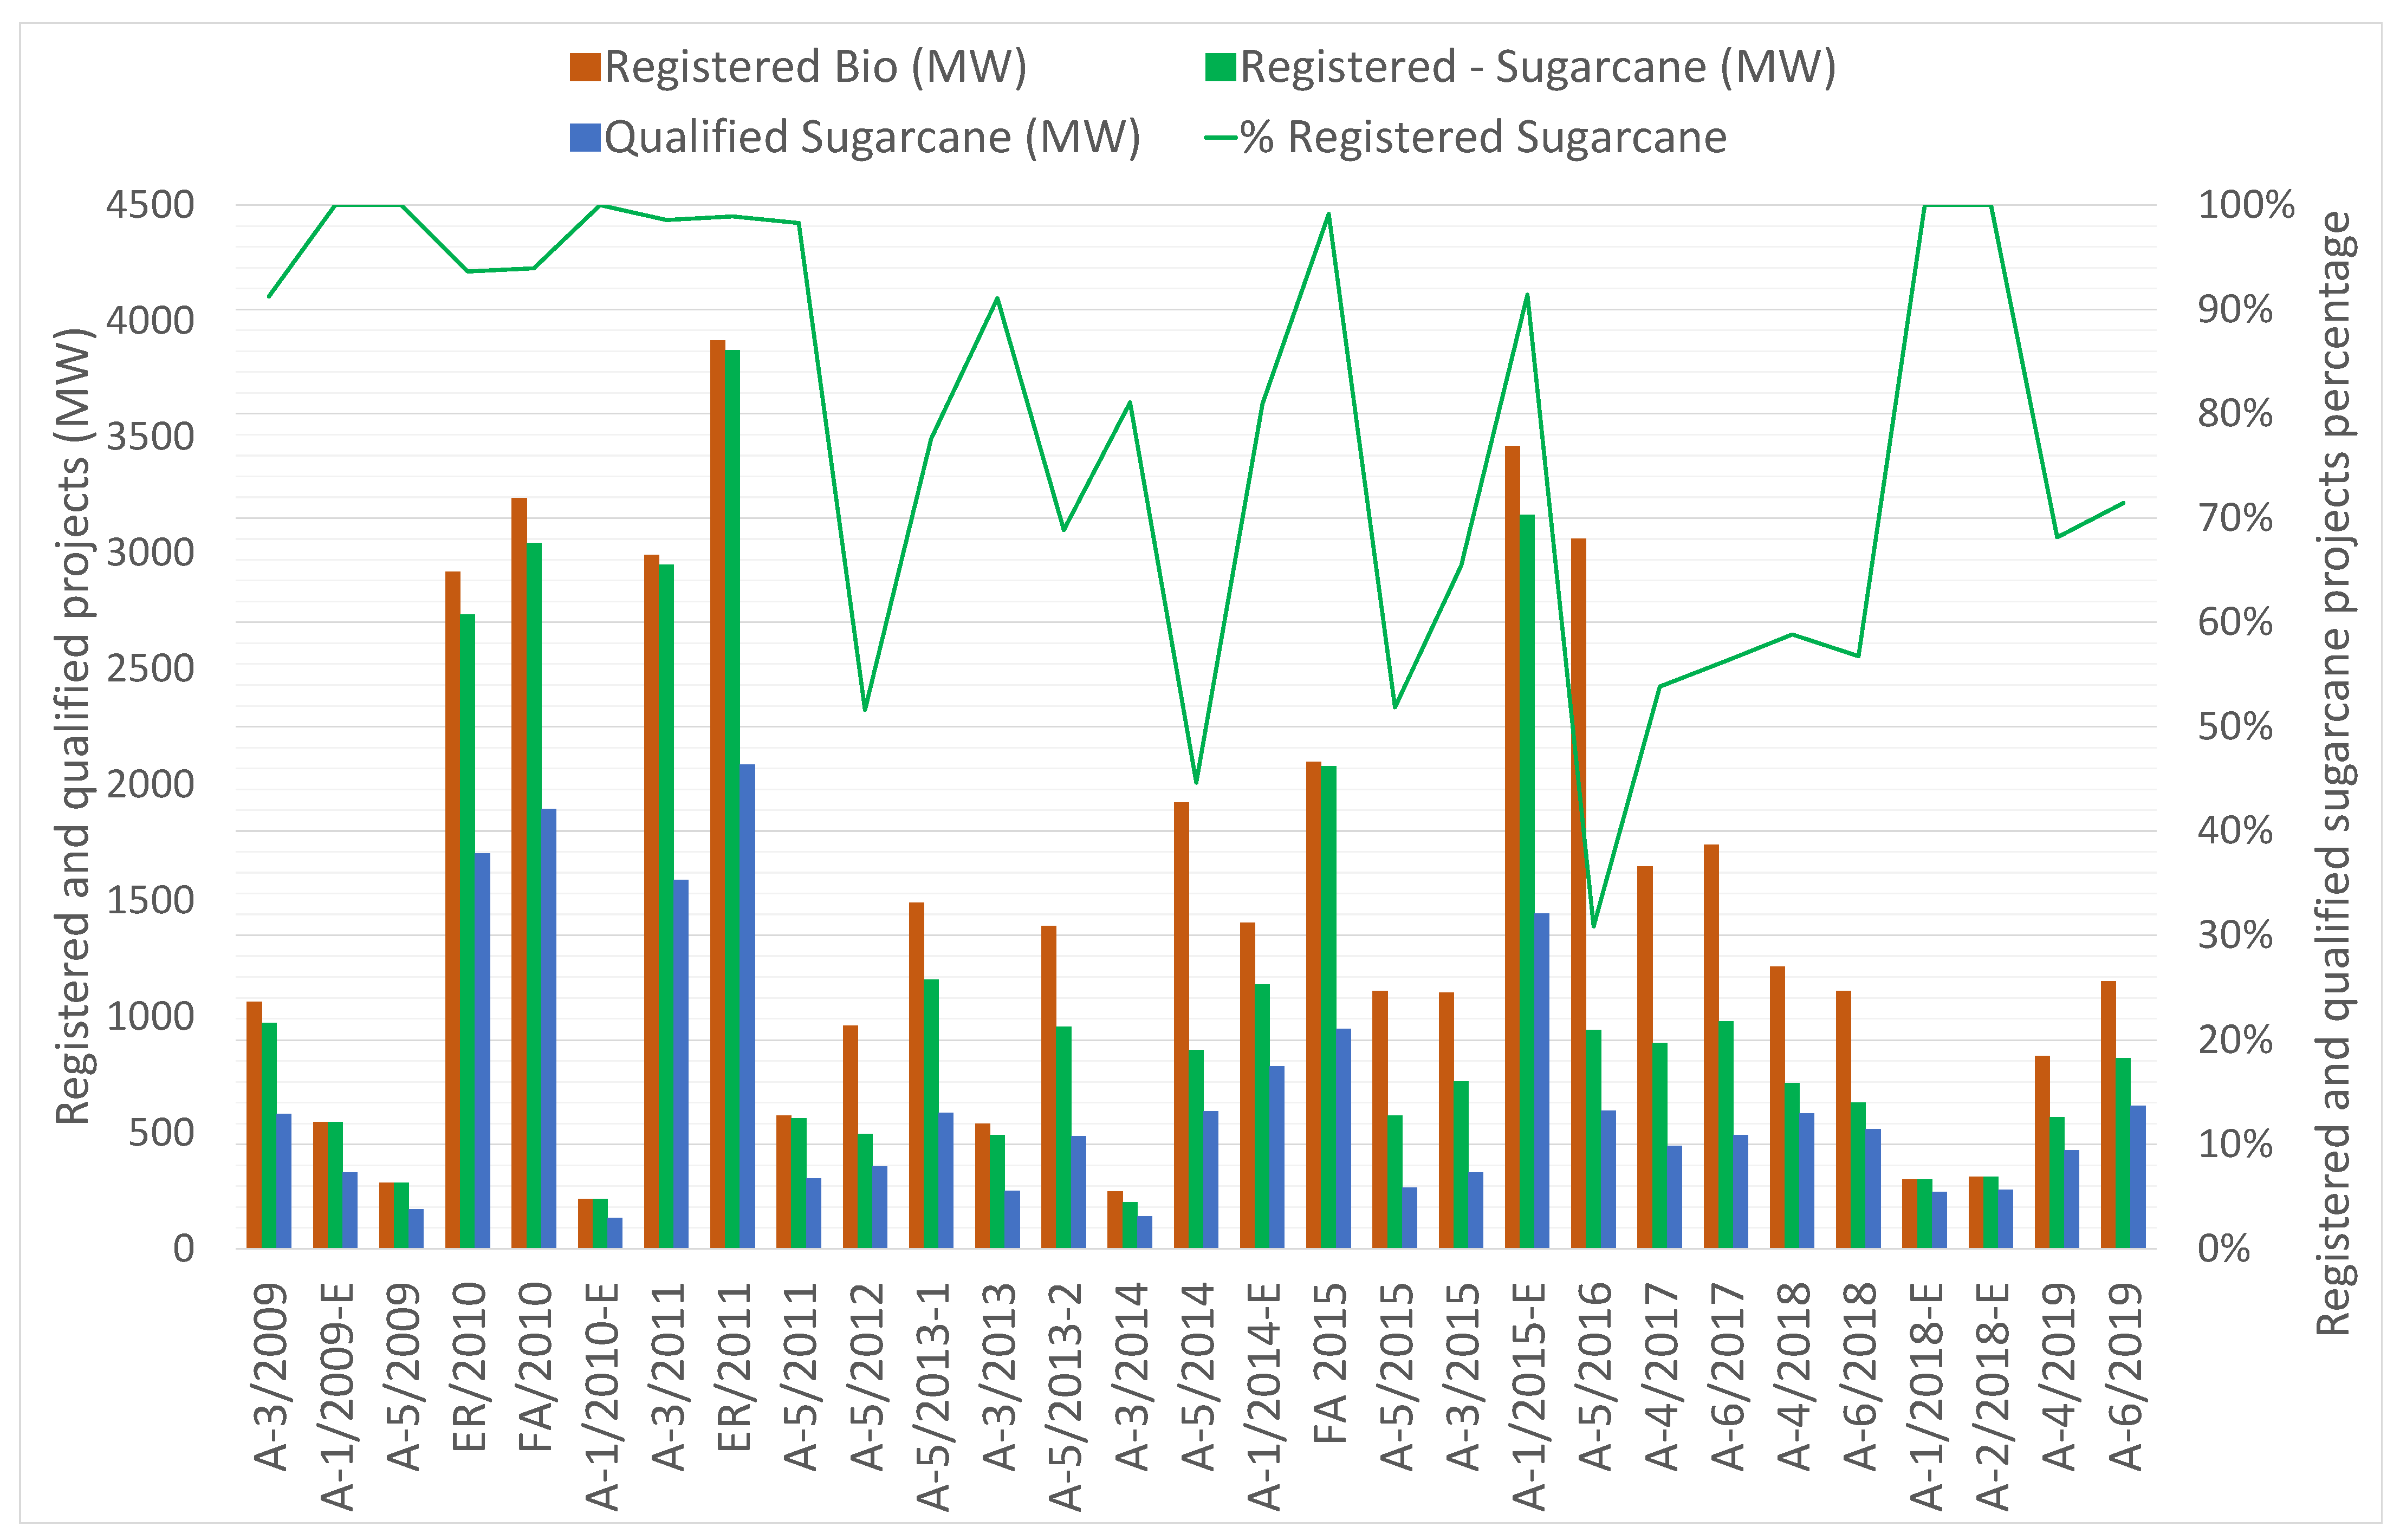
Analyses of bioelectricity projects registered in energy auctions showed that a substantial majority were sugarcane projects, accounting for an average of 78% of all registrations. Figure 1 shows that the registered sugarcane volume was under 50% of the registered bioelectricity projects in two energy auctions. In addition, two instances exhibited exceptionally high rates of sugarcane bioelectricity registration. Between 2010 and 2011, the LER and LFA supported capacity expansion; however, in 2015, the first auction was LFA restricted to wind and bioelectricity sources, and the second auction was a current energy auction. In this period, the average of registered bioelectricity projects per auction was 740 MW, and the average technical qualification was 440 MW.
Concerning the technical qualification defined by the Brazilian government for the registered projects in the auctions, sugarcane bioelectricity projects have an average rate of 58% qualified (the straight blue line in Figure 1), which means that on average, 58% of registered bioelectricity projects can fill the obligations necessary to participate in the power auction. The relatively small value is mainly because of environmental licensing, location usage rights, and problems in connecting the project to the basic distribution grid [45]. All of these elements are recognised as barriers to greater investment in biomass power sources.
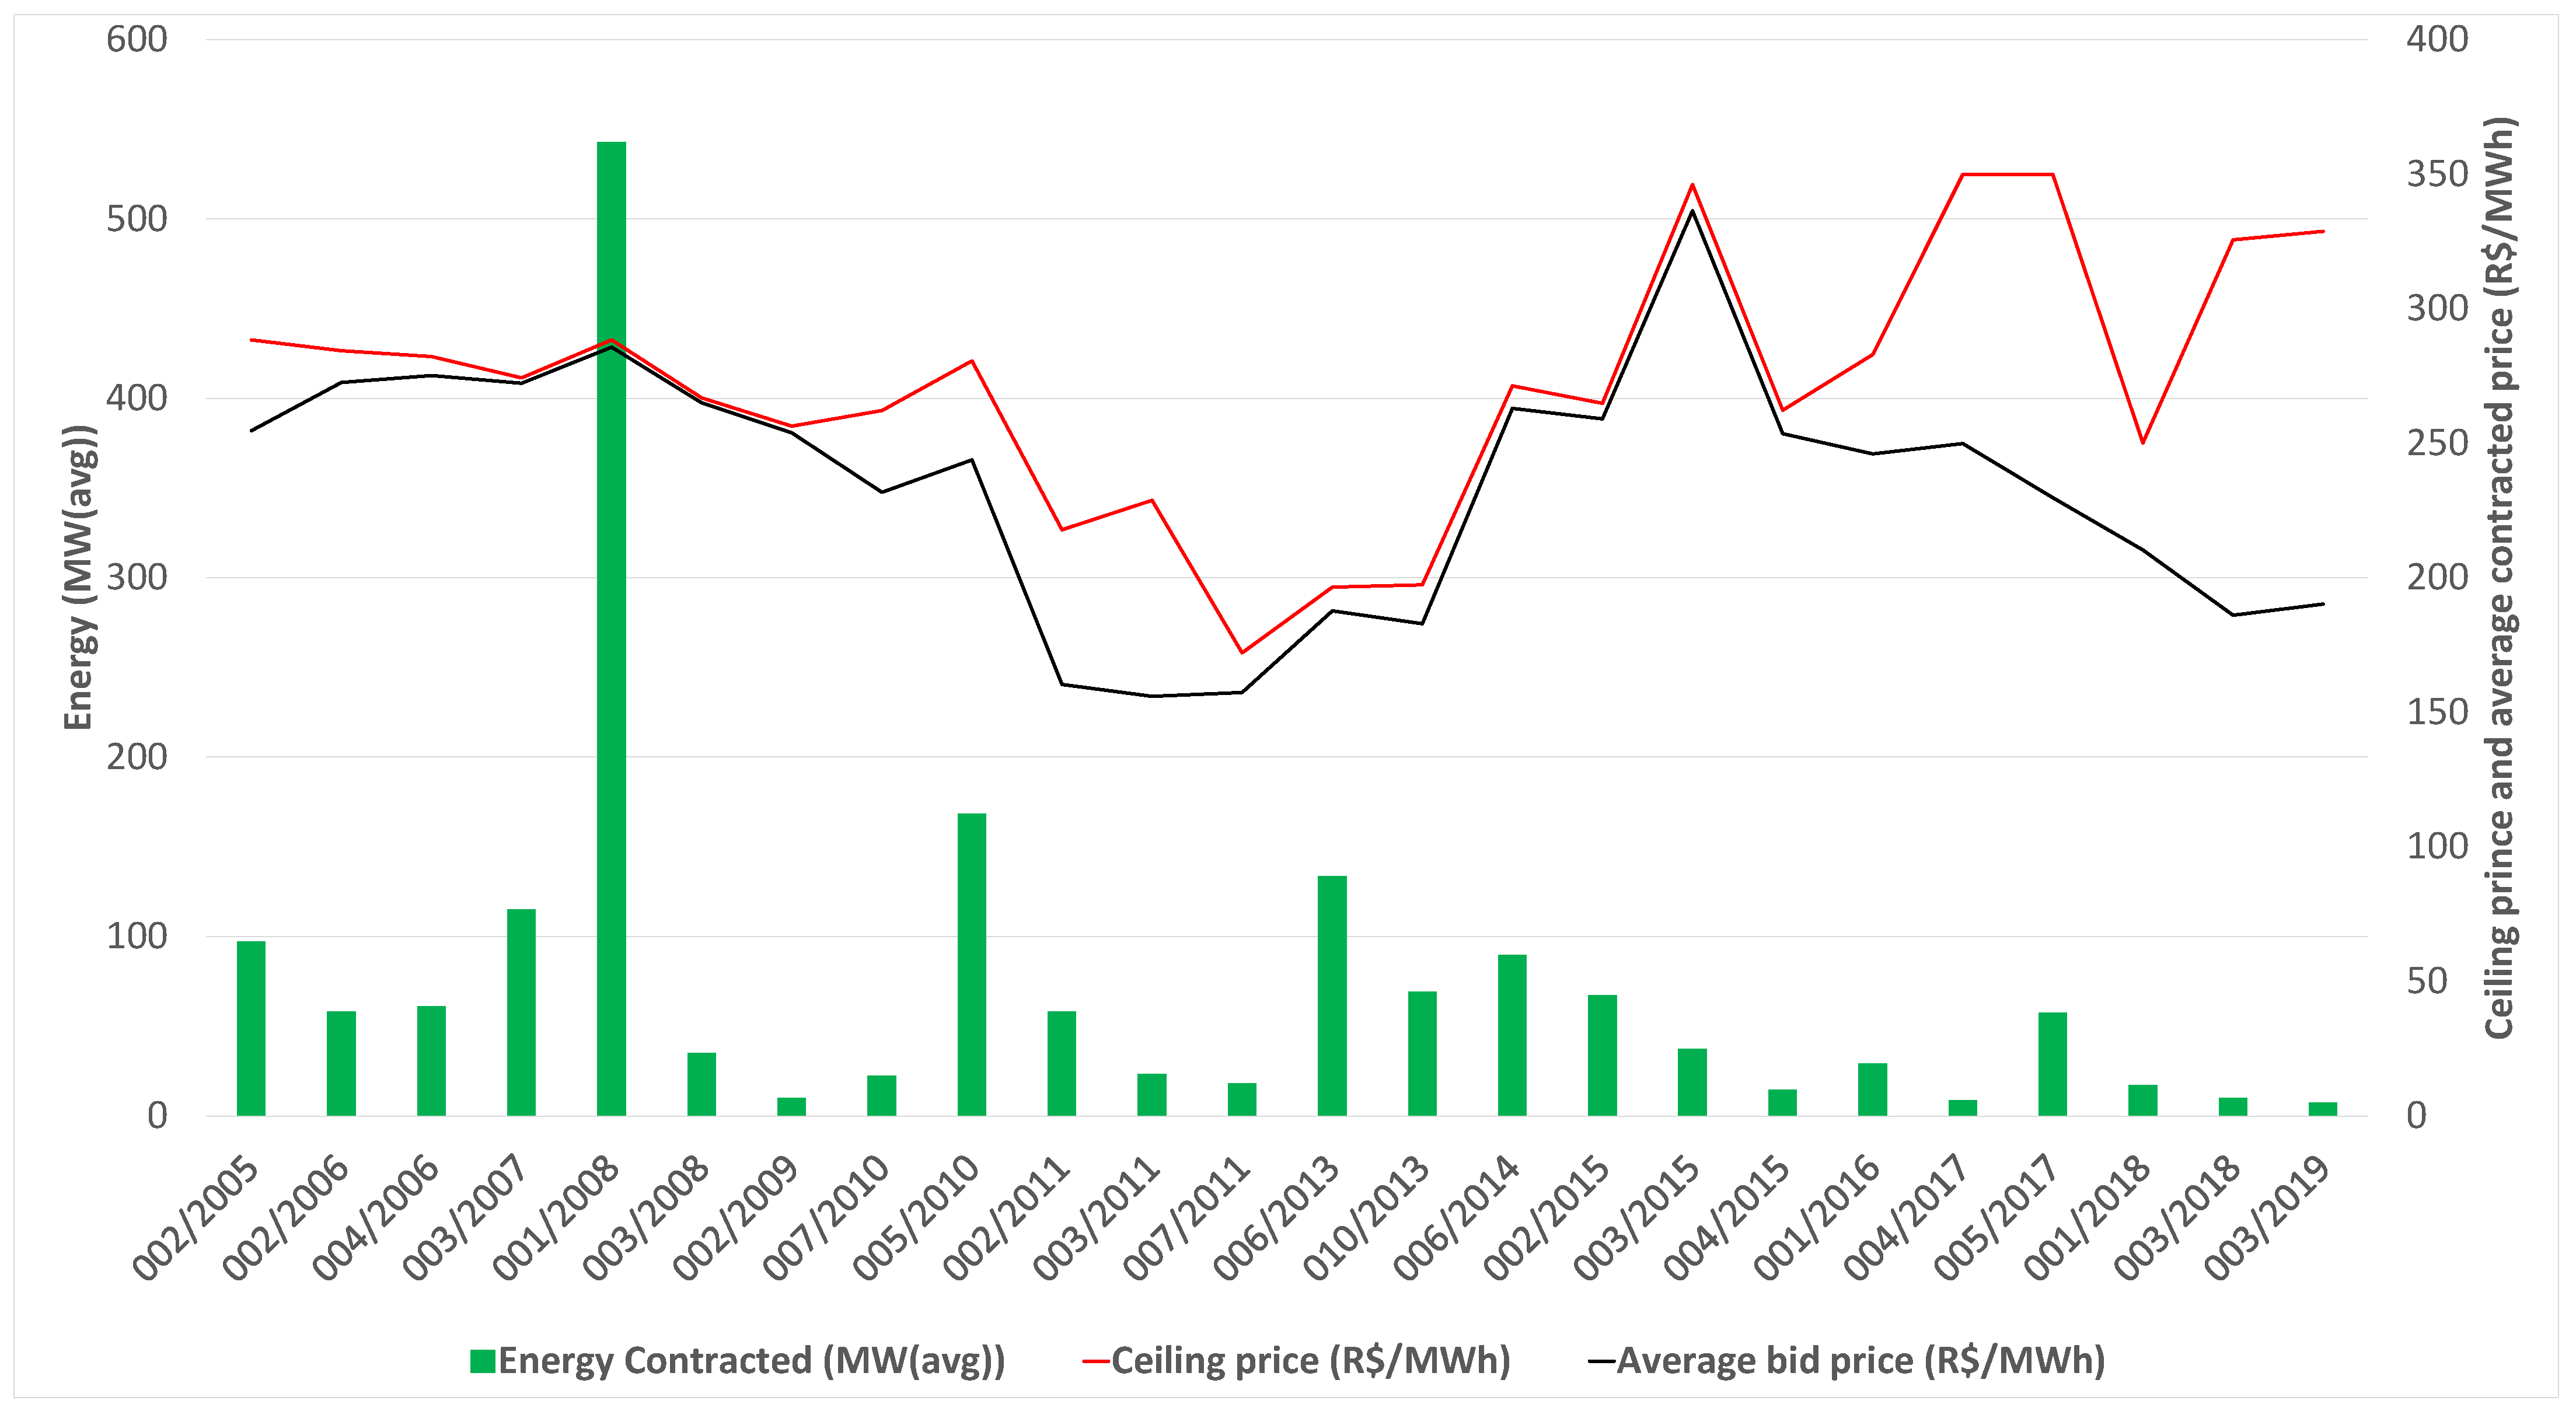
Between 2009 and 2019, approximately 4000 MW of installed capacity and 13,578 GWh of average energy were procured [45]. It is interesting to notice that the average capacity of those projects is approximately 50 MW [36], in general, associated with medium and great mills, as small mills are not competitive. Figure 2 shows the considerable variation in price ceilings for those projects, stable until 2010, with the lowest price in 2011.
As the price ceiling began to drop in 2008 until its minimum in 2011, the procure volume did not respond with a reduction in procured energy. For this reason, the price ceilings did not return to the 2010 level until 2014. However, significant variations persisted and only stabilised after 2017. On the other hand, the rises in the price ceiling from 2015 onwards did not appear sufficient to reach the previous project procurement level.
Even after the price ceiling reduction, the energy volumes procured at auctions between 2010 and 2013 were more steeply discounted than in previous years. Although not much affected until 2010, between 2010 and 2011, bioelectricity procurement was reduced by an average of 18% (Figure 3). These events contributed to the official plans to expand the expected procurement volume for sugarcane bioelectricity to become competitive with other RE sources [75,76,77].
However, Figure 1 also shows the stagnation of the volumes of both registered and qualified projects between 2011 and 2014. This period coincides with the low-price-ceiling phase of Figure 3. This evidence points towards dismantling the value chain instead of a rise in competitiveness.
The average procuring prices, as presented in Figure 2, showed a reduction between 2010 and 2012, followed by a rise until 2016, and remained mostly stable until 2019. Sugarcane bioelectricity procurement prices have oscillated, with an average price range of 234.31 R$/MWh.
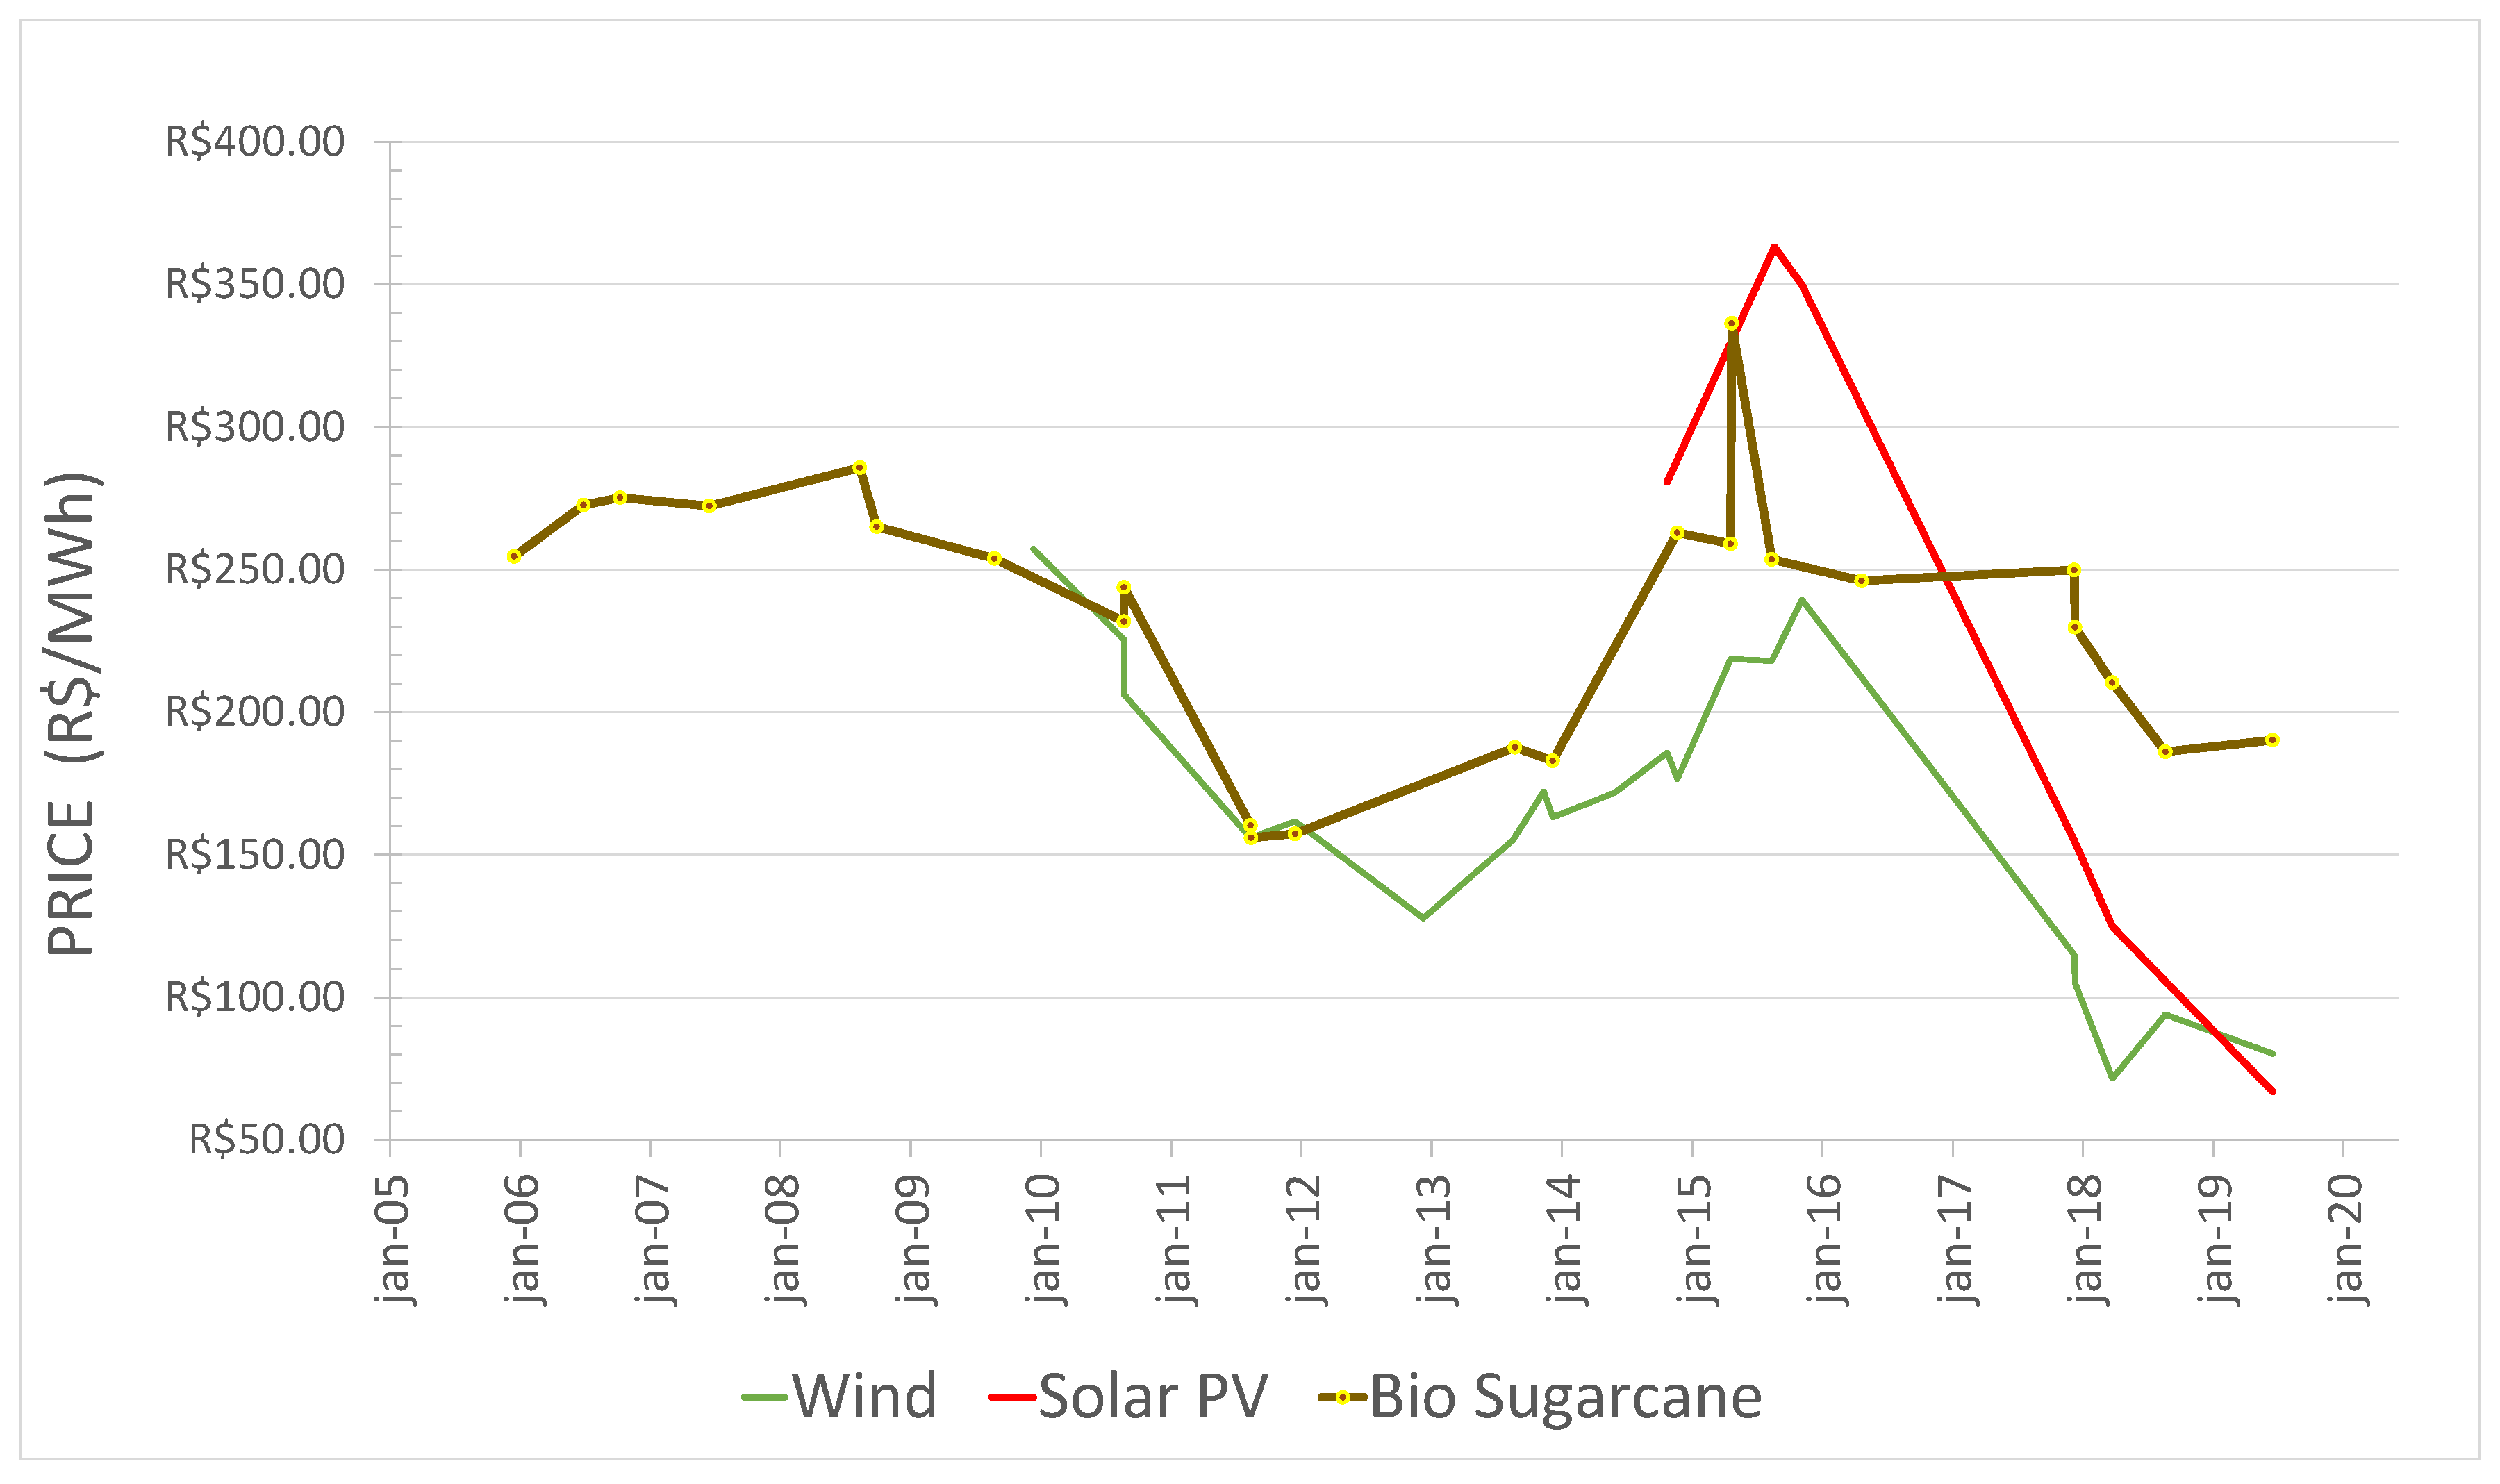
Figure 2 and Figure 3 also show that the bioelectricity value chain deteriorated because of price ceiling variation and incoherent signalling in the planning. Wind power prices decreased substantially, motivating an expansion in that sector and stiffening competition against bioelectricity. As of 2017, both wind and solar power were traded at price levels far lower than bioelectricity. Because wind and solar sources are relatively newer and not entirely consolidated technologies, significant price reductions continued in the following years [78,79].
As of 2016, state planning has suggested an average procurement amount for sugarcane bioelectricity, and public auction has shown stable price levels. Nonetheless, because of the aforementioned demand crisis, competition for procurements has significantly broadened, and, despite major discounts in procurement prices, procurement volumes have been lower since 2016 (Figure 2). Bioelectricity price levels are now higher than other renewable sources and are similar to the prices of natural gas projects (Figure 4). However, the technologies used in natural gas generation have characteristics and attributes, such as flexibility and state-of-the-art service, that are currently high priorities [37]. Thus, the procuring process may more favourably select natural gas projects.
3.2. Systemic Benefits of Sugarcane Bioelectricity
The systemic benefits of sugarcane bioelectricity were evaluated on the basis of some selected indicators listed in Table 4, indicating whether the comparison is favourable. If sugarcane bioelectricity contributes to the system, it avoids thermal dispatch and improves system security by reducing its marginal operational cost. The South-East/Central-West subsystems were chosen because these are the subsystems where the majority of the sugarcane bioelectricity potential is located and the effects would be most noticeable. The exception was the system’s total cost, which helps to evaluate the global benefits.
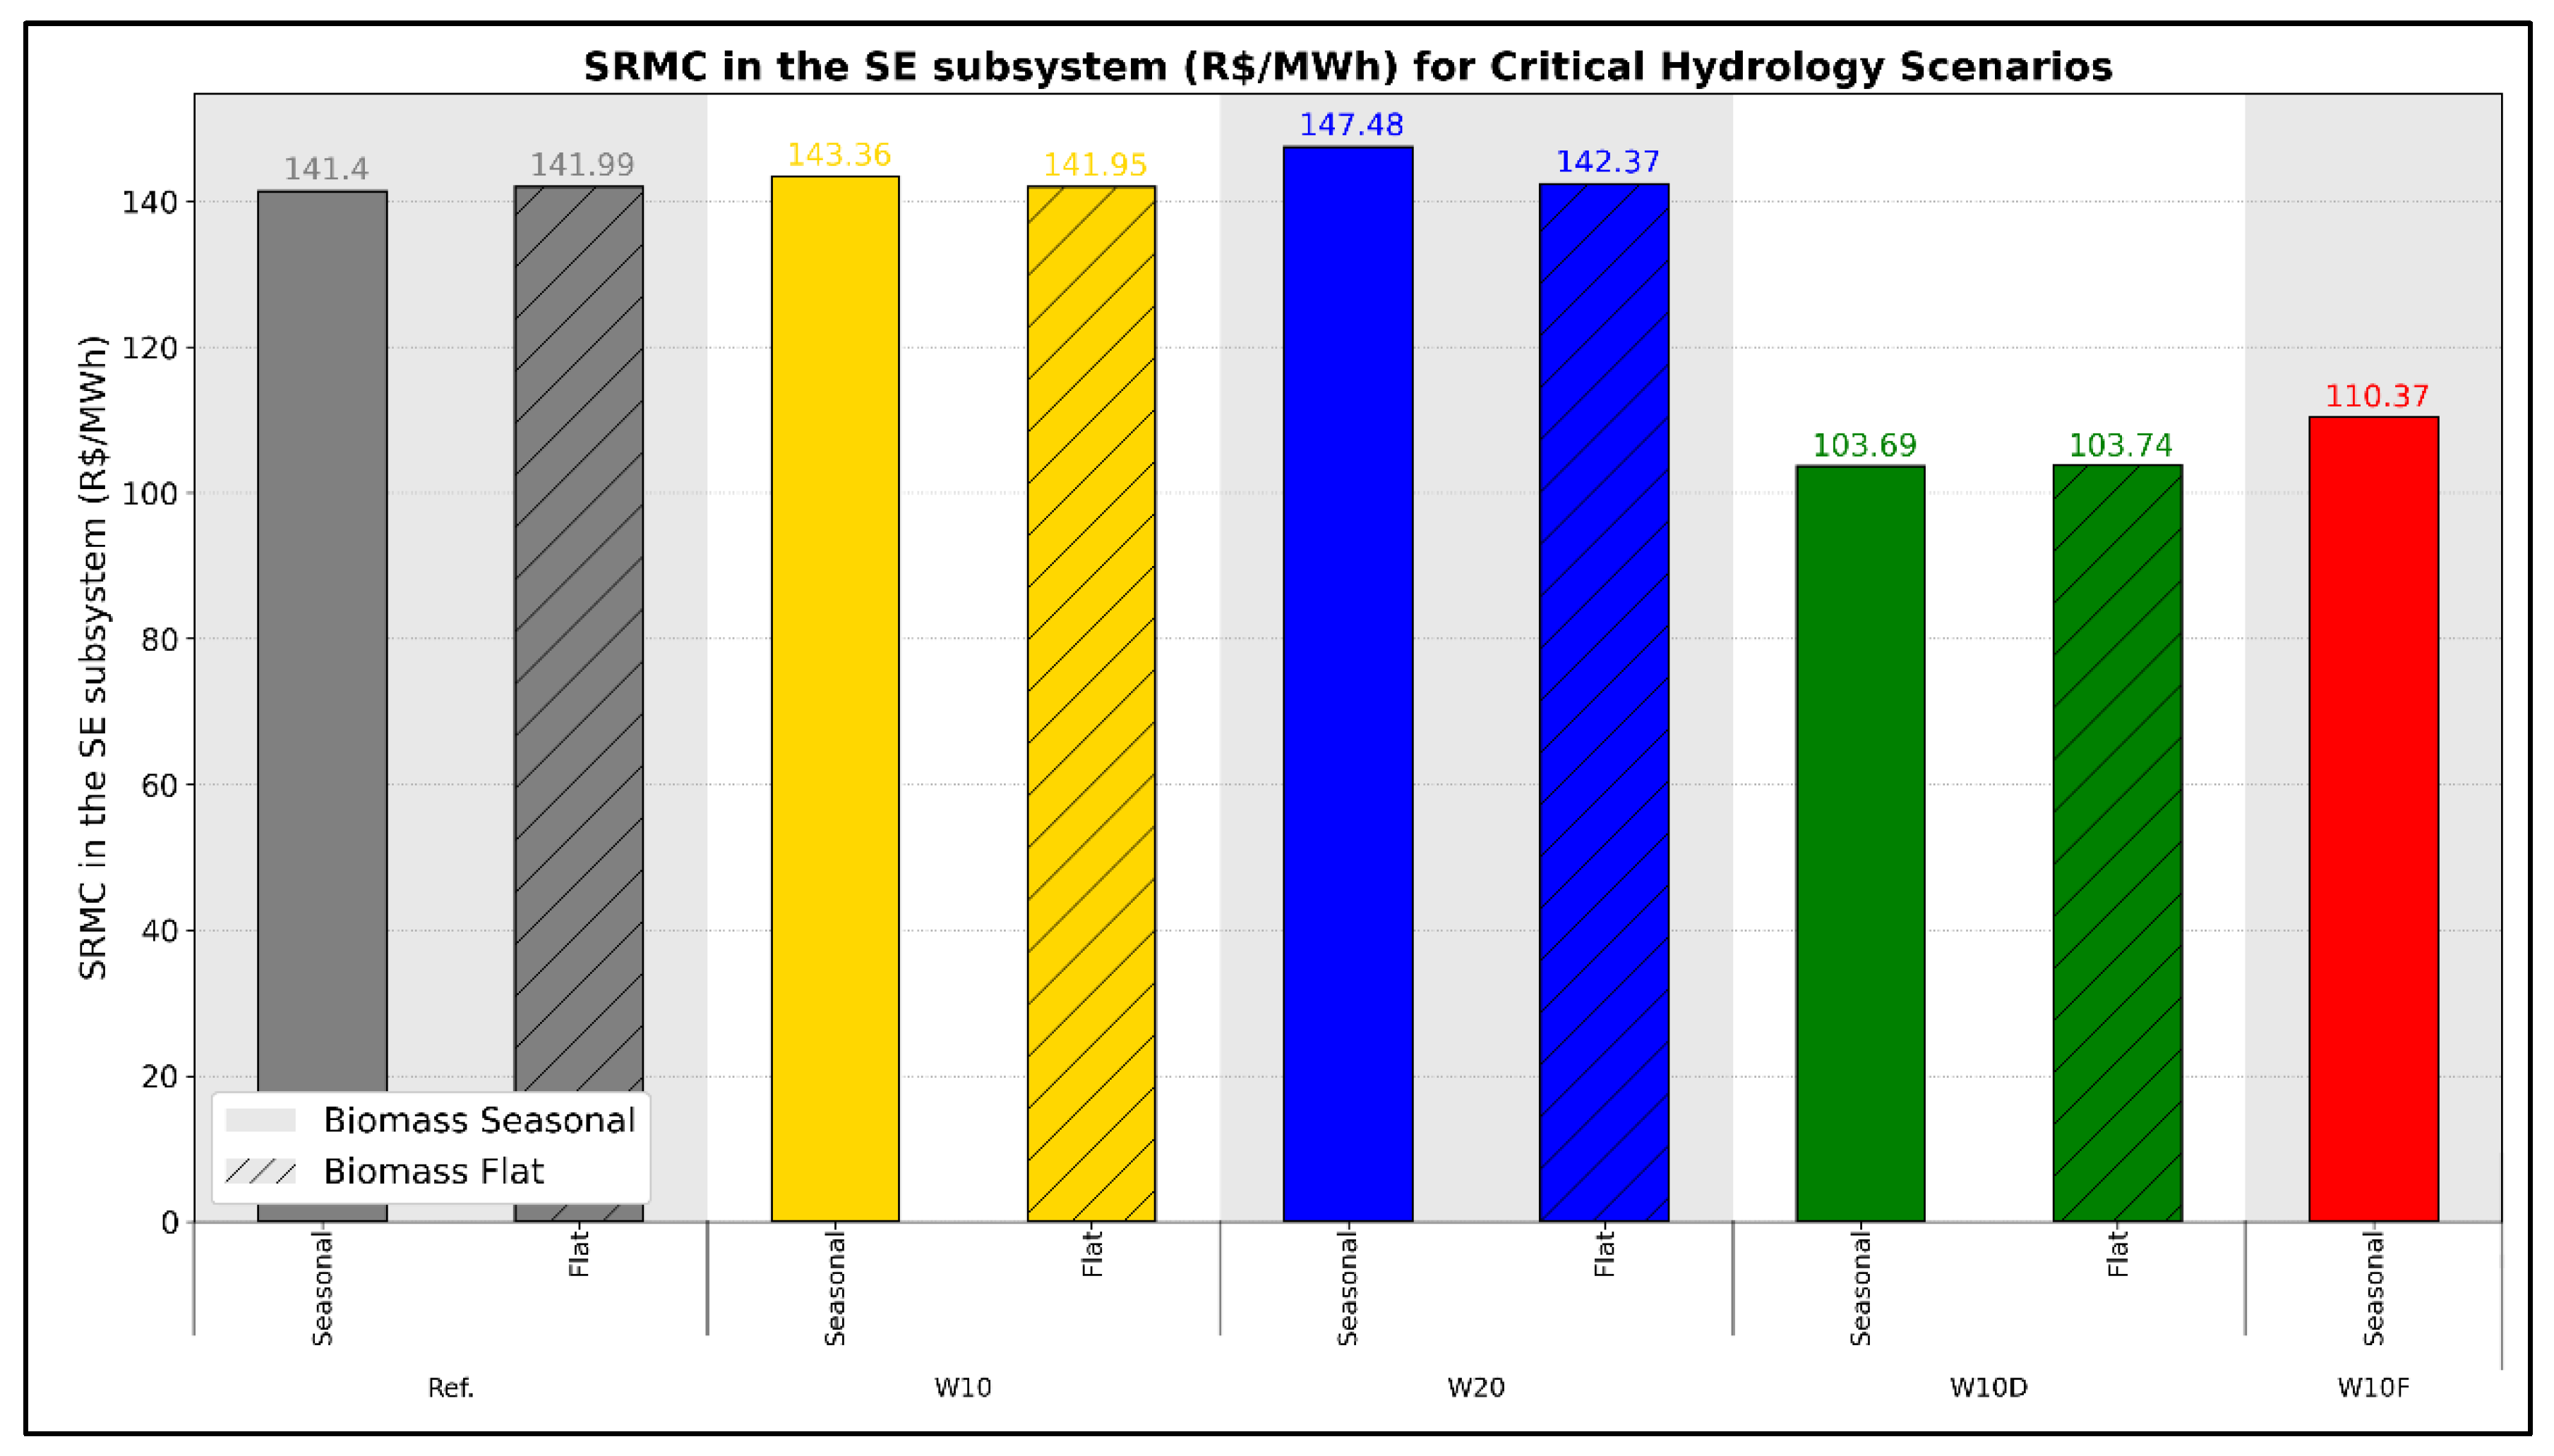
The evaluation of short-range marginal cost (SRMC) for scenarios with critical hydrology, presented in Figure 4, offers some interesting insights about the role of biomass and wind. First, the deterministic approach for wind power makes everything easier for the power system modelling. SRMC values are much higher for the stochastic cases. It was expected since, in the stochastic representation, the model has to deal with uncertainty, as in the real world.
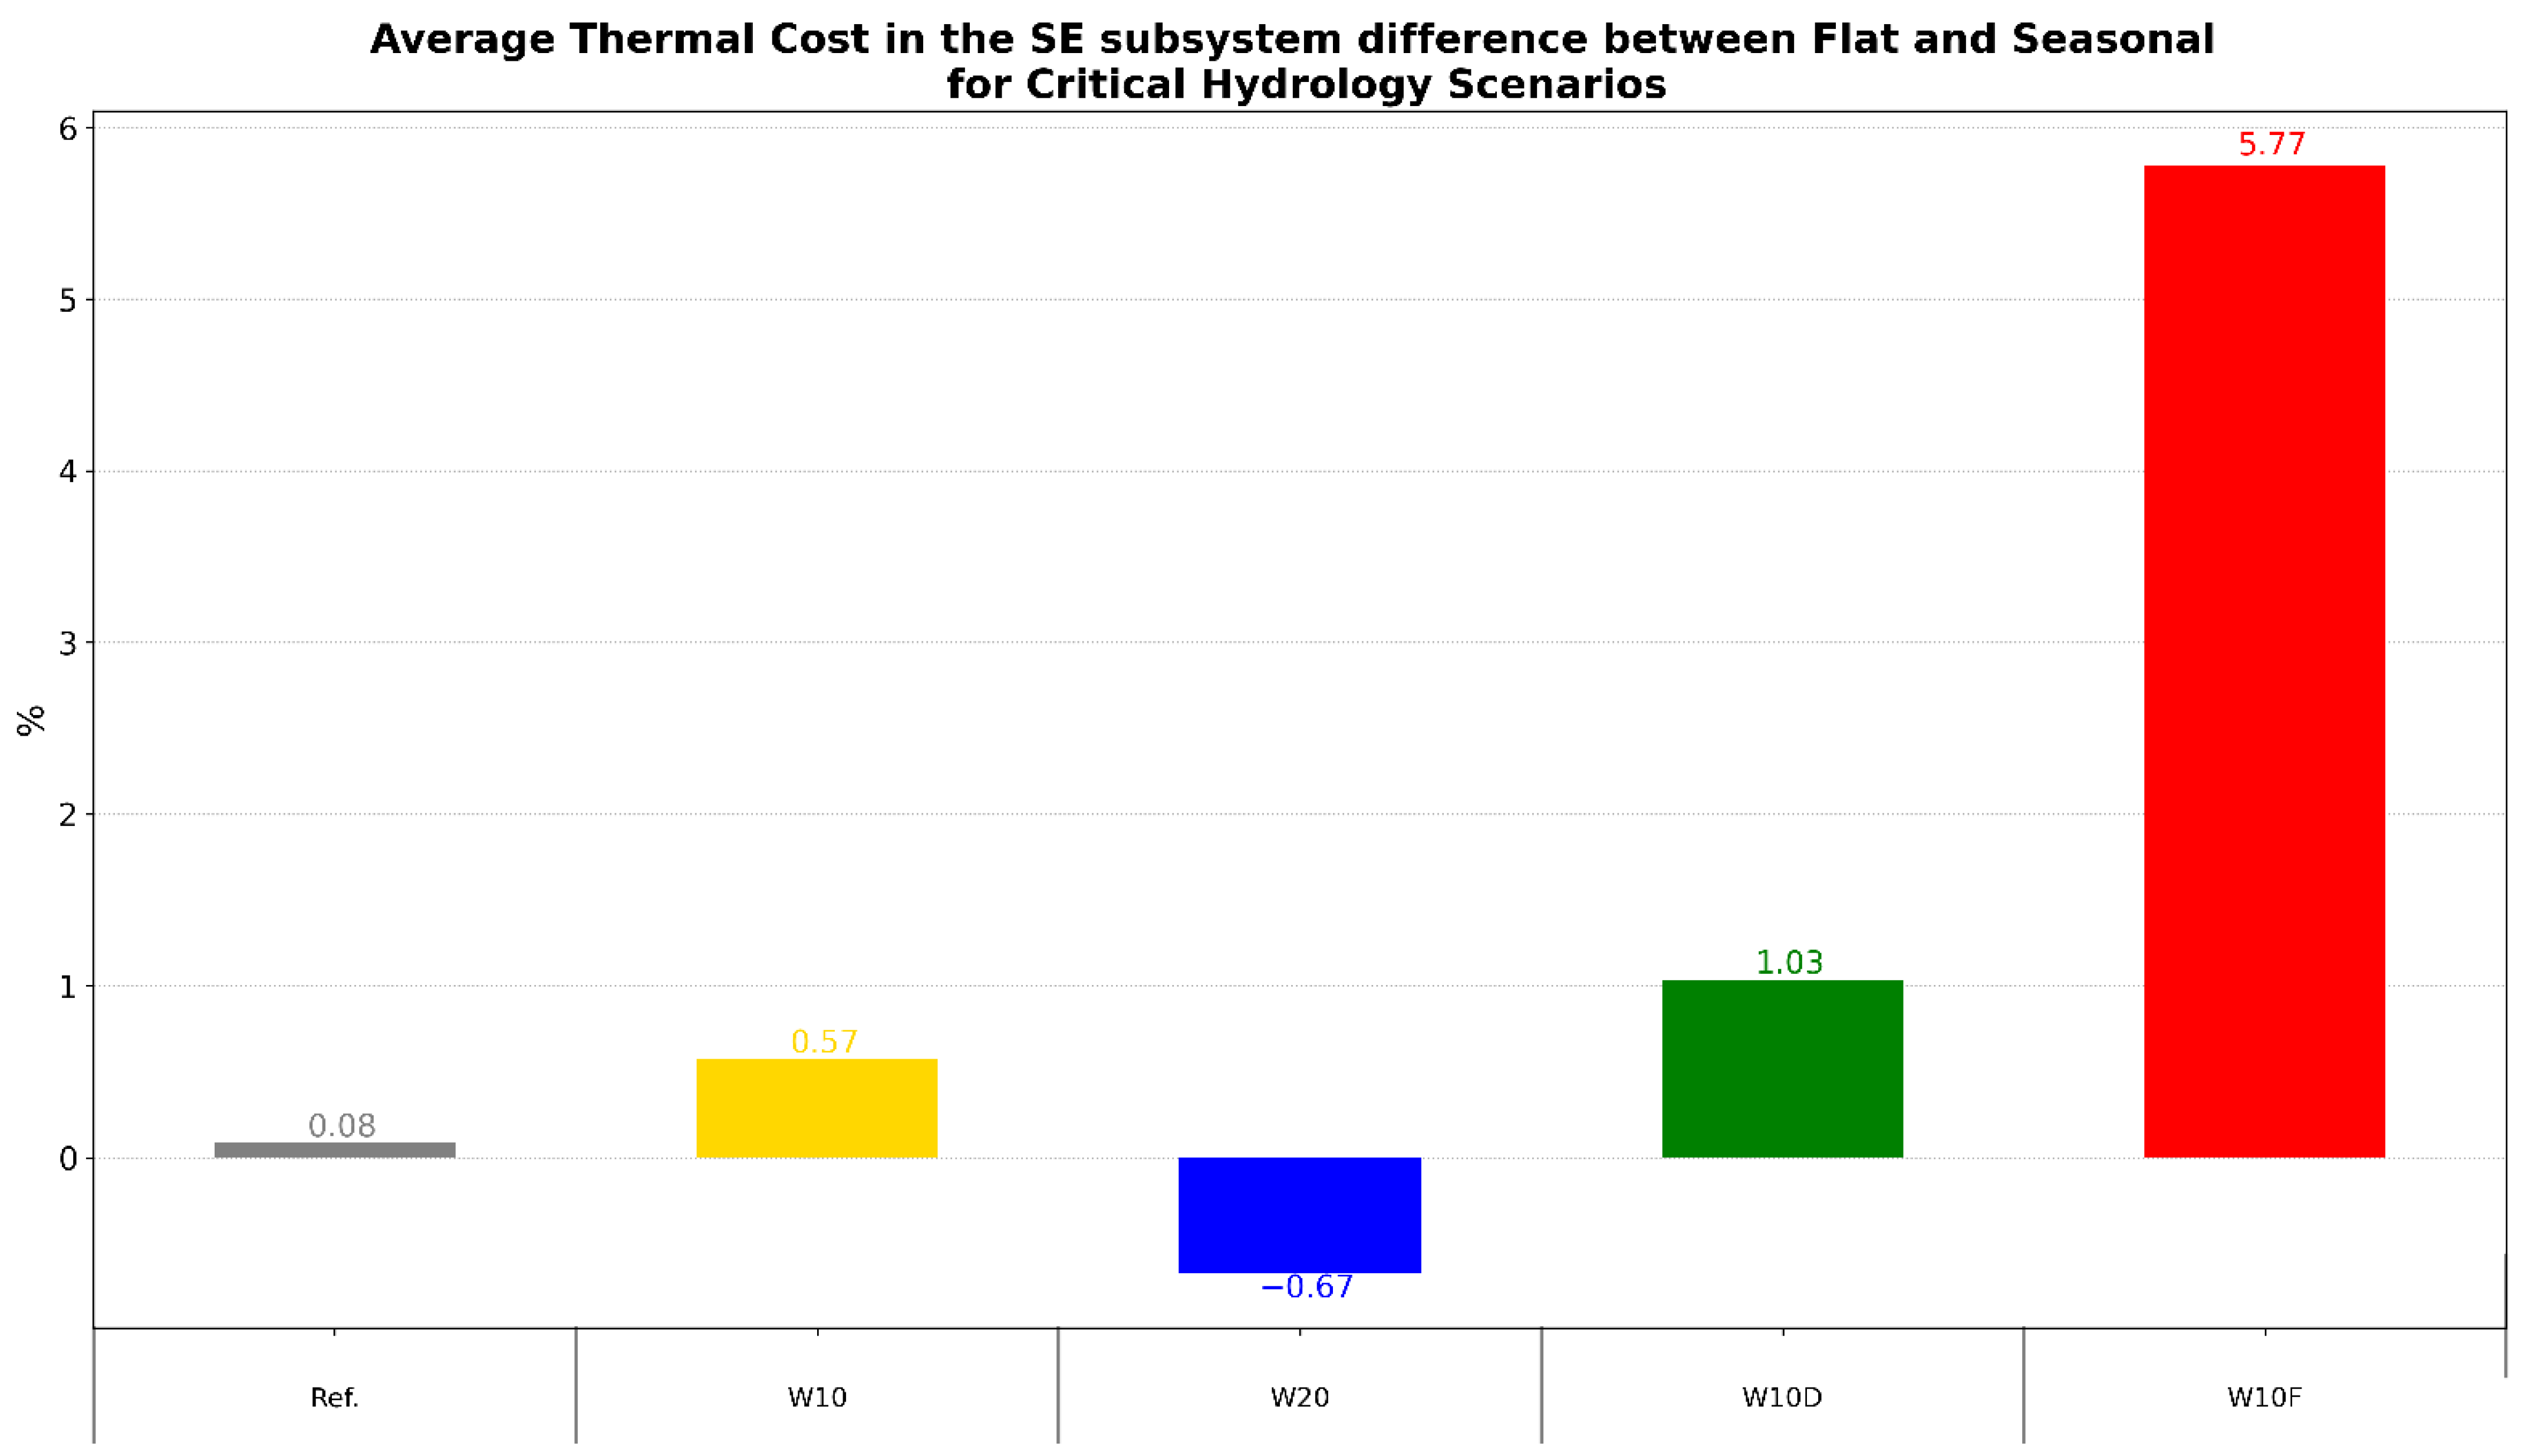
Secondly, when comparing the seasonal and flat biomass generation for each case, it is possible to notice that the flat biomass generation slightly reduced SRMC values by 1% and 3.5% for scenarios with load and biomass addition of 10% (W10) and 20% (W20), respectively. In the reference and in the W10D scenarios, the flat case was less than 0.5% more expensive than the seasonal one. It likely occurred due to the biomass addition’s impact on the netload. While the flat biomass generation affects the net load equally in the whole year, the seasonal biomass generation has greater impact in the year’s dry season and none in the wet period. Therefore, considering the fact that the hydrology is based on a drought period, the hydropower generation cannot deal with the load addition that is supposed to be supplied by biomass. It is emphasised in the stochastic case because of the uncertainty that the system must manage.
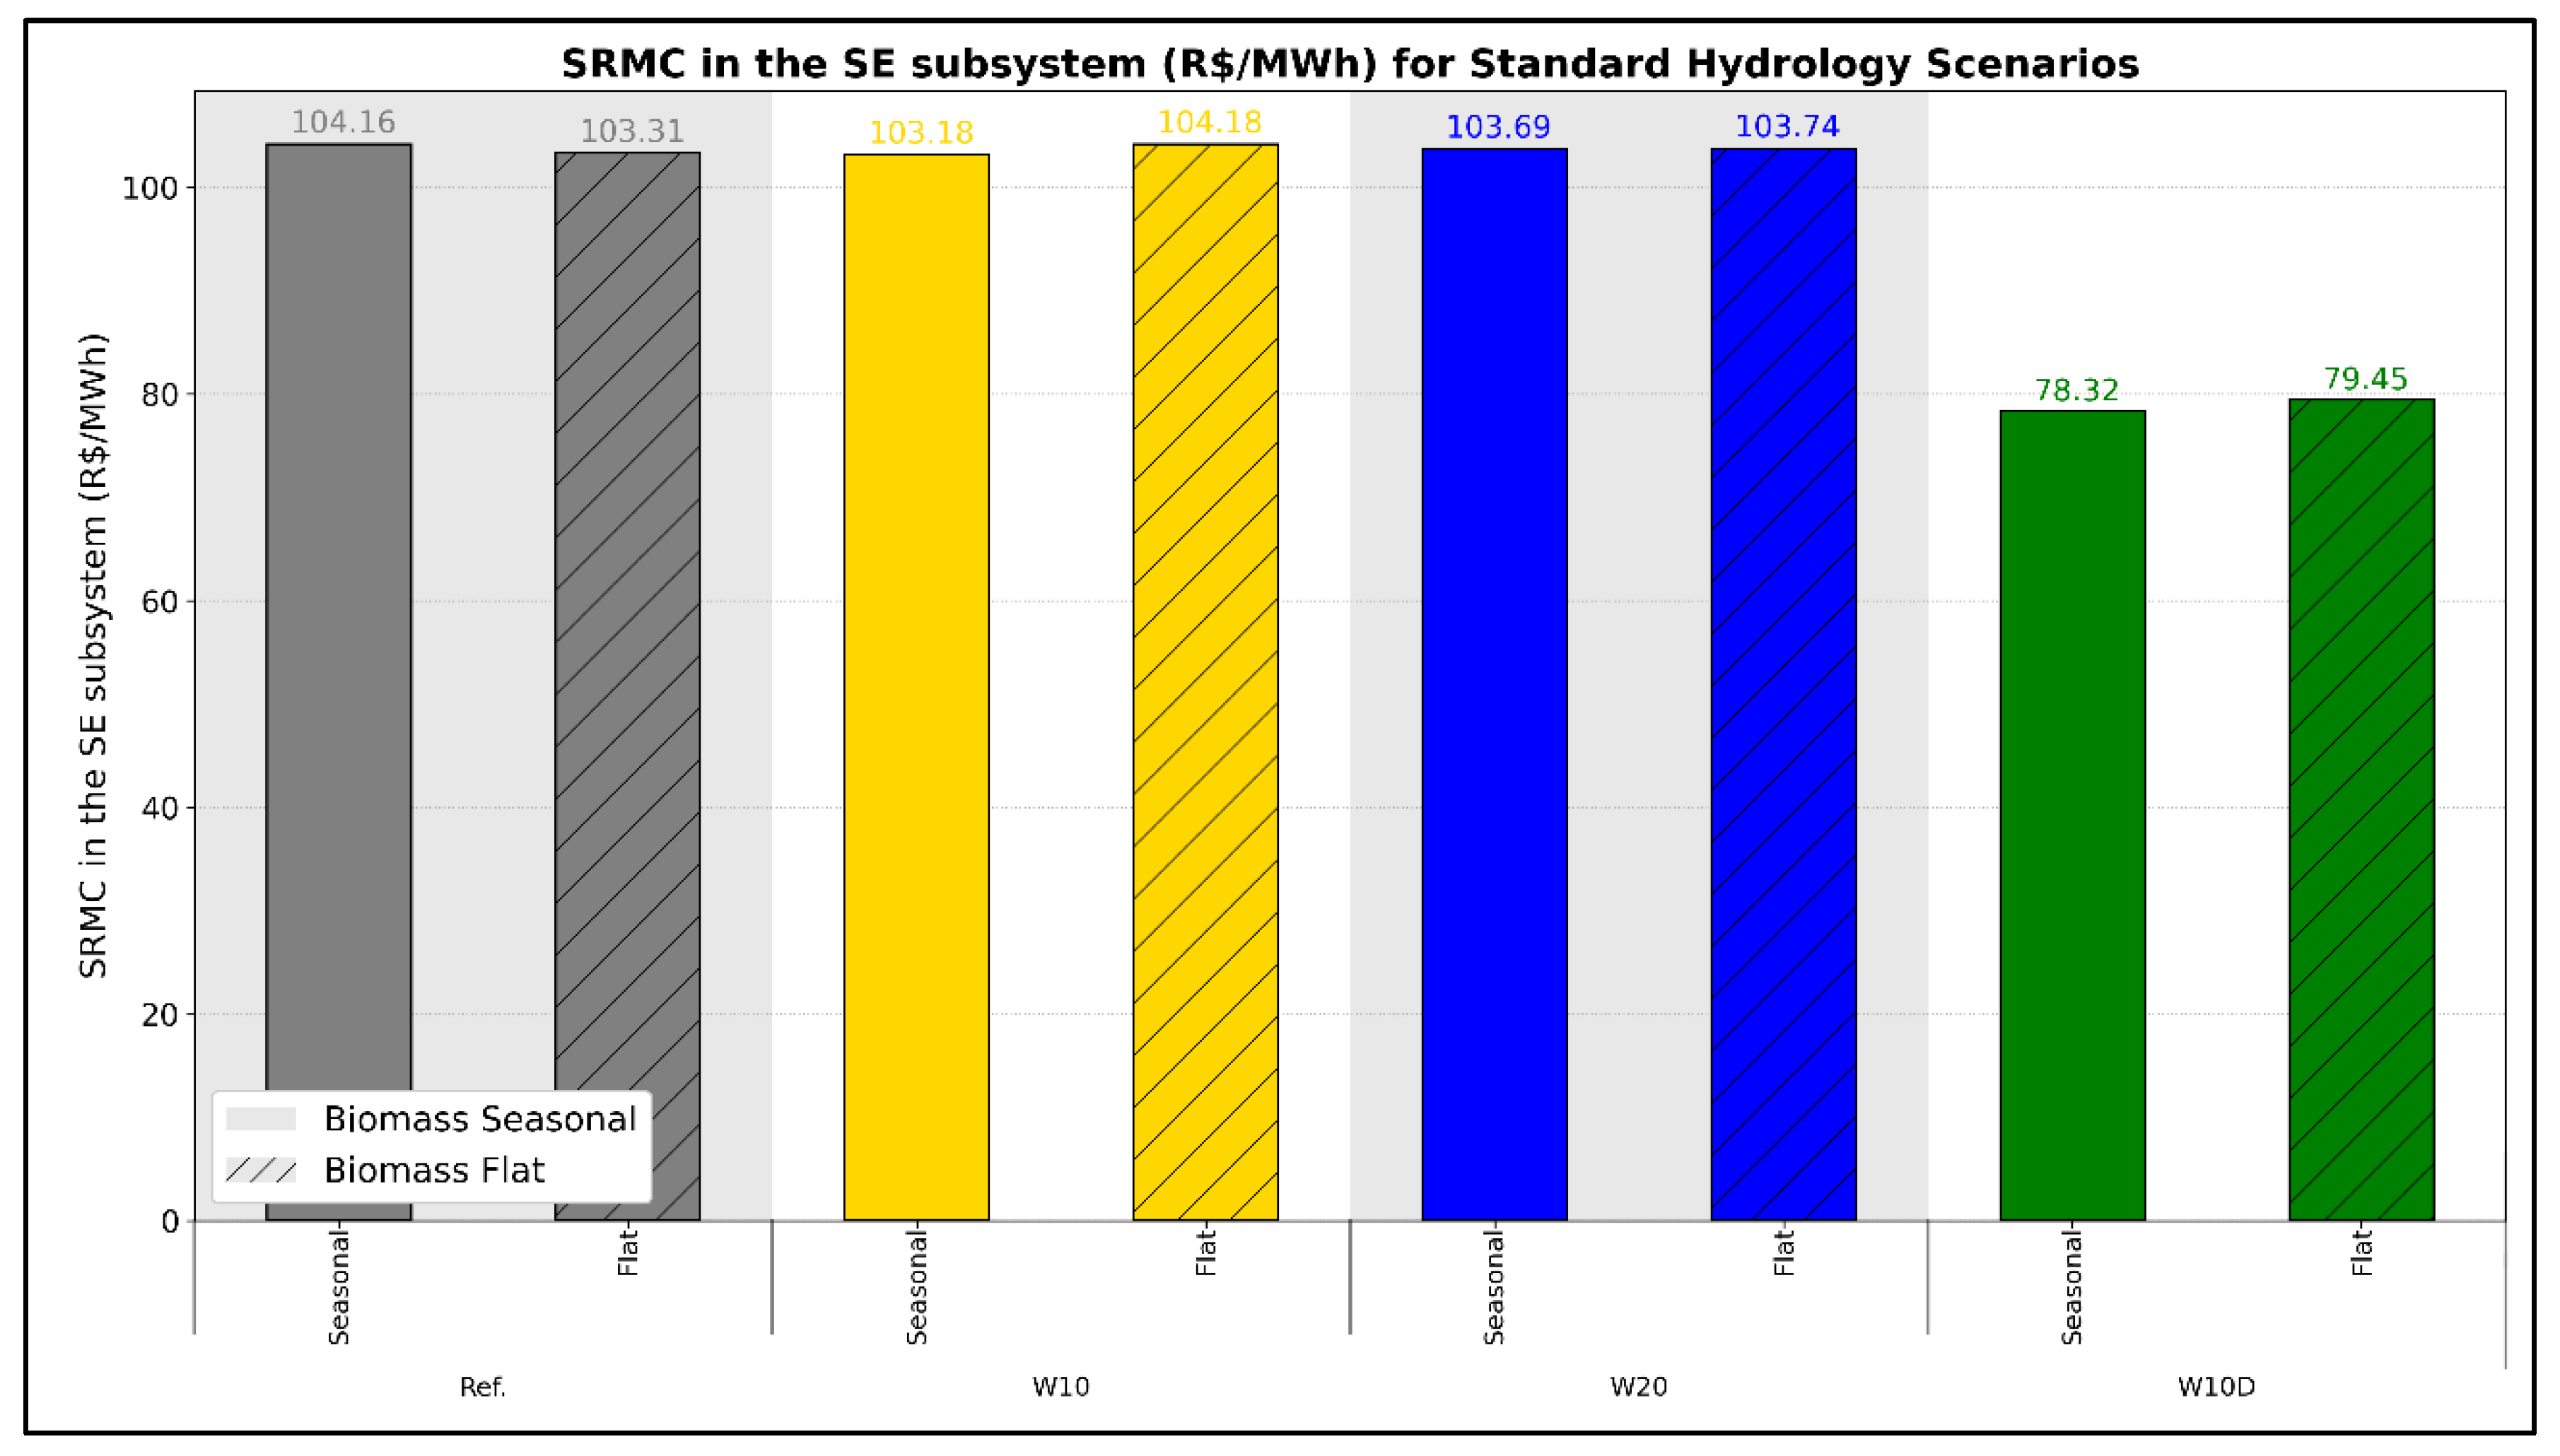
In the dry season, when biomass is available, it is not enough to fill the hydropower reservoirs. Due to the shortage of water in the wet period, there is no hydropower capacity to supply all additional demand, and thermal power plants must be dispatched. It should be noticed that in the scenarios with standard hydrology, the difference between seasonal and flat biomass generation was much smaller because hydropower could supply most of the demand (Figure 5).
Finally, it must be highlighted that the impact of flat wind generation was much greater than flat biomass generation. The SRMC was almost 6.5% more expensive in the W10F (flat wind generation) than in the scenarios with flat or seasonal biomass and deterministic wind. This shows that wind power complementarity offered substantially more benefits to the system. As the percentage differences were insignificant between the flat and seasonally fluctuating bioelectricity results, this indicates that the seasonal character of bioelectricity was no longer providing noticeable benefits to the SIN.
The situations mentioned above were also observed for other selected parameters. Figure 6 and Figure 7 show that the alteration in the wind generation curve affected all of the indicators more than the alterations in the bioelectricity load generation curve. Part of the benefit from the bioelectricity seasonal generation curve was lost because of the intense variation over the generation months.
4. Discussion
The Brazilian Experience: The Need for Integrated Bioelectricity Policies
Several studies have demonstrated the importance of bioelectricity for the decarbonisation process in the Brazilian energy mix [41,43,80]. Despite this acknowledgement, this study identified concerns from the perspective of the bioelectricity sector in the Brazilian context. The results suggest that bioelectricity is losing relevance in the SIN due to a loss of competitiveness compared to other renewable sources and transformations in the Brazilian electric system that are led by sources that are providing better systemic benefits when compared with bioelectricity.
The analyses of energy auctions showed that bioelectricity had lost competitiveness compared to other energy resources, especially wind power. The policies developed to promote electric energy generation based on renewable sources have always favoured wind and solar sources, small hydroelectric sources, and bioelectricity (Table 1). However, bioelectricity has suffered from the constant alteration in market signals, indicated by price ceiling variations and the consequent dismantling of the value chain, as discussed in Section 3.1. In the meantime, other renewable sources reached lower price levels, and the competition in energy auctions negatively affected bioelectricity, with wind power generation attaining greater installed capacity relative to bioelectricity in 2016. This finding is supported by various studies [45,46].
The more diversified the generation mix, the more regulatory changes are needed to overcome these barriers and enhance the relative competitiveness of bioelectricity. This can be done through dedicated bioelectricity auctions, regional auctions, procurement-specific auctions, or even pricing for non-GHG emission or locational attributes. Furthermore, sugarcane straw is not likely to contribute significantly to bioelectricity expansion because of technical and regulatory barriers such as low and volatile prices, demand for a high amount of energy, absence of long-term policies, small experience of the sector regarding the straw collection, store and transport, need of extra investments on special boilers, and demand for specific machines for straw packing [81,82,83,84,85]. All these aspects related with bioelectricity from sugarcane straw could be further explored; however, this was not the goal of this work. Other studies indicate that auction prices do not make the sugarcane generation potential feasible [48,50].
Regarding transformations in the Brazilian energy system, bioelectricity projects still face historical problems connecting with the transmission system. Increased demand and stalled construction of large hydroelectric reservoirs have eroded the SIN’s storage capacity relative to the national need. Although the system can store approximately 292 GW, projections show that in 2023, the system will have only 4.8 months’ worth of energy stock [62]. In addition, the Brazilian power system is expected to require energy resources that provide sufficient flexibility to meet the peak demand, with the share of natural gas projects expected to increase in the coming years [37]. To meet these needs, the complementarity between hydroelectricity and RE sources should be explored [62]. However, the simulations performed during this study suggested that these advantages are barely perceptible when it comes to biomass power because, despite generating higher amounts of bioelectricity in the dry season, the wide variation in capacity during other months reduces this benefit considerably.
The simulations also showed that wind power generation could be more relevant (Figure 5) because wind power generation is also complementary to hydroelectric power generation [80]. The substantial reinforcements for the connections among the SIN subsystems have also facilitated the exploitation of wind power generation complementarity. Along with these developments, from 2014 ahead, the extension of transmission lines added to the system increased year after year; in 2020, it reached 147,692 km of transmission lines added to SIN connections among the four regions [2]. Between 2019 and 2023, significant efforts were and will be made to expand the capacity of the subsystems for receiving and exporting power. The North-East subsystem will increase its capacity to export to the South-East/Mid-West by 141.2% [71], leveraging synergies among the different hydrographic basins and complementary wind power from the North-East subsystem.
In that sense, one of the main advantages of bioelectricity is also delivered by wind power. It hampers the capacity of bioelectricity to offer valuable services to the power system once there are better and cheaper alternatives. Therefore, it is possible to inquire if it is still logical to keep investing and promoting bioelectricity from sugarcane.
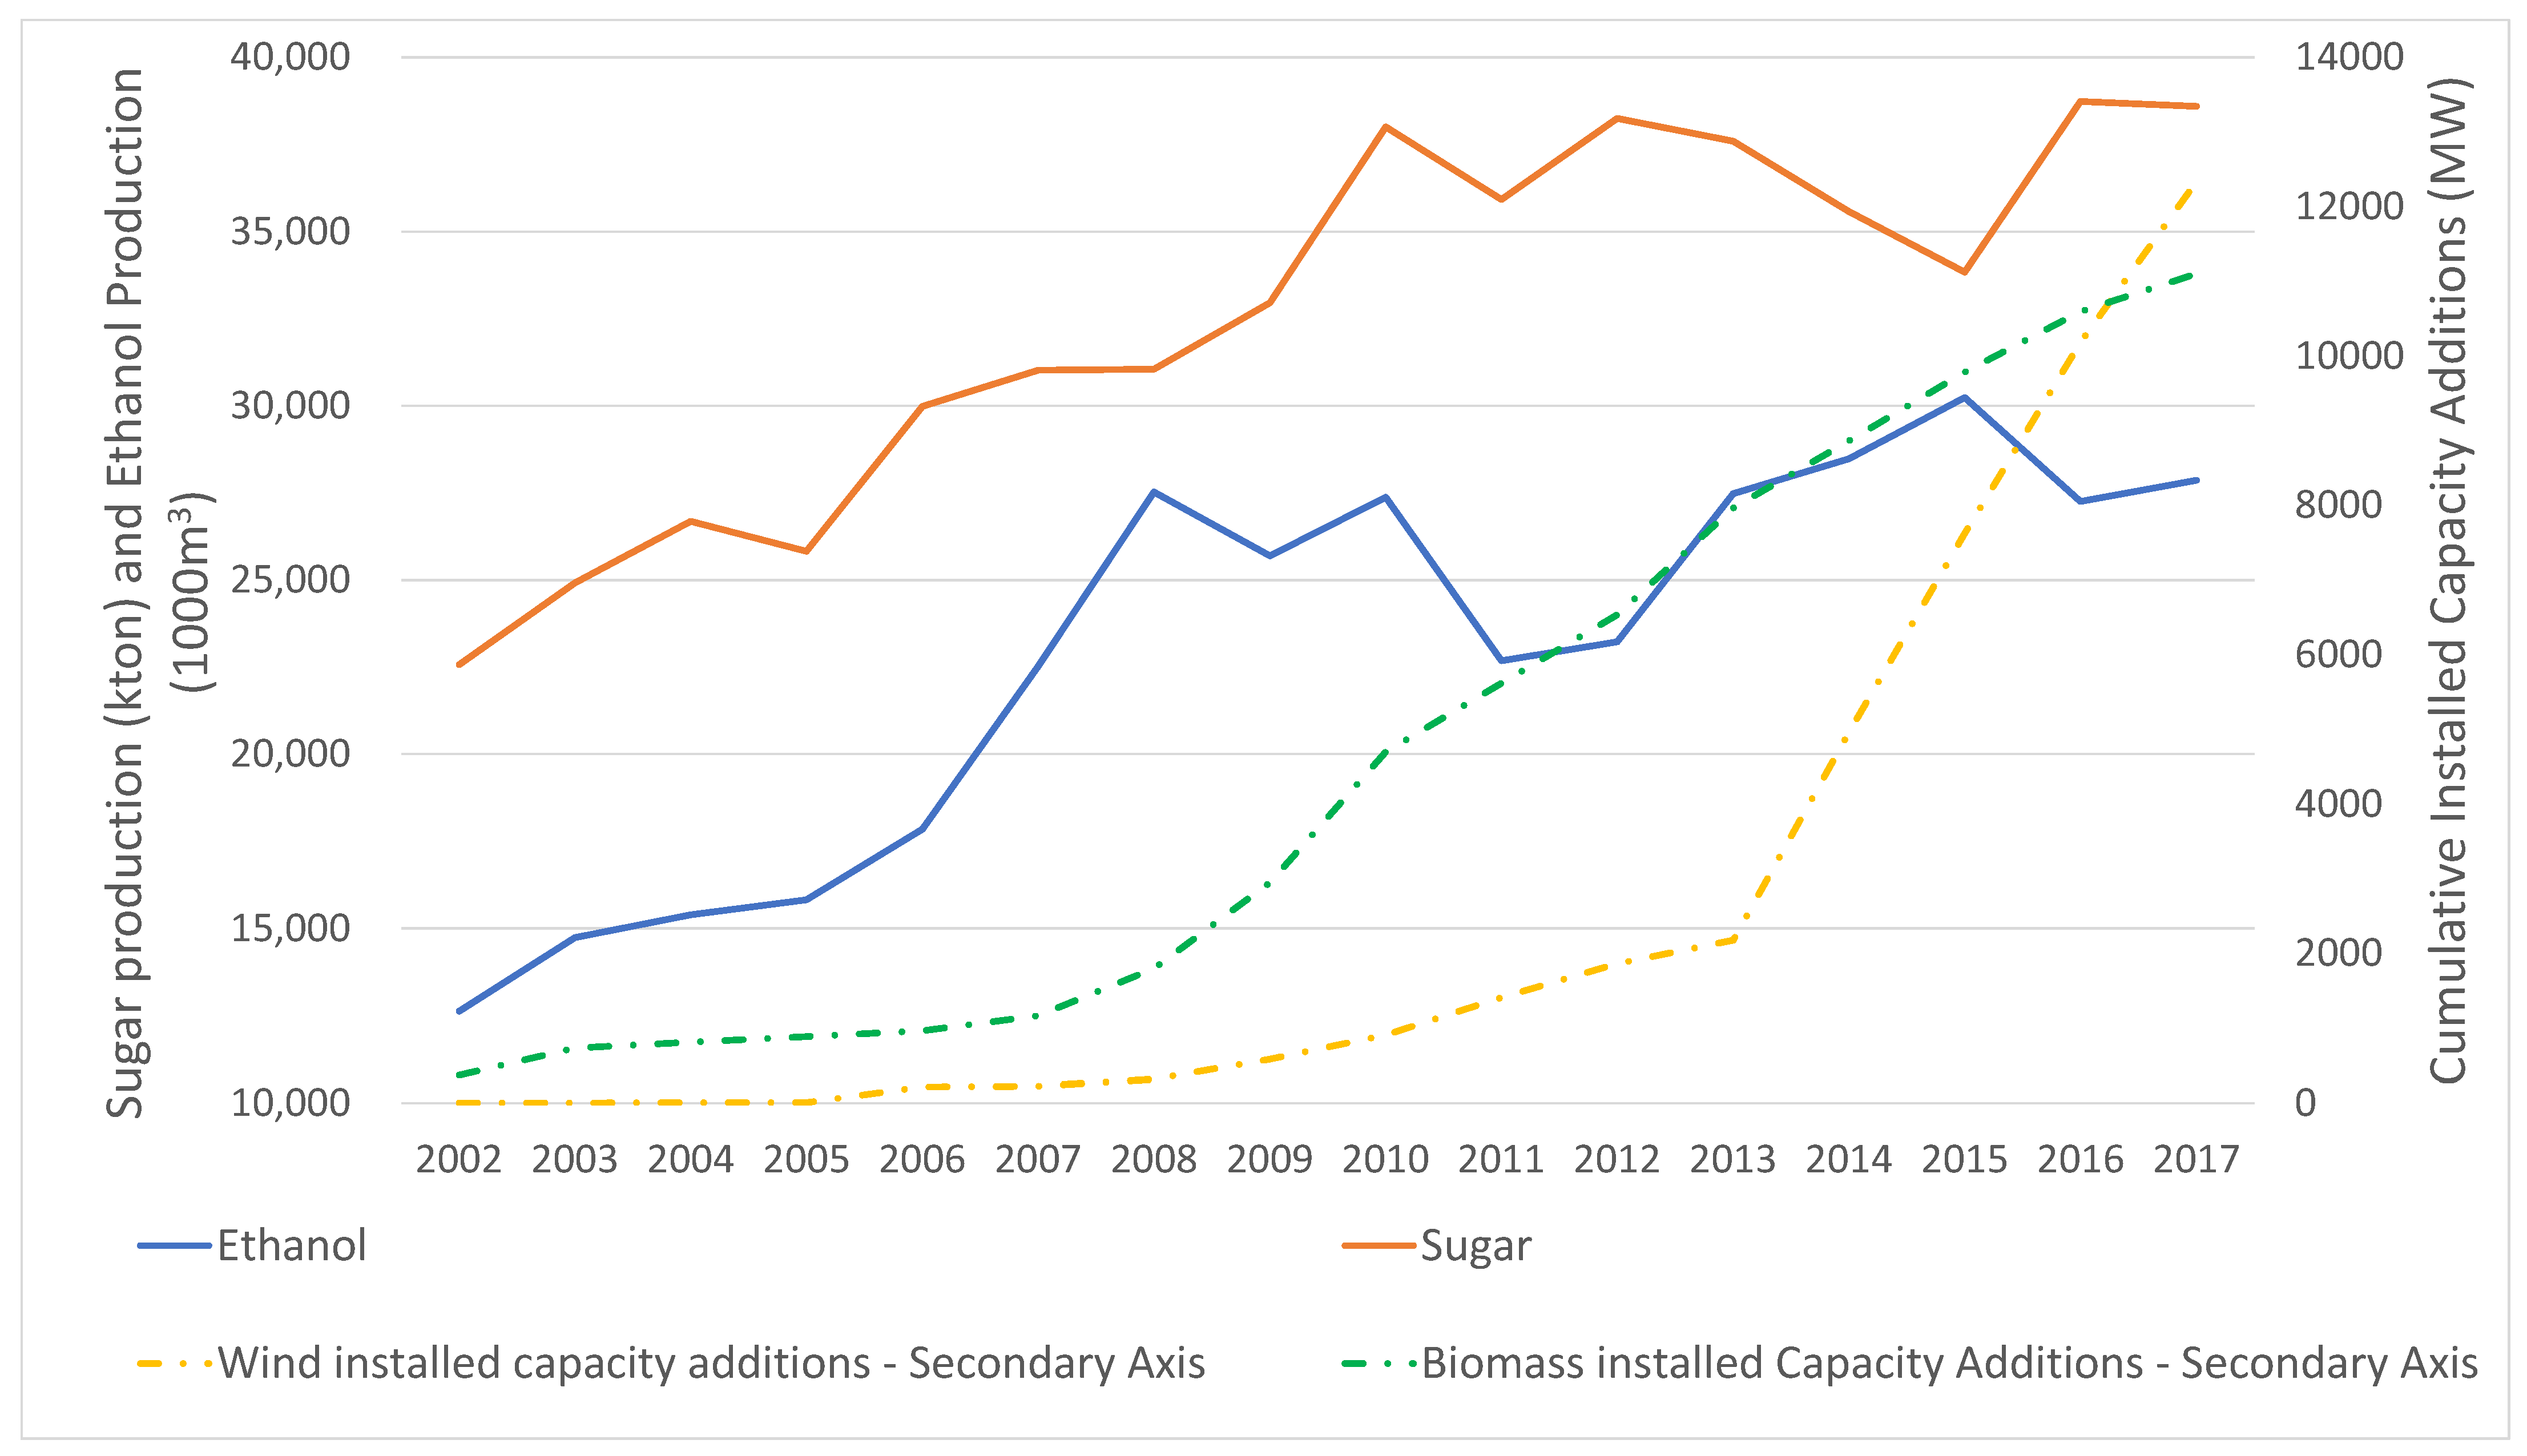
In the last 20 years, evidence suggests that the sugarcane-derived bioelectricity installed capacity expanded concomitantly with the sugar and (mainly) ethanol market expansion. Figure 8 presents the bioelectricity and wind power installed capacity growth from 2002 to 2017, clearly showing the correlation of the bioelectricity installed capacity expansion with the expansion of the sugar-energy sector, which increased sugar and ethanol production by 71 and 121%, respectively [86].
An integrated biofuel–sugar–bioelectricity policy could make sense and foster investments in bioelectricity in the way it would make sense to keep adding this source to the power sector. However, no integrated policy for bioelectricity and ethanol considers the dynamics of the electric and sugar-energy sectors. Although fuel sector policies negatively affected the sugar-energy sector, bioelectricity benefited from incentive policies for RE expansion (Table 1).
Furthermore, the findings and discussion herein presented can be useful for other countries to take advantage of the Brazilian experience in order to develop policies focusing on renewable energy source and bioelectricity. Of course, each country has its peculiarities, but the Brazilian case can be analysed under a specific view for different perspectives.
The current study did not develop an integrated biomass sector analysis. It focused on the power sector and the potential benefits of bioelectricity from sugarcane. The results indicate that bioelectricity is not the cheapest, neither the best source to complement hydropower. Regarding the non-GHG emission attribute, one Brazilian case study suggested that pricing in the range of 10 USD/tCO2eq would not alter relative competitiveness among generation sources, especially because the current cheapest alternatives are also non-GHG emitters [87]. However, this aspect was not thoroughly evaluated in this study and needs to be addressed in future investigations.
5. Conclusions
The analysis of the Brazilian case is relevant because Brazil has implemented incentives for RE that also benefited sugarcane bioelectricity and because of the importance of the sugar-energy sector in Brazil. Moreover, Brazil is one of the main countries in developing the biomass sector. Brazil’s bioelectricity prospects can be analysed as resulting from interactions between the sugar-energy and electric sectors. The methodological approach evaluated the bioelectricity sector from different perspectives: competitiveness of bioelectricity in energy auctions and its systemic benefits in the Brazilian electric sector. Market conditions and specific competitiveness factors affect bioelectricity supply. We found that wind and solar energy generation has been expanding rapidly with relatively lesser investments, and sugarcane-derived bioelectricity lost significance and competitiveness in such an environment.
Technological developments and RE incentive policies have reduced the procurement costs of wind and solar sources; moreover, supporting changes to the layout of the energy system for integrating wind and solar energy and the policies developed for these sectors negatively affected the competitiveness and development of bioelectricity. The new context of RE integration will involve greater competition between variable renewable sources, with bioelectricity remaining as a contributor to the SIN but with decreased importance and relative presence in the Brazilian energy mix.
This study shows that bioelectricity seasonality is not as good as it was disseminated, and the complementarity between wind power and hydropower generation is more intense. The findings can contribute to policies for expanding bioelectricity in the electric energy generation mix on the basis of its real value to the power sector. Future research might investigate whether valuing some of the bioelectricity attributes, such as non-GHG emissions and location near demand centres, would alter the competitiveness of bioelectricity. It would also be important to assess whether the simulation results would be significantly different considering the hourly or sub-hourly resolution, as well as larger time horizons.
The design of policies that integrate and coordinate sectors is critical to realising the potential of bioelectricity. For now, in Brazil, bioelectricity development can take advantage of the National Biofuel Policy (RenovaBio) that could foster a recovery in the sector that would improve the expansion of the bioelectricity supply [29,76]. The costs and barriers inherent to the power sector should be considered, as well as those that will provide bioenergetic waste for energy generation. In addition, consistent price signals are essential to mobilise the value chain of the biomass sector in preparation for new projects. These findings have relevant implications for policy design in Brazil, and at the same they can be used as an example for any other country that aims to invest in this source since Brazil is one of the countries with greater know-how on biomass and bioelectricity use.
Supplementary Materials
The following supporting information can be downloaded at https://www.mdpi.com/article/10.3390/en16020955/s1. Table S1: Parameters used to compute the technical potential to generate bioelectricity from sugarcane residues.
Author Contributions
Conceptualisation, M.Y.S. and D.S.R.; methodology, M.Y.S. and D.S.R.; software, M.Y.S.; validation, M.Y.S., D.S.R., M.d.O.P. and F.A.D.; formal analysis, M.Y.S. and F.A.D.; writing—original draft preparation, M.Y.S.; writing—review and editing, D.S.R., M.d.O.P. and F.A.D.; supervision, M.Y.S. and D.S.R. All authors have read and agreed to the published version of the manuscript.
Funding
This research received no external funding.
Institutional Review Board Statement
Not applicable.
Informed Consent Statement
Not applicable.
Data Availability Statement
Data is contained within the article or supplementary material.
Acknowledgments
This study was developed within the scope and with the sponsorship of the Research and Technological Development Program of the Electric Energy Sector regulated by the National Electric Energy Agency (ANEEL) as part of the R&D project (code Aneel PD—00061-0057/2017), named Co-generation of Electric Energy in the Sugar and Alcohol Sector with the Use of Regional Bioenergetics: Technological Routes for the Optimization of the Productive Process and Business Model for the Commercialization of Generated Energy.
Conflicts of Interest
The authors declare no conflict of interest. The funders had no role in the design of the study; in the collection, analyses, or interpretation of data; in the writing of the manuscript; or in the decision to publish the results.
References
- EPE. Balanço Energético Nacional; EPE: Rio de Janeiro, Brazil, 2021. [Google Scholar]
- EPE. 2021 Statistical Yearbook of Electricity; EPE: Rio de Janeiro, Brazil, 2021; p. 255. [Google Scholar]
- CCEE. Câmara de Comercialização de Energia Elétrica InfoMercado Dados Gerais; EPE: Rio de Janeiro, Brazil, 2020. [Google Scholar]
- Coelho, S.T. Mecanismos Para Implementação da Co-Geração de Eletricidade a Partir de Biomassa. Um Modelo Para o Estado de São Paulo; Universidade de São Paulo: São Paulo, Brazil, 1999. [Google Scholar]
- Khatiwada, D.; Seabra, J.; Silveira, S.; Walter, A. Power Generation from Sugarcane Biomass–A Complementary Option to Hydroelectricity in Nepal and Brazil. Energy 2012, 48, 241–254. [Google Scholar] [CrossRef]
- Tomaz, W.L. Viabilidade e Perspectiva da Cogeração e Da Geração Termelétrica Junto Ao Setor Sucro-Alcooleiro; UNICAMP: Rio de Janeiro, Brazil, 1994. [Google Scholar]
- International Renewable Energy Agency. Renewable Energy Benefits: Understanding the Socio-Economics. IRENA 2017, 1–16. [Google Scholar]
- Laureti, L.; Rogges, M.G.L.; Costantiello, A. Evaluation of Economic, Social Effects of Renewable Energy Technologies. J. Environ. Prot. 2018, 9, 1143–1154. [Google Scholar] [CrossRef] [Green Version]
- Shoaib, A.; Ariaratnam, S. A Study of Socioeconomic Impacts of Renewable Energy Projects in Afghanistan. Procedia Eng. 2016, 145, 995–1003. [Google Scholar] [CrossRef] [Green Version]
- IEA. Bioenergy Implementation of Bioenergy in Brazil–2021 Update. IEA Bioenergy 2021, 10, 1–15. [Google Scholar]
- Bhandari, R.; Sessa, V. Energy in Agriculture in Brazil. Rev. Cienc. Agron. 2020, 51, 1–11. [Google Scholar] [CrossRef]
- Philp, J. Biomass for a Sustainable Bioeconomy: Technology and Governance; Organisation for Economic Co-operation and Development: Paris, France, 2016.
- Carneiro, P.; Ferreira, P. The Economic, Environmental and Strategic Value of Biomass. Renew. Energy 2012, 44, 17–22. [Google Scholar] [CrossRef] [Green Version]
- da Silva, A.J.R. Project SUCRE Sustainable Bioelectricity; Terminal Evaluation Report; LNBR: Campinas, Brazil, 2020. [Google Scholar]
- Ruiz, B.J.; Rodríguez, V.; Bermann, C. Analysis and Perspectives of the Government Programs to Promote the Renewable Electricity Generation in Brazil. Energy Policy 2007, 35, 2989–2994. [Google Scholar] [CrossRef]
- Nakao Cavaliero, C.K.; Da Silva, E.P. Electricity Generation: Regulatory Mechanisms to Incentive Renewable Alternative Energy Sources in Brazil. Energy Policy 2005, 33, 1745–1752. [Google Scholar] [CrossRef]
- Eletrobras PROINFA. Available online: https://eletrobras.com/pt/Paginas/Proinfa.aspx (accessed on 1 April 2021).
- MME. PROINFA–Diagnóstico e Perspectivas; MME: Brasilia, Brazil, 2008. [Google Scholar]
- IEMA. Energia Eólica No Brasil; IEMA: São Paulo, Brazil, 2015. [Google Scholar]
- IEMA. Energia Solar Fotovoltaica No Brasil; IEMA: São Paulo, Brazil, 2015. [Google Scholar]
- Nascimento, R.L. Energia Solar No Brasil: Situação e Perspectivas; Câmara dos Deputados: Brasília, Brazil, 2017. [Google Scholar]
- CCEE. Regras de Comercialização–Cáclulo Do Desconto Aplicado a TUSD/TUST. 2019. Available online: https://www.ccee.org.br/ccee/documentos/CCEE_054272 (accessed on 17 November 2022).
- Rego, E.E.; de Oliveira Ribeiro, C. Successful Brazilian Experience for Promoting Wind Energy Generation. Electr. J. 2018, 31, 13–17. [Google Scholar] [CrossRef]
- Lopez Soto, D.; Mejdalani, A.; Nogales, A.; Tolmasquim, M.; Hallack, M. Advancing the Policy Design and Regulatory Framework for Renewable Energies in Latin America and the Caribbean for Grid-Scale and Distributed Generation; IDB: Washington, DC, USA, 2019. [Google Scholar] [CrossRef]
- ONS. Operador Nacional do Sistema Numbers of the System. Available online: http://www.ons.org.br/paginas/sobre-o-sin/o-sistema-em-numeros/ (accessed on 17 November 2022).
- EPE. Brazilian Energy Balance: Base Year 2014; EPE: Rio de Janeiro, Brazil, 2015. [Google Scholar]
- ONS. Histórico da Operação–Installed Capacity. Available online: http://www.ons.org.br/Paginas/resultados-da-operacao/historico-da-operacao/capacidade_instalada.aspx (accessed on 17 November 2022).
- EPE. Anuário Estatístico de Energia Elétrica Ano Base 2018; EPE: Rio de Janeiro, Brazil, 2019. [Google Scholar]
- EPE. Anuário Estatístico de Energia Elétrica 2018 No Ano Base de 2017; EPE: Rio de Janeiro, Brazil, 2018. [Google Scholar]
- Szczygielski, J.J.; Brzeszczyński, J.; Charteris, A.; Bwanya, P.R. The COVID-19 Storm and the Energy Sector: The Impact and Role of Uncertainty. Energy Econ. 2021, 109, 105258. [Google Scholar] [CrossRef]
- Magazzino, C.; Mele, M.; Morelli, G. The Relationship between Renewable Energy and Economic Growth in a Time of COVID-19: A Machine Learning Experiment on the Brazilian Economy. Sustainability 2021, 13, 1285. [Google Scholar] [CrossRef]
- Marinho, P.R.D.; Cordeiro, G.M.; Coelho, H.F.C.; Cabral, P.C. The COVID-19 Pandemic in Brazil: Some Aspects and Tools. Epidemiologia 2021, 2, 243–255. [Google Scholar] [CrossRef]
- Carvalho, M.; Delgado, D.B.d.M.; Lima, K.M.; Cancela, M.; dos Siqueira, C.A.; Silva, D.L.B. Effects of the COVID-19 Pandemic on the Brazilian Electricity Consumption Patterns. Int. J. Energy Res. 2020, 45, 3358–3364. [Google Scholar] [CrossRef]
- Khatiwada, D.; Leduc, S.; Silveira, S.; McCallum, I. Optimizing Ethanol and Bioelectricity Production in Sugarcane Biorefineries in Brazil. Renew. Energy 2016, 85, 371–386. [Google Scholar] [CrossRef]
- Dantas, G.A.; Legey, L.F.L.; Mazzone, A. Energy from Sugarcane Bagasse in Brazil: An Assessment of the Productivity and Cost of Different Technological Routes. Renew. Sustain. Energy Rev. 2013, 21, 356–364. [Google Scholar] [CrossRef]
- Antonio Bizzo, W.; Lenço, P.C.; Carvalho, D.J.; Veiga, J.P.S. The Generation of Residual Biomass during the Production of Bio-Ethanol from Sugarcane, Its Characterization and Its Use in Energy Production. Renew. Sustain. Energy Rev. 2014, 29, 589–603. [Google Scholar] [CrossRef]
- EPE. Plano Decenal de Expanção de Energia 2029; EPE: Rio de Janeiro, Brazil, 2020. [Google Scholar]
- Brazil Intended Nationally Determined Contribution Towards Achieving the Objective of the United Nations Framework Convention on Climate Change; United Nations Framework Convention on Climate Change (UNFCCC): Bonn, Germany, 2015.
- Araujo, A.; Gross, A.; Molleta, C.F. Fourth Nacional Communication of Brazil to the UNFCC; United Nations Framework Convention on Climate Change (UNFCCC): Bonn, Germany, 2020. [Google Scholar]
- SEEG. Sistema de Estimativa de Emissões de Gases de Efeito Estufa; IEMA: São Paulo, Brazil, 2020. [Google Scholar]
- Santos, M.J.; Ferreira, P.; Araújo, M.; Portugal-Pereira, J.; Lucena, A.F.P.; Schaeffer, R. Scenarios for the Future Brazilian Power Sector Based on a Multi-Criteria Assessment. J. Clean. Prod. 2017, 167, 938–950. [Google Scholar] [CrossRef]
- Herreras Martínez, S.; Koberle, A.; Rochedo, P.; Schaeffer, R.; Lucena, A.; Szklo, A.; Ashina, S.; van Vuuren, D.P. Possible Energy Futures for Brazil and Latin America in Conservative and Stringent Mitigation Pathways up to 2050. Technol. Forecast Soc. Change 2015, 98, 186–210. [Google Scholar] [CrossRef] [Green Version]
- Dantas, G.d.A.; de Castro, N.J.; Brandão, R.; Rosental, R.; Lafranque, A. Prospects for the Brazilian Electricity Sector in the 2030s: Scenarios and Guidelines for Its Transformation. Renew. Sustain. Energy Rev. 2017, 68, 997–1007. [Google Scholar] [CrossRef]
- Grangeia, C.; Santos, L.; Lazaro, L.L.B. The Brazilian Biofuel Policy (RenovaBio) and Its Uncertainties: An Assessment of Technical, Socioeconomic and Institutional Aspects. Energy Convers. Manag. X 2022, 13, 100156. [Google Scholar] [CrossRef]
- EPE. Expansão Da Geração: Termelétricas a Biomassa Nos Leilões de Energia No Brasil; EPE: Rio de Janeiro, Brazil, 2019. [Google Scholar]
- Souza, G.F. De Avaliação Termodinâmica e Econômica de Alternativas de Diversificação da Produção No Setor Sucroalcooleiro Brasileiro; Universidade Federal De Itajubá: Itajubá, Brazil, 2013. [Google Scholar]
- Mutran, V.M.; Ribeiro, C.O.; Nascimento, C.A.O.; Chachuat, B. Risk-Conscious Optimization Model to Support Bioenergy Investments in the Brazilian Sugarcane Industry. Appl. Energy 2020, 258, 113978. [Google Scholar] [CrossRef]
- Filho, L.C.D. Estudo De Viabilidade Do Uso Do Palhiço Para Geração De Energia Na Entressafra De Uma Usina Sucroenergética, Fundação Getúlio Vargas Escola. 2013. Available online: https://bibliotecadigital.fgv.br/dspace/handle/10438/10958 (accessed on 17 November 2022).
- Redígolo, S.C.R. Recuperação Da Palha De Cana-De-Açúcar Para A Produção De Energia Elétrica E Etanol Celulósico; Universidade Estadual Paulista: São Paulo, Brazil, 2014. [Google Scholar]
- Lacerda, K.A. Remodelagem De Uma Usina Sucroalcooleira Para Incremento Da Cogeração De Energia Com Aproveitamento Do Palhiço; Universidade Estadual Paulista: São Paulo, Brazil, 2015. [Google Scholar]
- Contreras-Lisperguer, R.; Batuecas, E.; Mayo, C.; Díaz, R.; Pérez, F.J.; Springer, C. Sustainability Assessment of Electricity Cogeneration from Sugarcane Bagasse in Jamaica. J. Clean. Prod. 2018, 200, 390–401. [Google Scholar] [CrossRef]
- Mohammed, Y.S.; Mustafa, M.W.; Bashir, N.; Ogundola, M.A.; Umar, U. Sustainable Potential of Bioenergy Resources for Distributed Power Generation Development in Nigeria. Renew. Sustain. Energy Rev. 2014, 34, 361–370. [Google Scholar] [CrossRef]
- Alexis Sagastume Gutiérrez, Juan, J. Cabello Eras, Donald Huisingh, Carlo Vandecasteele, L.H. The Current Potential of Low-Carbon Economy and Biomass-Based Electricity in Cuba. J. Clean. Prod. 2018, 172, 2108–2122. [Google Scholar] [CrossRef]
- Hiloidhari, M.; Araújo, K.; Kumari, S.; Baruah, D.C.; Ramachandra, T.V.; Kataki, R.; Thakur, I.S. Bioelectricity from Sugarcane Bagasse Co-Generation in India—An Assessment of Resource Potential, Policies and Market Mobilization Opportunities for the Case of Uttar Pradesh. J. Clean. Prod. 2018, 182, 1012–1023. [Google Scholar] [CrossRef]
- Bryman, A. Integrating Quantitative and Qualitative Research: How Is It Done? Qual. Res. 2006, 6, 97–113. [Google Scholar] [CrossRef] [Green Version]
- Goldblatt, D.L.; Hartmann, C.; Dürrenberger, G. Combining Interviewing and Modeling for End-User Energy Conservation. Energy Policy 2005, 33, 257–271. [Google Scholar] [CrossRef]
- MME. Portaria no 514, de 27 de Dezembro de 2018; MME: Sao Paolo, Brazil, 2018. [Google Scholar]
- Rego, E.E. Proposta de Aperfeiçoamento da Metodologia Dos Leilões de Comercialização de Energia Elétrica No Ambiente Regulado: Aspectos Conceituais, Metodológicos e Suas Aplicações. Ph.D. Thesis, Universide de Sao Paolo, Sao Paolo, Brazil, 2012. [Google Scholar]
- Maurer, L.; Barroso, L. Electricity Auctions. 2011. Available online: https://elibrary.worldbank.org/doi/abs/10.1596/978-0-8213-8822-8 (accessed on 1 February 2021).
- IRENA. Renewable Energy Auctions–A Guide to Design. IRENA CEM 2015, 123–156. [Google Scholar]
- Tolmasquim, M.T.; de Barros Correia, T.; Addas Porto, N.; Kruger, W. Electricity Market Design and Renewable Energy Auctions: The Case of Brazil. Energy Policy 2021, 158. [Google Scholar] [CrossRef]
- CCEE. Câmara de Comercialização de Energia Elétrica Leilões de Mercado. Available online: https://www.ccee.org.br/mercado/leilao-mercado (accessed on 17 November 2022).
- Instuto Acende Brasil. Análise de Leilões. Available online: https://acendebrasil.com.br/leiloes/ (accessed on 17 November 2022).
- Maceira, M.E.P.; Duarte, V.S.; Penna, D.D.J.; Moraes, L.A.M.; Melo, A.C.G. Ten Years of Application of Stochastic Dual Dynamic Programming in Official and Agent Studies in Brazil–Description of the NEWAVE Program. Power Syst. Comput. Conf. 2008, 1–7. [Google Scholar]
- CEPEL. Manual de Referência–Newave; CEPEL: Rio De Janeiro, Brazil, 2012. [Google Scholar]
- de Freitas, R.A.; Vogel, E.P.; Korzenowski, A.L.; Oliveira Rocha, L.A. Stochastic Model to Aid Decision Making on Investments in Renewable Energy Generation: Portfolio Diffusion and Investor Risk Aversion. Renew. Energy 2020, 162, 1161–1176. [Google Scholar] [CrossRef]
- Ribeiro, G.B.d.D.; Batista, F.R.S.; de Magalhães, M.A.; Valverde, S.R.; Carneiro, A.d.C.O.; Amaral, D.H. Techno-Economic Feasibility Analysis of a Eucalyptus-Based Power Plant Using Woodchips. Biomass Bioenergy 2021, 153, 106218. [Google Scholar] [CrossRef]
- Maceiral, M.E.P.; Penna, D.D.J.; Diniz, A.L.; Pinto, R.J.; Melo, A.C.G.; Vasconcellos, C.V.; Cruz, C.B. Twenty Years of Application of Stochastic Dual Dynamic Programming in Official and Agent Studies in Brazil-Main Features and Improvements on the NEWAVE Model. Power Syst. Comput. Conf. 2018, 1–7. [Google Scholar] [CrossRef]
- Ferreira, P.G.C.; Oliveira, F.L.C.; Souza, R.C. The Stochastic Effects on the Brazilian Electrical Sector. Energy Econ. 2015, 49, 328–335. [Google Scholar] [CrossRef]
- Mummey, J.F.C. Uma Contribuição Metodológica Para a Otimização Da Operação E Expansão Do Sistema Hidrotérmico Brasileiro Mediante a Representação Estocástica Da Geração Eólica. Ph.D. Thesis, Universide de Sao Paolo, Sao Paolo, Brazil, May 2017. [Google Scholar]
- ONS. Sumário Do Programa Mensal de Operação (PMO); ONS: Rio de Janeiro, Brazil, 2019. [Google Scholar]
- ANEEL. Resolução Normativa No 843, de 2 de Abril de 2019; ANEEL: Rio de Janeiro, Brazil, 2019.
- ONS. Plano de Operação Energética 2019–2023; ONS: Rio de Janeiro, Brazil, 2019. [Google Scholar]
- ANEEL. Agência Nacional de Energia Elétrica Editais Dos Leiloes de Energia. Available online: https://www2.aneel.gov.br/aplicacoes_liferay/editais_geracao/edital_geracao.cfm (accessed on 17 November 2022).
- EPE. Plano Decenal de Expanção de Energia 2026; EPE: Rio de Janeiro, Brazil, 2017. [Google Scholar]
- EPE. Plano Decenal de Expansão de Energia 2024; EPE: Rio de Janeiro, Brazil, 2015. [Google Scholar]
- EPE. Plano Decenal de Expanção de Energia 2016; EPE: Rio de Janeiro, Brazil, 2007. [Google Scholar]
- IRENA. Future of Wind: Deployment, Investment, Technology, Grid Integration and Socio-Economic Aspects; IRENA: Abu Dhabi, United Arab Emirates, 2019; ISBN 9789292601553. [Google Scholar]
- IRENA. Renewable Power Generation Costs in 2020; IRENA: Abu Dhabi, United Arab Emirates, 2020; ISBN 978–92–9260–244–4. [Google Scholar]
- Schmidt, J.; Cancella, R.; Pereira, A.O. An Optimal Mix of Solar PV, Wind and Hydro Power for a Low-Carbon Electricity Supply in Brazil. Renew. Energy 2016, 85, 137–147. [Google Scholar] [CrossRef]
- Watanabe, M.D.B.; Morais, E.R.; Cardoso, T.F.; Chagas, M.F.; Junqueira, T.L.; Carvalho, D.J.; Bonomi, A. Process Simulation of Renewable Electricity from Sugarcane Straw: Techno-Economic Assessment of Retrofit Scenarios in Brazil. J. Clean. Prod. 2020, 254, 120081. [Google Scholar] [CrossRef]
- de Cássia Oliveira Pavan, M.; Ramos, D.S.; Soaresa, M.Y.; Barufi, C.; de Carvalho, M.M. Barriers to Broaden the Electricity Production from Biomass and Biogas in Brazil. Production 2021, 31, 1–20. [Google Scholar] [CrossRef]
- Project SUCRE. Sugarcane Straw Processing and Burning, 2013.
- CTC PALHA DE CANA: Desafios, Benefícios e Perspectivas. 2017. Available online: https://esalqlog.esalq.usp.br/upload/kceditor/files/2017/SILA14/Francisco%20Antonio%20Barba%20Linero.pdf (accessed on 1 December 2022).
- da Silva, J.B.S.; Villa-Vélez, H.A.; Júnior, J.B.; Conconi, C.C.; Cruz, G. Perspectives and Challenges of Sugarcane Straw for Bioenergy Production. In Sugarcane: Production, Properties and Uses; Nova Science Publishers: Hauppauge, NY, USA, 2020. [Google Scholar]
- UNICA. Histórico da Produção e Moagem 2019. Available online: https://unica.com.br/ (accessed on 1 June 2021).
- PSR. Custos e Benefícios Das Fontes de Geração Elétrica; PSR: São Paulo, Brazil, 2018. [Google Scholar]
Figure 1.
Bioelectricity projects registered and qualified for energy auctions in Brazil [30,43,44].

Figure 2.
Auction prices and procured energy in MW(avg) for bioelectricity from 2008 to 2019 Based on [62,74].


Figure 4.
Short-run marginal cost for scenarios with critical hydrology.

Figure 5.
Short-run marginal cost for scenarios with standard hydrology.

Figure 6.
Percentage difference between flat and seasonal cases for average thermal cost in the southeast subsystem for scenarios with critical hydrology.
Figure 6.
Percentage difference between flat and seasonal cases for average thermal cost in the southeast subsystem for scenarios with critical hydrology.

Figure 7.
Percentage difference between flat and seasonal cases for total cost in the system for scenarios with critical hydrology.
Figure 7.
Percentage difference between flat and seasonal cases for total cost in the system for scenarios with critical hydrology.
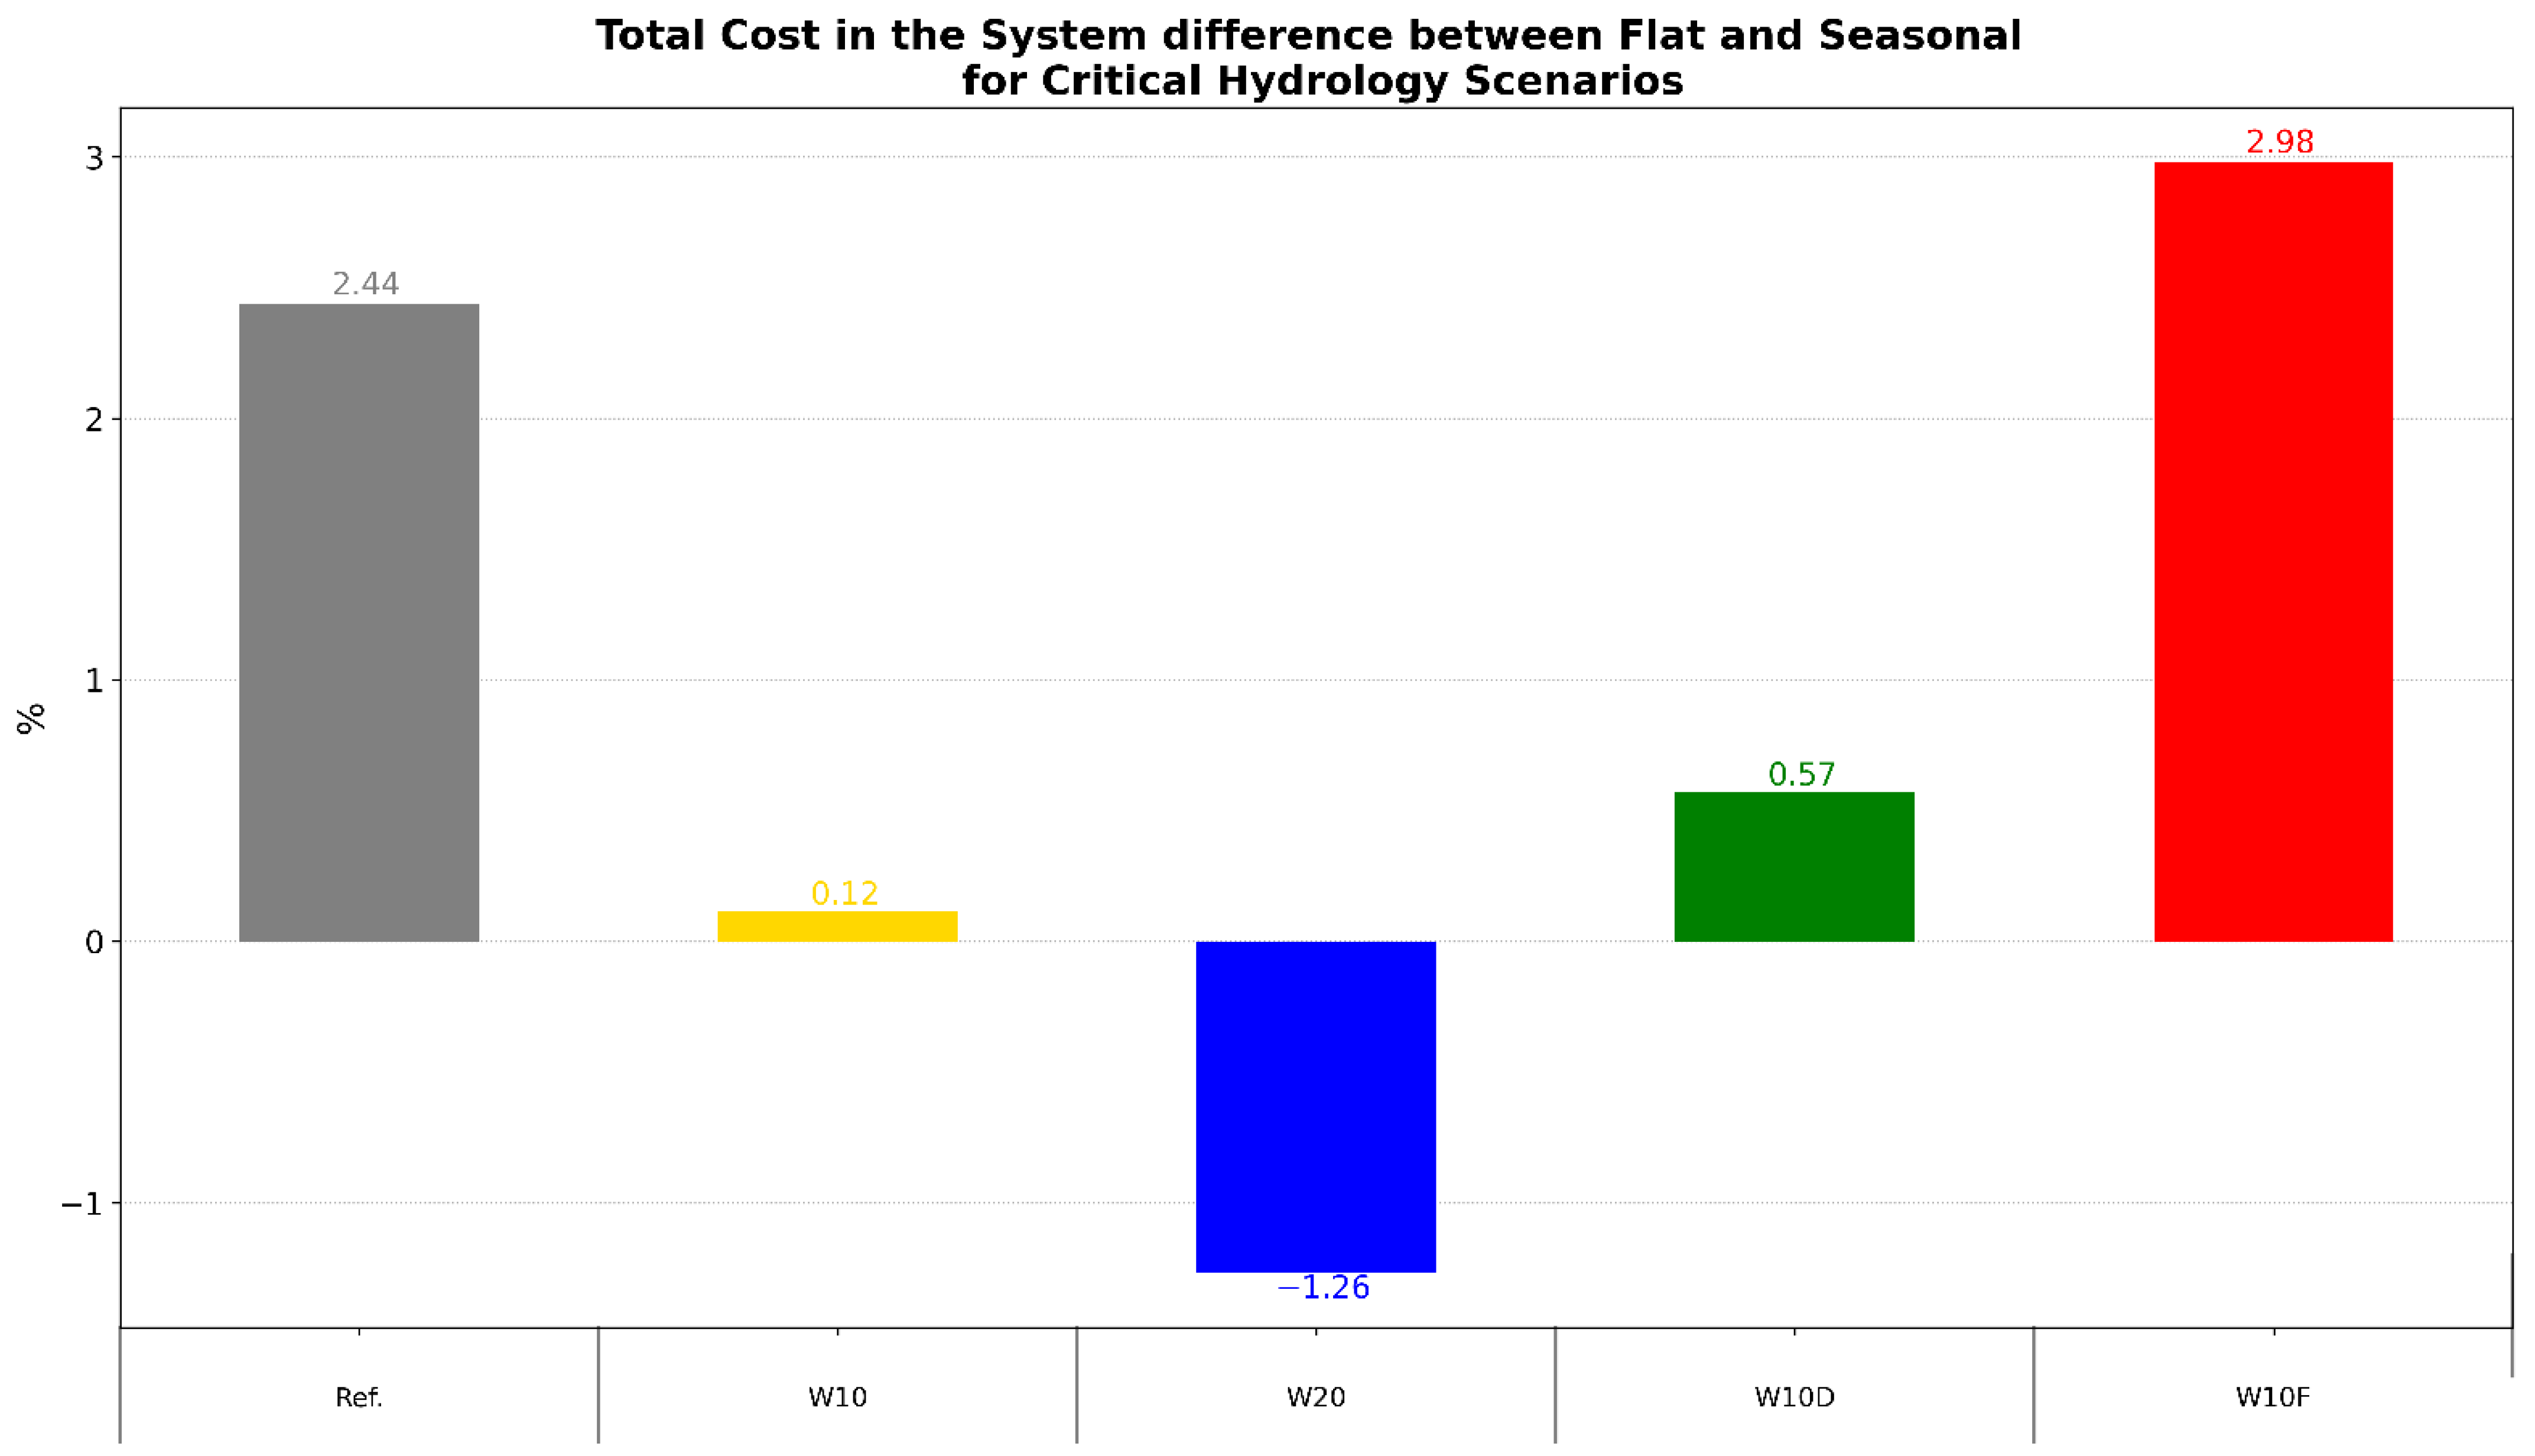
Figure 8.
Sugar and ethanol production and cumulative capacity additions from 2002 to 2017 Based on [64,83].


Table 1.
Policies and incentives for variable renewable energy sources.
| Measure | Description | Applies to Bioelectricity |
|---|---|---|
| Program for Alternative Sources of Electric Power (PROINFA) | Created by Law 10.438 of 26 April 2002; had as its first objective the procurement of 3300 MW (1100 MW each of wind, biomass, small hydro), with the second objective of renewables reaching 10% of electric energy consumption in 20 years through a feed-in tariff mechanism; only the first goal was met [15,16]. | Yes. Bioelectricity was procured at only 62% of the initial goal; the result was associated with the low reference value used for this source and with the weak structure of the equipment supply chain [17,18]. |
| Tax incentives | Federal and state tax exemption for equipment production; in the North and North-East regions, generating companies are exempt from income tax, and project up to 30 MW of installed capacity are under a special income taxation regime [19,20,21]. | Yes |
| Subsidised financing | The Brazilian National Bank for Economic and Social Development (BNDES) provided funding for renewable energy projects with interest rates lower than the private financing market; almost all renewable sources projects use this financing option. | Yes |
| Discount on tariff from the use of the transmission (TUST) and distribution systems (TUSD) | Discount higher than 50% on tariffs for using the transmission (TUST, in its Portuguese acronym) and distribution systems (TUSD) for renewable generation undertakings: wind, solar, biomass, and qualified combined cycle [22]. | Yes |
| Special consumers (load between 500 kW and 2.5 MW) | Consumers can buy energy from renewable generators that inject power of less than 50–300 MW [22]. | Yes |
| Net-metering system | Resolution 482 of 2012 and 687/2015 allows consumers to generate up to 5 MW to compensate for the electric energy consumed using the power injected in the distribution grid. | Yes |
| Exemption from investing in R&D and energy efficiency | Renewable energy investments were made exempt from the mandatory investment in the Research and Development program (R&D) and Energy Efficiency program. | Yes |
| Distributed generation contracts | Electric energy operators can buy distributed generation projects through an official call for bids up to 10% of their loads. | Yes |
| Renewable energy source auctions | The government has used the regulated contracting environment and reserve auctions to procure variable renewable sources [23,24]. | Yes |
Table 2.
Description of main scenario features.
| Scenario | Wind Generation | Load Addition | Hydrology | Biomass Generation |
|---|---|---|---|---|
| Reference | Stochastic | 0 | Standard/critical | Seasonal/flat |
| W10 | Stochastic | 10% | Standard/critical | Seasonal/flat |
| W20 | Stochastic | 20% | Standard/critical | Seasonal/flat |
| W10D | Deterministic | 10% | Standard/critical | Seasonal/flat |
| W10F | Flat | 10% | Critical | Seasonal |
Table 3.
Qualitative aspects considered in the simulations.
| System Condition or Characteristic | Definition |
|---|---|
| Reservoir level | January 2019 (standard) or January 2015 (severe). |
| Hydrologic tendency | January 2019 (standard) flow rate from July to December 2014 (severe). |
| South-East/Mid-West load | 10/20% addition to the South-East/Mid-West gross load preserving its behaviour profile. |
| Sugarcane bioelectricity | Additional generation was added to the South-East/Mid-West submarket to supply additional load and adjust levels similar to wind power generation. |
| Bioelectricity generation profile curve | Seasonal average generation per month [71,73]. Average generation per month with a flat pattern. |
| Wind generation profile curve | Transformed wind power generations in uniform quantities throughout the months—flat curve. |
Table 4.
Indicators selected for comparisons.
| Indicator | System | Percentage Comparison |
|---|---|---|
| Marginal operational cost (SRMC) | South-East/Mid-West subsystem | the higher, the worse |
| Thermal generation | South-East/Mid-West subsystem | the greater, the worse |
| Total cost | Interconnected system | the greater, the worse |
Disclaimer/Publisher’s Note: The statements, opinions and data contained in all publications are solely those of the individual author(s) and contributor(s) and not of MDPI and/or the editor(s). MDPI and/or the editor(s) disclaim responsibility for any injury to people or property resulting from any ideas, methods, instructions or products referred to in the content. |
© 2023 by the authors. Licensee MDPI, Basel, Switzerland. This article is an open access article distributed under the terms and conditions of the Creative Commons Attribution (CC BY) license (https://creativecommons.org/licenses/by/4.0/).
Share and Cite
MDPI and ACS Style
Soares, M.Y.; Ramos, D.S.; de Oliveira Pavan, M.; Diuana, F.A. Barriers to the Expansion of Sugarcane Bioelectricity in Brazilian Energy Transition. Energies 2023, 16, 955. https://doi.org/10.3390/en16020955
AMA Style
Soares MY, Ramos DS, de Oliveira Pavan M, Diuana FA. Barriers to the Expansion of Sugarcane Bioelectricity in Brazilian Energy Transition. Energies. 2023; 16(2):955. https://doi.org/10.3390/en16020955
Chicago/Turabian StyleSoares, Munir Younes, Dorel Soares Ramos, Margareth de Oliveira Pavan, and Fabio A. Diuana. 2023. "Barriers to the Expansion of Sugarcane Bioelectricity in Brazilian Energy Transition" Energies 16, no. 2: 955. https://doi.org/10.3390/en16020955
Note that from the first issue of 2016, this journal uses article numbers instead of page numbers. See further details here.