

Analysis of the Impact of the Level of Self-Consumption of Electricity from a Prosumer Photovoltaic Installation on Its Profitability under Different Energy Billing Scenarios in Poland


Abstract
1. Introduction
2. Legal Conditions and Billing Systems for Electricity from Prosumer Installations in Poland
2.1. Legal Information
2.1.1. Definition of a Prosumer
- On-grid—a system connected to the power grid;
- Off-grid—a system not connected to the power grid (stand-alone/island installation), which requires storage of the electricity produced in a local storage facility;
- Hybrydowy—a system connected to the power grid equipped with a charge controller and local energy storage.
2.1.2. Discount System
- Installations with an installed capacity of up to 10 kW—at a ratio of 1 to 0.8;
- Installations with an installed capacity equal to and above 10 kW—at a ratio of 1 to 0.7.
2.1.3. Net-Billing System
- Transitional discount system (from 1 April 2022 to 30 June 2022)—in effect for prosumers who reported the connection of the micro-installation to the DSO in the abovementioned period. However, after the transitional period, the surplus electricity supplied into the grid was billed at the average monthly price valid in June 2022, and investors automatically started to be net-billed.
- Net-billing based on monthly prices (from 1 July 2022 to 30 June 2024)—during this two-year period, surplus electricity introduced into the grid will be billed based on the average market price for electricity that applied in the previous month.
- Net-billing based on hourly prices (from 1 July 2024)—eventually, the billing of the value of surplus electricity will be based on the application of dynamic tariffs based on hourly prices and a distinction between electricity introduced into the grid and electricity consumed. The introduced energy will be billed on the basis of the hourly exchange price in the day-ahead markets. It will be determined by the energy information market operator, i.e., Polskie Sieci Elektroenergetyczne (Polish Transmission System Operator). On the other hand, the value of electricity consumed will depend on the tariff of the current supplier.
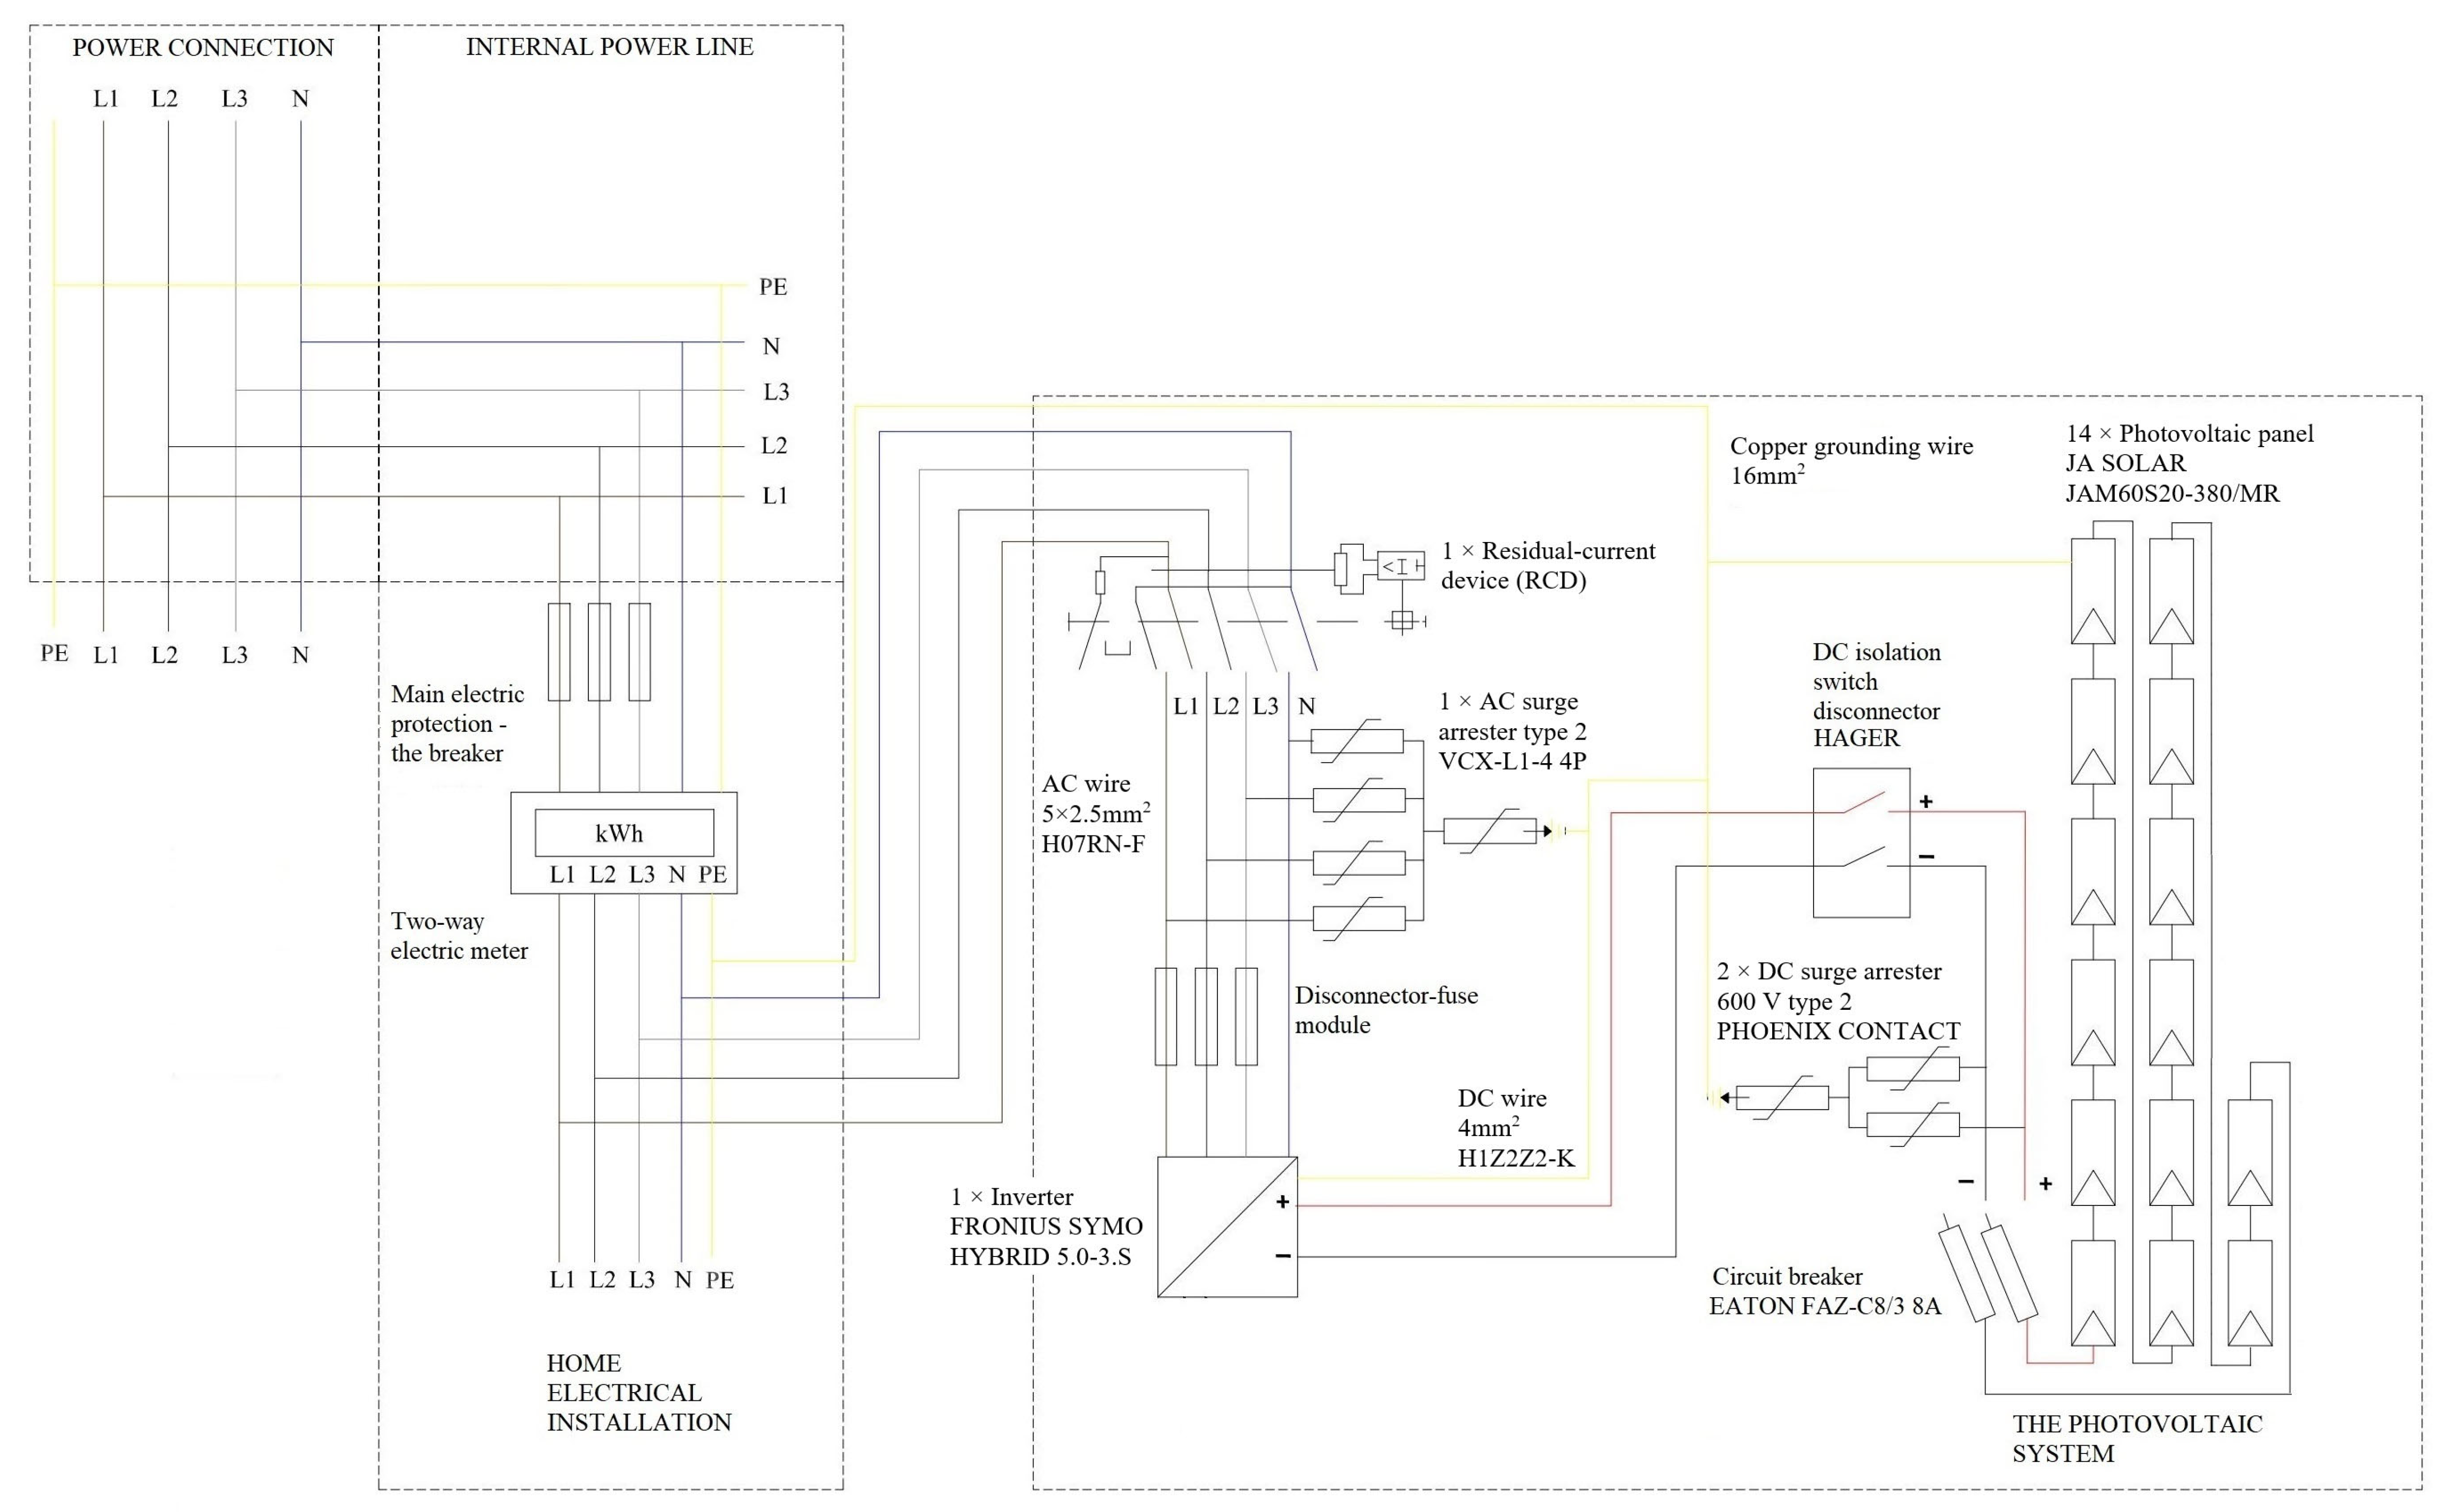
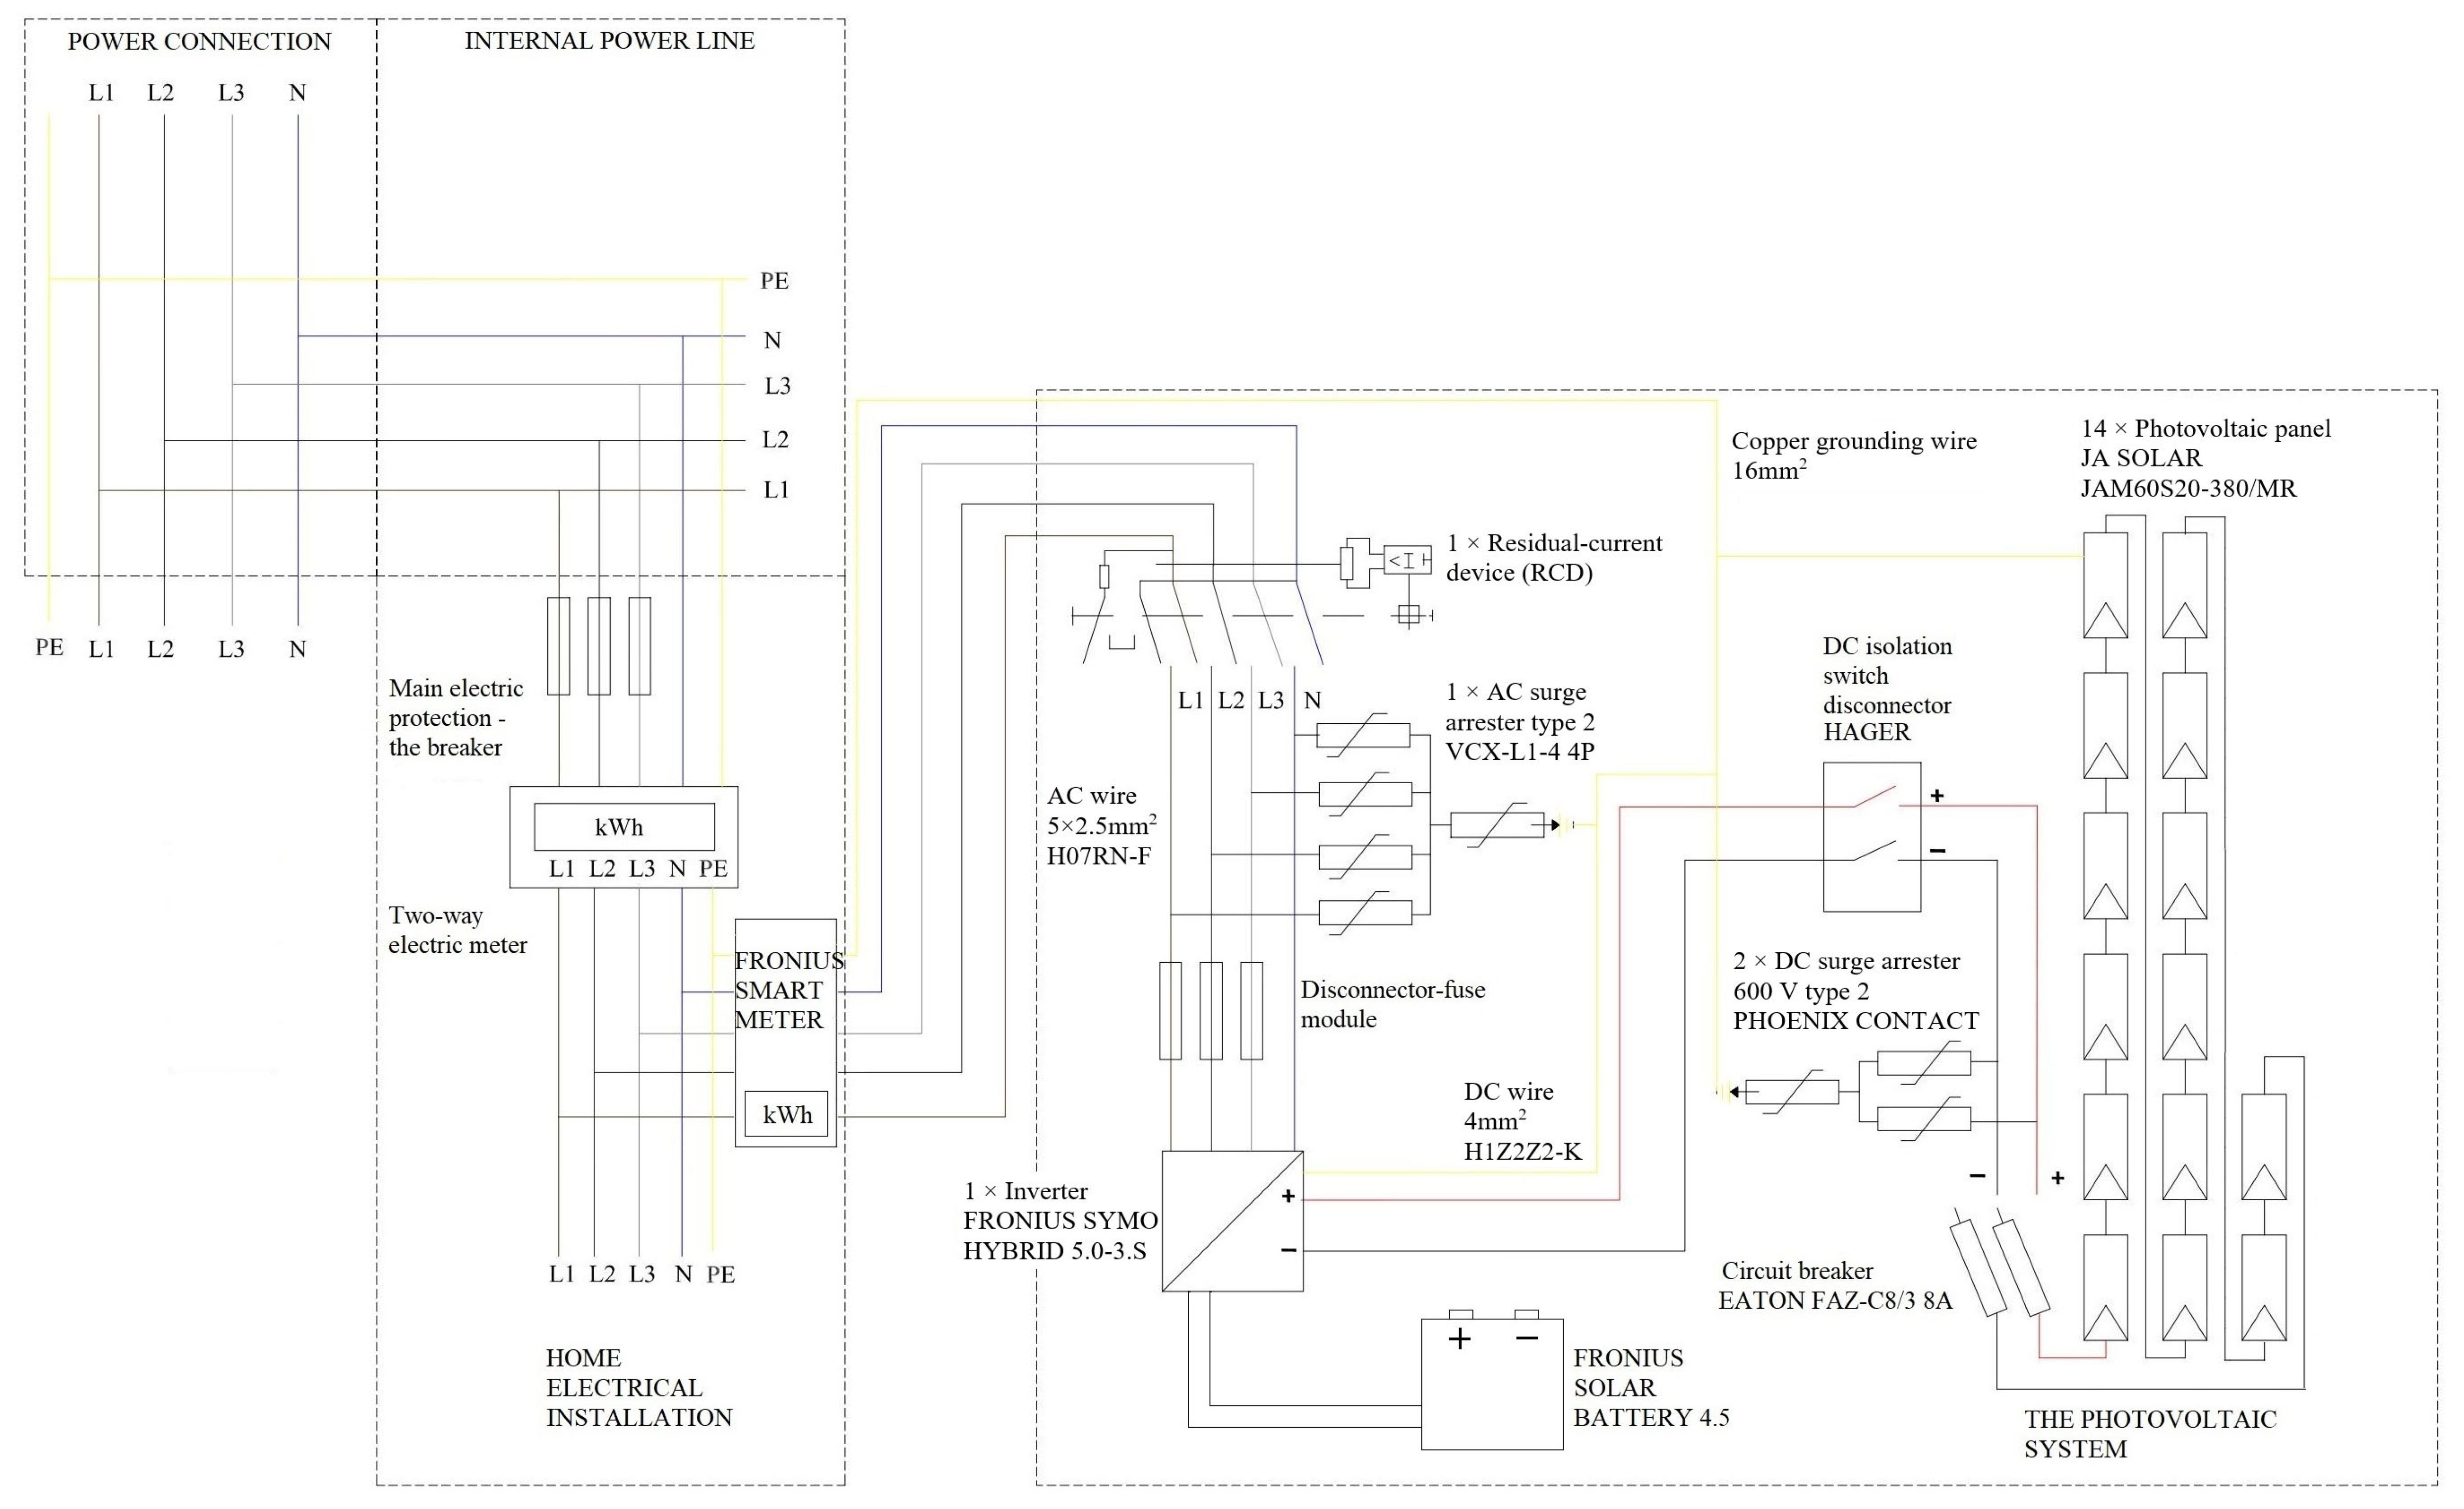
2.2. Design of the Prosumer Photovoltaic Installation
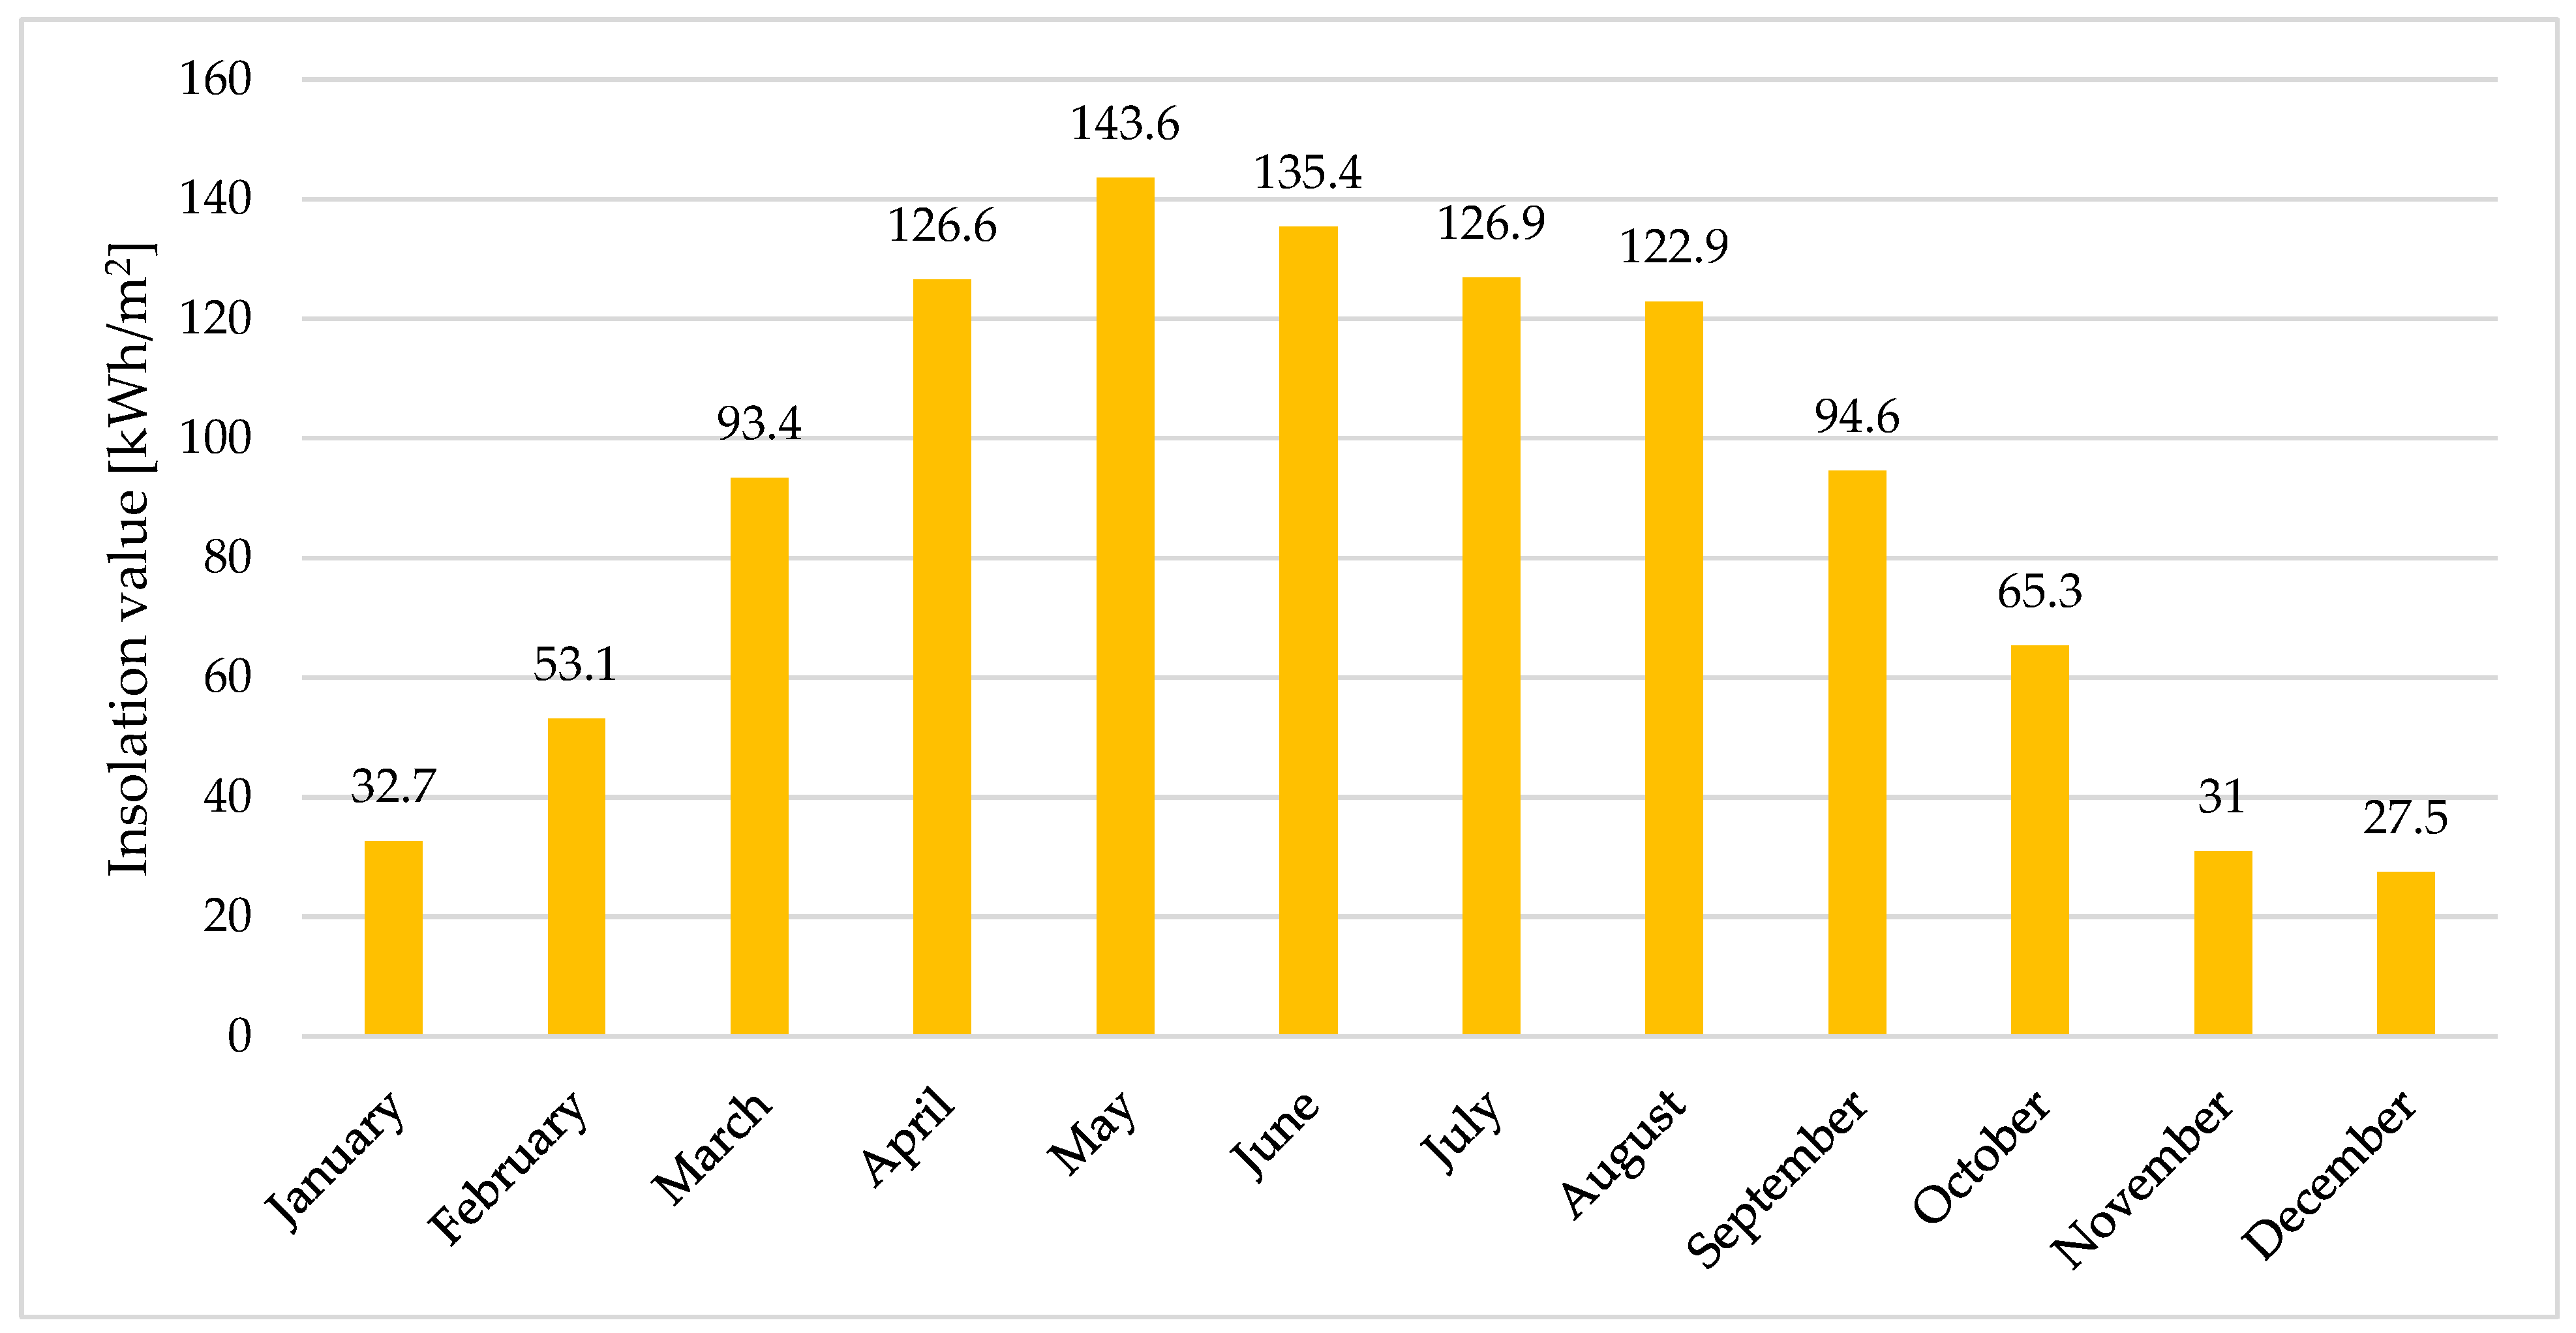
- Annual total insolation: 1053 kWh/m2;
- Annual average temperature: 8.7 °C.
- PPV—power of the photovoltaic installation [kW];
- Ek—annual electricity consumption [kWh];
- Ep—yield, annual production of electricity from 1 kW of power installed in the photovoltaic system [kWh];
- N—insolation falling on a given area during the year [kWh/m2]; for Poland, this value is between 975 and 1150 kWh/m2 depending on the exact location [50];
- GSTC—power density of solar radiation in STC = 1000 W/m2;
- ww—coefficient of performance; usually, its value ranges between 80 and 85%, and is influenced by the following losses: on wires, on modules due to temperature, inverter losses, and others;
- wkn—insolation correction factor, which depends on the angle of inclination of the photovoltaic system and its azimuth; a table with all the data can be found in [49] on page 199.
3. Profitability Analysis of a Prosumer PV Installation under Different Electricity Billing Scenarios
- The net-metering system (otherwise known as the discount system);
- The net-billing system based on monthly prices;
- The net-billing system based on hourly prices.
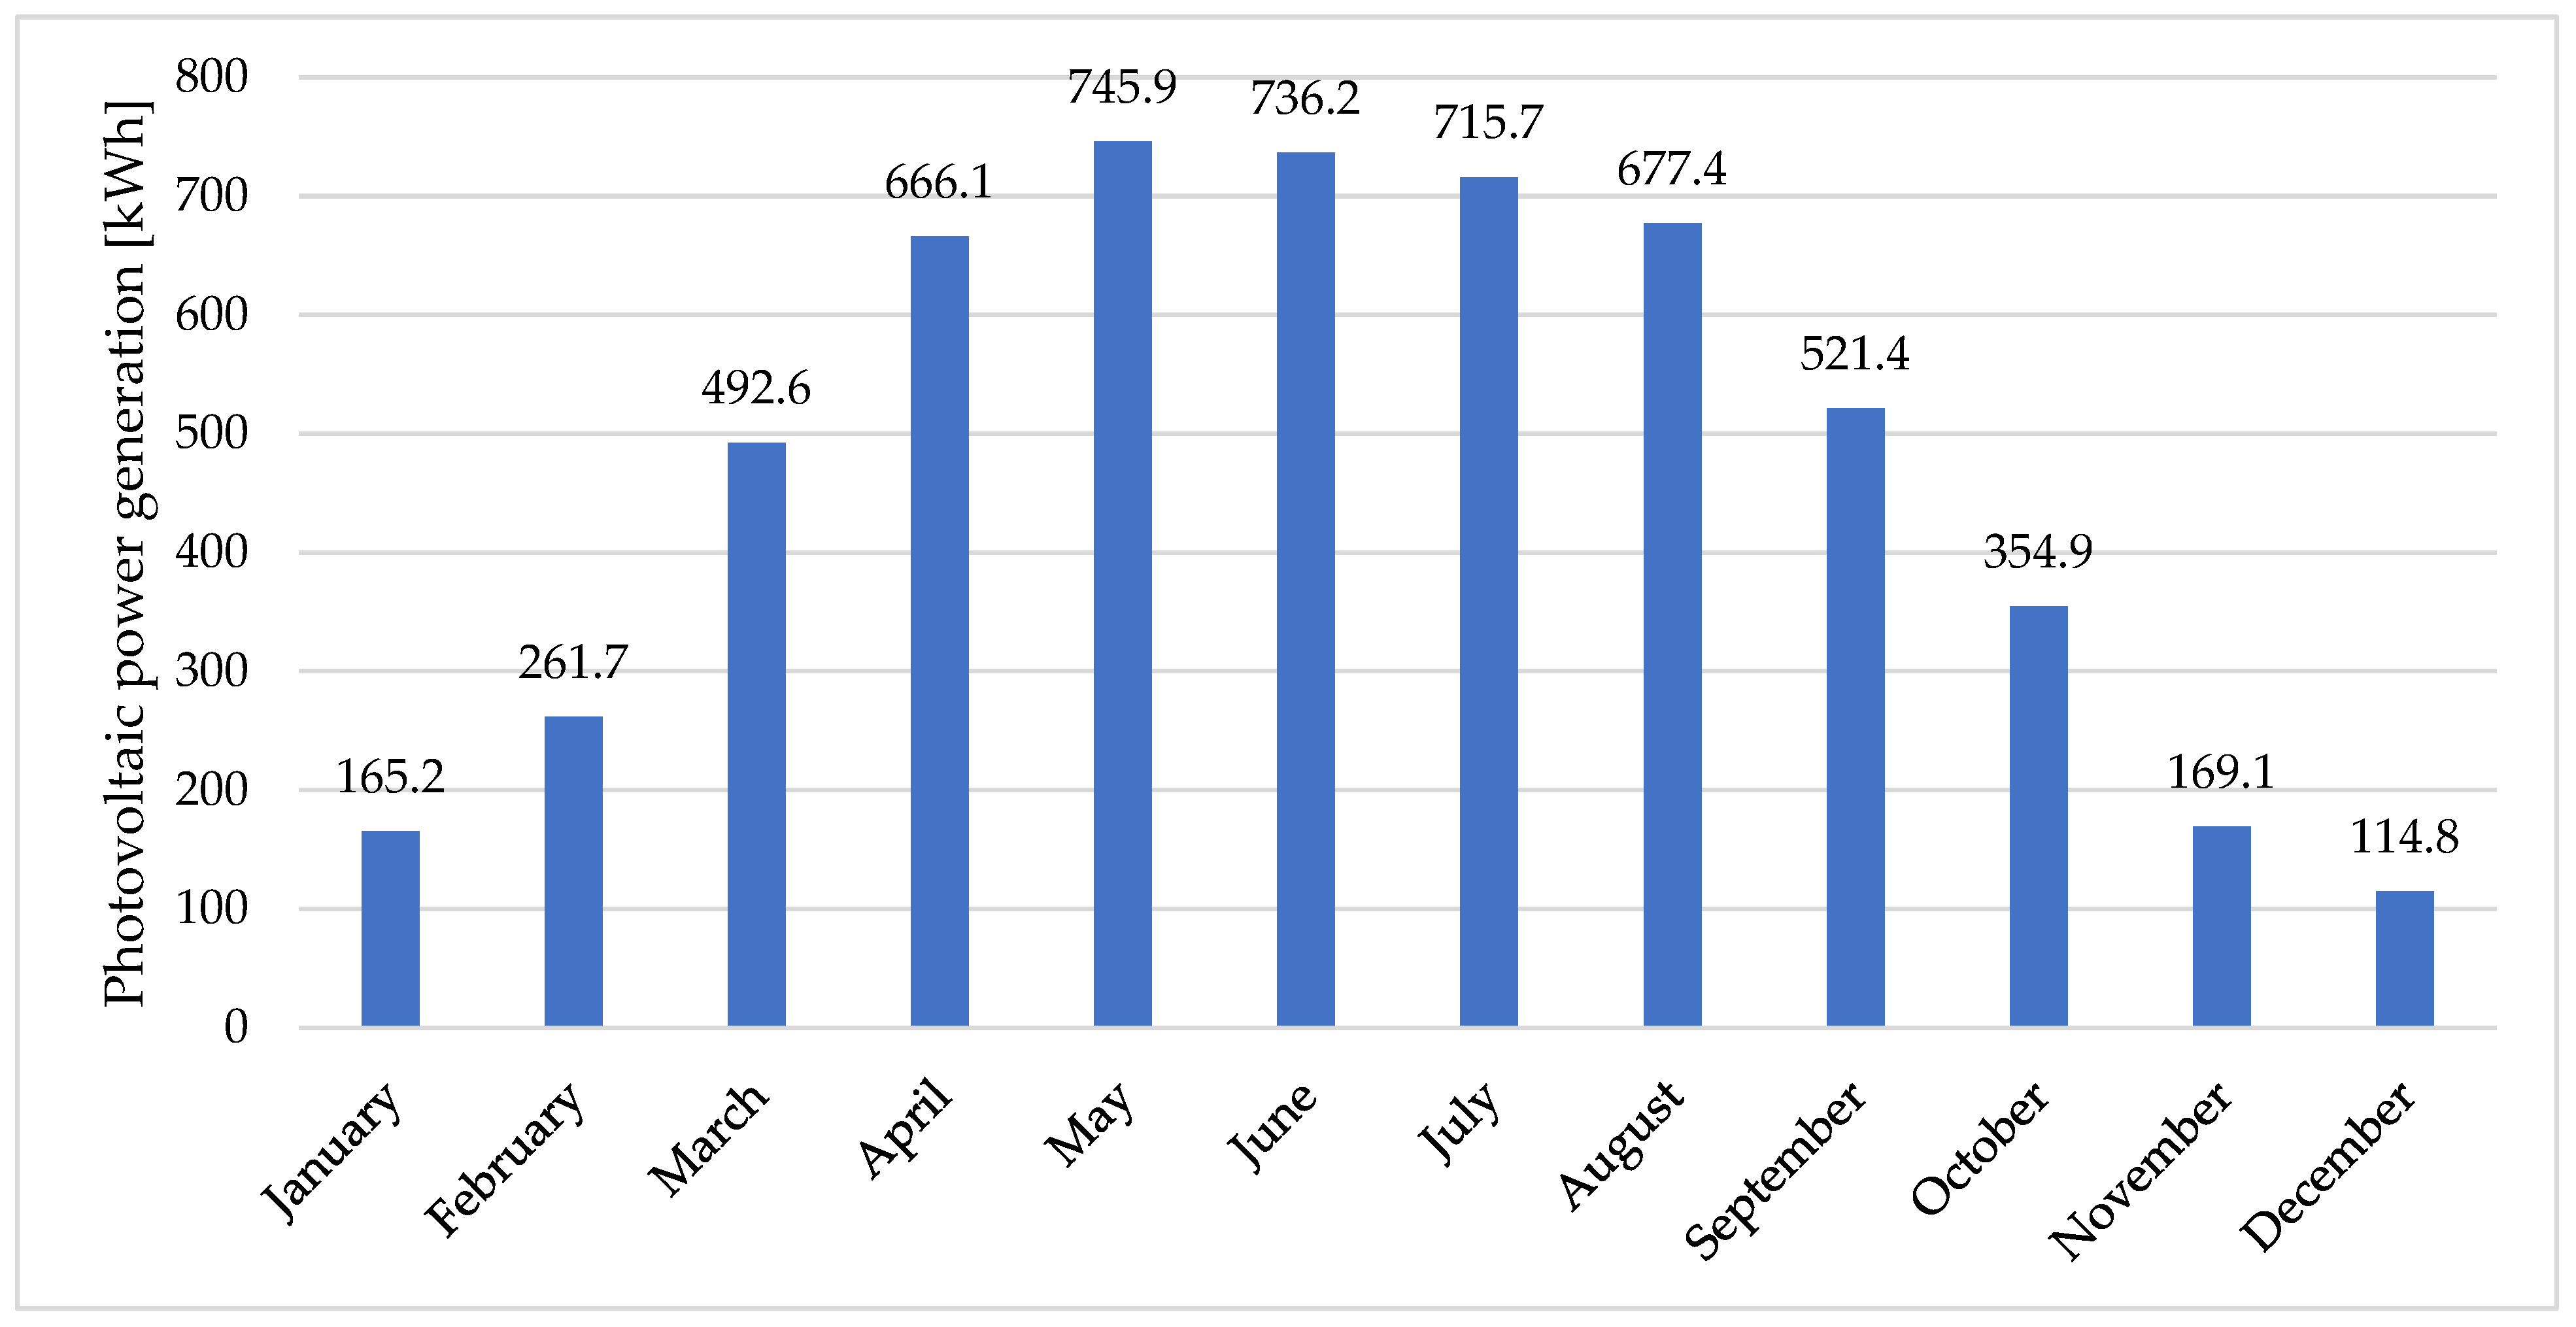
3.1. Production of Electricity from the Designed Photovoltaic System
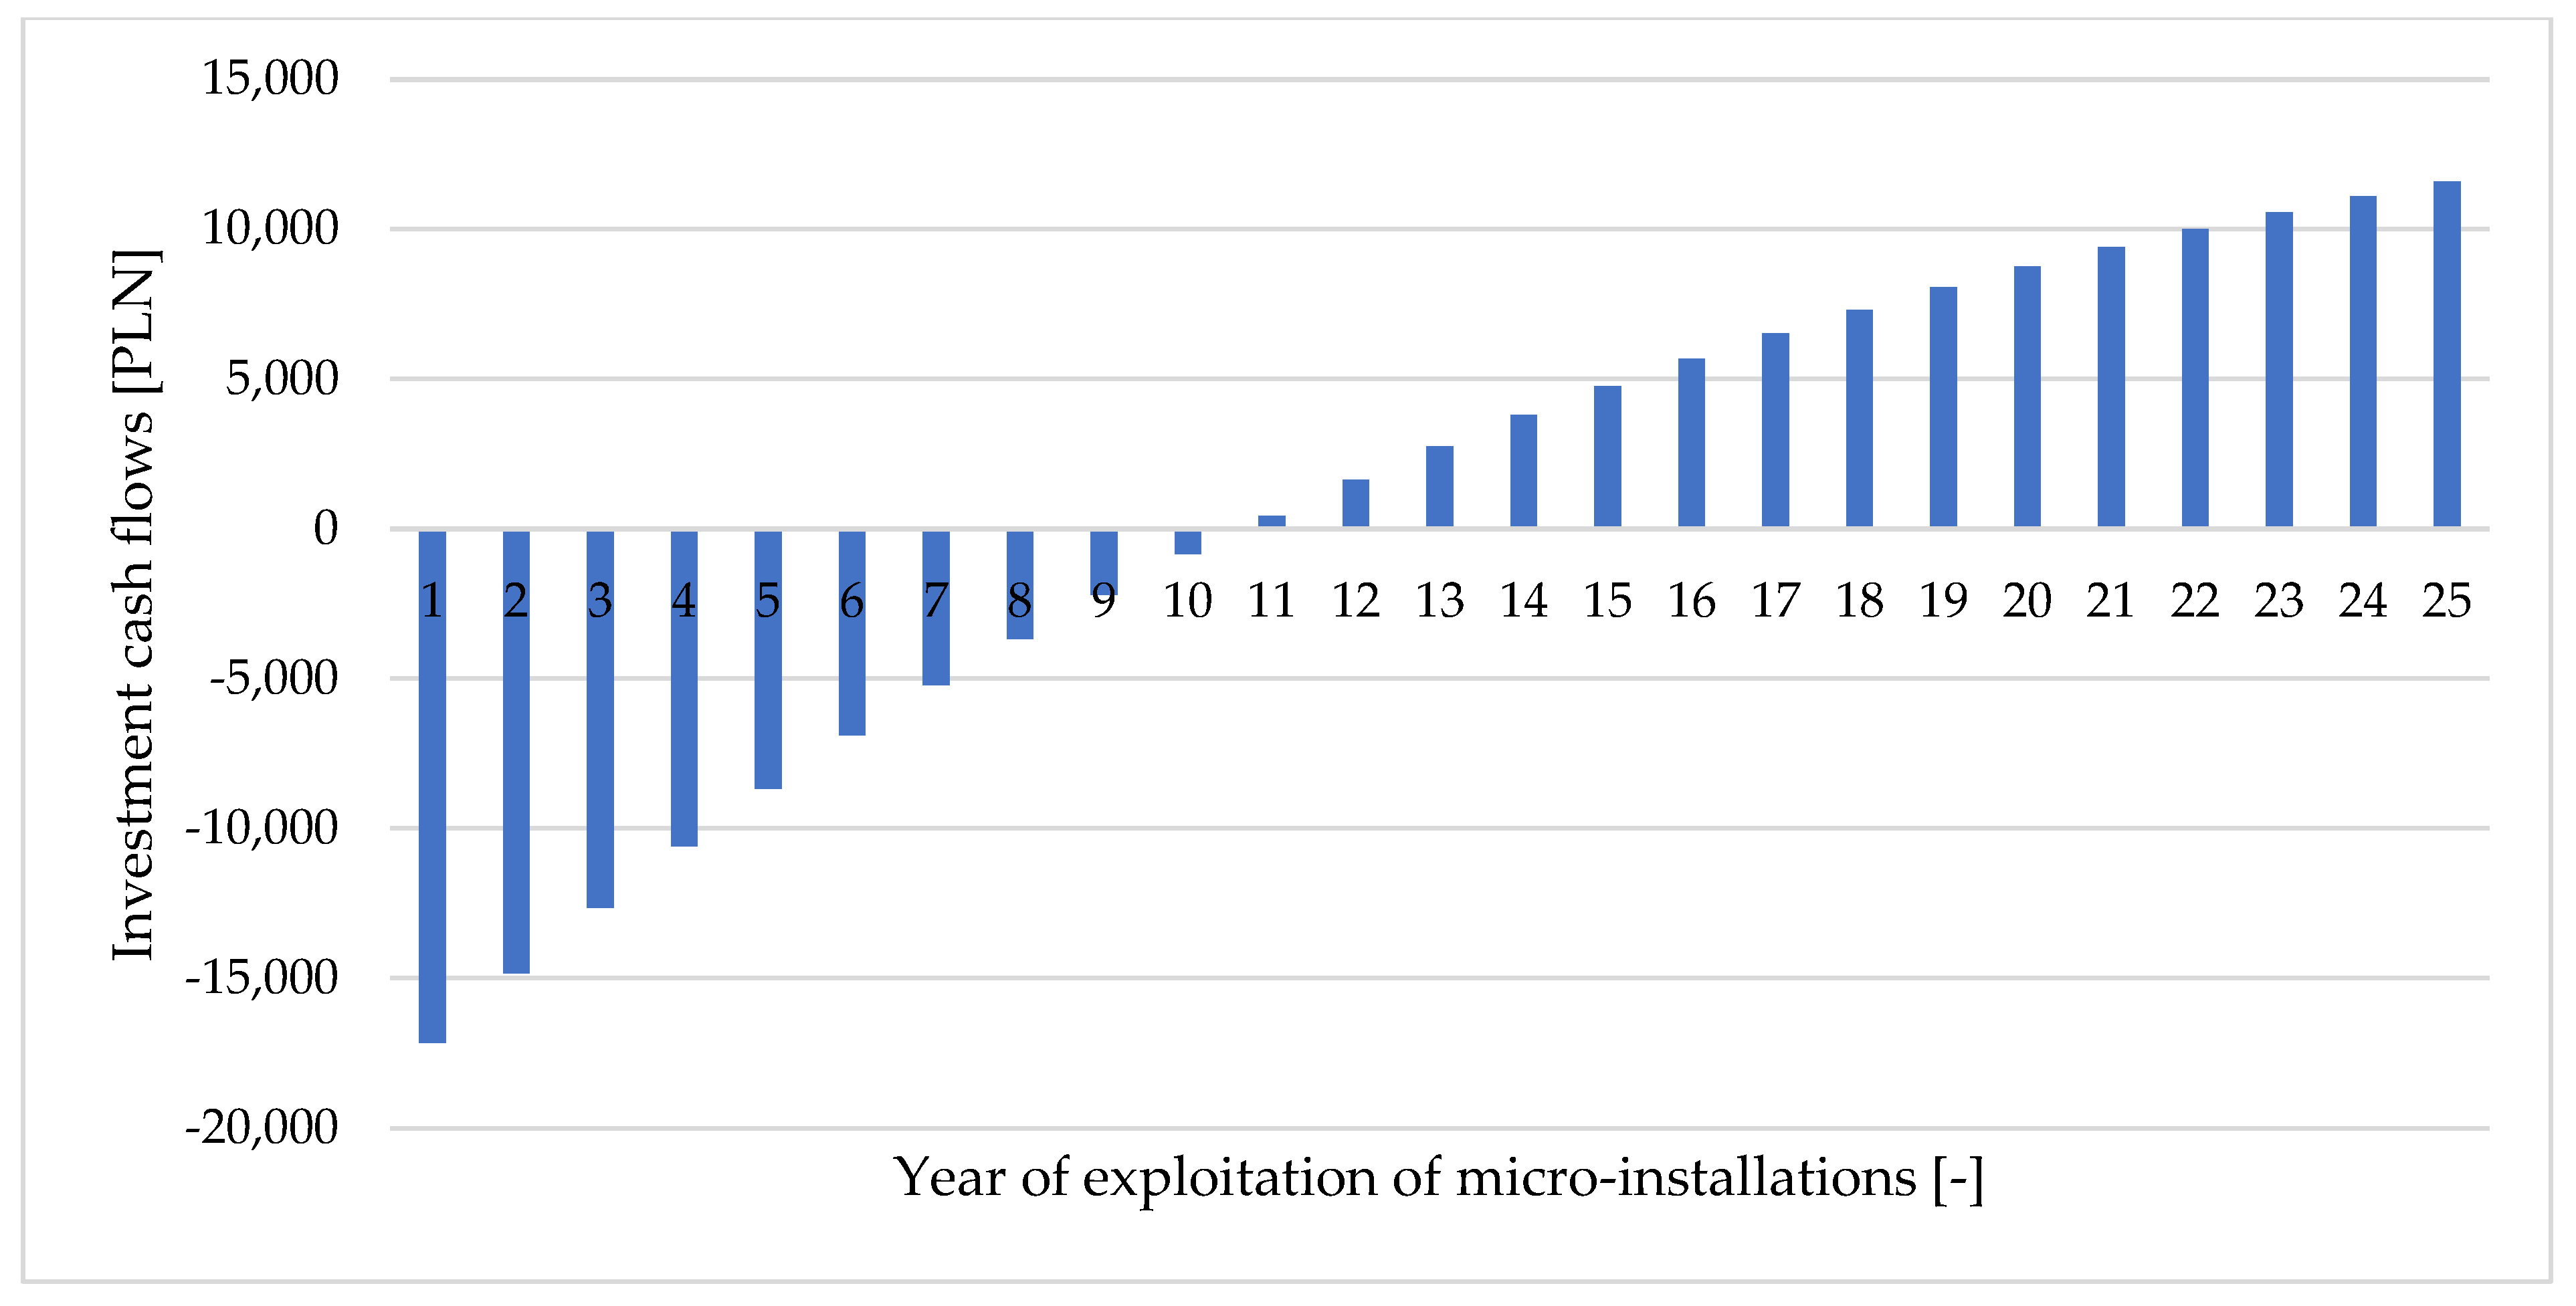
3.2. NPV Indicator to Assess the Profitability of the Investment
- T—predicted lifespan of the investment (25 years according to an assumption);
- t—year of the life of the investment;
- St—savings that occurred in year t due to, for example, the sale of the electricity produced, which are calculated as the product of the electricity that was generated in a given year and the price of electricity that was applicable in year t; in the case of the discount system, these will be the savings resulting from not buying electricity from the operator;
- Mt—operational costs in year t;
- r—discount rate (assumed value 0.08);
- It—capital expenditure in year t.
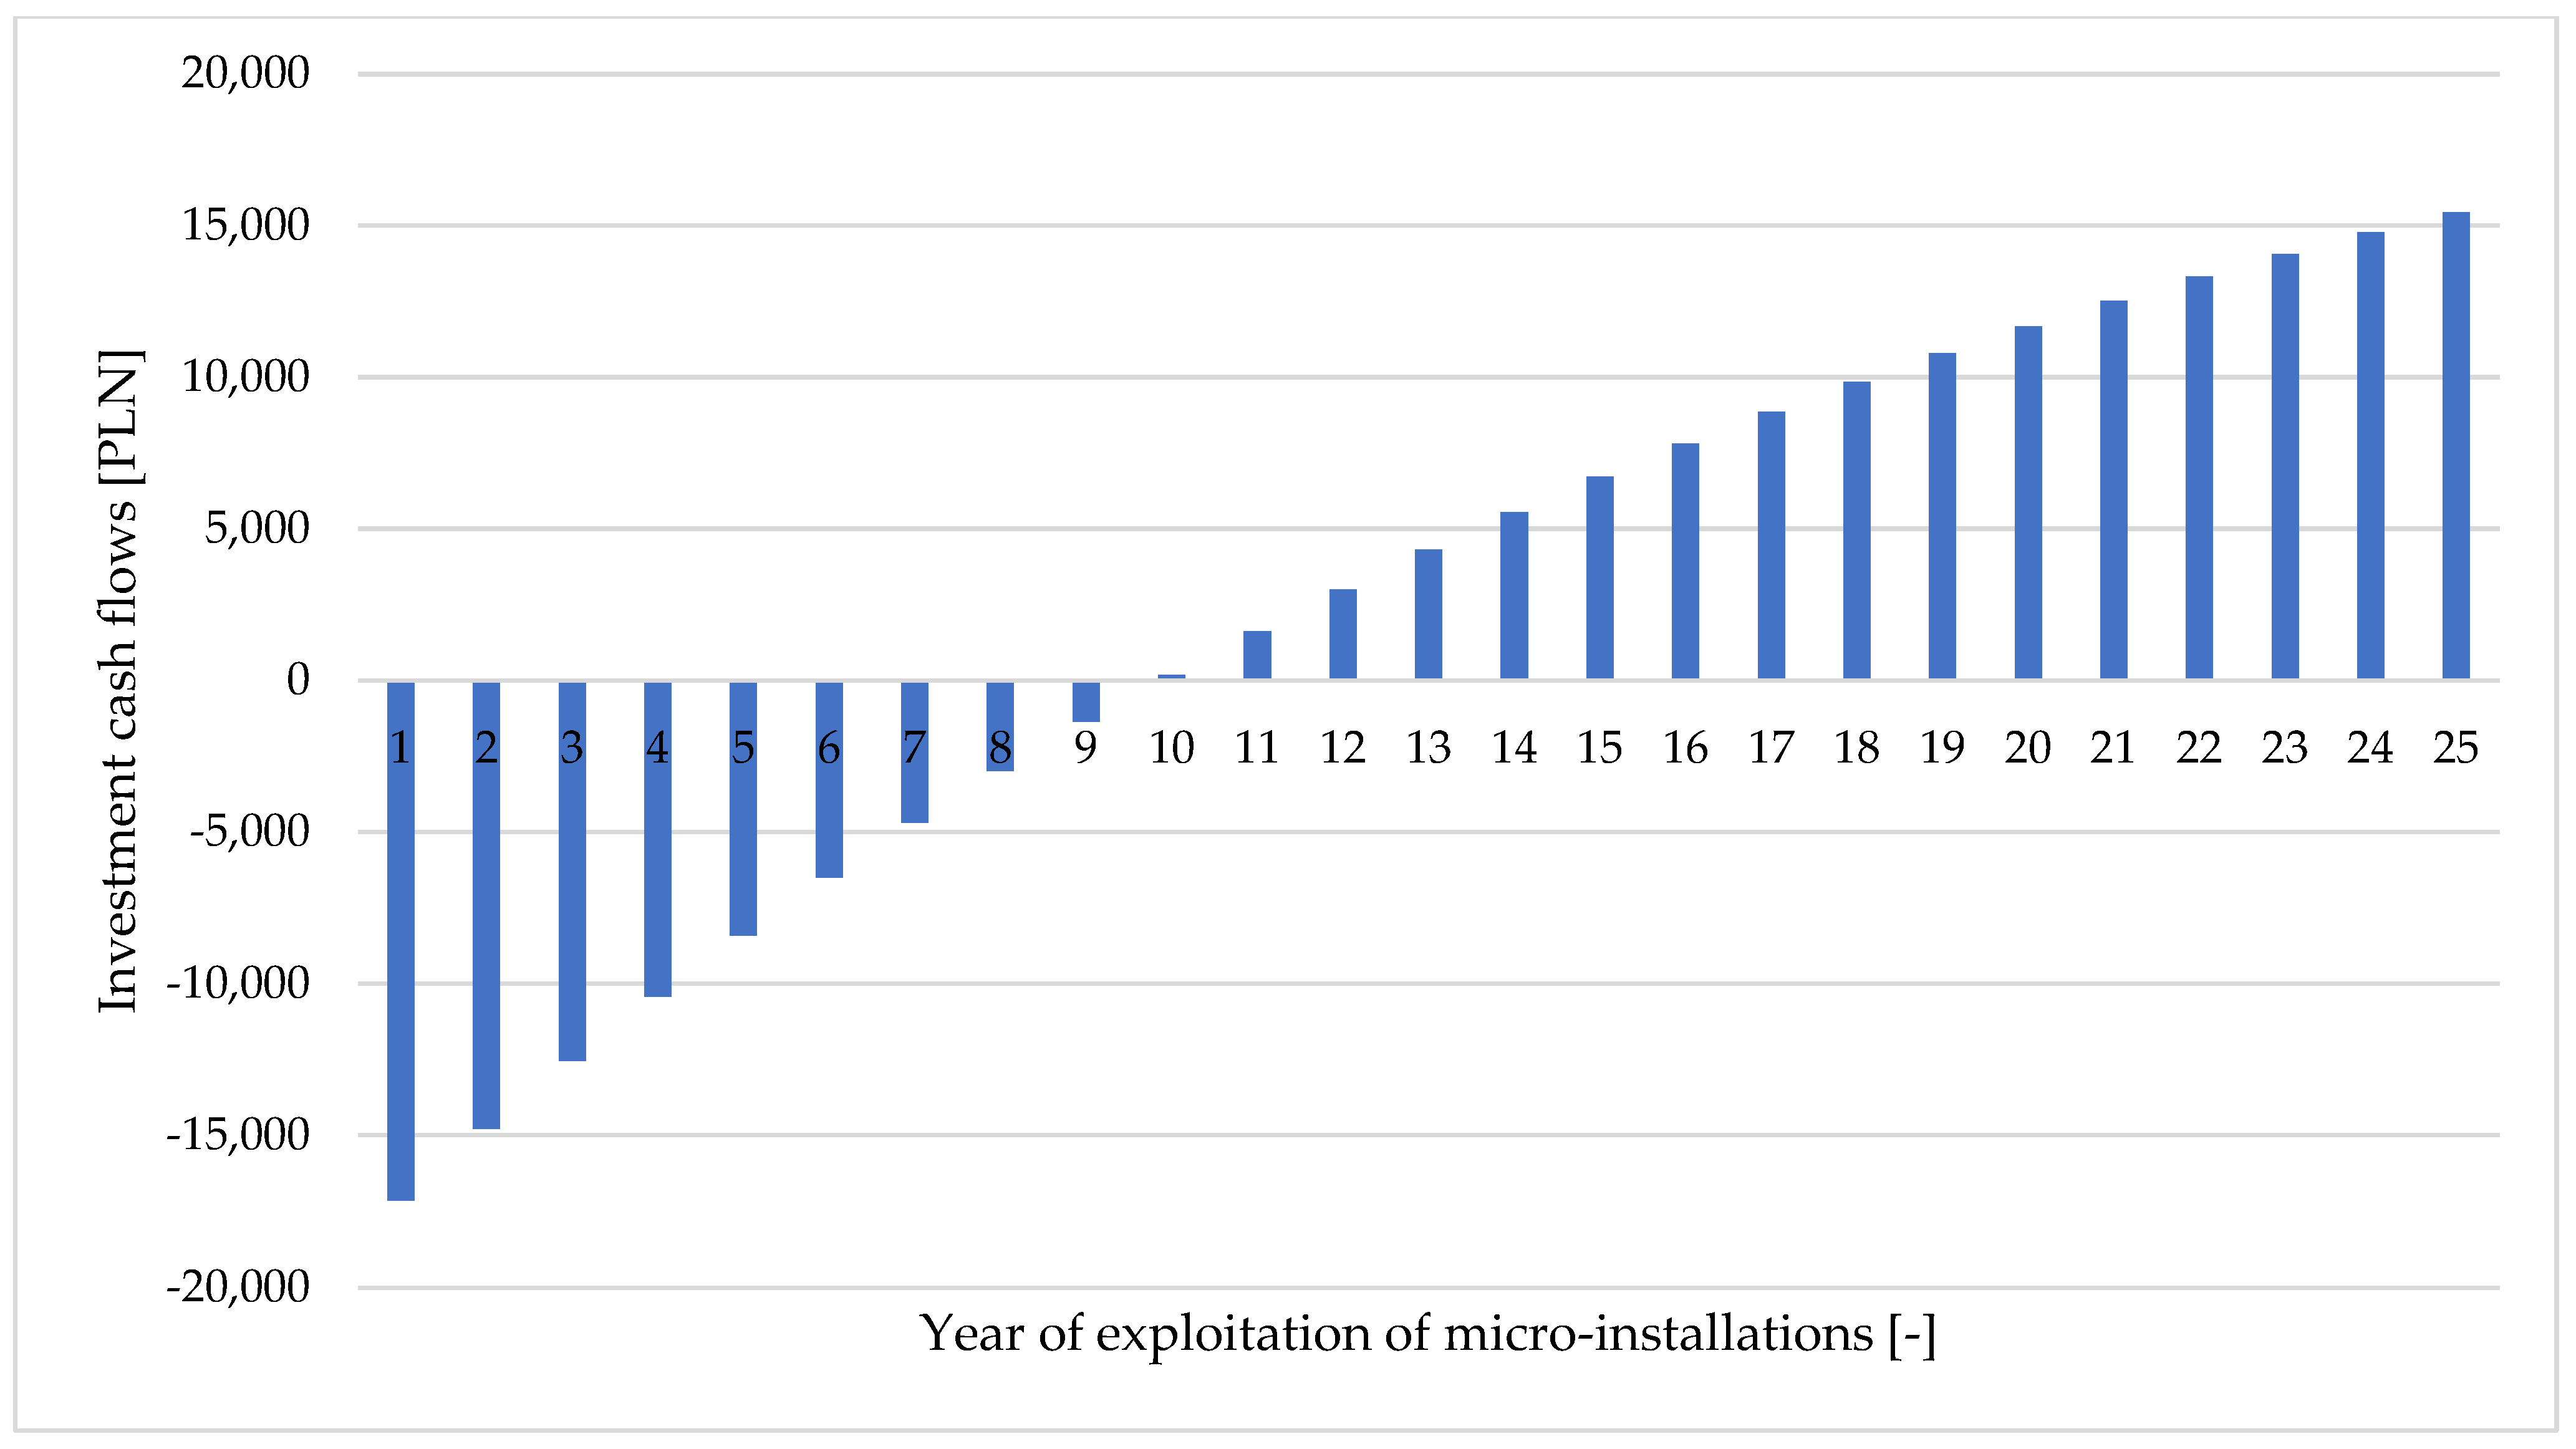
3.3. Electricity Billing under the Discount System
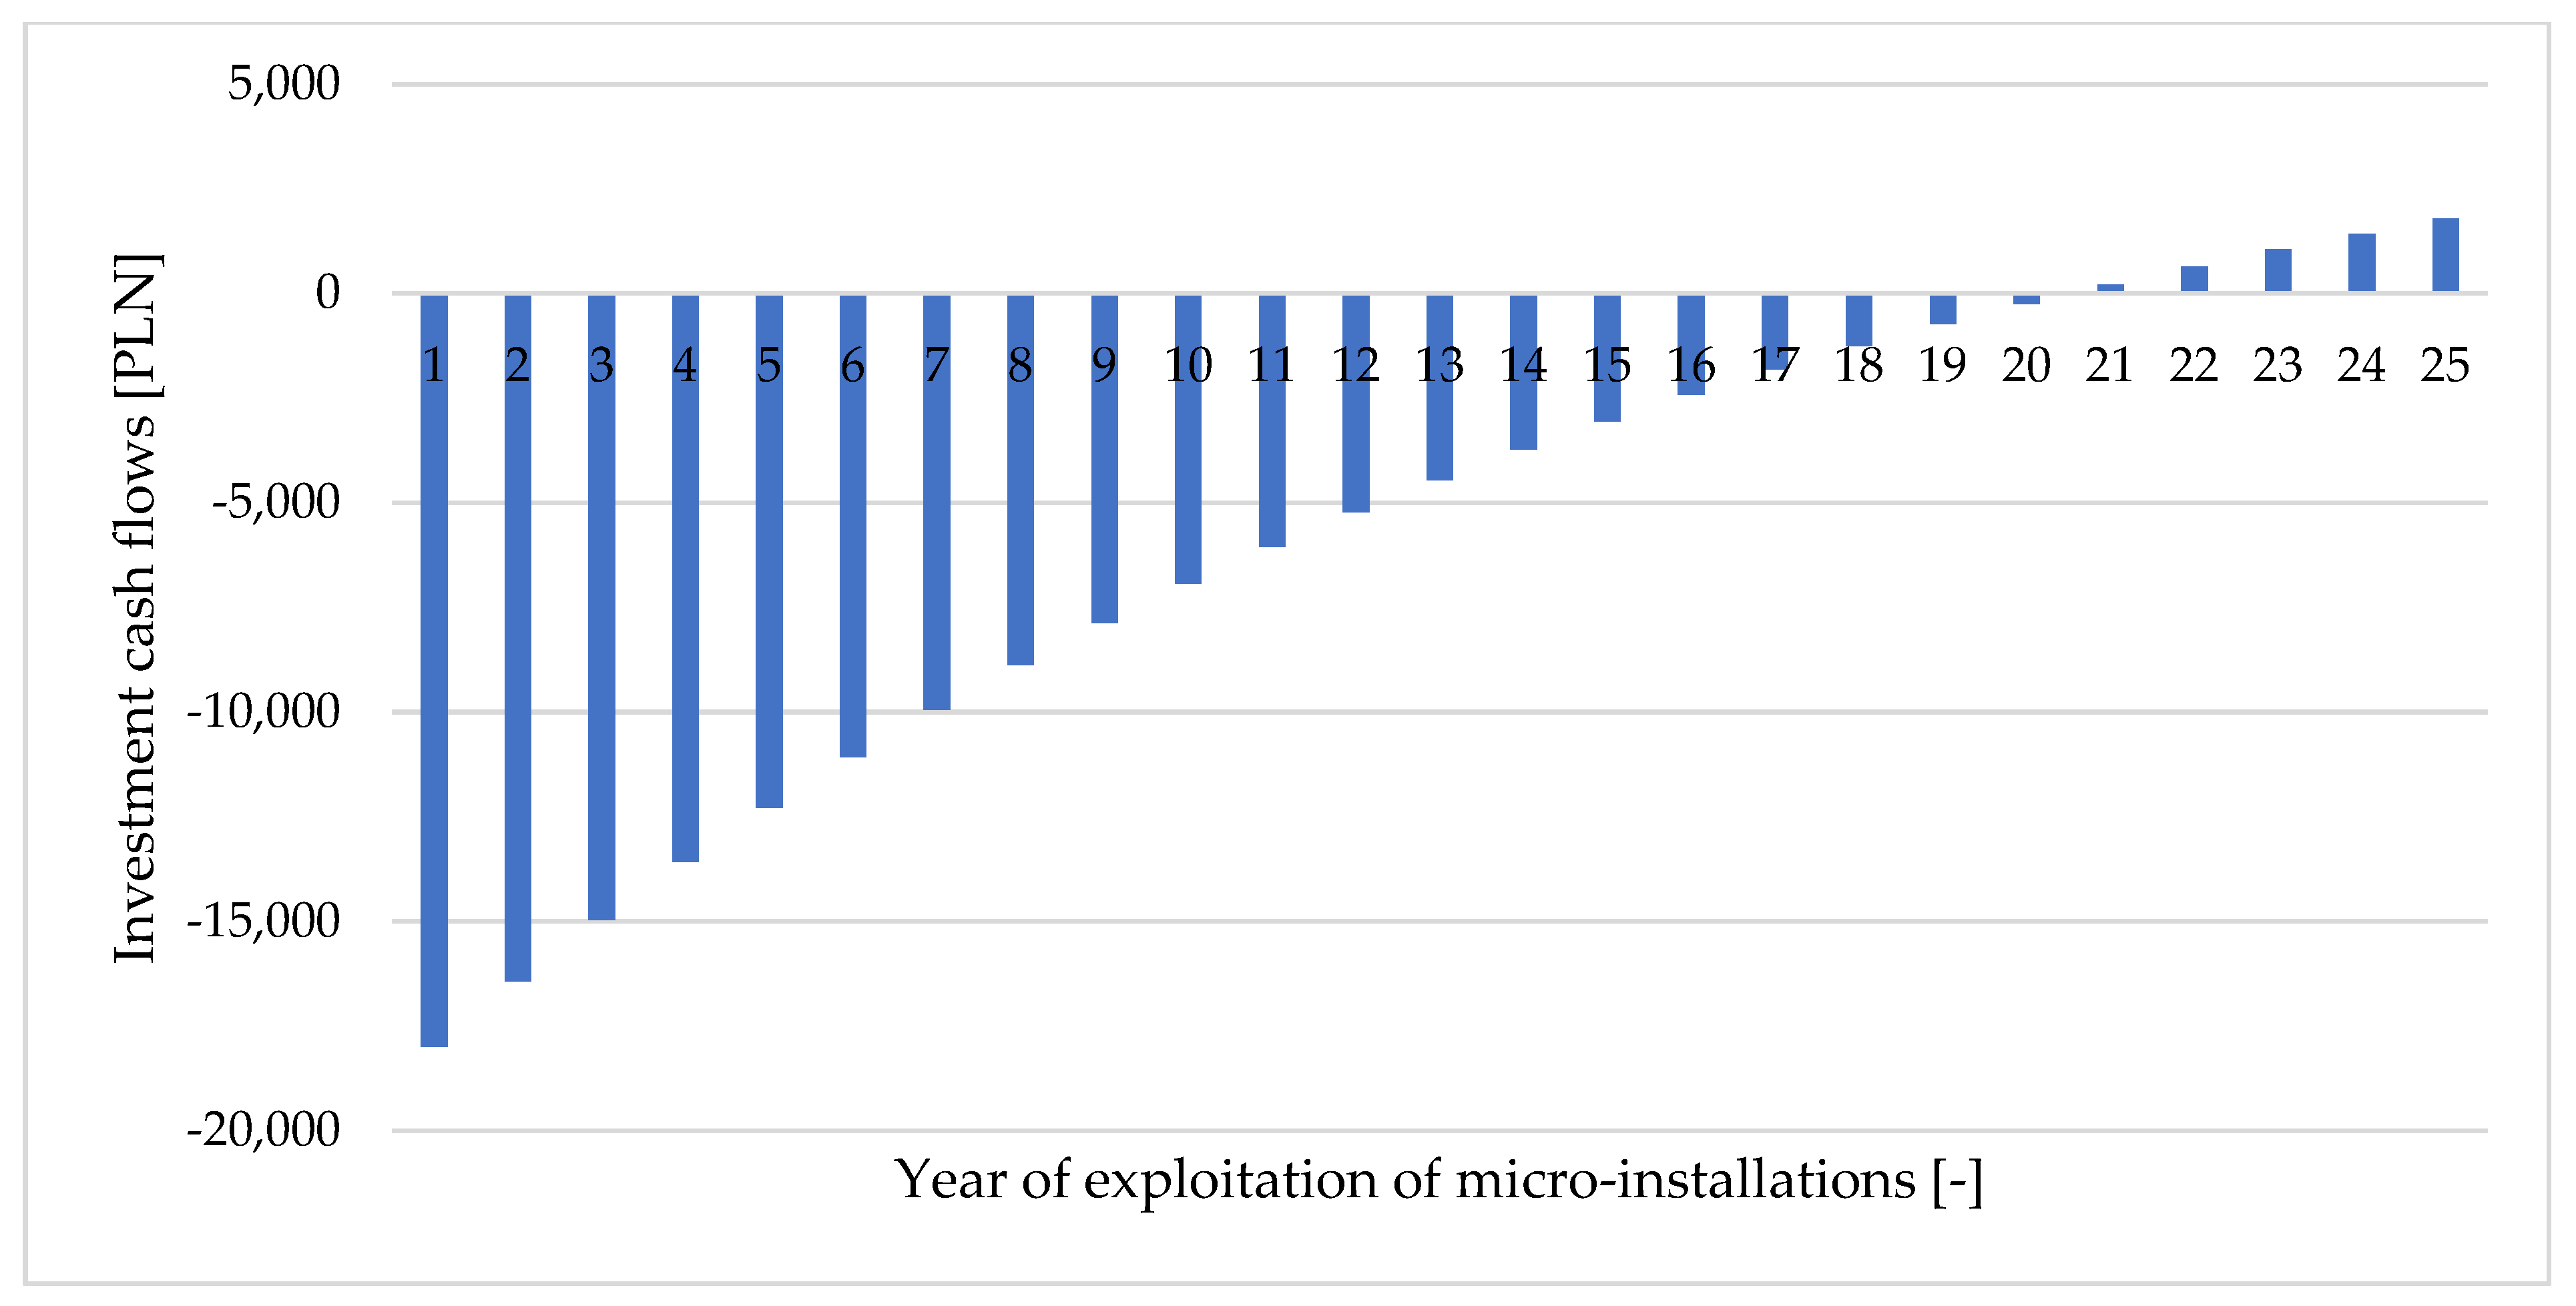
3.4. Electricity Billing in the Net-Billing System Based on Monthly Prices
- Electricity production for each month, taking into account the percentage electricity production determined in Table 3;
- Household self-consumption at a level of 30% of the electricity produced in each of the twelve months;
- The volume of electricity to be purchased and the amount of money to be paid for it;
- The volume of electricity that will be sold and the amount that investors will receive;
- The amount that will be saved as a result of the production of electricity from the micro-installation for own use.
3.5. Electricity Billing Based on Hourly Prices in the Net-Billing System
- Quarter 1: 16.36%;
- Quarter 2: 38.22%;
- Quarter 3: 34.06%;
- Quarter 4: 11.36%.
- The hourly electricity demand on a quarterly and annual basis;
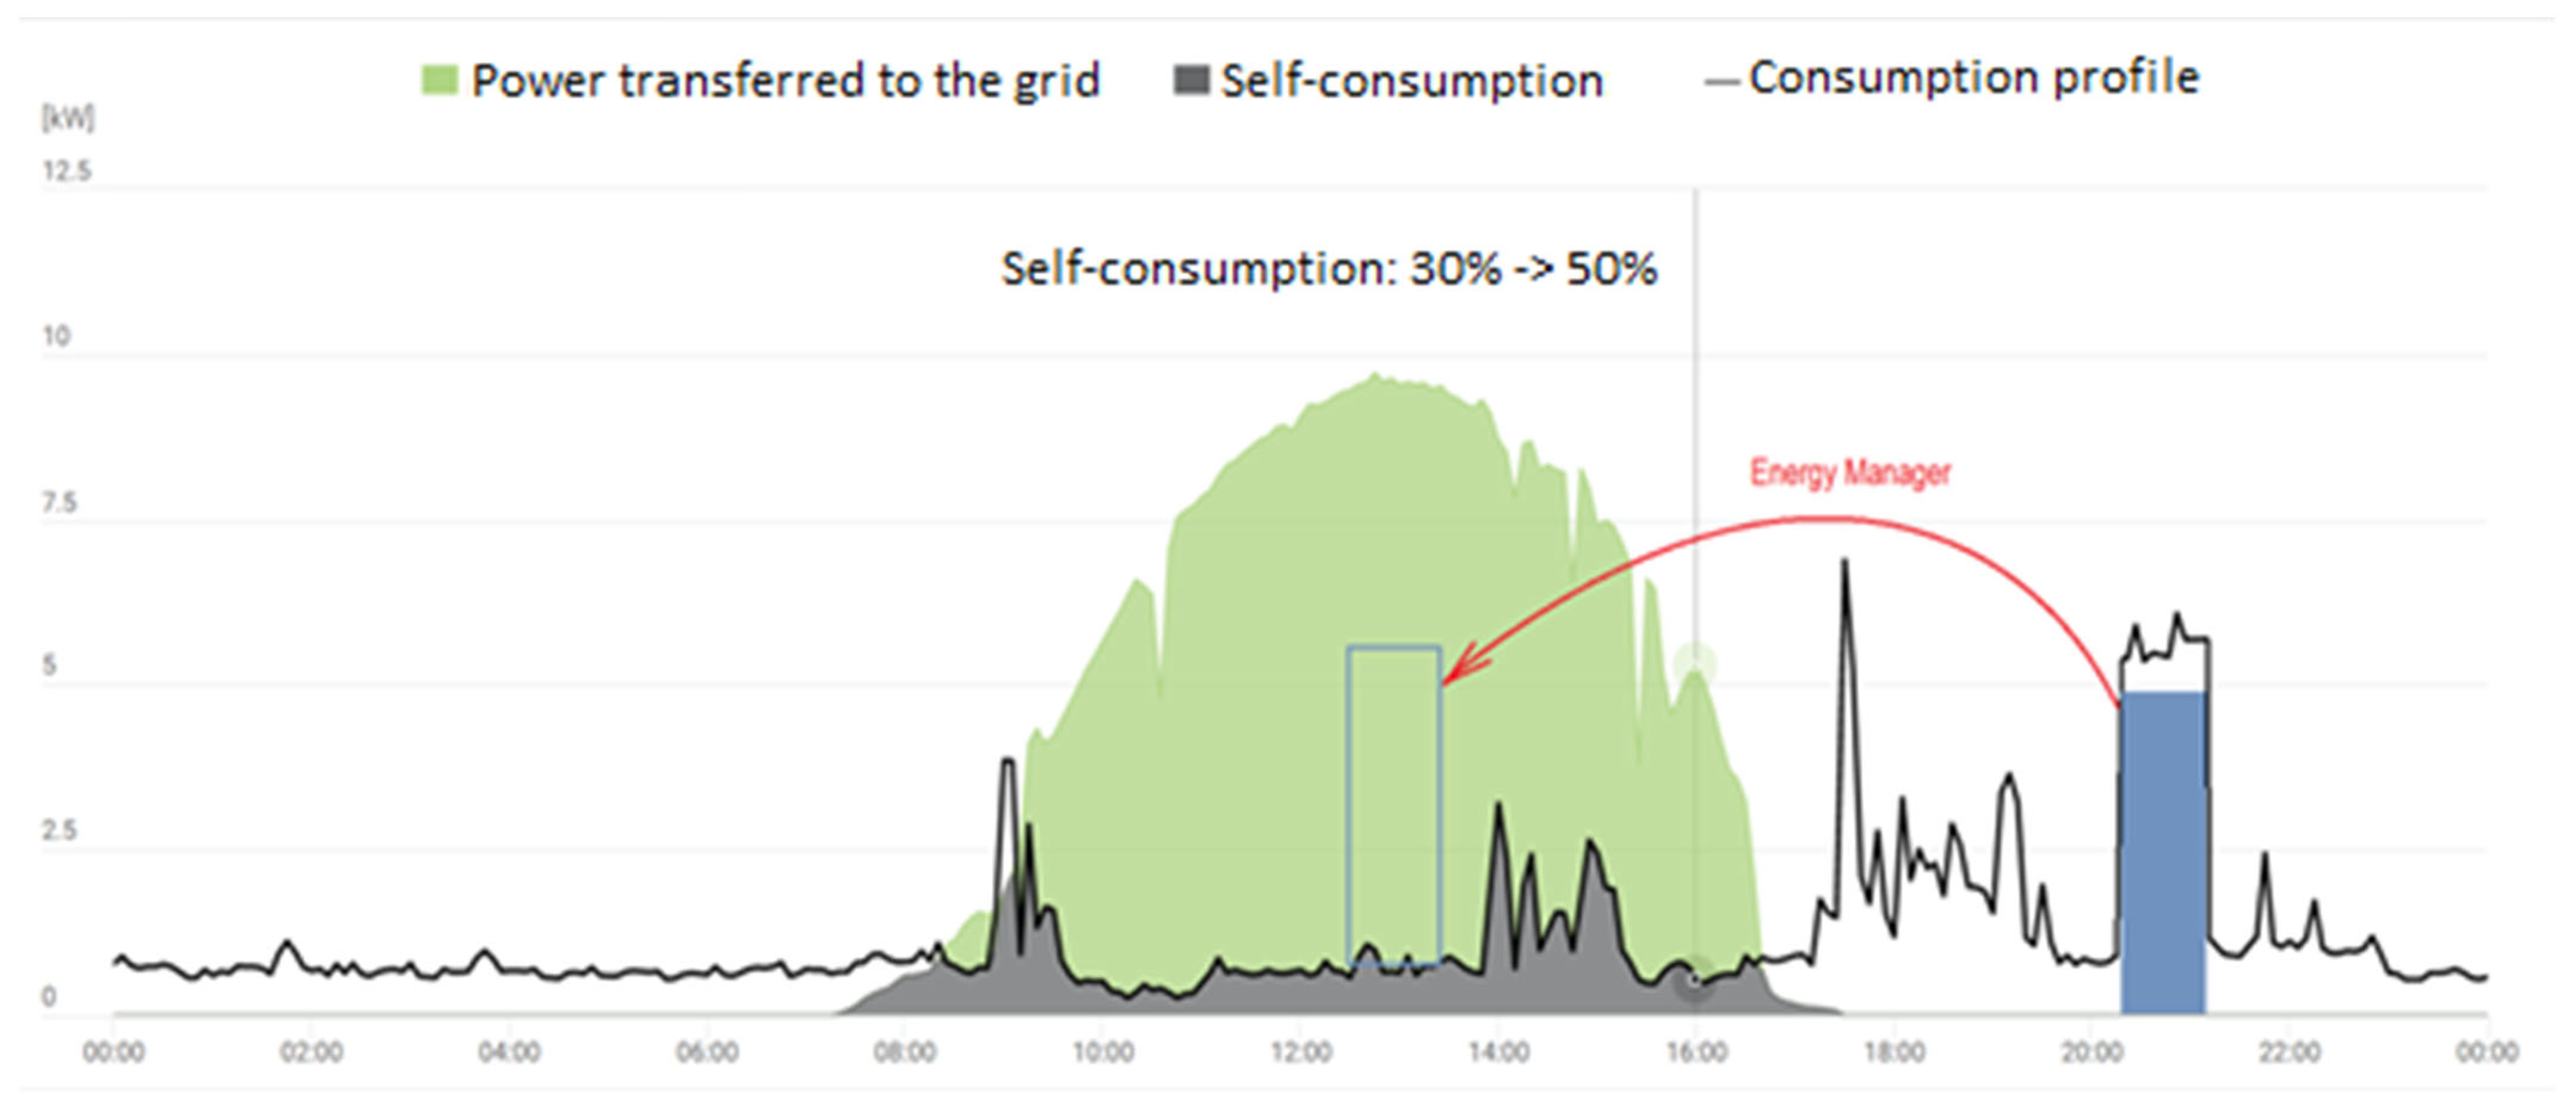
- The hourly self-consumption of the electricity produced by the photovoltaic installation;
- The quantity of energy that will need to be purchased from the operator.
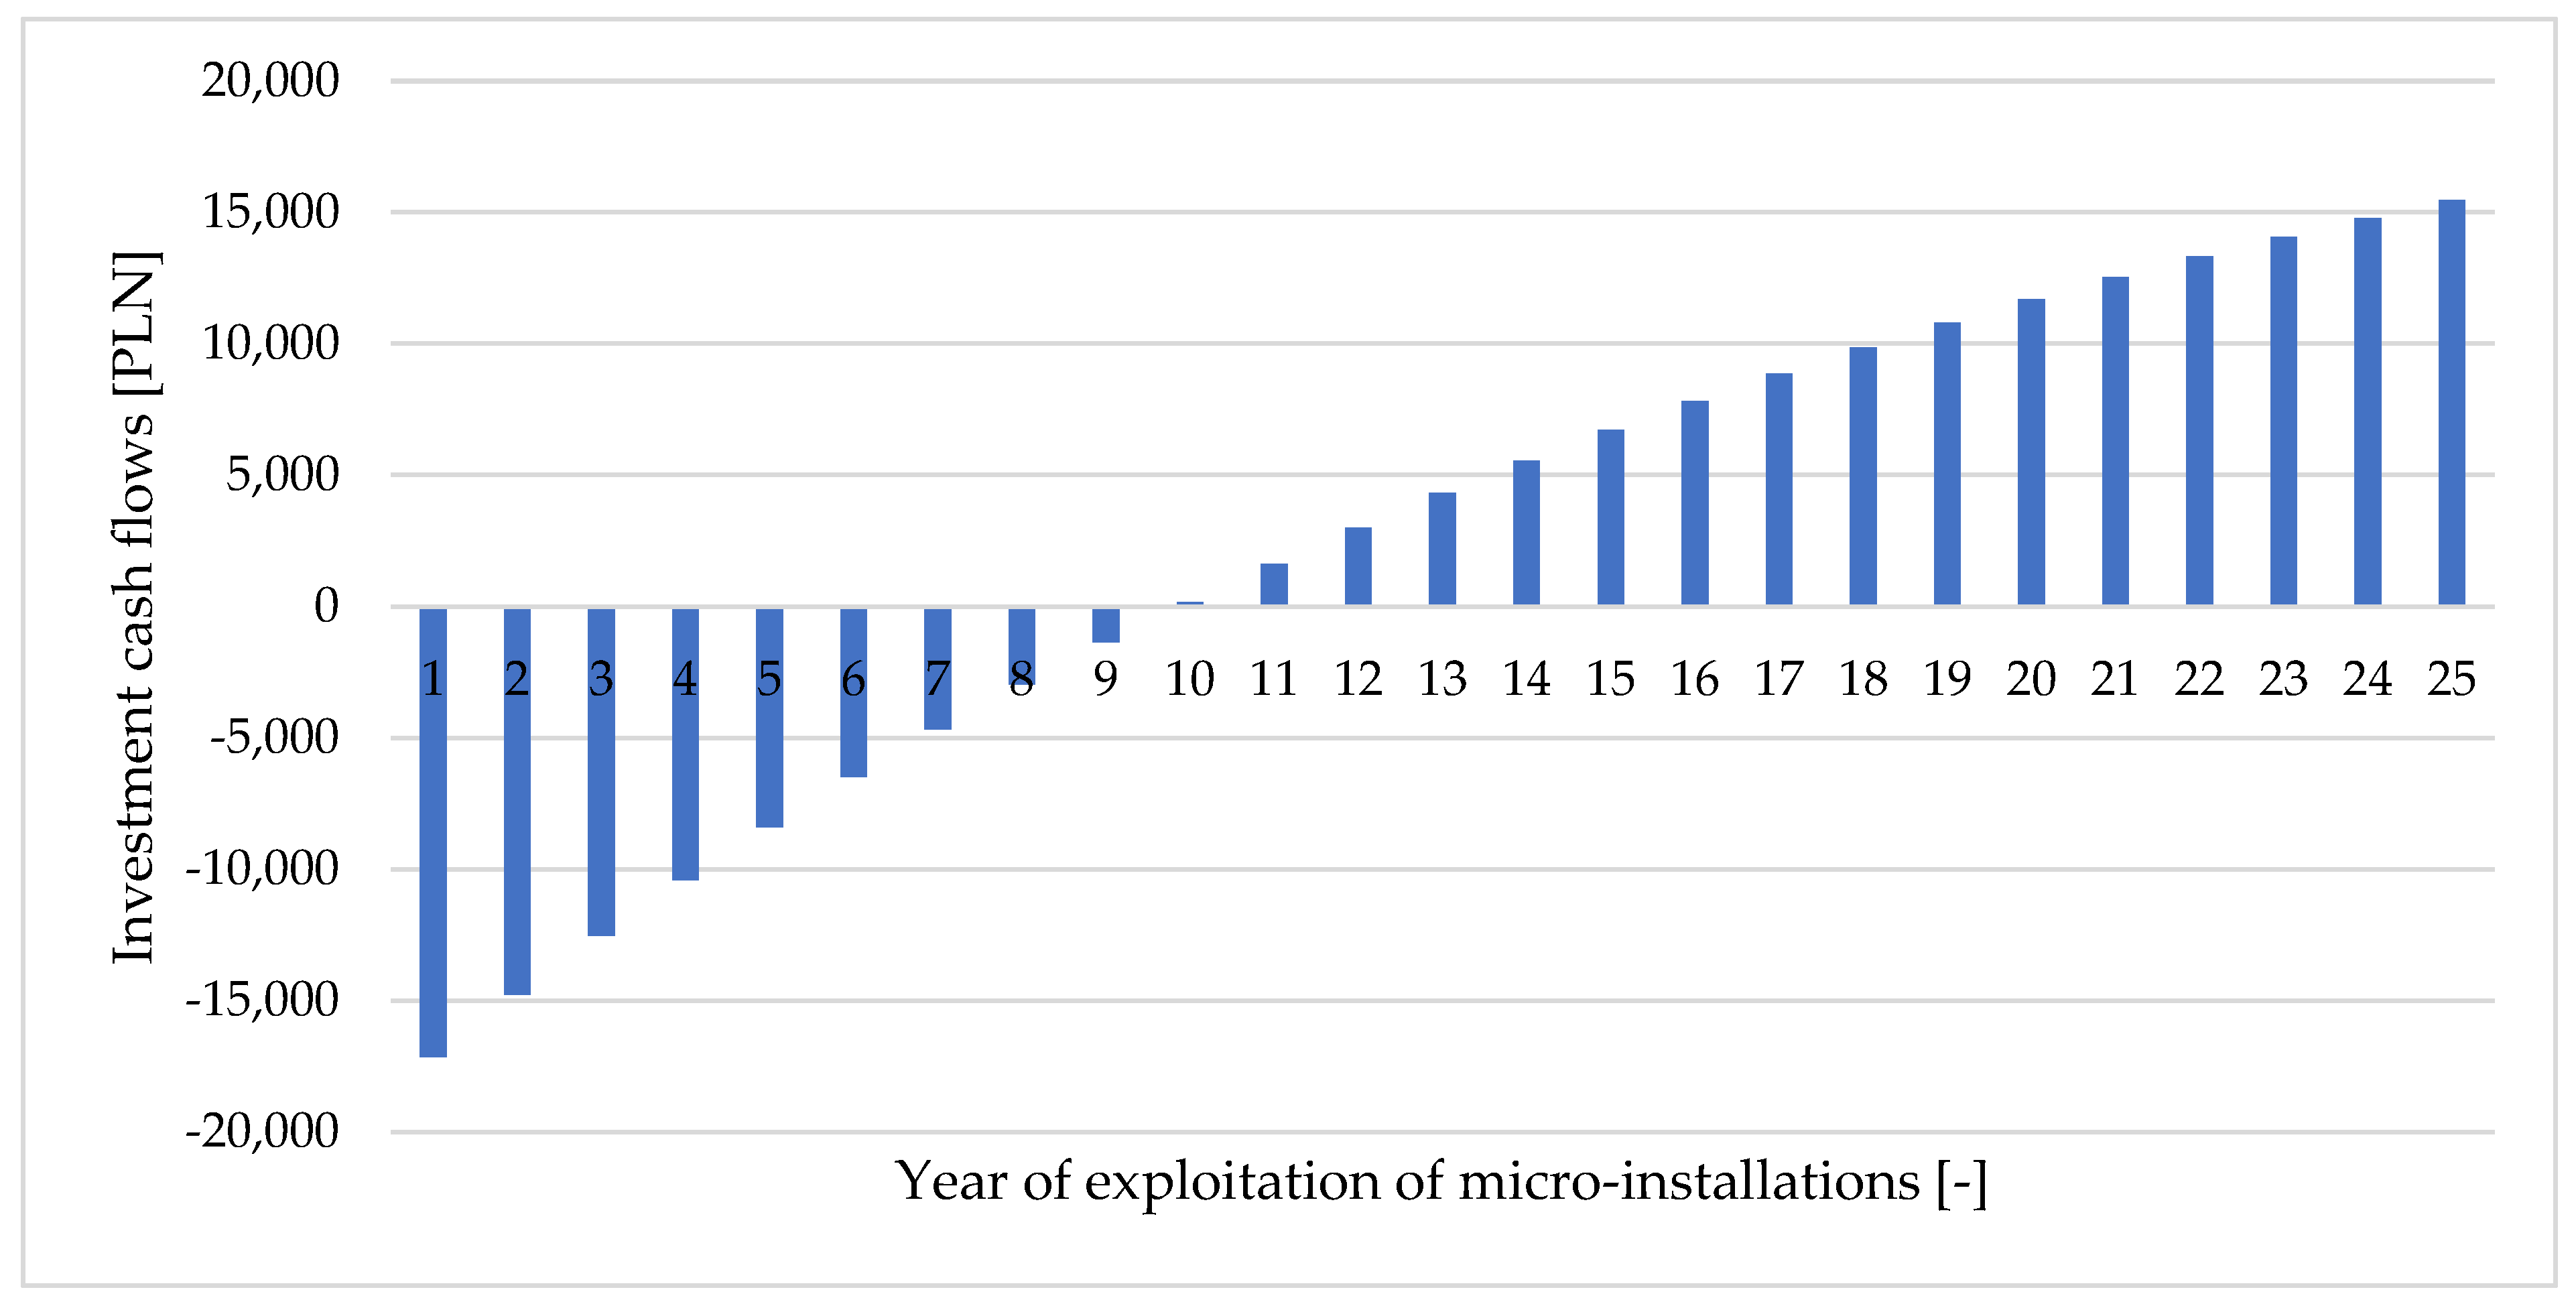
3.6. NPV Analyses of PV Installations for Different Energy Billing Scenarios with a 50% Self-Consumption Level
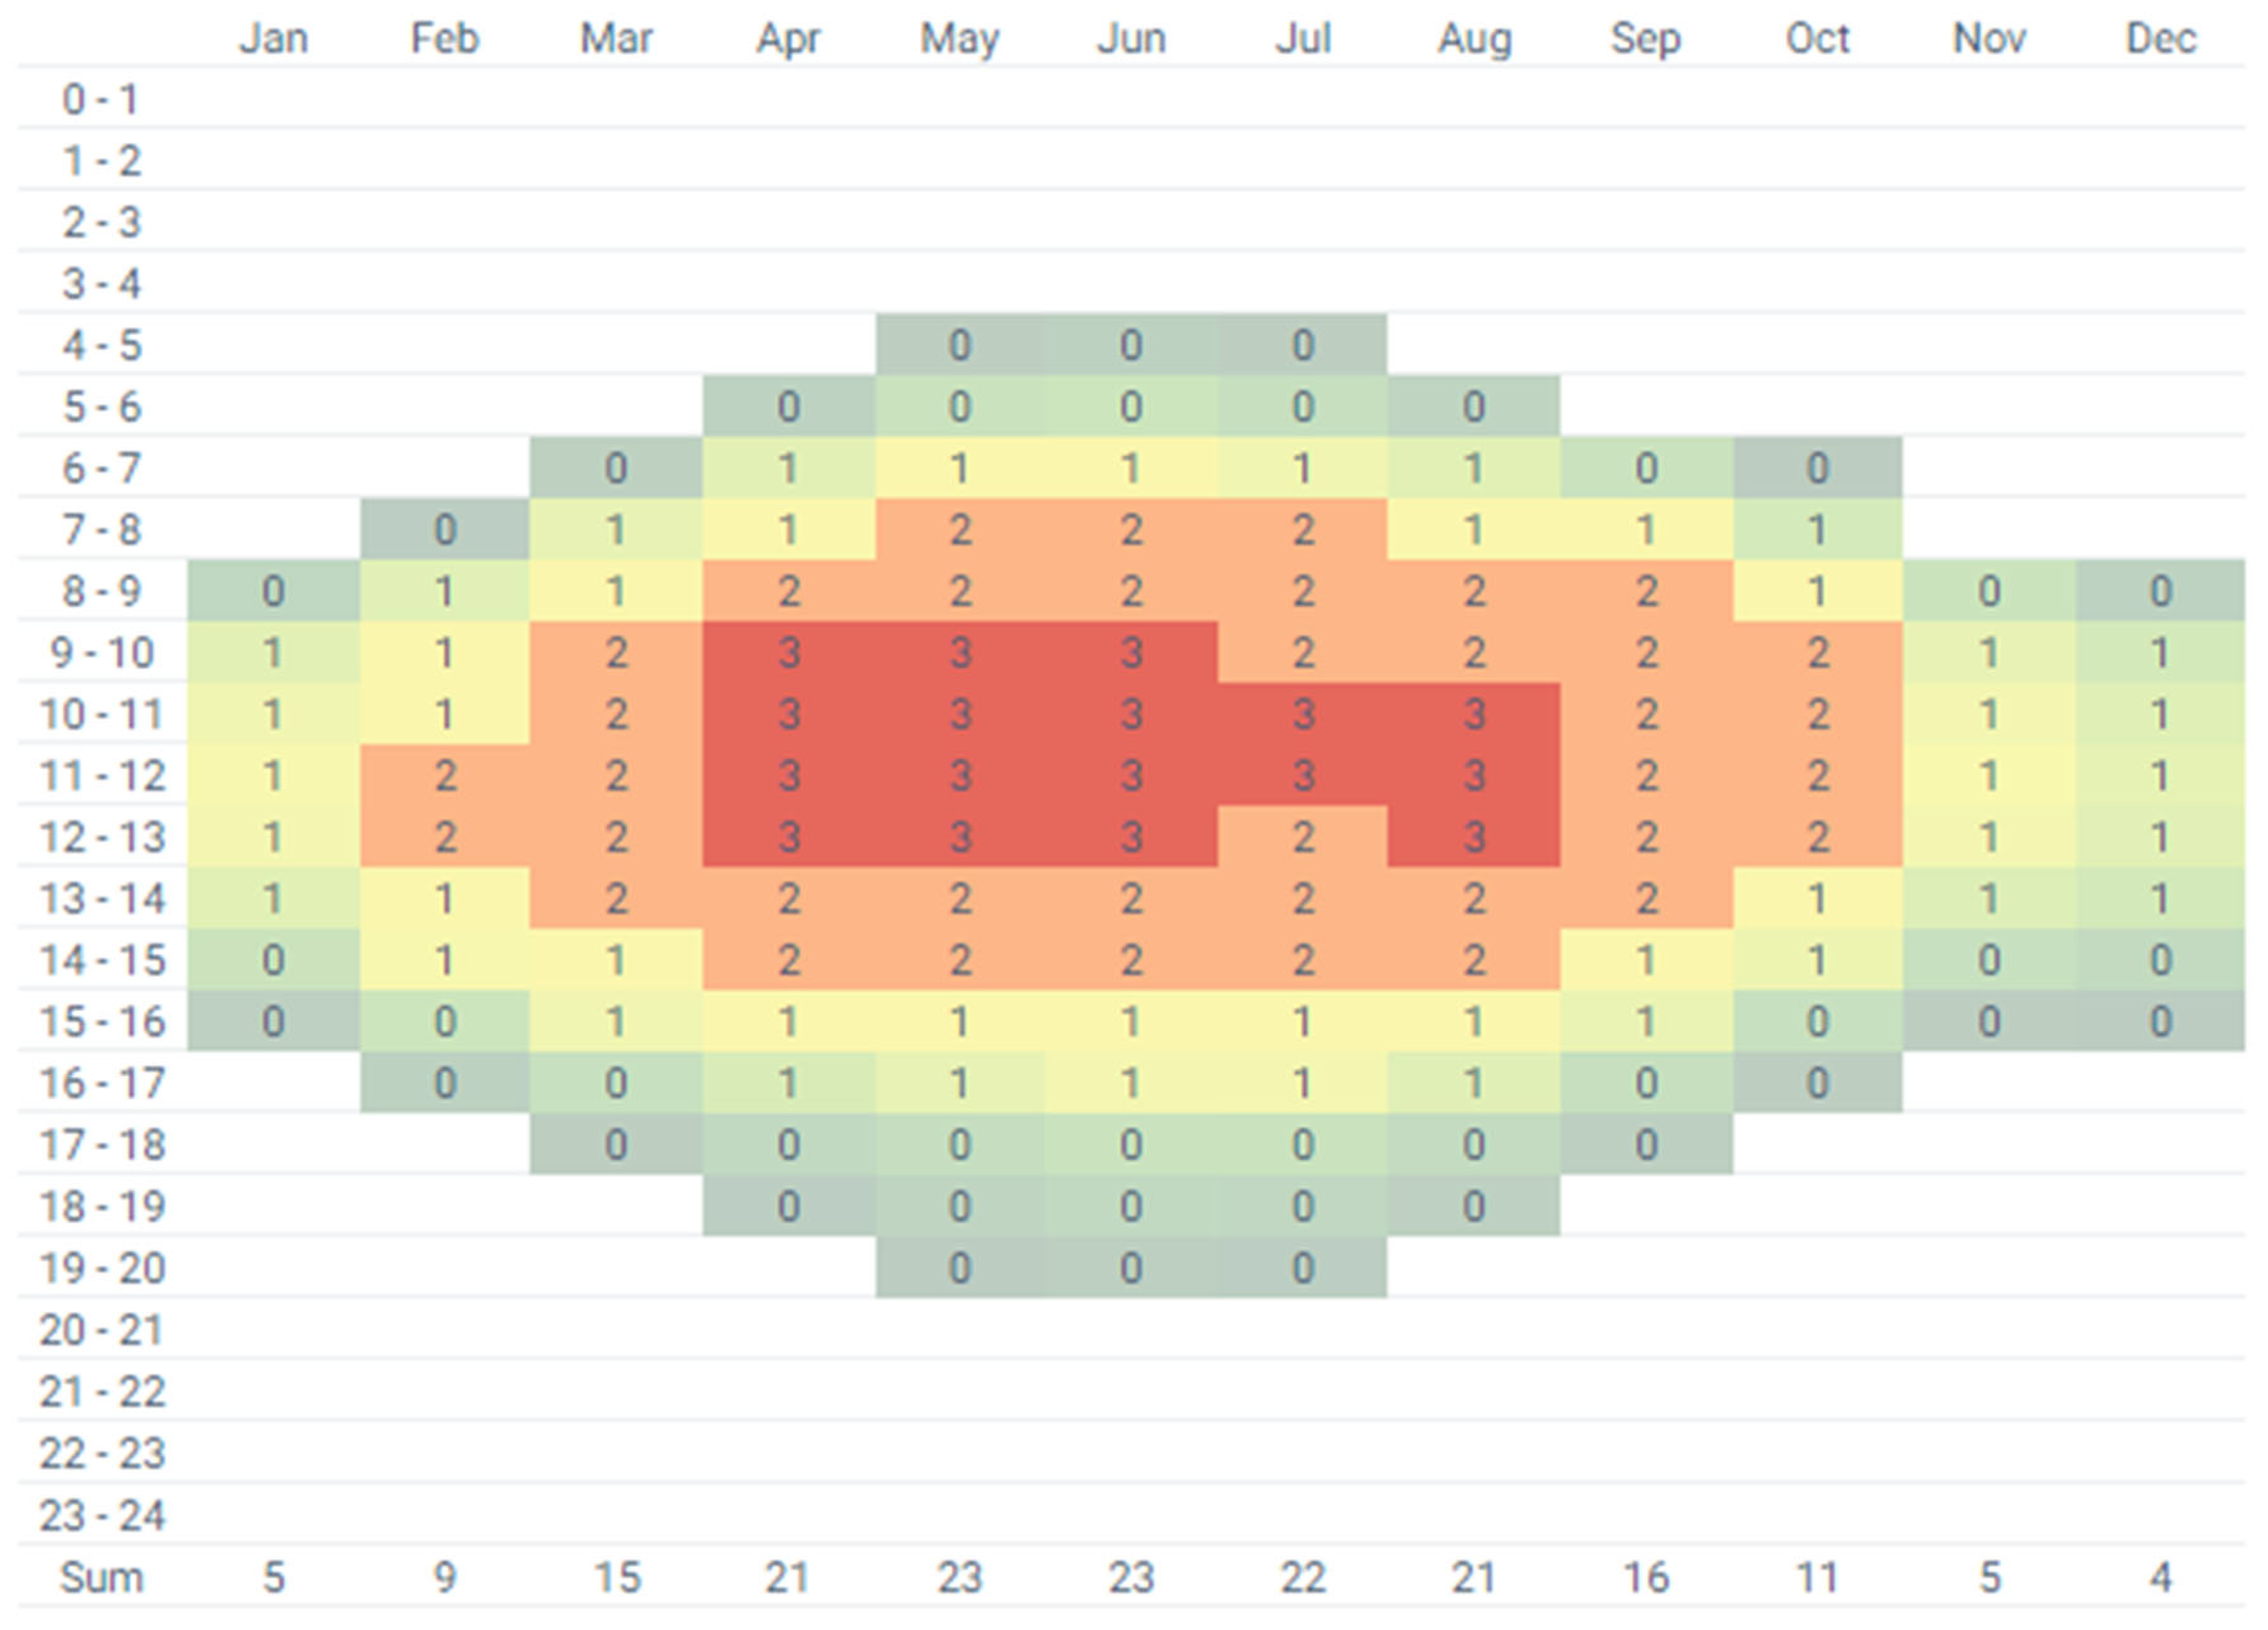
- Quarter I, electricity production from the PV installation from 8:00 a.m. to 2:00 p.m.;
- Quarter II, electricity production from the PV installation from 6:00 a.m. to 4:00 p.m.;
- Quarter III, electricity production from the PV installation from 6:00 a.m. to 4:00 p.m.;
- Quarter IV, electricity production from the PV installation from 08:00 a.m. to 1:00 p.m.
3.7. NPV Analyses of PV Installations for Different Energy Billing Scenarios with 60% Self-Consumption Level
4. Discussion
5. Summary
Author Contributions
Funding
Data Availability Statement
Conflicts of Interest
Appendix A


| System Lifetime [Year] | Electricity Demand [kWh/Year] | Electricity Price [PLN/kWh] | Electricity Costs without a PV System [PLN/Year] | Electricity Needed from Grid (after Self-Consumption) [kWh/rok] | Electricity to Be Picked Up from the Grid [kWh/rok] | Difference of Electricity [kWh/rok] | Electricity Cost for Purchase from the Grid [PLN/Year] | Investment Outlays [PLN] | Operating Costs [PLN] | Discount Rate [-] | Investor Cash Flow [PLN/Year] | NPV [PLN] | Investment Profitability [PLN] |
|---|---|---|---|---|---|---|---|---|---|---|---|---|---|
| 0 | - | - | - | - | - | - | - | 19,660 | - | - | - | −19,660.00 | −19,660.00 |
| 1 | 4500 | 0.70 | 3150.00 | 2813.70 | 3147.76 | 334.06 | 0 | 0 | 450 | 0.08 | 3150.00 | 2500.00 | −17,160.00 |
| 2 | 4500 | 0.71 | 3213.00 | 2822.97 | 3130.45 | 307.48 | 0 | 0 | 450 | 0.08 | 3213.00 | 2368.83 | −14,791.17 |
| 3 | 4500 | 0.73 | 3277.26 | 2832.20 | 3113.23 | 281.03 | 0 | 0 | 450 | 0.08 | 3277.26 | 2244.37 | −12,546.80 |
| 4 | 4500 | 0.74 | 3342.81 | 2841.37 | 3096.10 | 254.73 | 0 | 0 | 450 | 0.08 | 3342.81 | 2126.30 | −10,420.50 |
| 5 | 4500 | 0.76 | 3409.66 | 2850.49 | 3079.08 | 228.59 | 0 | 0 | 450 | 0.08 | 3409.66 | 2014.30 | −8406.21 |
| 6 | 4500 | 0.77 | 3477.85 | 2859.57 | 3062.14 | 202.57 | 0 | 0 | 450 | 0.08 | 3477.85 | 1908.06 | −6498.15 |
| 7 | 4500 | 0.79 | 3547.41 | 2868.59 | 3045.30 | 176.71 | 0 | 0 | 450 | 0.08 | 3547.41 | 1807.31 | −4690.84 |
| 8 | 4500 | 0.80 | 3618.36 | 2877.56 | 3028.55 | 150.99 | 0 | 0 | 450 | 0.08 | 3618.36 | 1711.77 | −2979.07 |
| 9 | 4500 | 0.82 | 3690.73 | 2886.48 | 3011.90 | 125.42 | 0 | 0 | 450 | 0.08 | 3690.73 | 1621.17 | −1357.90 |
| 10 | 4500 | 0.84 | 3764.54 | 2895.36 | 2995.33 | 99.97 | 0 | 0 | 450 | 0.08 | 3764.54 | 1535.27 | 177.37 |
| 11 | 4500 | 0.85 | 3839.83 | 2904.18 | 2978.86 | 74.68 | 0 | 0 | 450 | 0.08 | 3839.83 | 1453.84 | 1631.21 |
| 12 | 4500 | 0.87 | 3916.63 | 2912.96 | 2962.47 | 49.51 | 0 | 0 | 450 | 0.08 | 3916.63 | 1376.65 | 3007.86 |
| 13 | 4500 | 0.89 | 3994.96 | 2921.69 | 2946.18 | 24.49 | 0 | 0 | 450 | 0.08 | 3994.96 | 1303.48 | 4311.34 |
| 14 | 4500 | 0.91 | 4074.86 | 2930.37 | 2929.98 | −0.39 | 0.35 | 0 | 450 | 0.08 | 4074.51 | 1234.00 | 5545.34 |
| 15 | 4500 | 0.92 | 4156.36 | 2939.00 | 2913.86 | −25.14 | 23.22 | 0 | 450 | 0.08 | 4133.14 | 1161.08 | 6706.42 |
| 16 | 4500 | 0.94 | 4239.49 | 2947.59 | 2897.83 | −49.76 | 46.88 | 0 | 450 | 0.08 | 4192.61 | 1092.43 | 7798.85 |
| 17 | 4500 | 0.96 | 4324.27 | 2956.13 | 2881.90 | −74.23 | 71.33 | 0 | 450 | 0.08 | 4252.94 | 1027.82 | 8826.67 |
| 18 | 4500 | 0.98 | 4410.76 | 2964.62 | 2866.05 | −98.57 | 96.62 | 0 | 450 | 0.08 | 4314.15 | 967.00 | 9793.67 |
| 19 | 4500 | 1.00 | 4498.98 | 2973.06 | 2850.28 | −122.78 | 122.75 | 0 | 450 | 0.08 | 4376.22 | 909.75 | 10,703.42 |
| 20 | 4500 | 1.02 | 4588.96 | 2981.46 | 2834.61 | −146.85 | 149.75 | 0 | 450 | 0.08 | 4439.20 | 855.88 | 11,559.30 |
| 21 | 4500 | 1.04 | 4680.73 | 2989.81 | 2819.02 | −170.79 | 177.65 | 0 | 450 | 0.08 | 4503.08 | 805.17 | 12,364.46 |
| 22 | 4500 | 1.06 | 4774.35 | 2998.12 | 2803.51 | −194.61 | 206.47 | 0 | 450 | 0.08 | 4567.87 | 757.44 | 13,121.91 |
| 23 | 4500 | 1.08 | 4869.84 | 3006.38 | 2788.09 | −218.29 | 236.23 | 0 | 450 | 0.08 | 4633.61 | 712.53 | 13,834.44 |
| 24 | 4500 | 1.10 | 4967.23 | 3014.59 | 2772.76 | −241.83 | 266.94 | 0 | 450 | 0.08 | 4700.29 | 670.27 | 14,504.71 |
| 25 | 4500 | 1.13 | 5066.58 | 3022.76 | 2757.50 | −265.26 | 298.66 | 0 | 450 | 0.08 | 4767.92 | 630.49 | 15,135.20 |
| System Lifetime [Year] | Electricity That Was Purchased Self-Consumption Adjusted [kWh/Year] | Electricity Purchase Costs from the Grid [PLN/Year] | Electricity That Has Been Sold [kWh/Year] | Costs of Selling Electricity to the Grid [PLN/Year] | Savings Related to the Production of Electricity for Own Use [PLN/Year] | Investment Outlays [PLN] | Operating Costs [PLN] | Discount Rate [-] | Investor Cash Flow [PLN/Year] | NPV [PLN] | Investment Profitability [PLN] |
|---|---|---|---|---|---|---|---|---|---|---|---|
| 0 | - | - | - | - | - | 19,660 | - | - | - | −19,660.00 | −19,660 |
| 1 | 2813.70 | 1969.59 | 3934.70 | 2761.20 | 1180.41 | 0 | 450 | 0.08 | 1972.02 | 1409.28 | −18,250.7 |
| 2 | 2822.97 | 2004.31 | 3913.06 | 2800.93 | 1190.69 | 0 | 450 | 0.08 | 1987.31 | 1318.00 | −16,932.7 |
| 3 | 2832.20 | 2067.50 | 3891.54 | 2841.24 | 1217.50 | 0 | 450 | 0.08 | 1991.23 | 1223.48 | −15,709.2 |
| 4 | 2841.37 | 2102.62 | 3870.13 | 2882.12 | 1227.38 | 0 | 450 | 0.08 | 2006.89 | 1144.36 | −14,564.9 |
| 5 | 2850.49 | 2166.38 | 3848.85 | 2923.60 | 1253.62 | 0 | 450 | 0.08 | 2010.84 | 1062.28 | −13,502.6 |
| 6 | 2859.57 | 2201.87 | 3827.68 | 2965.67 | 1263.13 | 0 | 450 | 0.08 | 2026.93 | 993.73 | −12,508.9 |
| 7 | 2868.59 | 2266.18 | 3806.63 | 3008.35 | 1288.82 | 0 | 450 | 0.08 | 2030.98 | 922.49 | −11,586.4 |
| 8 | 2877.56 | 2302.05 | 3785.69 | 3051.64 | 1297.95 | 0 | 450 | 0.08 | 2047.54 | 863.10 | −10,723.3 |
| 9 | 2886.48 | 2366.92 | 3764.87 | 3095.55 | 1323.08 | 0 | 450 | 0.08 | 2051.71 | 801.25 | −9922.03 |
| 10 | 2895.36 | 2432.10 | 3744.16 | 3140.09 | 1347.90 | 0 | 450 | 0.08 | 2055.89 | 743.84 | −9178.19 |
| 11 | 2904.18 | 2468.56 | 3723.57 | 3185.28 | 1356.44 | 0 | 450 | 0.08 | 2073.17 | 696.15 | −8482.04 |
| 12 | 2912.96 | 2534.28 | 3703.09 | 3231.12 | 1380.72 | 0 | 450 | 0.08 | 2077.56 | 646.33 | −7835.72 |
| 13 | 2921.69 | 2600.30 | 3682.72 | 3277.61 | 1404.70 | 0 | 450 | 0.08 | 2082 | 600.08 | −7235.63 |
| 14 | 2930.37 | 2666.64 | 3662.47 | 3324.78 | 1428.36 | 0 | 450 | 0.08 | 2086.5 | 557.16 | −6678.47 |
| 15 | 2939.00 | 2703.88 | 3642.32 | 3372.62 | 1436.12 | 0 | 450 | 0.08 | 2104.85 | 521.68 | −6156.79 |
| 16 | 2947.59 | 2770.73 | 3622.29 | 3421.15 | 1459.27 | 0 | 450 | 0.08 | 2109.68 | 484.44 | −5672.35 |
| 17 | 2956.13 | 2837.88 | 3602.37 | 3470.38 | 1482.12 | 0 | 450 | 0.08 | 2114.61 | 449.89 | −5222.46 |
| 18 | 2964.62 | 2905.33 | 3582.56 | 3520.32 | 1504.67 | 0 | 450 | 0.08 | 2119.67 | 417.83 | −4804.62 |
| 19 | 2973.06 | 2973.06 | 3562.85 | 3570.98 | 1526.94 | 0 | 450 | 0.08 | 2124.85 | 388.08 | −4416.54 |
| 20 | 2981.46 | 3041.09 | 3543.26 | 3622.36 | 1548.91 | 0 | 450 | 0.08 | 2130.18 | 360.48 | −4056.06 |
| 21 | 2989.81 | 3109.40 | 3523.77 | 3674.49 | 1570.60 | 0 | 450 | 0.08 | 2135.68 | 334.87 | −3721.19 |
| 22 | 2998.12 | 3178.01 | 3504.39 | 3727.37 | 1591.99 | 0 | 450 | 0.08 | 2141.36 | 311.11 | −3410.08 |
| 23 | 3006.38 | 3246.89 | 3485.11 | 3781.00 | 1613.11 | 0 | 450 | 0.08 | 2147.22 | 289.06 | −3121.02 |
| 24 | 3014.59 | 3316.05 | 3465.95 | 3835.41 | 1633.95 | 0 | 450 | 0.08 | 2153.3 | 268.61 | −2852.41 |
| 25 | 3022.76 | 3415.72 | 3446.88 | 3890.60 | 1669.28 | 0 | 450 | 0.08 | 2144.16 | 247.38 | −2605.03 |
| System Lifetime [Year] | Electricity That Was Purchased Self-Consumption Adjusted [kWh/Year] | Electricity Purchase Costs from the Grid [PLN/Year] | Electricity That Has Been Sold [kWh/Year] | Costs of Selling Electricity to the Grid [PLN/Year] | Savings Related to the Production of Electricity for Own Use [PLN/Year] | Investment Outlays [PLN] | Operating Costs [PLN] | Discount Rate [-] | Investor Cash Flow [PLN/Year] | NPV [PLN] | Investment Profitability [PLN] |
|---|---|---|---|---|---|---|---|---|---|---|---|
| 0 | - | - | - | - | - | 19,660 | - | - | - | −19,660.00 | −19,660.00 |
| 1 | 3150 | 2205.00 | 4271.00 | 2797.96 | 945.00 | 0 | 450 | 0.08 | 1537.96 | 1007.37 | −18,652.63 |
| 2 | 3150 | 2236.50 | 4240.08 | 2832.90 | 958.50 | 0 | 450 | 0.08 | 1554.90 | 947.28 | −17,705.35 |
| 3 | 3150 | 2299.50 | 4209.34 | 2868.25 | 985.50 | 0 | 450 | 0.08 | 1554.25 | 876.59 | −16,828.76 |
| 4 | 3150 | 2331.00 | 4178.76 | 2903.99 | 999.00 | 0 | 450 | 0.08 | 1571.99 | 824.70 | −16,004.07 |
| 5 | 3150 | 2394.00 | 4148.35 | 2940.14 | 1026.00 | 0 | 450 | 0.08 | 1572.14 | 763.71 | −15,240.36 |
| 6 | 3150 | 2425.50 | 4118.11 | 2976.69 | 1039.50 | 0 | 450 | 0.08 | 1590.69 | 718.83 | −14,521.53 |
| 7 | 3150 | 2488.50 | 4088.04 | 3013.66 | 1066.50 | 0 | 450 | 0.08 | 1591.66 | 666.15 | −13,855.38 |
| 8 | 3150 | 2520.00 | 4058.13 | 3051.04 | 1080.00 | 0 | 450 | 0.08 | 1611.04 | 627.27 | −13,228.11 |
| 9 | 3150 | 2583.00 | 4028.38 | 3088.83 | 1107.00 | 0 | 450 | 0.08 | 1612.83 | 581.71 | −12,646.40 |
| 10 | 3150 | 2646.00 | 3998.80 | 3127.05 | 1134.00 | 0 | 450 | 0.08 | 1615.05 | 539.65 | −12,106.76 |
| 11 | 3150 | 2677.50 | 3969.39 | 3165.71 | 1147.50 | 0 | 450 | 0.08 | 1635.71 | 508.53 | −11,598.23 |
| 12 | 3150 | 2740.50 | 3940.13 | 3204.78 | 1174.50 | 0 | 450 | 0.08 | 1638.78 | 472.08 | −11,126.15 |
| 13 | 3150 | 2803.50 | 3911.03 | 3244.28 | 1201.50 | 0 | 450 | 0.08 | 1642.28 | 438.40 | −10,687.75 |
| 14 | 3150 | 2866.50 | 3882.10 | 3284.23 | 1228.50 | 0 | 450 | 0.08 | 1646.23 | 407.27 | −10,280.48 |
| 15 | 3150 | 2898.00 | 3853.32 | 3324.61 | 1242.00 | 0 | 450 | 0.08 | 1668.61 | 384.16 | −9896.32 |
| 16 | 3150 | 2961.00 | 3824.70 | 3365.43 | 1269.00 | 0 | 450 | 0.08 | 1673.43 | 357.11 | −9539.21 |
| 17 | 3150 | 3024.00 | 3796.24 | 3406.71 | 1296.00 | 0 | 450 | 0.08 | 1678.71 | 332.08 | −9207.13 |
| 18 | 3150 | 3087.00 | 3767.94 | 3448.44 | 1323.00 | 0 | 450 | 0.08 | 1684.44 | 308.92 | −8898.22 |
| 19 | 3150 | 3150.00 | 3739.79 | 3490.62 | 1350.00 | 0 | 450 | 0.08 | 1690.62 | 287.47 | −8610.75 |
| 20 | 3150 | 3213.00 | 3711.79 | 3533.25 | 1377.00 | 0 | 450 | 0.08 | 1697.25 | 267.59 | −8343.15 |
| 21 | 3150 | 3276.00 | 3683.96 | 3576.36 | 1404.00 | 0 | 450 | 0.08 | 1704.36 | 249.18 | −8093.97 |
| 22 | 3150 | 3339.00 | 3656.27 | 3619.92 | 1431.00 | 0 | 450 | 0.08 | 1711.92 | 232.12 | −7861.85 |
| 23 | 3150 | 3402.00 | 3628.73 | 3663.94 | 1458.00 | 0 | 450 | 0.08 | 1719.94 | 216.29 | −7645.56 |
| 24 | 3150 | 3465.00 | 3601.35 | 3708.45 | 1485.00 | 0 | 450 | 0.08 | 1728.45 | 201.61 | −7443.95 |
| 25 | 3150 | 3559.50 | 3574.12 | 3753.44 | 1525.50 | 0 | 450 | 0.08 | 1719.44 | 185.36 | −7258.59 |
| System Lifetime [Year] | Electricity Demand [kWh/Year] | Electricity Price [PLN/kWh] | Electricity Costs without a PV System [PLN/Year] | Electricity Needed from Grid (after Self-Consumption) [kWh/rok] | Electricity to Be Picked Up from the Grid [kWh/rok] | Difference of Electricity [kWh/rok] | Electricity Cost for Purchase from the Grid [PLN/Year] | Investment Outlays [PLN] | Operating Costs [PLN] | Discount Rate [-] | Investor Cash Flow [PLN/Year] | NPV [PLN] | Investment Profitability [PLN] |
|---|---|---|---|---|---|---|---|---|---|---|---|---|---|
| 0 | - | - | - | - | - | - | - | 19,660 | - | - | - | −19,660.00 | −19,660.00 |
| 1 | 4500 | 0.70 | 3150.00 | 1689.50 | 2248.40 | 558.90 | 0 | 0 | 450 | 0.08 | 3150.00 | 2500.00 | −17,160.00 |
| 2 | 4500 | 0.71 | 3213.00 | 1704.96 | 2236.03 | 531.07 | 0 | 0 | 450 | 0.08 | 3213.00 | 2368.83 | −14,791.17 |
| 3 | 4500 | 0.73 | 3277.26 | 1720.33 | 2223.74 | 503.41 | 0 | 0 | 450 | 0.08 | 3277.26 | 2244.37 | −12,546.80 |
| 4 | 4500 | 0.74 | 3342.81 | 1735.62 | 2211.50 | 475.88 | 0 | 0 | 450 | 0.08 | 3342.81 | 2126.30 | −10,420.50 |
| 5 | 4500 | 0.76 | 3409.66 | 1750.83 | 2199.34 | 448.52 | 0 | 0 | 450 | 0.08 | 3409.66 | 2014.30 | −8406.21 |
| 6 | 4500 | 0.77 | 3477.85 | 1765.95 | 2187.24 | 421.30 | 0 | 0 | 450 | 0.08 | 3477.85 | 1908.06 | −6498.15 |
| 7 | 4500 | 0.79 | 3547.41 | 1780.98 | 2175.22 | 394.24 | 0 | 0 | 450 | 0.08 | 3547.41 | 1807.31 | −4690.84 |
| 8 | 4500 | 0.80 | 3618.36 | 1795.94 | 2163.25 | 367.32 | 0 | 0 | 450 | 0.08 | 3618.36 | 1711.77 | −2979.07 |
| 9 | 4500 | 0.82 | 3690.73 | 1810.81 | 2151.35 | 340.54 | 0 | 0 | 450 | 0.08 | 3690.73 | 1621.17 | −1357.90 |
| 10 | 4500 | 0.84 | 3764.54 | 1825.6 | 2139.52 | 313.92 | 0 | 0 | 450 | 0.08 | 3764.54 | 1535.27 | 177.37 |
| 11 | 4500 | 0.85 | 3839.83 | 1840.31 | 2127.76 | 287.45 | 0 | 0 | 450 | 0.08 | 3839.83 | 1453.84 | 1631.21 |
| 12 | 4500 | 0.87 | 3916.63 | 1854.94 | 2116.05 | 261.12 | 0 | 0 | 450 | 0.08 | 3916.63 | 1376.65 | 3007.86 |
| 13 | 4500 | 0.89 | 3994.96 | 1869.49 | 2104.41 | 234.93 | 0 | 0 | 450 | 0.08 | 3994.96 | 1303.48 | 4311.34 |
| 14 | 4500 | 0.91 | 4074.86 | 1883.95 | 2092.84 | 208.89 | 0 | 0 | 450 | 0.08 | 4074.86 | 1234.12 | 5545.46 |
| 15 | 4500 | 0.92 | 4156.36 | 1898.34 | 2081.33 | 182.99 | 0 | 0 | 450 | 0.08 | 4156.36 | 1168.4 | 6713.86 |
| 16 | 4500 | 0.94 | 4239.49 | 1912.65 | 2069.88 | 157.23 | 0 | 0 | 450 | 0.08 | 4239.49 | 1106.11 | 7819.97 |
| 17 | 4500 | 0.96 | 4324.27 | 1926.88 | 2058.50 | 131.62 | 0 | 0 | 450 | 0.08 | 4324.27 | 1047.10 | 8867.07 |
| 18 | 4500 | 0.98 | 4410.76 | 1941.03 | 2047.18 | 106.15 | 0 | 0 | 450 | 0.08 | 4410.76 | 991.18 | 9858.25 |
| 19 | 4500 | 1.00 | 4498.98 | 1955.11 | 2035.92 | 80.81 | 0 | 0 | 450 | 0.08 | 4498.98 | 938.20 | 10,796.44 |
| 20 | 4500 | 1.02 | 4588.96 | 1969.11 | 2024.72 | 55.61 | 0 | 0 | 450 | 0.08 | 4588.96 | 888.01 | 11,684.45 |
| 21 | 4500 | 1.04 | 4680.73 | 1983.02 | 2013.58 | 30.56 | 0 | 0 | 450 | 0.08 | 4680.73 | 840.46 | 12,524.91 |
| 22 | 4500 | 1.06 | 4774.35 | 1996.87 | 2002.51 | 5.64 | 0 | 0 | 450 | 0.08 | 4774.35 | 795.42 | 13,320.33 |
| 23 | 4500 | 1.08 | 4869.84 | 2010.64 | 1991.49 | −19.14 | 20.71 | 0 | 450 | 0.08 | 4849.12 | 749.24 | 14,069.57 |
| 24 | 4500 | 1.10 | 4967.23 | 2024.33 | 1980.54 | −43.78 | 48.33 | 0 | 450 | 0.08 | 4918.91 | 704.74 | 14,774.31 |
| 25 | 4500 | 1.13 | 5066.58 | 2037.94 | 1969.65 | −68.29 | 76.89 | 0 | 450 | 0.08 | 4989.69 | 662.88 | 15,437.19 |
| System Lifetime [Year] | Electricity That Was Purchased Self-Consumption Adjusted [kWh/Year] | Electricity Purchase Costs from the Grid [PLN/Year] | Electricity That Has Been Sold [kWh/Year] | Costs of Selling Electricity to the Grid [PLN/Year] | Savings Related to the Production of Electricity for Own Use [PLN/Year] | Investment Outlays [PLN] | Operating Costs [PLN] | Discount Rate [-] | Investor Cash Flow [PLN/Year] | NPV [PLN] | Investment Profitability [PLN] |
|---|---|---|---|---|---|---|---|---|---|---|---|
| 0 | - | - | - | - | - | 19,660 | - | - | - | −19,660.00 | −19,660 |
| 1 | 1689.50 | 1182.65 | 2810.50 | 1972.29 | 1967.35 | 0 | 450 | 0.08 | 2756.99 | 2136.10 | −17,523.90 |
| 2 | 1704.96 | 1210.52 | 2795.04 | 2000.67 | 1984.48 | 0 | 450 | 0.08 | 2774.62 | 1992.99 | −15,530.91 |
| 3 | 1720.33 | 1255.84 | 2779.67 | 2029.46 | 2029.16 | 0 | 450 | 0.08 | 2802.78 | 1867.71 | −13,663.20 |
| 4 | 1735.62 | 1284.36 | 2764.38 | 2058.66 | 2045.64 | 0 | 450 | 0.08 | 2819.94 | 1741.98 | −11,921.22 |
| 5 | 1750.83 | 1330.63 | 2749.18 | 2088.28 | 2089.37 | 0 | 450 | 0.08 | 2847.03 | 1631.38 | −10,289.84 |
| 6 | 1765.95 | 1359.78 | 2734.06 | 2118.33 | 2105.22 | 0 | 450 | 0.08 | 2863.78 | 1521.09 | −8768.75 |
| 7 | 1780.98 | 1406.97 | 2719.02 | 2148.82 | 2148.03 | 0 | 450 | 0.08 | 2889.87 | 1423.64 | −7345.11 |
| 8 | 1795.94 | 1436.75 | 2704.07 | 2179.74 | 2163.25 | 0 | 450 | 0.08 | 2906.24 | 1327.03 | −6018.08 |
| 9 | 1810.81 | 1484.86 | 2689.19 | 2211.10 | 2205.14 | 0 | 450 | 0.08 | 2931.38 | 1241.31 | −4776.77 |
| 10 | 1825.60 | 1533.50 | 2674.40 | 2242.92 | 2246.50 | 0 | 450 | 0.08 | 2955.91 | 1160.72 | −3616.05 |
| 11 | 1840.31 | 1564.26 | 2659.70 | 2275.20 | 2260.74 | 0 | 450 | 0.08 | 2971.68 | 1081.51 | −2534.55 |
| 12 | 1854.94 | 1613.79 | 2645.07 | 2307.94 | 2301.21 | 0 | 450 | 0.08 | 2995.35 | 1010.79 | −1523.75 |
| 13 | 1869.49 | 1663.84 | 2630.52 | 2341.15 | 2341.16 | 0 | 450 | 0.08 | 3018.47 | 944.42 | −579.33 |
| 14 | 1883.95 | 1714.39 | 2616.05 | 2374.84 | 2380.61 | 0 | 450 | 0.08 | 3041.05 | 882.15 | 302.82 |
| 15 | 1898.34 | 1746.47 | 2601.66 | 2409.01 | 2393.53 | 0 | 450 | 0.08 | 3056.07 | 821.54 | 1124.36 |
| 16 | 1912.65 | 1797.89 | 2587.35 | 2443.68 | 2432.11 | 0 | 450 | 0.08 | 3077.9 | 767.06 | 1891.42 |
| 17 | 1926.88 | 1849.80 | 2573.12 | 2478.84 | 2470.20 | 0 | 450 | 0.08 | 3099.23 | 716.00 | 2607.42 |
| 18 | 1941.03 | 1902.21 | 2558.97 | 2514.52 | 2507.79 | 0 | 450 | 0.08 | 3120.1 | 668.19 | 3275.61 |
| 19 | 1955.11 | 1955.11 | 2544.90 | 2550.70 | 2544.90 | 0 | 450 | 0.08 | 3140.49 | 623.42 | 3899.03 |
| 20 | 1969.11 | 2008.49 | 2530.90 | 2587.40 | 2581.51 | 0 | 450 | 0.08 | 3160.43 | 581.52 | 4480.55 |
| 21 | 1983.02 | 2062.34 | 2516.98 | 2624.64 | 2617.66 | 0 | 450 | 0.08 | 3179.96 | 542.32 | 5022.87 |
| 22 | 1996.87 | 2116.68 | 2503.14 | 2662.41 | 2653.32 | 0 | 450 | 0.08 | 3199.05 | 505.66 | 5528.54 |
| 23 | 2010.64 | 2171.49 | 2489.37 | 2700.71 | 2688.51 | 0 | 450 | 0.08 | 3217.74 | 471.39 | 5999.92 |
| 24 | 2024.33 | 2226.76 | 2475.68 | 2739.58 | 2723.24 | 0 | 450 | 0.08 | 3236.06 | 439.36 | 6439.28 |
| 25 | 2037.94 | 2302.87 | 2462.06 | 2779.00 | 2782.13 | 0 | 450 | 0.08 | 3258.26 | 410.06 | 6849.34 |
| System Lifetime [Year] | Electricity That Was Purchased Self-Consumption Adjusted [kWh/Year] | Electricity Purchase Costs from the Grid [PLN/Year] | Electricity That Has Been Sold [kWh/Year] | Costs of Selling Electricity to the Grid [PLN/Year] | Savings Related to the Production of Electricity for Own Use [PLN/Year] | Investment Outlays [PLN] | Operating Costs [PLN] | Discount Rate [-] | Investor Cash Flow [PLN/Year] | NPV [PLN] | Investment Profitability [PLN] |
|---|---|---|---|---|---|---|---|---|---|---|---|
| 0 | - | - | - | - | - | 19,660 | - | - | - | −19,660.00 | −19,660.00 |
| 1 | 2250 | 1575.00 | 4271.00 | 2251.75 | 1575.00 | 0 | 450 | 0.08 | 2251.75 | 1668.28 | −17,991.72 |
| 2 | 2250 | 1597.50 | 3339.58 | 2275.77 | 1597.50 | 0 | 450 | 0.08 | 2275.77 | 1565.30 | −16,426.42 |
| 3 | 2250 | 1642.50 | 3308.84 | 2299.97 | 1642.50 | 0 | 450 | 0.08 | 2299.97 | 1468.57 | −14,957.85 |
| 4 | 2250 | 1665.00 | 3278.26 | 2324.34 | 1665.00 | 0 | 450 | 0.08 | 2324.34 | 1377.70 | −13,580.15 |
| 5 | 2250 | 1710.00 | 3247.85 | 2348.90 | 1710.00 | 0 | 450 | 0.08 | 2348.90 | 1292.36 | −12,287.79 |
| 6 | 2250 | 1732.50 | 3217.61 | 2373.63 | 1732.50 | 0 | 450 | 0.08 | 2373.63 | 1212.21 | −11,075.58 |
| 7 | 2250 | 1777.50 | 3187.54 | 2398.54 | 1777.50 | 0 | 450 | 0.08 | 2398.54 | 1136.95 | −9938.63 |
| 8 | 2250 | 1800.00 | 3157.63 | 2423.61 | 1800.00 | 0 | 450 | 0.08 | 2423.61 | 1066.28 | −8872.35 |
| 9 | 2250 | 1845.00 | 3127.88 | 2448.86 | 1845.00 | 0 | 450 | 0.08 | 2448.86 | 999.93 | −7872.42 |
| 10 | 2250 | 1890.00 | 3098.30 | 2474.28 | 1890.00 | 0 | 450 | 0.08 | 2474.28 | 937.63 | −6934.79 |
| 11 | 2250 | 1912.50 | 3068.89 | 2499.87 | 1912.50 | 0 | 450 | 0.08 | 2499.87 | 879.16 | −6055.64 |
| 12 | 2250 | 1957.50 | 3039.63 | 2525.63 | 1957.50 | 0 | 450 | 0.08 | 2525.63 | 824.26 | −5231.37 |
| 13 | 2250 | 2002.50 | 3010.53 | 2551.55 | 2002.50 | 0 | 450 | 0.08 | 2551.55 | 772.74 | −4458.64 |
| 14 | 2250 | 2047.50 | 2981.60 | 2577.64 | 2047.50 | 0 | 450 | 0.08 | 2577.64 | 724.38 | −3734.26 |
| 15 | 2250 | 2070.00 | 2952.82 | 2603.89 | 2070.00 | 0 | 450 | 0.08 | 2603.89 | 679.00 | −3055.26 |
| 16 | 2250 | 2115.00 | 2924.20 | 2630.30 | 2115.00 | 0 | 450 | 0.08 | 2630.30 | 636.41 | −2418.85 |
| 17 | 2250 | 2160.00 | 2895.74 | 2656.87 | 2160.00 | 0 | 450 | 0.08 | 2656.87 | 596.45 | −1822.40 |
| 18 | 2250 | 2205.00 | 2867.44 | 2683.61 | 2205.00 | 0 | 450 | 0.08 | 2683.61 | 558.96 | −1263.45 |
| 19 | 2250 | 2250.00 | 2839.29 | 2710.49 | 2250.00 | 0 | 450 | 0.08 | 2710.49 | 523.78 | −739.66 |
| 20 | 2250 | 2295.00 | 2811.29 | 2737.52 | 2295.00 | 0 | 450 | 0.08 | 2737.52 | 490.78 | −248.88 |
| 21 | 2250 | 2340.00 | 2783.46 | 2764.71 | 2340.00 | 0 | 450 | 0.08 | 2764.71 | 459.83 | 210.95 |
| 22 | 2250 | 2385.00 | 2755.77 | 2792.04 | 2385.00 | 0 | 450 | 0.08 | 2792.04 | 430.80 | 641.75 |
| 23 | 2250 | 2430.00 | 2728.23 | 2819.51 | 2430.00 | 0 | 450 | 0.08 | 2819.51 | 403.56 | 1045.31 |
| 24 | 2250 | 2475.00 | 2700.85 | 2847.13 | 2475.00 | 0 | 450 | 0.08 | 2847.13 | 378.03 | 1423.33 |
| 25 | 2250 | 2542.50 | 2673.62 | 2874.89 | 2542.50 | 0 | 450 | 0.08 | 2874.89 | 354.08 | 1777.41 |
| System Lifetime [Year] | Electricity That Was Purchased Self-Consumption Adjusted [kWh/Year] | Electricity Purchase Costs from the Grid [PLN/Year] | Electricity That Has Been Sold [kWh/Year] | Costs of Selling Electricity to the Grid [PLN/Year] | Savings Related to the Production of Electricity for Own Use [PLN/Year] | Investment Outlays [PLN] | Operating Costs [PLN] | Discount Rate [-] | Investor Cash Flow [PLN/Year] | NPV [PLN] | Investment Profitability [PLN] |
|---|---|---|---|---|---|---|---|---|---|---|---|
| 0 | - | - | - | - | - | 19,660 | - | - | - | −34,660.00 | −34,660.00 |
| 1 | 2250 | 1575.00 | 3356.10 | 2243.43 | 1575.00 | 0 | 450 | 0.08 | 3537.70 | 2858.98 | −31,801.02 |
| 2 | 2250 | 1597.50 | 3325.18 | 2267.28 | 1597.50 | 0 | 450 | 0.08 | 3587.44 | 2689.85 | −29,111.17 |
| 3 | 2250 | 1642.50 | 3294.44 | 2291.31 | 1642.50 | 0 | 450 | 0.08 | 3637.87 | 2530.63 | −26,580.54 |
| 4 | 2250 | 1665.00 | 3263.86 | 2315.52 | 1665.00 | 0 | 450 | 0.08 | 3689.01 | 2380.77 | −24,199.76 |
| 5 | 2250 | 1710.00 | 3233.45 | 2339.89 | 1710.00 | 0 | 450 | 0.08 | 3740.85 | 2239.70 | −21,960.07 |
| 6 | 2250 | 1732.50 | 3203.21 | 2364.44 | 1732.50 | 0 | 450 | 0.08 | 3793.42 | 2106.92 | −19,853.14 |
| 7 | 2250 | 1777.50 | 3173.14 | 2389.17 | 1777.50 | 0 | 450 | 0.08 | 3846.73 | 1981.96 | −17,871.18 |
| 8 | 2250 | 1800.00 | 3143.23 | 2414.06 | 1800.00 | 0 | 450 | 0.08 | 3900.77 | 1864.34 | −16,006.84 |
| 9 | 2250 | 1845.00 | 3113.48 | 2439.11 | 1845.00 | 0 | 450 | 0.08 | 3955.56 | 1753.65 | −14,253.19 |
| 10 | 2250 | 1890.00 | 3083.90 | 2464.34 | 1890.00 | 0 | 450 | 0.08 | 4011.11 | 1649.49 | −12,603.70 |
| 11 | 2250 | 1912.50 | 3054.49 | 2489.73 | 1912.50 | 0 | 450 | 0.08 | 4067.44 | 1551.46 | −11,052.25 |
| 12 | 2250 | 1957.50 | 3025.23 | 2515.29 | 1957.50 | 0 | 450 | 0.08 | 4124.55 | 1459.22 | −9593.03 |
| 13 | 2250 | 2002.50 | 2996.13 | 2541 | 2002.50 | 0 | 450 | 0.08 | 4182.45 | 1372.41 | −8220.62 |
| 14 | 2250 | 2047.50 | 2967.20 | 2566.88 | 2047.50 | 0 | 450 | 0.08 | 4241.16 | 1290.74 | −6929.87 |
| 15 | 2250 | 2070.00 | 2938.42 | 2592.91 | 2070.00 | 0 | 450 | 0.08 | 4300.67 | 1213.89 | −5715.98 |
| 16 | 2250 | 2115.00 | 2909.80 | 2619.11 | 2115.00 | 0 | 450 | 0.08 | 4361.03 | 1141.59 | −4574.39 |
| 17 | 2250 | 2160.00 | 2881.34 | 2645.45 | 2160.00 | 0 | 450 | 0.08 | 4422.21 | 1073.56 | −3500.82 |
| 18 | 2250 | 2205.00 | 2853.04 | 2671.96 | 2205.00 | 0 | 450 | 0.08 | 4484.25 | 1009.57 | −2491.26 |
| 19 | 2250 | 2250.00 | 2824.89 | 2698.61 | 2250.00 | 0 | 450 | 0.08 | 4547.15 | 949.36 | −1541.90 |
| 20 | 2250 | 2295.00 | 2796.89 | 2725.4 | 2295.00 | 0 | 450 | 0.08 | 4610.91 | 892.72 | −649.18 |
| 21 | 2250 | 2340.00 | 2769.06 | 2752.35 | 2340.00 | 0 | 450 | 0.08 | 4675.57 | 839.43 | 190.25 |
| 22 | 2250 | 2385.00 | 2741.37 | 2779.43 | 2385.00 | 0 | 450 | 0.08 | 4741.11 | 789.31 | 979.56 |
| 23 | 2250 | 2430.00 | 2713.83 | 2806.65 | 2430.00 | 0 | 450 | 0.08 | 4807.57 | 742.16 | 1721.72 |
| 24 | 2250 | 2475.00 | 2686.45 | 2834.01 | 2475.00 | 0 | 450 | 0.08 | 4874.95 | 697.81 | 2419.53 |
| 25 | 2250 | 2542.50 | 2659.22 | 2861.51 | 2542.50 | 0 | 450 | 0.08 | 4943.27 | 656.10 | 3075.63 |
| System Lifetime [Year] | Electricity Demand [kWh/Year] | Electricity Price [PLN/kWh] | Electricity Costs without a PV System [PLN/Year] | Electricity Needed from Grid (after Self-Consumption) [kWh/rok] | Electricity to Be Picked Up from the Grid [kWh/rok] | Difference of Electricity [kWh/rok] | Electricity Cost for Purchase from the Grid [PLN/Year] | Investment Outlays [PLN] | Operating Costs [PLN] | Discount Rate [-] | Investor Cash Flow [PLN/Year] | NPV [PLN] | Investment Profitability [PLN] |
|---|---|---|---|---|---|---|---|---|---|---|---|---|---|
| 0 | - | - | - | - | - | - | - | 19,660 | - | - | - | −19,660.00 | −19,660.00 |
| 1 | 4500 | 0.70 | 3150.00 | 1127.40 | 1798.72 | 671.32 | 0 | 0 | 450 | 0.08 | 3150.00 | 2500.00 | −17,160.00 |
| 2 | 4500 | 0.71 | 3213.00 | 1145.95 | 1788.83 | 642.87 | 0 | 0 | 450 | 0.08 | 3213.00 | 2368.83 | −14,791.17 |
| 3 | 4500 | 0.73 | 3277.26 | 1164.40 | 1778.99 | 614.59 | 0 | 0 | 450 | 0.08 | 3277.26 | 2244.37 | −12,546.80 |
| 4 | 4500 | 0.74 | 3342.81 | 1182.74 | 1769.20 | 586.46 | 0 | 0 | 450 | 0.08 | 3342.81 | 2126.30 | −10,420.50 |
| 5 | 4500 | 0.76 | 3409.66 | 1200.99 | 1759.47 | 558.48 | 0 | 0 | 450 | 0.08 | 3409.66 | 2014.30 | −8406.21 |
| 6 | 4500 | 0.77 | 3477.85 | 1219.13 | 1749.80 | 530.66 | 0 | 0 | 450 | 0.08 | 3477.85 | 1908.06 | −6498.15 |
| 7 | 4500 | 0.79 | 3547.41 | 1237.18 | 1740.17 | 503.00 | 0 | 0 | 450 | 0.08 | 3547.41 | 1807.31 | −4690.84 |
| 8 | 4500 | 0.80 | 3618.36 | 1255.12 | 1730.60 | 475.48 | 0 | 0 | 450 | 0.08 | 3618.36 | 1711.77 | −2979.07 |
| 9 | 4500 | 0.82 | 3690.73 | 1272.97 | 1721.08 | 448.11 | 0 | 0 | 450 | 0.08 | 3690.73 | 1621.17 | −1357.90 |
| 10 | 4500 | 0.84 | 3764.54 | 1290.72 | 1711.62 | 420.90 | 0 | 0 | 450 | 0.08 | 3764.54 | 1535.27 | 177.37 |
| 11 | 4500 | 0.85 | 3839.83 | 1308.37 | 1702.20 | 393.84 | 0 | 0 | 450 | 0.08 | 3839.83 | 1453.84 | 1631.21 |
| 12 | 4500 | 0.87 | 3916.63 | 1325.92 | 1692.84 | 366.92 | 0 | 0 | 450 | 0.08 | 3916.63 | 1376.65 | 3007.86 |
| 13 | 4500 | 0.89 | 3994.96 | 1343.38 | 1683.53 | 340.15 | 0 | 0 | 450 | 0.08 | 3994.96 | 1303.48 | 4311.34 |
| 14 | 4500 | 0.91 | 4074.86 | 1360.74 | 1674.27 | 313.53 | 0 | 0 | 450 | 0.08 | 4074.86 | 1234.12 | 5545.46 |
| 15 | 4500 | 0.92 | 4156.36 | 1378.01 | 1665.06 | 287.05 | 0 | 0 | 450 | 0.08 | 4156.36 | 1168.40 | 6713.86 |
| 16 | 4500 | 0.94 | 4239.49 | 1395.18 | 1655.90 | 260.72 | 0 | 0 | 450 | 0.08 | 4239.49 | 1106.11 | 7819.97 |
| 17 | 4500 | 0.96 | 4324.27 | 1412.26 | 1646.80 | 234.54 | 0 | 0 | 450 | 0.08 | 4324.27 | 1047.10 | 8867.07 |
| 18 | 4500 | 0.98 | 4410.76 | 1429.24 | 1637.74 | 208.50 | 0 | 0 | 450 | 0.08 | 4410.76 | 991.18 | 9858.25 |
| 19 | 4500 | 1.00 | 4498.98 | 1446.13 | 1628.73 | 182.61 | 0 | 0 | 450 | 0.08 | 4498.98 | 938.20 | 10796.44 |
| 20 | 4500 | 1.02 | 4588.96 | 1462.93 | 1619.77 | 156.85 | 0 | 0 | 450 | 0.08 | 4588.96 | 888.01 | 11,684.45 |
| 21 | 4500 | 1.04 | 4680.73 | 1479.62 | 1610.87 | 131.24 | 0 | 0 | 450 | 0.08 | 4680.73 | 840.46 | 12,524.91 |
| 22 | 4500 | 1.06 | 4774.35 | 1496.24 | 1602.01 | 105.77 | 0 | 0 | 450 | 0.08 | 4774.35 | 795.42 | 13,320.33 |
| 23 | 4500 | 1.08 | 4869.84 | 1512.76 | 1593.19 | 80.43 | 0 | 0 | 450 | 0.08 | 4869.84 | 752.77 | 14,073.10 |
| 24 | 4500 | 1.10 | 4967.23 | 1529.19 | 1584.43 | 55.24 | 0 | 0 | 450 | 0.08 | 4967.23 | 712.36 | 14,785.46 |
| 25 | 4500 | 1.13 | 5066.58 | 1545.53 | 1575.72 | 30.19 | 0 | 0 | 450 | 0.08 | 5066.58 | 674.10 | 15,459.56 |
| System Lifetime [Year] | Electricity That Was Purchased Self-Consumption Adjusted [kWh/Year] | Electricity Purchase Costs from the Grid [PLN/Year] | Electricity That Has Been Sold [kWh/Year] | Costs of Selling Electricity to the Grid [PLN/Year] | Savings Related to the Production of Electricity for Own Use [PLN/Year] | Investment Outlays [PLN] | Operating Costs [PLN] | Discount Rate [-] | Investor Cash Flow [PLN/Year] | NPV [PLN] | Investment Profitability [PLN] |
|---|---|---|---|---|---|---|---|---|---|---|---|
| 0 | - | - | - | - | - | 19,660 | - | - | - | −19,660.00 | −19,660.00 |
| 1 | 1127.40 | 789.18 | 2248.40 | 1577.83 | 2360.82 | 0 | 450 | 0.08 | 3149.47 | 2499.51 | −17,160.49 |
| 2 | 1145.95 | 813.63 | 2236.03 | 1600.53 | 2381.37 | 0 | 450 | 0.08 | 3168.28 | 2330.49 | −14,830.00 |
| 3 | 1164.40 | 850.01 | 2223.74 | 1623.57 | 2434.99 | 0 | 450 | 0.08 | 3208.55 | 2189.83 | −12,640.18 |
| 4 | 1182.74 | 875.23 | 2211.50 | 1646.93 | 2454.77 | 0 | 450 | 0.08 | 3226.47 | 2040.79 | −10,599.39 |
| 5 | 1200.99 | 912.75 | 2199.34 | 1670.63 | 2507.25 | 0 | 450 | 0.08 | 3265.12 | 1915.92 | −8683.47 |
| 6 | 1219.13 | 938.73 | 2187.24 | 1694.67 | 2526.27 | 0 | 450 | 0.08 | 3282.20 | 1784.77 | −6898.70 |
| 7 | 1237.18 | 977.37 | 2175.22 | 1719.05 | 2577.63 | 0 | 450 | 0.08 | 3319.32 | 1674.22 | −5224.48 |
| 8 | 1255.12 | 1004.10 | 2163.25 | 1743.79 | 2595.90 | 0 | 450 | 0.08 | 3335.60 | 1559.00 | −3665.48 |
| 9 | 1272.97 | 1043.84 | 2151.35 | 1768.88 | 2646.16 | 0 | 450 | 0.08 | 3371.21 | 1461.33 | −2204.15 |
| 10 | 1290.72 | 1084.20 | 2139.52 | 1794.34 | 2695.80 | 0 | 450 | 0.08 | 3405.93 | 1369.17 | −834.98 |
| 11 | 1308.37 | 1112.11 | 2127.76 | 1820.16 | 2712.89 | 0 | 450 | 0.08 | 3420.94 | 1274.19 | 439.21 |
| 12 | 1325.92 | 1153.55 | 2116.05 | 1846.35 | 2761.45 | 0 | 450 | 0.08 | 3454.25 | 1193.03 | 1632.23 |
| 13 | 1343.38 | 1195.61 | 2104.41 | 1872.92 | 2809.39 | 0 | 450 | 0.08 | 3486.70 | 1116.59 | 2748.82 |
| 14 | 1360.74 | 1238.27 | 2092.84 | 1899.87 | 2856.73 | 0 | 450 | 0.08 | 3518.33 | 1044.65 | 3793.47 |
| 15 | 1378.01 | 1267.77 | 2081.33 | 1927.21 | 2872.23 | 0 | 450 | 0.08 | 3531.68 | 971.47 | 4764.94 |
| 16 | 1395.18 | 1311.47 | 2069.88 | 1954.94 | 2918.53 | 0 | 450 | 0.08 | 3562.00 | 908.36 | 5673.31 |
| 17 | 1412.26 | 1355.77 | 2058.50 | 1983.07 | 2964.23 | 0 | 450 | 0.08 | 3591.54 | 849.06 | 6522.37 |
| 18 | 1429.24 | 1400.65 | 2047.18 | 2011.61 | 3009.35 | 0 | 450 | 0.08 | 3620.31 | 793.37 | 7315.73 |
| 19 | 1446.13 | 1446.13 | 2035.92 | 2040.56 | 3053.87 | 0 | 450 | 0.08 | 3648.31 | 741.09 | 8056.82 |
| 20 | 1462.93 | 1492.18 | 2024.72 | 2069.92 | 3097.82 | 0 | 450 | 0.08 | 3675.55 | 692.04 | 8748.86 |
| 21 | 1479.62 | 1538.81 | 2013.58 | 2099.71 | 3141.19 | 0 | 450 | 0.08 | 3702.09 | 646.05 | 9394.90 |
| 22 | 1496.24 | 1586.01 | 2002.51 | 2129.92 | 3183.99 | 0 | 450 | 0.08 | 3727.90 | 602.94 | 9997.84 |
| 23 | 1512.76 | 1633.78 | 1991.49 | 2160.57 | 3226.22 | 0 | 450 | 0.08 | 3753.01 | 562.55 | 10,560.40 |
| 24 | 1529.19 | 1682.11 | 1980.54 | 2191.66 | 3267.89 | 0 | 450 | 0.08 | 3777.45 | 524.74 | 11,085.13 |
| 25 | 1545.53 | 1746.45 | 1969.65 | 2223.20 | 3338.55 | 0 | 450 | 0.08 | 3815.31 | 491.40 | 11,576.53 |
| System Lifetime [Year] | Electricity That Was Purchased Self-Consumption Adjusted [kWh/Year] | Electricity Purchase Costs from the Grid [PLN/Year] | Electricity That Has Been Sold [kWh/Year] | Costs of Selling Electricity to the Grid [PLN/Year] | Savings Related to the Production of Electricity for Own Use [PLN/Year] | Investment Outlays [PLN] | Operating Costs [PLN] | Discount Rate [-] | Investor Cash Flow [PLN/Year] | NPV [PLN] | Investment Profitability [PLN] |
|---|---|---|---|---|---|---|---|---|---|---|---|
| 0 | - | - | - | - | - | 19,660 | - | - | - | −19,660.00 | −19,660.00 |
| 1 | 1800 | 1260.00 | 2921.10 | 1952.08 | 1890.00 | 0 | 450 | 0.08 | 2582.08 | 1974.15 | −17,685.85 |
| 2 | 1800 | 1278.00 | 2890.18 | 1970.11 | 1917.00 | 0 | 450 | 0.08 | 2609.11 | 1851.09 | −15,834.76 |
| 3 | 1800 | 1314.00 | 2859.44 | 1988.20 | 1971.00 | 0 | 450 | 0.08 | 2645.20 | 1742.62 | −14,092.14 |
| 4 | 1800 | 1332.00 | 2828.86 | 2006.34 | 1998.00 | 0 | 450 | 0.08 | 2672.34 | 1633.49 | −12,458.65 |
| 5 | 1800 | 1368.00 | 2798.45 | 2024.53 | 2052.00 | 0 | 450 | 0.08 | 2708.53 | 1537.12 | −10,921.53 |
| 6 | 1800 | 1386.00 | 2768.21 | 2042.78 | 2079.00 | 0 | 450 | 0.08 | 2735.78 | 1440.43 | −9481.10 |
| 7 | 1800 | 1422.00 | 2738.14 | 2061.07 | 2133.00 | 0 | 450 | 0.08 | 2772.07 | 1354.90 | −8126.20 |
| 8 | 1800 | 1440.00 | 2708.23 | 2079.39 | 2160.00 | 0 | 450 | 0.08 | 2799.39 | 1269.30 | −6856.90 |
| 9 | 1800 | 1476.00 | 2670.94 | 2091.85 | 2214.00 | 0 | 450 | 0.08 | 2829.85 | 1190.52 | −5666.38 |
| 10 | 1800 | 1512.00 | 2643.18 | 2111.58 | 2268.00 | 0 | 450 | 0.08 | 2867.58 | 1119.81 | −4546.57 |
| 11 | 1800 | 1530.00 | 2619.49 | 2134.59 | 2295.00 | 0 | 450 | 0.08 | 2899.59 | 1050.59 | −3495.99 |
| 12 | 1800 | 1566.00 | 2590.23 | 2153.04 | 2349.00 | 0 | 450 | 0.08 | 2936.04 | 987.24 | −2508.75 |
| 13 | 1800 | 1602.00 | 2561.13 | 2171.51 | 2403.00 | 0 | 450 | 0.08 | 2972.51 | 927.52 | −1581.23 |
| 14 | 1800 | 1638.00 | 2532.20 | 2190.00 | 2457.00 | 0 | 450 | 0.08 | 3009.00 | 871.24 | −709.99 |
| 15 | 1800 | 1656.00 | 2503.42 | 2208.49 | 2484.00 | 0 | 450 | 0.08 | 3036.49 | 815.37 | 105.38 |
| 16 | 1800 | 1692.00 | 2474.80 | 2227.00 | 2538.00 | 0 | 450 | 0.08 | 3073.00 | 765.63 | 871.01 |
| 17 | 1800 | 1728.00 | 2446.34 | 2245.50 | 2592.00 | 0 | 450 | 0.08 | 3109.50 | 718.78 | 1589.79 |
| 18 | 1800 | 1764.00 | 2418.04 | 2264.01 | 2646.00 | 0 | 450 | 0.08 | 3146.01 | 674.67 | 2264.46 |
| 19 | 1800 | 1800.00 | 2389.89 | 2282.50 | 2700.00 | 0 | 450 | 0.08 | 3182.50 | 633.15 | 2897.62 |
| 20 | 1800 | 1836.00 | 2361.89 | 2300.97 | 2754.00 | 0 | 450 | 0.08 | 3218.97 | 594.08 | 3491.69 |
| 21 | 1800 | 1872.00 | 2334.06 | 2319.43 | 2808.00 | 0 | 450 | 0.08 | 3255.43 | 557.31 | 4049.01 |
| 22 | 1800 | 1908.00 | 2306.37 | 2337.85 | 2862.00 | 0 | 450 | 0.08 | 3291.85 | 522.73 | 4571.74 |
| 23 | 1800 | 1944.00 | 2278.83 | 2356.24 | 2916.00 | 0 | 450 | 0.08 | 3328.24 | 490.21 | 5061.95 |
| 24 | 1800 | 1980.00 | 2251.45 | 2374.59 | 2970.00 | 0 | 450 | 0.08 | 3364.59 | 459.63 | 5521.58 |
| 25 | 1800 | 2034.00 | 2224.22 | 2392.90 | 3051.00 | 0 | 450 | 0.08 | 3409.90 | 432.20 | 5953.77 |
References
- The Article of the Council of the European Union “Fit for 55”. Available online: https://www.consilium.europa.eu/en/policies/green-deal/fit-for-55-the-eu-plan-for-a-green-transition/ (accessed on 23 November 2022).
- The Article of the Council of the European Union “Clean Energy“. Available online: https://www.consilium.europa.eu/en/policies/clean-energy/ (accessed on 23 November 2022).
- The Article of the Council of the European Union “Energy Prices and Security of Supply”. Available online: https://www.consilium.europa.eu/en/policies/energy-prices-and-security-of-supply/ (accessed on 23 November 2022).
- Tha Article “This Year Polish Photovoltaics Will Again Break the Investment Record” (In Polish: “W tym Roku Polska Fotowoltaika Znowu Pobije Rekord Inwestycji”). Available online: https://www.gramwzielone.pl/energia-sloneczna/109176/w-tym-roku-polska-fotowoltaika-znowu-pobije-rekord-inwestycji (accessed on 23 November 2022).
- The Article “Installed Power of Photovoltaics” (In Polish: “Moc Zainstalowana Footwoltaiki”). Available online: https://www.rynekelektryczny.pl/generacja-zrodel-fotowoltaicznych/ (accessed on 23 November 2022).
- Wang, P.; Yu, P.; Huang, L.; Zhang, Y. An integrated technical, economic, and environmental framework for evaluating the rooftop photovoltaic potential of old residential buildings. J. Environ. Manag. 2022, 317, 115296. [Google Scholar] [CrossRef] [PubMed]
- Qadourah, J.A. Energy and economic potential for photovoltaic systems installed on the rooftop of apartment buildings in Jordan. Results Eng. 2022, 16, 100642. [Google Scholar] [CrossRef]
- Cura, D.; Yilmaz, M.; Koten, H.; Senthilraja, S.; Awad, M.M. Evaluation of the technical and economic aspects of solar photovoltaic plants under different climate conditions and feed-in tariff. Sustain. Cities Soc. 2022, 80, 103804. [Google Scholar] [CrossRef]
- Boduch, A.; Mik, K.; Castro, R.; Zawadzki, P. Technical and economic assessment of a 1 MWp floating photovoltaic system in Polish conditions. Renew. Energy 2022, 196, 983–994. [Google Scholar] [CrossRef]
- Braat, M.; Tsafarakis, O.; Lampropoulos, I.; Besseling, J.; Sark, W. Cost-Effective Increase of Photovoltaic Electricity Feed-In on Congested Transmission Lines: A Case Study of The Netherlands. Energies 2021, 14, 2868. [Google Scholar] [CrossRef]
- Fahim, S.R.; Hasanien, H.M.; Turky, R.A.; Aleem, S.H.E.A.; Ćalasan, M. A Comprehensive Review of Photovoltaic Modules Models and Algorithms Used in Parameter Extraction. Energies 2022, 15, 8941. [Google Scholar] [CrossRef]
- Lewinska, G.; Dyndał, K.; Sanetra, J.; Marszałek, K.W. Micromorph and polymorphous solar panel in a warm temperature transitional climate—Comparsion of outdoor performance and simulations. In Proceedings of the 19th International Conference on Renewable Energies and Power Quality (ICREPQ ’21), Almeria, Spain, 28–30 July 2021; Volume 19, pp. 385–390. [Google Scholar] [CrossRef]
- Trzmiel, G.; Głuchy, D.; Kurz, D. The impact of shading on the exploitation of photovoltaic installations. Renew. Energy 2020, 153, 480–498. [Google Scholar] [CrossRef]
- Baghel, N.S.; Chander, N. Performance comparison of mono and polycrystalline silicon solar photovoltaic modules under tropical wet and dry climatic conditions in east-central India. Clean Energy 2022, 6, 165–177. [Google Scholar] [CrossRef]
- Basta, M.; Helman, K. Scale-specific importance of weather variables for explanationof variations of electricity consumption: The case of Prague, Czech Republic. Energy Econ. 2013, 40, 503–514. [Google Scholar] [CrossRef]
- Household Load Profiles in USA. Available online: https://www.nrel.gov/buildings/end-use-load-profiles.html (accessed on 8 December 2022).
- Hayn, M.; Bertsch, V.; Fichtner, W. Electricity load profiles in Europe: The importance of household segmentation. Energy Res. Soc. Sci. 2014, 3, 30–45. [Google Scholar] [CrossRef]
- Behm, C.; Nolting, L.; Praktiknjo, A. How to model European electricity load profiles using artificialneutral networks. Appl. Energy 2020, 277, 115564. [Google Scholar] [CrossRef]
- Ordóñez, A.; Sánchez, E.; Rozas, L.; García, R.; Parra-Domínguez, J. Net-metering and net-billing in photovoltaic self-consumption: The cases of Ecuador and Spain. Sustain. Energy Technol. Assess. 2022, 53, 102434. [Google Scholar] [CrossRef]
- Fratean, A.; Dobra, P. Technical and economic viability of greenfield large scale photovoltaic plants in Romania. Sustain. Energy Technol. Assess. 2022, 53, 102486. [Google Scholar] [CrossRef]
- Mongkoldhumrongkul, K. Techno-economic analysis of photovoltaic rooftop system on car parking area in Rayong, Thailand. Energy Rep. 2022, 9, 202–212. [Google Scholar] [CrossRef]
- Kasprzyk, L.; Tomczewski, A.; Bednarek, K.; Bugała, A. Minimisation of the LCOE for the hybrid power supply system with the lead-acid battery. E3S Web Conf. 2017, 19, 01030. [Google Scholar] [CrossRef]
- Dobrzycki, A.; Kurz, D.; Maćkowiak, E. Influence of Selected Working Conditions on Electricity Generation in Bifacial Photovoltaic Modules in Polish Climatic Conditions. Energies 2021, 14, 4964. [Google Scholar] [CrossRef]
- Cirone, D.; Bruno, R.; Bevilacqua, P.; Perrella, S.; Arcuri, N. Techno-Economic Analysis of an Energy Community Based on PV and Electric Storage Systems in a Small Mountain Locality of South Italy: A Case Study. Sustainability 2022, 14, 13877. [Google Scholar] [CrossRef]
- Šimic, Z.; Topi’c, D.; Crnogorac, I.; Kneževi’c, G. Method for Sizing of a PV System for Family Home Using Economic Indicators. Energies 2021, 14, 4529. [Google Scholar] [CrossRef]
- Cucchiella, F.; D’Adamo, I.; Rosa, P. Industrial Photovoltaic Systems: An Economic Analysis in Non-Subsidized Electricity Markets. Energies 2015, 8, 12865–12880. [Google Scholar] [CrossRef]
- Sacchelli, S.; Havrysh, V.; Kalinichenko, A.; Suszanowicz, D. Ground-Mounted Photovoltaic and Crop Cultivation: A Comparative Analysis. Sustainability 2022, 14, 8607. [Google Scholar] [CrossRef]
- Bukowski, M.; Majewski, J.; Sobolewska, A. Macroeconomic Efficiency of Photovoltaic Energy Production in Polish Farms. Energies 2021, 14, 5721. [Google Scholar] [CrossRef]
- Iwaszczuk, N.; Trela, M. Analysis of the Impact of the Assumed Moment of Meeting Total Energy Demand on the Profitability of Photovoltaic Installations for Households in Poland. Energies 2021, 14, 1637. [Google Scholar] [CrossRef]
- Li, Y.; Peng, J.; Jia, H.; Zou, B.; Hao, B.; Ma, T.; Wang, X. Optimal battery schedule for grid-connected photovoltaic-battery systems of office buildings based on a dynamic programming algorithm. J. Energy Storage 2022, 50, 104557. [Google Scholar] [CrossRef]
- Ma, T.; Zhang, Y.; Gu, W.; Xiao, G.; Yang, H.; Wang, S. Strategy comparison and techno-economic evaluation of a grid-connected photovoltaic-battery system. Renew. Energy 2022, 197, 1049–1060. [Google Scholar] [CrossRef]
- Koo, C.; Shi, K.; Li, W.; Lee, J. Integrated approach to evaluating the impact of feed-in tariffs on the life cycle economic performance of photovoltaic systems in China: A case study of educational facilities. Energy 2022, 254, 124302. [Google Scholar] [CrossRef]
- D’Adamo, I.; Gastaldi, M.; Morone, P.; Ozturk, I. Economics and policy implications of residential photovoltaic systems in Italy’s developed market. Util. Policy 2022, 79, 01437. [Google Scholar] [CrossRef]
- Holami, H.; Nils Røstvik, H. Levelised Cost of Electricity (LCOE) of Building Integrated Photovoltaics (BIPV) in Europe, Rational Feed-In Tariffs and Subsidies. Energies 2021, 14, 2531. [Google Scholar] [CrossRef]
- Trela, M.; Dubel, A. Net-Metering vs. Net-Billing from the Investors Perspective—Impacts of Changes in RES Financing in Poland on the Profitability of a Joint Photovoltaic Panels and Heat Pump System. Energies 2022, 15, 227. [Google Scholar] [CrossRef]
- Brodzinski, Z.; Brodzinska, K.; Szadziun, M. Photovoltaic Farms—Economic Efficiency of Investments in North-East Poland. Energies 2021, 14, 2087. [Google Scholar] [CrossRef]
- Act of 27 January 2022 Amending the Act on Renewable Energy Sources and the Act Amending the Act on Renewable Energy Sources and Some Other Acts (In Polish: Ustawa z Dnia 27 Stycznia 2022 r. o Zmianie Ustawy o Odnawialnych Źródłach Energii oraz Ustawy o Zmianie Ustawy o Odnawialnych Źródłach Energii oraz Niektórych Innych Ustaw (Dz.U. 2022, poz. 467)). Available online: https://isap.sejm.gov.pl/isap.nsf/download.xsp/WDU20220000467/T/D20220467L.pdf (accessed on 20 November 2022).
- Głuchy, D. Analiza Porównawcza Opłacalności Inwestycji w Źródła Fotowoltaiczne, Informatyka Automatyka Pomiary w Gospodarce i Ochronie Środowiska 2012, 4b, Wyd; Centrum Innowacji i Transferu Technologii LPNT: Lublin, Poland, 2012; pp. 28–31. [Google Scholar]
- Kurz, D. Analiza Porównawcza Panelu Fotowoltaicznego i Dachówki Solarnej w Zastosowaniu do Budownictwa Jednorodzinnego, Informatyka Automatyka Pomiary w Gospodarce i Ochronie Środowiska 2012, 4b, Wyd; Centrum Innowacji i Transferu Technologii LPNT: Lublin, Poland, 2012; pp. 17–20. [Google Scholar]
- Soliński, B. System wsparcia hybrydowych mikroinstalacji wykorzystujących odnawialne źródła energii a ich efektywność ekonomiczna. Zesz. Nauk. Inst. Gospod. Surowcami Miner. Energią Pol. Akad. Nauk. 2017, 97, 5–20. [Google Scholar]
- Petelski, Ł. Własna instalacja fotowoltaiczna—Zagospodarowanie nadwyżek energii elektrycznej. Nowa Energ. 2020, 5–6, 75–76. [Google Scholar]
- Soliński, B.; Stopa, M. Modele biznesowe wytwórców energii w mikroinstalacjach a zmiany otoczenia prawnego w sektorze energetyki odnawialnej. Polityka Społeczeństwo 2018, 16, 38–51. [Google Scholar] [CrossRef]
- Act of 20 February 2015 on Renewable Energy Sources (In Polish: Ustawa z Dnia 20 Lutego 2015 r. o Odnawialnych Źródłach Energii (Dz.U. 2015, poz. 478)). Available online: https://isap.sejm.gov.pl/isap.nsf/download.xsp/WDU20150000478/T/D20150478L.pdf (accessed on 20 November 2022).
- Pijarski, P.; Połecki, Z. Rynek Energii Elektrycznej. Polityka i Ekonomia; Monograph of Lublin University of Technology: Lublin, Poland, 2017. [Google Scholar]
- The Article “Photovoltaics Has the Largest Share in the Installed Capacity of RES” (In Polish: “Fotowoltaika ma Największy Udział w Mocy Zainstalowanej OZE”). Available online: https://www.rynekelektryczny.pl/moc-zainstalowana-fotowoltaiki-w-polsce/ (accessed on 3 March 2022).
- The Article “The Fourth Edition of the My Electricity Program and a New Billing System for Prosumers Is Starting” (In Polish: Tekst “Rusza Czwarta EDYCJA programu Mój Prąd i Nowy System Rozliczeń dla Prosumentów”). Available online: https://www.gov.pl/web/nfosigw/rusza-czwarta-edycja-programu-moj-prad-i-nowy-system-rozliczen-dla-prosumentow-to-kolejny-krok-w-kierunku-rozwoju-sektora-fotowoltaiki (accessed on 2 April 2022).
- Malciak, M.; Nowakowska, P. Zmiany w Funkcjonowaniu i Zasadach Rozliczania Fotowoltaiką. Nowa Energ. 2021, 5–6, 81. [Google Scholar]
- The Article “New Rules for Prosumer Settlements from 2022” (In Polish: “Nowe Zasady Rozliczeń Prosumentów od 2022 r.”). Available online: https://www.gov.pl/attachment/47e43da4-8258-4844-b158-77f3f6b607b8 (accessed on 2 April 2022).
- Szymański, B. Instalacje Fotowoltaiczne; GLOBEnergia Sp. z o.o.: Kraków, Poland, 2021. (In Polish) [Google Scholar]
- Map with Insolation in the Town of Występ (Nakło Poviat, Kuyavian-Pomeranian Voivodeship). Available online: https://globalsolaratlas.info/detail?s=53.12169,17.662636&m=site&c=53.12169,17.662636,11 (accessed on 27 August 2022).
- Kała, J.; Soliński, B. Efektywność ekonomiczna funkcjonowania mikroinstalacji fotowoltaicznych wykorzystywanych przez prosumenta. Probl. Drob. Gospod. Rol. 2017, 4, 105–116. [Google Scholar] [CrossRef]
- Michalak, J. Porównanie dyskontowych wskaźników oceny opłacalności ekonomicznej inwestycji na wybranym przykładzie. Pozn. Univ. Technol. Acad. J. 2016, 86, 79–86. [Google Scholar]
- Reports on Monthly Electricity Prices of Polish Power Exchange (In Polish: Raporty Dotyczące Miesięcznych cen za Energię Elektryczną Towarowej Giełdy Energii), Dostępne na. Available online: https://tge.pl/energia-elektryczna-rdn (accessed on 2 September 2022).
- Reports on Hourly Electricity Prices of Polish Power Grids (In Polish: Raporty Dotyczące Godzinowych cen za Energię Elektryczną Polskich Sieci Elektroenergetycznych). Available online: https://www.pse.pl/dane-systemowe/funkcjonowanie-rb/raporty-dobowe-z-funkcjonowania-rb/podstawowe-wskazniki-cenowe-i-kosztowe/rynkowa-cena-energii-elektrycznej-rce (accessed on 2 September 2022).
- Kurz, D.; Nawrowski, R.; Filipiak, M.; Węgrzyn, W. Analiza możliwości zarządzania i rozdziału energii elektrycznej, wyprodukowanej w prosumenckiej instalacji fotowoltaicznej, w budynku z automatyką budynkową. Przegląd Elektrotechniczny 2022, 98/11, 259–264. [Google Scholar] [CrossRef]
- Datasheet of Energy Storage. Available online: https://sunsol.pl/oferta/akumulatory-litowe/fronius/fronius-solar-battery-4-5-kwh/ (accessed on 23 November 2022).


| No. | Name of Device | Quantity | Unit Price [PLN/Unit] | Total Price [PLN] |
|---|---|---|---|---|
| 1. | JA SOLAR JAM60S20-380/MR photovoltaic panel | 14 | 849.00 | 11,886.00 |
| 2. | FRONIUS SYMO HYBRID 5.0-3-S inverter | 1 | 4649.00 | 4649.00 |
| 3. | DC H1Z2Z2-K cable 1 × 4 mm2 | 20 m | 20.50 | 410.00 |
| 4. | AC H07RN-F cable 5 × 2.5 mm2 | 5 m | 8.40 | 42.00 |
| 5. | HAGER SB432PV DC switch-disconnector | 1 | 179.00 | 179.00 |
| 6. | 2600 V DC PHOENIX CONTACT low voltage surge arrester | 2 | 725.00 | 1450.00 |
| 7. | 2 AC VCX-L1-4 class T2 4P low voltage surge arrester | 1 | 138.00 | 138.00 |
| 8. | EATON FAZ-C8/3 8A overcurrent circuit breaker | 1 | 295.00 | 295.00 |
| 9. | Assembly structure for ceramic roof tiles (including rails, clamps) | 1 | 1525.00 | 1525.00 |
| 10. | Assembly service | 1 | 3086.00 | 3086.00 |
| SUM | 23,660.00 |
| System Operation Period [Year] | Decrease in Efficiency of the PV Installation [%/Year] | Production of Electricity from the PV Installation [kWh/Year] | Household Self-Consumption of Electricity [%/Year] | Electricity Used for Investors’ Current Needs [kWh/Year] | Electricity Transmitted to the DSO [kWh/Year] |
|---|---|---|---|---|---|
| 1 | 0 | 5621.00 | 30 | 1686.30 | 3934.70 |
| 2 | 0.55 | 5590.08 | 30 | 1677.03 | 3913.06 |
| 3 | 1.10 | 5559.34 | 30 | 1667.80 | 3891.54 |
| 4 | 1.65 | 5528.76 | 30 | 1658.63 | 3870.13 |
| 5 | 2.20 | 5498.35 | 30 | 1649.51 | 3848.85 |
| 6 | 2.75 | 5468.11 | 30 | 1640.43 | 3827.68 |
| 7 | 3.30 | 5438.04 | 30 | 1631.41 | 3806.63 |
| 8 | 3.85 | 5408.13 | 30 | 1622.44 | 3785.69 |
| 9 | 4.40 | 5378.38 | 30 | 1613.52 | 3764.87 |
| 10 | 4.95 | 5348.80 | 30 | 1604.64 | 3744.16 |
| 11 | 5.50 | 5319.39 | 30 | 1595.82 | 3723.57 |
| 12 | 6.05 | 5290.13 | 30 | 1587.04 | 3703.09 |
| 13 | 6.60 | 5261.03 | 30 | 1578.31 | 3682.72 |
| 14 | 7.15 | 5232.10 | 30 | 1569.63 | 3662.47 |
| 15 | 7.70 | 5203.32 | 30 | 1561.00 | 3642.32 |
| 16 | 8.25 | 5174.70 | 30 | 1552.41 | 3622.29 |
| 17 | 8.80 | 5146.24 | 30 | 1543.87 | 3602.37 |
| 18 | 9.35 | 5117.94 | 30 | 1535.38 | 3582.56 |
| 19 | 9.90 | 5089.79 | 30 | 1526.94 | 3562.85 |
| 20 | 10.45 | 5061.79 | 30 | 1518.54 | 3543.26 |
| 21 | 11.00 | 5033.96 | 30 | 1510.19 | 3523.77 |
| 22 | 11.55 | 5006.27 | 30 | 1501.88 | 3504.39 |
| 23 | 12.10 | 4978.73 | 30 | 1493.62 | 3485.11 |
| 24 | 12.65 | 4951.35 | 30 | 1485.41 | 3465.95 |
| 25 | 13.20 | 4924.12 | 30 | 1477.24 | 3446.88 |
| Month | Percentage of Electricity Produced from a PV Installation over the Year [%] |
|---|---|
| January | 2.94 |
| February | 4.66 |
| March | 8.76 |
| April | 11.85 |
| May | 13.27 |
| June | 13.10 |
| July | 12.73 |
| August | 12.05 |
| September | 9.28 |
| October | 6.31 |
| November | 3.01 |
| December | 2.04 |
| Month | Electricity Sales Price in the First Year of Operation [PLN/MWh] | Electricity Sales Price in the First Year of Operation—Rounded Values [PLN/kWh] |
|---|---|---|
| January | 666.90 | 0.67 |
| February | 525.89 | 0.53 |
| March | 683.59 | 0.68 |
| April | 584.45 | 0.58 |
| May | 662.40 | 0.66 |
| June | 659.29 | 0.66 |
| July | 799.79 | 0.80 |
| August | 1023.42 | 1.02 |
| September | 711.92 | 0.71 |
| October | 467.12 | 0.47 |
| November | 552.40 | 0.55 |
| December | 829.98 | 0.83 |
| Hour | Quarter I | Quarter II | Quarter III | Quarter IV |
|---|---|---|---|---|
| 5:00 | - | - | - | - |
| 6:00 | - | 1.74% | 1.62% | - |
| 7:00 | - | 1.74% | 1.62% | - |
| 8:00 | 1.82% | 3.47% | 3.24% | 1.42% |
| 9:00 | 1.82% | 5.21% | 3.24% | 1.42% |
| 10:00 | 1.82% | 5.21% | 4.87% | 2.84% |
| 11:00 | 3.63% | 5.21% | 4.87% | 2.84% |
| 12:00 | 3.63% | 5.22% | 4.88% | 1.42% |
| 13:00 | 1.82% | 3.47% | 3.24% | 1.42% |
| 14:00 | 1.82% | 3.47% | 3.24% | - |
| 15:00 | - | 1.74% | 1.62% | - |
| 16:00 | - | 1.74% | 1.62% | - |
| 17:00 | - | - | - | - |
| Hour | Quarterly Energy Demand [kWh] | Annual Energy Demand [kWh] | Quarterly Self-Consumption [kWh] | Annual Self-Consumption [kWh] | Quarterly Energy Purchase [kWh] | Annual Energy Purchase [kWh] |
|---|---|---|---|---|---|---|
| 1:00 | - | - | - | - | - | - |
| 2:00 | - | - | - | - | - | - |
| 3:00 | - | - | - | - | - | - |
| 4:00 | - | - | - | - | - | - |
| 5:00 | - | - | - | - | - | - |
| 6:00 | - | - | - | - | - | - |
| 7:00 | 112.5 | 450 | 67.5 | 270 | 45 | 180 |
| 8:00 | 112.5 | 450 | 67.5 | 270 | 45 | 180 |
| 9:00 | 112.5 | 450 | 67.5 | 270 | 45 | 180 |
| 10:00 | 112.5 | 450 | 67.5 | 270 | 45 | 180 |
| 11:00 | 112.5 | 450 | 67.5 | 270 | 45 | 180 |
| 12:00 | - | - | - | - | - | - |
| 13:00 | - | - | - | - | - | - |
| 14:00 | - | - | - | - | - | - |
| 15:00 | - | - | - | - | - | - |
| 16:00 | - | - | - | - | - | - |
| 17:00 | - | - | - | - | - | - |
| 18:00 | 112.5 | 450 | - | - | 112.5 | 450 |
| 19:00 | 112.5 | 450 | - | - | 112.5 | 450 |
| 20:00 | 112.5 | 450 | - | - | 112.5 | 450 |
| 21:00 | 112.5 | 450 | - | - | 112.5 | 450 |
| 22:00 | 112.5 | 450 | - | - | 112.5 | 450 |
| 23:00 | - | - | - | - | - | - |
| 00:00 | - | - | - | - | - | - |
| Hour | Quarterly Energy Demand [kWh] | Annual Energy Demand [kWh] | Quarterly Self-Consumption [kWh] | Annual Self-Consumption [kWh] | Quarterly Energy Purchase [kWh] | Annual Energy Purchase [kWh] |
|---|---|---|---|---|---|---|
| 1:00 | - | - | - | - | - | - |
| 2:00 | - | - | - | - | - | - |
| 3:00 | - | - | - | - | - | - |
| 4:00 | - | - | - | - | - | - |
| 5:00 | - | - | - | - | - | - |
| 6:00 | - | - | - | - | - | - |
| 7:00 | - | - | - | - | - | - |
| 8:00 | 112.5 | 450 | 67.5 | 270 | 45 | 180 |
| 9:00 | 112.5 | 450 | 67.5 | 270 | 45 | 180 |
| 10:00 | 112.5 | 450 | 67.5 | 270 | 45 | 180 |
| 11:00 | 112.5 | 450 | 67.5 | 270 | 45 | 180 |
| 12:00 | 112.5 | 450 | 67.5 | 270 | 45 | 180 |
| 13:00 | - | - | - | - | - | - |
| 14:00 | - | - | - | - | - | - |
| 15:00 | - | - | - | - | - | - |
| 16:00 | - | - | - | - | - | - |
| 17:00 | - | - | - | - | - | - |
| 18:00 | 112.5 | 450 | - | - | 112.5 | 450 |
| 19:00 | 112.5 | 450 | - | - | 112.5 | 450 |
| 20:00 | 112.5 | 450 | - | - | 112.5 | 450 |
| 21:00 | 112.5 | 450 | - | - | 112.5 | 450 |
| 22:00 | 112.5 | 450 | - | - | 112.5 | 450 |
| 23:00 | - | - | - | - | - | - |
| 00:00 | - | - | - | - | - | - |
| Hour | Quarter I | Quarter II | Quarter III | Quarter IV |
|---|---|---|---|---|
| [PLN/MWh] | [PLN/MWh] | [PLN/MWh] | [PLN/MWh] | |
| 1:00 | 546.38 | 683.83 | 842.80 | 446.04 |
| 2:00 | 511.98 | 617.66 | 755.99 | 422.00 |
| 3:00 | 500.97 | 600.39 | 743.52 | 396.80 |
| 4:00 | 496.70 | 600.10 | 752.52 | 394.75 |
| 5:00 | 513.09 | 613.91 | 753.24 | 411.73 |
| 6:00 | 536.11 | 637.96 | 746.96 | 450.88 |
| 7:00 | 643.30 | 702.41 | 907.23 | 569.74 |
| 8:00 | 620.05 | 714.34 | 824.08 | 573.12 |
| 9:00 | 685.26 | 741.48 | 872.76 | 690.52 |
| 10:00 | 699.20 | 687.44 | 739.17 | 695.57 |
| 11:00 | 660.95 | 618.10 | 668.33 | 635.02 |
| 12:00 | 671.87 | 577.61 | 653.84 | 631.72 |
| 13:00 | 655.52 | 550.02 | 655.05 | 616.69 |
| 14:00 | 673.49 | 512.17 | 628.49 | 627.00 |
| 15:00 | 679.97 | 501.40 | 616.36 | 607.79 |
| 16:00 | 727.51 | 523.94 | 643.94 | 621.72 |
| 17:00 | 855.21 | 558.58 | 669.26 | 682.84 |
| 18:00 | 985.29 | 643.85 | 750.07 | 711.27 |
| 19:00 | 1007.80 | 732.84 | 945.98 | 654.25 |
| 20:00 | 988.02 | 854.52 | 1224.74 | 636.84 |
| 21:00 | 872.85 | 938.82 | 1277.74 | 556.11 |
| 22:00 | 672.90 | 872.96 | 1201.73 | 448.71 |
| 23:00 | 657.43 | 837.20 | 1137.76 | 499.24 |
| 00:00 | 546.55 | 718.70 | 885.08 | 438.29 |
| Self-Consumption [%] | The Principle of Accounting for Energy | NPV after 25 Years of Operation [PLN] | Payback Time [Year] |
|---|---|---|---|
| 30 | Rebate | 15,135.20 | 10 |
| Monthly price | −2605.03 | >25 | |
| Hourly price | −7258.59 | >25 | |
| 50 | Rebate | 15,437.19 | 10 |
| Monthly price | 6849.34 | 14 | |
| Hourly price | 1777.41 | 21 | |
| Hourly price + energy storage | 3075.63 | 21 | |
| 60 | Rebate | 15,459.56 | 10 |
| Monthly price | 11,576.53 | 11 | |
| Hourly price | 5953.77 | 15 |
Disclaimer/Publisher’s Note: The statements, opinions and data contained in all publications are solely those of the individual author(s) and contributor(s) and not of MDPI and/or the editor(s). MDPI and/or the editor(s) disclaim responsibility for any injury to people or property resulting from any ideas, methods, instructions or products referred to in the content. |
© 2023 by the authors. Licensee MDPI, Basel, Switzerland. This article is an open access article distributed under the terms and conditions of the Creative Commons Attribution (CC BY) license (https://creativecommons.org/licenses/by/4.0/).
Share and Cite
Kurz, D.; Nowak, A. Analysis of the Impact of the Level of Self-Consumption of Electricity from a Prosumer Photovoltaic Installation on Its Profitability under Different Energy Billing Scenarios in Poland. Energies 2023, 16, 946. https://doi.org/10.3390/en16020946
Kurz D, Nowak A. Analysis of the Impact of the Level of Self-Consumption of Electricity from a Prosumer Photovoltaic Installation on Its Profitability under Different Energy Billing Scenarios in Poland. Energies. 2023; 16(2):946. https://doi.org/10.3390/en16020946
Chicago/Turabian StyleKurz, Dariusz, and Agata Nowak. 2023. "Analysis of the Impact of the Level of Self-Consumption of Electricity from a Prosumer Photovoltaic Installation on Its Profitability under Different Energy Billing Scenarios in Poland" Energies 16, no. 2: 946. https://doi.org/10.3390/en16020946
APA StyleKurz, D., & Nowak, A. (2023). Analysis of the Impact of the Level of Self-Consumption of Electricity from a Prosumer Photovoltaic Installation on Its Profitability under Different Energy Billing Scenarios in Poland. Energies, 16(2), 946. https://doi.org/10.3390/en16020946