Abstract
The generation from renewable sources has increased significantly worldwide, mainly driven by the need to reduce the global emissions of greenhouse gases, decelerate climate changes, and meet the environmental, social, and governance agenda (ESG). The main characteristics of variable renewable energy (VRE) are the stochastic nature, its seasonal aspects, spatial and time correlations, and the high variability in a short period, increasing the complexity of modeling, planning, operating, and the commercial aspects of the power systems. The research on the complementarity and dependence aspects of VREs is gaining importance, given the development of hybrid generation systems and an array of VREs generators spread over a large region, which could be compounded by different renewable sources, such as hydro, solar, and wind. This review is based on a systematic literature review, providing a comprehensive overview of studies that investigated applied methodologies and methods to address dependence and complementarity. It is a recent field of interest, as 60% of the articles were published in the last five years, a set of methods that have been employed to address this issue, from conventional statistics methods to artificial intelligence. The copulas technique appears as an important approach to modeling renewable energy interdependence. There is a gap in articles comparing the accuracy of the methods employed and the computational efforts.
1. Introduction
The energy generation from renewable sources has increased significantly around the world mainly driven by the need to reduce the global emissions of greenhouse gases, decelerate climate changes, and meet the environmental, social, and governance agenda (ESG). Companies and countries are being pressured to to implement sustainable actions to comply with a set of established goals, as renewable energy development performs an essential role in the green economy [1]. The International Energy Agency (IEA) report, Renewable Energy Market Update—Outlook for 2021 and 2022 [2] pointed out that renewable capacity additions increased 45%, reaching almost 280 GW, the highest year-on-year increase since 2019. The renewable sources supported 90% of global power capacity expansion and, the figures related to solar photovoltaic (PV) development, which should reach 162 GW by 2022, are remarkable. The wind capacity additions grew more than 90% in 2020, adding over 114 GW to the world installed capacity. Although the pace of wind capacity growth is decreasing in 2021 and 2022, the expected growth capacity is still 50% higher than the 2017–2019 average.
The extensive insertion of variable renewable energy (VRE) worldwide is expanding the complexity of modeling, planning, operating, and the commercial aspects of the power systems. It is important to notice that the insertion of VRE is growing through large wind and solar PV plants and also through distributed small generators, requiring different ways to integrate them into the existing systems. Considering the fast growth of VREs, the question “is a large-scale transformation of the world’s energy systems feasible?” was raised and discussed in [3,4], and it is being addressed to accommodate this transformation. The complexity of dealing with VRE is mainly related to the stochastic nature of the generation, its seasonal aspects, spatial and time dependence, high variability in a short period of time, and the data availability [5]. Previously, only a few countries, with a considerable amount of hydro installed capacity (such as Brazil, Canada, Norway, USA, etc.) were dealing with some of these aspects related to the stochastic modeling of inflows and hydro-thermal scheduling optimization [6,7,8].
There is a set of studies engaged with measuring the impacts and proposing solutions for renewable sources penetration into power systems, from the expansion planning perspective to real-time operation [9]. In the late 1980s, a planning model approach was proposed in [10], introducing VREs alongside the conventional generation, and analyzing the impacts and results for both short-term and long-term studies. Following the same line of research, the paper [11] evaluated the potential contribution of VREs for energy supply security in Latin America, considering seasonality, variability, and complementarity. A more recent study from 2022 [12], applied to the Brazilian power system [13] came up with a new hierarchical modeling framework, taking into account the VREs expansion and integrating two electricity planning optimization models, one model focused on a theory-based portfolio dealing with the trade-off between security of supply and expected cost of supply, while the other one is a deterministic least-cost model aiming at examining the amount of electricity produced by each generation technology. On the operating side, new paradigms are emerging to deal with the generation mix, such as the smart-grid, energy storage system, micro-grid, demand-side management, etc. [14]. Extensive literature can be found addressing the impact of VREs on power systems dynamic and stability [15], power losses [16] and voltage stability [17]. The work [18] focuses on how the high penetration of VREs is leading to changes in the optimization models and providing insights on these changes, most of them to fulfill the requirements related to time resolution, to deal strategically and flexibly with short-term operation constraints to work with key input parameters, uncertainty analysis, etc. In the article [19], the principles for modeling able to deal with operational uncertainty are presented, and they address the problem related to the integration of stochastic generation.
As aforementioned, one of the complexities that must be addressed in this novel power system framework is the stochastic nature of VREs. The forecasting models could be used as an effective tool to address this issue and act to mitigate uncertainties, which is essential to perform the planning and power system operation [20,21,22]. There are diversified techniques applied to VREs generation forecasting, which should be employed according to specific purposes and time horizons. The main approaches found in the literature are physical methods, statistical techniques, probabilistic methods, and intelligent forecasting methods [23].
Another important aspect of VREs is that they are driven by weather and climate phenomena and could present significant spatial and time dependence. The features of VREs complementarity must be well investigated given the tendency of developing of hybrid generation systems with an array of VREs generators spread over a large region, which could be compounded by different renewable sources, such as hydro, solar, and wind. Although the number of articles examining the dependence and complementarity has been growing in recent years, this field is a point of attention due to the early stage of VREs development. In [24], published in 1978, the authors analyze how the spatial dependence among different wind farms geographically dispersed could aggregate reliability for the power system. Even in the beginning of the development, during the eighties, the interdependence between the load and generation from VREs (wind, solar PV, and hydro run-of-river) were investigated as both, load and generation, are influenced by weather variables [25,26,27]. The cross-dependence between different VREs sources is an essential field to be addressed, the full understanding of how the VREs could work together, and how to forecast the generation, taking into account that these dependencies would improve all analyses related to the power systems planning, operation, portfolio analysis, and commercial decisions. In [28,29,30], published during the first decade of the 2000s, the complementarity in a hybrid system, compounded by wind and hydro plants, was investigated. The literature related to renewable energy is increasing following the installed growth capacity; the articles are addressing all aspects of this massive insertion. The recent paper [31], published in 2021, aimed at creating a schematic database and analyzing statistically, the overall trend of the most relevant articles on the topic of PV-wind hybrid renewable systems, by considering 550 recently published scientific articles.
The relevance of all themes related to renewable energy is evident and crucial for the power industry to address the aspects related to the generation uncertainty of VREs. The main objective of this work is to compare and summarize the theories, methodologies, and main outcomes of the academic literature that were focused on modeling and simulating the VREs generation, taking into account the spatial and temporal dependencies among different renewable generation sources. To reach this objective, a systematic literature review (SLR) was carried out.
This review is structured into 4 sections. Section 2 brings a systematic bibliographic review methodology, the main steps developed to execute the literature review, and the main outcomes. Section 3 presents the most relevant approaches and developments related to VREs sources generation forecasting and scenario simulation, considering the uncertainty of weather-dependent sources and the spatial and temporal correlation between them. Section 4 summarizes the review and presents potential future research directions.
2. Systematic Literature Review Methodology
The bibliographic review is the groundwork for solid academic activity development. In [32], we can find the typology of literature reviews, the steps in conducting it, and recommendations on how to implement a systematic literature review. In [33], the authors propose a step-by-step method to conduct a systematic literature review in operation management, and an application of this methodology is presented in [34]. Based on the concepts and criteria cited previously in this section, this systematic literature review was conducted; Figure 1 shows the main steps of SLR.
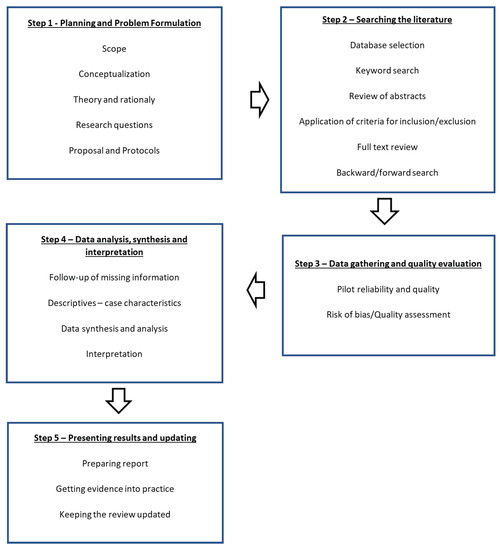
Figure 1.
Main steps to conducted a systematic literature review (adapted from [33]).
The objective of this section is to detail each step developed during this work.
2.1. Systematic Literature Review Planning and Main Results
According to what is proposed in [33], the planning and problem formulation step should cover a set of initial requirements. One of these initial requirements is the scope, which must be clearly defined; to fulfill this objective, we applied Cooper’s taxonomy as described in [35]. Table 1 contains categories and characteristics of taxonomy applied to this review also.

Table 1.
Categories and Characteristics according to Coopers’ taxonomy.
Table 1.
Categories and Characteristics according to Coopers’ taxonomy.
| Categories | Characteristics | Observations |
|---|---|---|
| Focus | Research Outcomes Research Methods Theories Applications | It is the main interest of the author. To develop the research topic a broad conception of what is known about the topic and potential areas in which knowledge may be needed, as stated in [36]. |
| Goals | Synthesize Identification of Central Issues | The reviewer main objective. The topic related to theories and rationale should be developed, in [37] the main questions were presented: ‘What will be analyzed and why?’ and ‘Which theories apply?’ |
| Perspective | Neutral | The relevant works will be presented allocating attention to different theories, methods, issues, or outcomes that reflect their relative prominence in the literature. |
| Coverage | Exhaustive with selective citation | Applied efforts to include most of the literature search results, but with selective citation. |
| Organization | Methodological | The article will be organized following these criteria. Research questions are an important step and will be elaborated following the requirements described in [38]: context, mechanisms, and outcomes. The proposal/protocol poses a framework that should be developed prior to the literature search, including leastwise the research topic and questions. |
| Audience | Specialized researchers | The intended audience of the paper. |
To accomplish the main objective of this paper, the following research questions should be answered:
- Which are the most influential articles in renewable energy generation scenarios and/or forecast considering different sources of complementarity or dependence?
- Which are the main themes in renewable energy generation scenarios and/or forecasting considering different sources of complementarity or dependence and how did they progress?
- Which are the main methodologies used to approach the subject: renewable energy generation scenarios and/or forecast considering different sources of complementarity or dependence?
- What are the major still unresolved shortcomings?
The literature search and evaluation is part of the second step presented by [33]; to accomplish it, is necessary to select the database, define the keywords search, review the articles’ abstract, specify criteria for inclusion/exclusion, full-text review, and backward/forward search. The databases Scopus and Web of Science (WoS) were selected due to the number of abstract and citation databases of research literature that can be accessed through these databases.
The selection of the keywords must be done carefully, as pointed out by [39]. The objective is to bring only studies correlated to the topic without artificially restricting the number of articles. The initial search, considering certain fields—article title, abstract, and keywords—was performed using the following keywords: “renewable energy generation” and “correlation”. Additional filters were used, aiming to select the most valuable documents, as document type (articles and reviews) and language (English). This search resulted in 729 documents in Scopus and 395 in the Web of Science database. In order to mitigate the artificial restriction risk in the document search and guarantee a broad search, we expanded the investigation using some synonyms; Table 2 shows how this phase was conducted.
Table 2.
Documents search results.
The prior analyses of the outcomes from the search shown at Table 2 were used to decide the first set of articles that was the raw material for this review. The analyses were based on articles’ titles, subjects area, and some abstracts. The results from search S 04 were selected; given that the Scopus database presented a greater number of articles, it was the main database to develop this article. Others actions to select the articles were executed, pursuing the objective stated before: bring only studies correlated to the topic without artificially restricting the search.
The next step was to perform the basic statistical analyses of the selected database; the results from this step will provide a big picture of the research theme. The package Bibliometrix, built in R, [40] and Biblioshiny app, a web interface for Bibliometrix, were used. The Scopus’ analysis results were employed to pursue a comprehensive bibliometric analysis.
The articles selected were linked to 24 areas of knowledge. Approximately 65% of the articles were classified in energy, engineering and environmental science; some areas of the knowledge were not expected to be part of the results, such as psychology, pharmacology, toxicology and pharmaceutics, arts and humanities, medicine, etc. It is important to notice that some documents were classified in more than one field; therefore, excluding some of them without, at least, shallow analysis of the articles could disregard valuable papers. After this review, the work database was reduced to 14 areas of knowledge, 818 articles, 2547 authors, and 246 sources. A little deeper analysis of the titles and abstracts shrank the set of documents to 210, totaling 193 articles and 17 reviews, 77 sources, 705 authors, and 9035 references. The work database was enriched with additional articles and reviews, selected based on the back/forward analysis of references. The new set of documents has 244 comprising 218 articles and 26 reviews, a deeper analysis will be performed within this set.
Figure 2 shows the annual scientific production, from 1963 to 2022, and it is possible to notice the correlation with renewable energy addition evolution into the power systems. The production achieved its peak in 2021 with 38 articles, and in 2022 this number already reached 32. In the first paper of this review, published in 1963 [41], the author presented a method for interrelating the total energy requirements, annual energy sales by classes, and annual peak loads as a possible basis for improving the timing generating capacity additions. Published in 1978 [24], it is the first work in the set of articles addressing issues related to renewable energy generation; the author discussed the reliability benefit of geographically dispersed wind generation due to the spatial correlation with the sites. The last article, available online in May 2022 [42], presented a case study from China for a multi-objective generation scheduling considering a hydro-solar-wind power system; a trapezoidal fuzzy number was established to deal with renewable uncertainties.
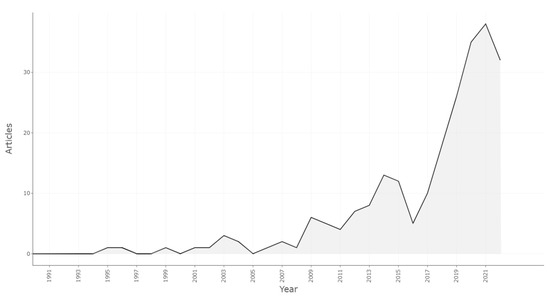
Figure 2.
Annual scientific production evolution (by Biblioshiny for bibliometrix [40]).
2.2. Bibliometric Evaluation
In this section, some bibliometric analyses were performed aiming at constructing key indicators about scientific research evolution. In [43], it is demonstrated how the structural analysis and research performance assessment outcomes, related to a research field, can be improved through a combination of elements into an integrated analysis. To achieve this objective, two procedures need to be executed: performance analysis and science mapping. The performance analysis as introduced in [44] has the objective of evaluating groups of scientific players (countries, universities, departments, and researchers) and activities impact based on bibliographic data. The science mapping, employed to represent the cognitive structure, shows the structural and dynamic aspects of scientific research. For this purpose, three kinds of analysis were carried out: citation, co-citation, and co-word.
2.2.1. Document Analysis
Identifying the impact and the quality of a paper is a very important step during scientific research. The citation analysis is one of the tools that could be used to reach this objective, grounded on the number of times that the author and/or the articles were cited in the literature regarding the research field.
A significant outcome during the citation analysis is the identification of the prolific authors and important papers. Figure 3 shows the 10 most cited documents and their respective authors.
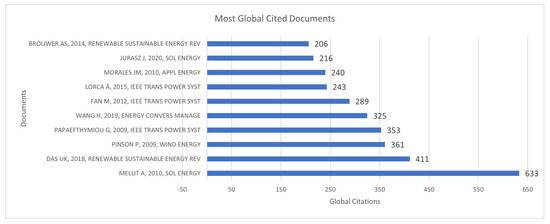
Figure 3.
Most cited documents (by Biblioshiny for bibliometrix [40]).
The most cited document, published in 2010, by Mellit and Pavan [45] proposed a method for solar irradiance forecast using an artificial neural network (ANN), taking into account the importance of planning the operations of power plants. Another interesting outcome is that two of the five first most cited documents are reviews, one related to photovoltaic power generation forecasting and model optimization [46], and the other one pursuing the objective of giving a comprehensive and extensive review of renewable energy forecasting methods based on deep learning [21].
2.2.2. Author Analysis
As mentioned before the set of articles selected adds up to 224, these research works addressed, in some way, scientific accomplishments in the field of renewable energy, more specifically related to forecasting, generation scenarios and how to describe the time and spatial correlation between different sources and their impacts. Table 3 summarizes the main figures related to the authors’ collaboration.
Table 3.
Authors collaboration.
Figure 4 shows the most relevant authors’ production over time from 2012 to 2022. The red line means the author’s timeline. The first author in the figure is Wang C., with eight published papers, from 2018 to 2022, half of them during 2020. The articles addressed the following fields: temporal correlation of short-term wind power forecast, short-term operation of the hybrid system, analytical method for probabilistic load flow, correlated synthetic time series generation using Fourier and ARMA signal processing, solar radiation forecast based on the structural equation, locational marginal pricing, risk assessment of park-level integrated energy system considering uncertainty and dynamic correlation of energy price. The authors Liu Y. and Liu J. presented the most protracted timeline among other authors, but with a gap in production during the years. The bubble size is related to the number of documents published during the years.
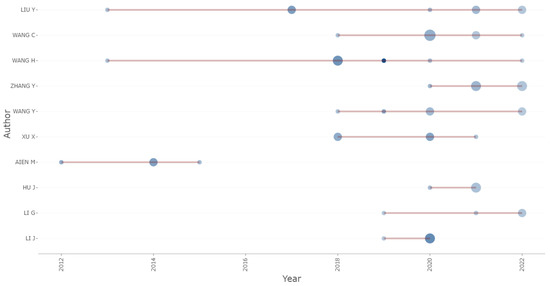
Figure 4.
Top 10 most relevant authors’ production from 2012 to 2022 (red line: the author’s timeline, bubble size: the number of publications, bubble color intensity: total citations per year (by Biblioshiny for bibliometrix).
The total citations per year is represented by the bubble color intensity. Wang H. is the author with the most cited publications, during 2018 and 2019.
2.2.3. Source Analysis
The selected articles were distributed into 86 sources. A previous conclusion is that we have a spread-out database. However, 69% of the articles were concentrated in the top 20 sources, and the top 10 account for 50%. Figure 5 presents the most relevant sources: Applied Energy represents 9%, followed by Renewable and Sustainable Energy Reviews with 7%.
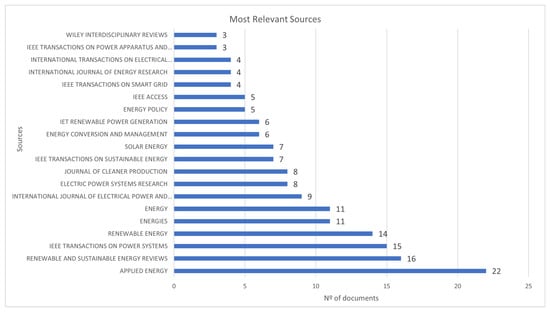
Figure 5.
Most relevant sources (by Biblioshiny for bibliometrix).
Figure 6 brings the top 10 most cited sources, the three first journals are IEEE Transactions on Power Systems, Applied Energy, and Renewable and Sustainable Energy Reviews. Figure 7 displays the h-index; this index is used to compare the productivity and impact of the sources. Renewable and Sustainable Energy Reviews, Applied Energy, and IEEE Transactions on Power Systems are the sources with the highest index.
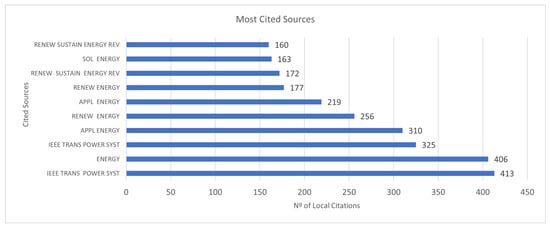
Figure 6.
Top 10 most relevant sources by the number of documents published (by Biblioshiny for bibliometrix).
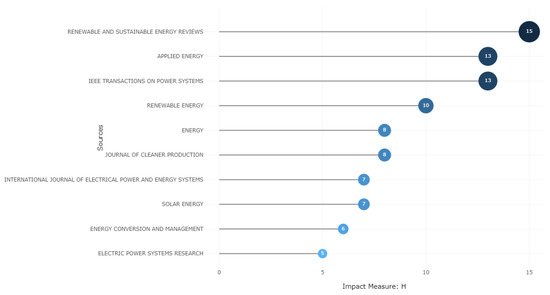
Figure 7.
H-index for the first 10 sources (by Biblioshiny for bibliometrix).
2.2.4. Countries Analysis
The objective of this section is to identify which countries are leading the research on renewable energy correlated scenario generation; the 224 documents related to this field were distributed among 42 countries. The top ten countries by scientific production are led by China, followed by the USA, Iran, Italy, Denmark, Germany, Brazil, India, the United Kingdom, and Portugal. Figure 8 shows the global distribution. China is also the most cited country in the articles under this review. Figure 9 maps the scientific collaboration between countries; China and USA, first and second in numbers of scientific production in this field, show up as the most collaborative countries.
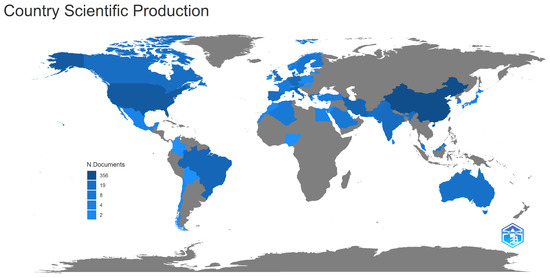
Figure 8.
Scientific production by country (by Biblioshiny for bibliometrix).
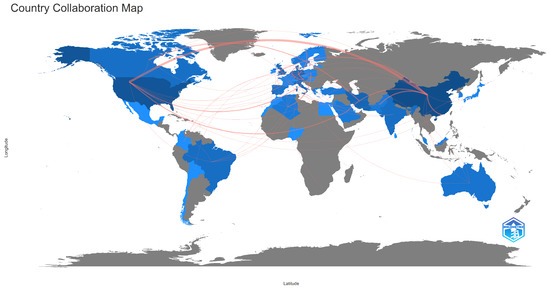
Figure 9.
Country collaboration map (by Biblioshiny for bibliometrix).
Figure 10 demonstrates the top 20 countries ordered according to their scientific productions. The red bar corresponds to publications rate in the author’s country when there is also a foreign co-author (MCP—multiple countries publication). The blue bar represents single country publications (SCP).
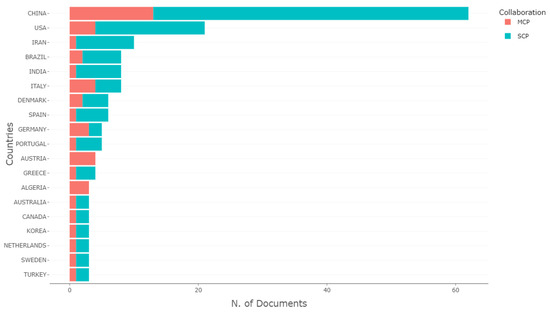
Figure 10.
Top 10 corresponding author’s country (red line: multiple countries publication (MCP), blue line, single country publication (SCP)) (by Biblioshiny for bibliometrix).
The top five countries are China, the USA, Iran, Brazil and India, totaling 82 articles (37% of total). China with 45, the USA with 15, and Iran with 9 publications are the top three most relevant countries. China has by far the most international collaborations.
2.2.5. Topics Analysis
The purpose of this analysis is to identify the main topics related to renewable energy correlated scenario generation; to achieve these objectives, keyword networks were employed. The co-occurrences among the document’s dataset are represented by keywords networks. Using the Bibliometrix software, a thematic map was plotted. This map is capable of representing each theme by clustering the keywords network. Centrality and density show the theme importance and theme improvement in the research area. The bubble size is relative to the cluster word occurrences, and its position depends on the cluster centrality and density. Therefore, highly developed and isolated themes are on the top left, motor themes are on the top right, emerging or declining themes are on the bottom left, and primary and transversal themes are on the bottom right of the thematic topic map. The thematic map analysis, Figure 11, shows that the solar energy/alternative energy keywords theme is the most important theme with the highest centrality, the themes related to solar power generation forecasting and stochastic system placed at the bottom left of the map could be classified as emerging themes.
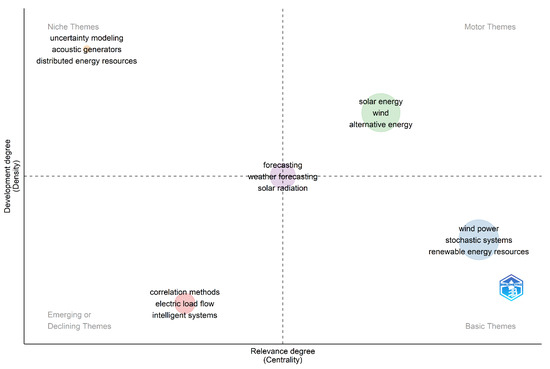
Figure 11.
Thematic map of keywords network clusters (bubble size: the clusters word occurrences). (by Biblioshiny for bibliometrix).
3. Main Methodologies to Address Renewable Energy Stochastic Characteristics and Complementarity Aspects
The main objective of this section is to present the most relevant approaches and developments related to VREs sources generation forecasting and scenario simulation, considering the uncertainty of weather-dependent sources and the spatial and temporal dependence between them.
The modeling process for VREs, considering simplified assumptions, such as variables independence, normal distribution or another kind of simplification, can significantly impact the model’s accuracy and effectiveness of the analysis. Therefore, it is essential to consider the stochastic dependence among the VREs, mainly for a power system with a high penetration of renewable generation sources.
A meaningful way to improve the processes related to power systems, from expansion planning to short-term operation decisions, as well as the decision-making processes associated with commercial aspects and risk management, is to take into account the stochastic nature of renewable energy sources and represent the interdependence among them [22]. One very significant step in this approach is to measure this interdependence. The improvements in these processes must be related to the objectives pursued. For short-term operation decisions, the goal is the load curve attendance. For medium- and long-term operation or expansion planning, the main objective is to guarantee the energetic balance. The literature presents a diversity of methodologies, methods, and processes to address the uncertainty problem, from deterministic forecasts to a scenario generation approach, considering only one source or a hybrid system supplied by different sources. The following sections of this work bring more details about these approaches.
First, it is worth introducing a general definition of energy complementarity and a description of how it is approached in the literature related to VREs. The work [47] presents a clear definition of the complementarity concept, detailing the three types of correlation: spatial, temporal, and spatio-temporal. The forms of complementarity are described below:
- Spatial—Renewable energy spread out geographically, using the same natural resource or not, could present this kind of correlation, where the shortage of the generation in one region could be compensated by a generation from another VRE, benefiting the power system if there is enough transmission capacity to transfer energy from one region to another, assuring the demand attendance.
- Temporal—Also could be noticed in VREs sharing the same natural resource or not and installed in the same region. The main characteristic of this complementarity is related to the time domain. The seasonal effect is a good example of temporal complementarity, such as the annual pattern of wind and solar generation, comparing their performance in the spring-summer period and autumn-winter period
- Spatio-temporal—As the correlations described before, it could be perceived in a single or multivariate source. In this case VREs present, simultaneously, complementarity related to spatial and time domains.
Improving the modeling of VREs complementarity is the key to better developing the activities of planning and operating the power system, assuring secure levels of demand attendance and system reliability.
The first step to develop models for forecasting and scenario generation, considering the complementarity among VREs, is to identify and measure the interdependence. A variety of metrics have been used to evaluate it, and the most common methods found during this review are Pearson’s coefficient, Spearman’s coefficient and Kendall’s tau () rank correlation coefficient.
One of the most used techniques to measure the dependence relationship between two randomly distributed variables is a Pearson’s coefficient correlation, and it can be found in a great number of papers addressing the complementarity aspects. Pearson’s correlation coefficient is a metric that directly measures how variables are linearly related, but it is not able to describe the non-linear dependence, limiting its use.
Spearman’s rank correlation coefficient is a non-parametric measure used to estimate rank dependence. The Spearman’s correlation between two variables is equal to a Pearson’s correlation applied to the variables’ ranks. While Pearson’s correlation captures only the linear dependence between two variables, Spearman’s correlation is able to evaluate the linear and no-linear dependence. It is important to notice the need to transform both variables by their univariate marginal cumulative distribution functions (CDF), in order to estimate the Pearson correlation coefficient for the transformed variables.
Proposed by Kendall [48] to address the problem of comparing two different rankings of the same set of individuals, in the psychology field, Kendall’s Tau () is a non-parametric measure, used to evaluate the ordinal dependence among two sets of random variables. The Kendall’s Tau () coefficient will reach the highest value when observations have a similar rank (correlation of 1); on the other hand, the coefficient will reach the lowest value when observations are not similar (correlation of −1).
3.1. Forecasting Models and Scenario Generation Applied to Renewable Energy Generation
Forecasting activities are crucial to deal with the uncertainties inherent in all activities in the power industry, mainly related to planning, operating, commercial, and risk management decisions. Adequate forecasting methods and/or scenario simulation provide knowledge, making it possible to foresee possible outcomes and give more time to act, optimizing results and/or mitigating risks. The first developments in this field were related to the load forecast and power system expansion planning; works dated from the 1950s, 1960s, and 1970s show the importance of addressing this theme in the power system activities [41,49,50,51,52,53].
Although a significant evolution in the methodologies and models to address the forecast and uncertainties issues in the power industry can be noticed during the years. The accelerated high penetration of intermittent sources, in a short period, is moving the level of uncertainty on the generation side to another level, as well as the need for more robust forecasting and simulation techniques. Consequently, new improvements in forecasting and scenario generation methods and other forms to deal with the VREs’ generation uncertainty have shifted from attractive improvements to mandatory necessities.
There are several methods and approaches, developed and under development, in the forecast and scenarios simulation fields, and choosing the best, that fits the pursued objective, is not a trivial task for the researchers. This choice must be made according to the problem to be addressed, the availability and data quality, objectives, and expected outcomes.
In order to organize the main ideas, methods, objectives, and other characteristics, there are some classifications and divisions proposed in the literature; however, sometimes there can exist more than one way to classify or divide one subject. In fact, when there is a convergence in the classification, it acts as a good guideline for the researchers. Following this idea, the work [54] presented a time-scale classification (see Table 4) in order to classify the forecasting methods related to wind generation, this time-scale was a result of the combination of the following works [55,56,57]. The work [58] provides a review focused on different approaches for addressing the stochastical characteristic of renewable power generation from a power system operator’s point of view; an interesting diagram of various methods of stochastic analysis of renewable energy sources is presented.
Table 4.
Time-scale classification, adapted from [54].
In this review, we are interested in investigating the developments related to all time-scale classification and the methodologies that consider the dependence between variables.
The technical approach to selecting the method that fulfills the requirements desired should take into account the context, the relevance and availability of historical data, the degree of accuracy, the horizon to be forecast, and the time availability to execute the analysis. Beyond time-scale classification and forecasting methods presented before, there are other ways to classify the forecasting methods as either parametric or non-parametric, physical methods, and the forecast technique type as point forecast, probabilistic forecast, quantile forecast, forecast interval, density forecast, and scenario forecast.
The next sections will present the main approaches available in the literature to address the issue related to VREs forecasting and scenario generation considering the complementarity aspects. Table 5 shows the most used methodologies and some characteristics related to them.
Table 5.
Most-used methodologies—main characteristics.
3.1.1. Methods Based on Numerical Weather Prediction (Physical Methods)
The physical forecasting methods, more used for ultra-short-term and short-term horizons, do not require historical generation data and are based on lower atmosphere forecasting and numerical weather predictions (NWP), considering physical parameters such as wind speed, temperature, atmospheric pressure, surface roughness, etc. Taking into account that the forecasting for each renewable power plant, independent of the source (wind or solar), will be based on the same numerical weather prediction, the results will be correlated. Although the NWP could bring accuracy to the forecast, there is a high cost involved mainly related to the acquisition and processing of the physical data. The article [59] presented a comparison of three physical models applied to photovoltaic generation, the methodology was based on three different types of input, date and time of the measurements to determine the position of the sun, the meteorological conditions (ambient temperature, wind speed, and solar irradiance) and the characteristics of the PV panel. Published in 2021, the work [60] presented an extensive comparison of power forecasting models based on NWP for photovoltaic energy, for intraday and day-ahead time horizons, and data with 15 min resolution, 32,400 possible combinations of physical model chain variants were compared and verified for deterministic power forecasting in Hungary. A recent work [61] applied to PV plants located in Hungary, compared 24 power deterministic forecasting models, based on NWP, with a day-ahead horizon. The main outcomes of this article are the comparison of the accuracy of the tested models and the importance of data selection compared to model selection. In addition, the tuning of hyperparameters related to machine learning models is crucial to extract the full potential of the model, and the best results obtained by tested models presented root mean square error (RMSE) 13.9% lower than the simplest solution, based on linear regression.
3.1.2. Methods Based on Copulas Approach
Copulas are mathematical objects, and the essence of the copula approach is that a joint distribution of random variables could be expressed as a function of their marginal distribution, in other words, it could be defined as a multivariate distribution function with uniform marginals. One of the most interesting characteristic of copulas is that any multivariate distribution function is equal to for some copula C, where are univariate marginals. The copulas methodology introduces an efficient way to model and perceive the dependence structure [62].
The use of copulas has received a lot of attention in the problems of modeling stochastic dependence among renewable sources, either to address the spatial correlation between plants fueled by the same renewable resource, geographically distributed or to capture the interdependence between different sources, geographically distributed or not. Additionally, works can be found in the literature that address the correlation among renewable generation and load, owing to both being affected by weather conditions.
Wind Generation Spatial Complementarity
A very important step to use copulas is to select a copula family that is most suitable to model the desired dependency structure. The work [63] evaluated several Archimedean and elliptical copula families for their fit to model wind power dependency structures, and according to the authors the most important outcome of this article is related to the use of the Gaussian copula to model wind power dependency. They believe that the Gambel copula is preferred. The article [64] also proposed a process to evaluate different possible copula families and select the most suitable one for modeling the multi-dimensional dependencies among VREs; in fact, the complete approach comprises first creating vine structures. Vine structures are visualized by trees, including nodes and edges, representing uni-variate variables and bi-variate copulas, respectively. The following step is to create a pair Copula decomposition, and the last step is to select the most suitable. This proposed approach was applied to a numerical study to evaluate the effectiveness of the proposed model.
Published in 2009 [65], this article presents the basic theory related to the use of the Gaussian copula to model stochastic dependence between geographically distributed wind parks, and a case study of wind power integration in the Netherlands was presented.
A methodology to model and simulate the clustered wind power considering its spatio-temporal correlations using the theory of copula was presented in [66], two case studies were carried out in order to simulate the proposed methodology, and the model results were compared to autoregressive-moving average model (ARMA) and Markov chain, the proposed model show more capability to capture the nonlinear correlation.
The articles [67,68] presented discussions about the correlation and tail dependence coefficients related to wind speed modeling, the student-T copula function was used for the wind speed scenario generation and the results showed that it was more accurate than conventional wind speed scenario construction methods, which are not able to model tail dependence.
In [69] the authors proposed a methodology to simulate wind generation related to large-scale wind bases, geographically spread out. The method could be divided into three steps, the first step consists of dividing the wind plants into clusters using GA-Kmeans. The copula principle was used to describe the correlation characteristic among wind farm clusters. Finally, the power output scenarios are simulated by the Markov chain Monte Carlo (MCMC) method. This methodology was applied to the Yalong River basin, in China, which is rich in wind energy and solar energy resource.
Wind and Hydro Generation Complementarity
The diversification of the source of energy, such as mixed hydro and wind portfolio, can bring a lot of benefits to the power system. Hydro plants could minimize the effect of the intermittence of wind generation in the short-term, and wind generation could reduce the risk of energy deficit due to droughts. In [30] the authors examined whether the risk level of a mixed hydro-and-wind portfolio of generating assets improves the risk of an all-hydro portfolio, by relaxing the dependence on water inflows and attenuating the impact of droughts in Québec. The study focused on the long-term and investigated the uncertainty in annual energy inflow. The dependence of hydro and wind energy inflows was modeled via copulas, where different families of copulas were used to model this dependence. The T copula presented the best results for all data available and for the data related to the low inflows period. The Gaussian copula fitted better to high inflows period data.
Applied to the Brazilian power system, the works [70,71] evaluated the potential integration of wind farms and hydroelectric assets by exploring the spatial correlation of hydrology and wind regimes in different regions. An entropy–copula-based model for the joint simulation of monthly streamflow and wind speed time series was employed to achieve the proposed objective. The proposed model presents two steps, first spatial and temporal simulation of streamflow time series based on the construction of a regular vine. Following that, spatial wind speed simulation based on the construction of a conditional distribution function given the streamflow. In order to perform the cited steps, it is necessary to find periodic autoregressive (PAR(p)) time series models for the streamflow, the construction of marginal distributions, and the construction of joint and conditional probability distribution functions using copulas. The dependence analysis between monthly streamflow and wind speed is performed based on Kendall’s . In [71], the generated scenarios were used as input to derive monthly operational policies via implicit stochastic optimization.
The research [72] proposed a methodology to surpass two problems related to the long-term optimal dispatch of hybrid systems compounded by hydro and wind power plants; one problem is associated with runoffs and wind speed aspects as variability, seasonality, linear and nonlinear dynamic correlations, etc. The other problem is linked to high non-convex nonlinear constraints. In order to address the first problem, this study employed a set of models and methodologies, a novel X-12 seasonal adjustment, vector autoregressive integrated moving average (VARIMA), component generalized autoregressive conditional heteroscedasticity (C-GARCH), and dynamic copula mixed model to estimate the joint probability distribution of runoffs and wind speeds. Then, the authors built a multistage stochastic mixed-integer linear programming (MILP) with the help of several linearization methods to achieve a long-term optimal dispatch of a hydro-wind hybrid system.
Wind and Solar Generation Complementarity
As mentioned before, the installed capacity of wind and solar generation is increasing sharply, and it is very important to model it appropriately. Focused on a generation capacity planning model to support the integration of wind farms and solar photovoltaic plants, by multi-stage stochastic programming, the paper [73] applied a Gaussian copula to represent the correlation between the random samples of wind power, solar irradiance, and load.
In [74], the authors were interested in investigating the integration of photovoltaics and wind turbines, spread out into a distribution network. The effects of this integration were simulated based on the stochastic modeling using Archimedean copulas to model the interdependence between wind and solar generation.
The article [75] aims at investigating the wind and solar complementarity in China, in both dimensions spatial and temporal, to determine the dependence of wind and solar used a combined approach with copulas and Gaussian kernel function. The main results were presented, and the spatial correlation was classified into four categories, according to Kendall’s : Category I (−0.95 < ≤ −0.80) concentrates in the northwest of China; Category II (−0.80 < ≤ −0.60) diffuses in the north, west and a few coastal regions; Category III (−0.60 < ≤ −0.30) is dispersed in the eastern, southwestern and western regions; and Category IV (−0.30 < ≤ 0.10) is mostly in the central and southeastern regions.
Applied to the optimal power flow calculation model, the researchers in [76] modeled temporal and spatial correlations among different renewable generations to evaluate the integration capability of power systems based on the copula model. The Gaussian copula was used to simulate aggregated wind and PV power scenarios. These scenarios were used as an input for a power system reliability evaluation model, and the loss of load probability (LOLP) indices was analyzed.
Aiming at providing a more realistic view [77], the stochastic nature of solar irradiation, wind generation, energy demands, thermal, and gas market prices were considered through uncertainty modeling. The probabilistic scenario base was constructed, employing the Monte Carlo simulation technique to generate an adequate number of scenarios, and the Cholesky decomposition technique combined with Nataf transformation, which is a kind of Gaussian copula, was used to take into consideration the correlation between all variables.
Solar Generation Spatial Complementarity
The study [78] was developed to address the uncertainty related to the design and operation of combined heat and power (CHP) systems, including renewable energy generation. For this purpose, a mixed algorithm combining Latin hypercube sampling (LHS) and the copula function was proposed to model the dependency between PV power and heat load, with good accuracy. A Gaussian copula approach was proposed in [79] in the probabilistic load flow analysis considering the correlation between loads and PV generation.
Hydro, Wind and Solar Generation Complementarity
The intermittency of renewable energy sources increases the uncertainty of power system reliability; this problem could be addressed if the renewable energy sources are combined with an energy storage system, but with a high investment cost, or alternatively, aggregating different renewable sources to reduce the uncertainty of the total energy production. A methodology for a generation of correlated scenarios of wind, photovoltaics, and small hydro plants is presented in [80]. The scenarios obtained from a direct probabilistic forecast of the aggregated production are compared with those of scenarios arising from separate production forecasts for each energy source. The correlations are modeled with a multivariate copula.
3.1.3. Methods Based on Correlation and Variance–Covariance Matrix
The variance-c-ovariance matrix and correlation index could be used to describe the spatial correlation among the VREs. A procedure was proposed in [81] to produce a plausible wind speed series that takes into account the spatial correlation with other wind sites.
Briefly speaking, the optimal power flow problem (OPF), for power system planning and operation, is approached as a deterministic problem, where the parameters and input variables are considered fixed. However, there are many uncertainties related to random disturbances, measurement errors, forecasting errors, etc., that impose errors in OPF solutions due to the use of deterministic data. To deal with these uncertainties and deliver more accuracy for the analysis of the articles, Refs. [82,83] presented a methodology for probabilistic optimal power flow (P-OPF) in a correlated hybrid wind-photovoltaic power system. In these studies, the uncertainty of wind generation was assessed via wind speed appropriate PDF (such as Weibull), and samples were generated. The correlation between different wind plants and the load was estimated by the correlation coefficients matrix. In [84], the complementarity between wind and solar power was evaluated for the same geographical point or for different locations. In the Italy territory, the complementarity was assessed by computing the correlation coefficient. The paper [85] presented a modular statistical modeling methodology for wind and solar power plants, combining the core functionality of the wind power simulation model and the PV simulation model. The methodology is based on a vector autoregressive model (VAR model), which is able to capture both the temporal correlations in both types of generation and the spatial correlations that were addressed by the covariance matrix.
The work [86] was conceived to answer which model is better to deal with spatiotemporal estimation for a wind speed time series. The authors tested the following models: VAR (vector autoregressive), VAR-DCC (VAR–dynamic conditional correlation), VAR-BEKK (VAR–Baba, Engle, Kraft, and Kroner), and VAR-t-DCC (VAR-DCC model with student’s t innovations). According to the results presented in the article, the VAR-t-DCC model is a good multipurpose method.
The paper [87] aims to evaluate the power system reliability by representing the multiple correlations among wind speeds, solar insolations, and bus/regional loads. A modified correlation matrix method is presented to simulate all correlations between the random variables.
The VARMA is an extension of the ARMA to consider not just regression (or “lag”) terms within a series, but other correlated series as well. The article [88] proposed a methodology to capture and reproduce the correlations between VREs using VARMA (vector autoregressive moving average) algorithm. The approach also includes Fourier series decomposition to model seasonal patterns.
3.1.4. Methods Based on Artificial Intelligence
Artificial intelligence (AI) is another approach widely used to address forecasting, scenario simulation, and to model the correlation between VREs. In [89], genetic algorithm methods are applied to adjust the time series model; in this case, an autoregressive moving average (ARMA) for two wind locations, the cross-correlation coefficients were estimated in order to simulate correlated hourly wind speeds. Multi-state wind energy conversion system models were used to incorporate the correlated wind farms in power system reliability studies.
The generative adversarial network (GAN) is a class of machine learning framework, the basic idea of this technique is to learn with a training set and generate new data with the same statistics [90]. The article [91] proposed a scenario generation framework, for wind assets, based on the conditional improved Wasserstein generative adversarial network (WGAN or WGAN-GP). The conditional generation scenario task is executed by enabling the conditional WGAN-GP to learn spatiotemporal relationships using the real forecast error data. Aiming at precisely modeling the uncertainty in wind power, a novel scenario forecasting method was proposed in [92] via an improved variant of GAN; the proposed method is called the progressive growing of generative adversarial networks (PG-GAN). A complete multi-objective scenario forecasting model is built to better utilize historical data and given point forecast data and capture the complex temporal dynamics and pattern correlations.
Focused on enhancing the scalability, robustness, and computational efficiency in spatio-temporal solar irradiance prediction, the article [93] used a chain-structure echo state network (CESN). The echo state network is an advanced variant of recurrent neural network (RNN) that provides less computational burden and faster learning speed. It is important to notice that the CESN needs the temporal and spatial measurement data to model and forecast solar irradiance. The spatial correlation was estimated by correlation coefficients between the locations, two by two. The article [94] also approached the problem using RRN. In this case, a short-term forecasting method based on a long short-term memory network, for watershed-type wind-PV-hydro multi-energy complementary bases (WMCB) considering the complementary characteristics of cascade hydropower stations, the correlation between the VREs was provided by the Pearson coefficient.
3.1.5. Methods Based on Other Approaches
Based on the Cholesky decomposition characteristics that allow the generation of correlated random variables scenarios, the article [95] provided a methodology, applied to the Brazilian energy market, to assess risk and portfolio optimization considering a hybrid portfolio compounded by hydro, wind, and solar assets.
Pre-processing techniques are important tools to simplify the time series analysis, generally decomposing the nonlinear original data set in stationary sub-series; wavelet transform (WT) is one of these techniques used to meet this objective. The article [96] brings a novel approach to wind speed forecasting, where wavelet transform (WT) is employed for decomposition of the wind speed data into more stationary components. Then, a spatio-temporal model is used on each sub-series for incorporating both temporal and spatial information. Based on the wavelet transform coherence (WTC), the authors in [97] propose a wavelet-based complementarity index (WBCI), a metric to assess the complementarity between energy sources at multiple temporal scales. The spatio-temporal complementarity among the photovoltaic and run-of-river hydro generation in North-East Italy is investigated.
Broadly speaking, the principal component analysis (PCA) is a kind of process to compute the principal components of a database and use them to perform a change of basis on the data. This methodology is performed in [98] aiming at capturing the correlations between solar and wind power plants. Additionally, the scenarios generated by the proposed PCA methodology are used as building blocks for daily multi-regional scenarios under the different assumptions of dependence, which can include extreme joint events.
4. Conclusions
A systematic bibliography review methodology was applied to assess articles related to renewable energy sources’ correlation and complementarity, and the main methodologies and applications used to address this issue. Based on the research outcomes, the questions raised in the first section of this article can be addressed.
The first question: which are the most influential articles in renewable energy generation scenarios and/or forecast considering different sources of complementarity or correlation?
The modeling of VREs interdependence has gained more attention in the last years; consequently, the proposed methods and approaches are still under development and testing. Based on the number of citations, two articles could be highlighted [65,99]: the first one, focused on wind generation, presented a methodology for the generation of statistical scenarios of short-term wind generation that accounts for the interdependence structure. The second article, published in 2009, brought the basic theory concerning the use of copulas functions for dependence modeling. A case study, considering the application of the technique for the study of the large-scale integration of wind power in the Netherlands, was presented.
The second question: which are the main themes in renewable energy generation scenario and/or forecasting considering different sources of complementarity or correlation and how did they progress? Forecasting and scenario generation methods and other forms to deal with the VREs generation of uncertainty and correlation with them have shifted from attractive improvements to mandatory necessities due to the high penetration of this kind of source worldwide. Modeling and dealing with the VREs’ generation uncertainty and interdependence is crucial for all activities in the power systems, from long-term expansion planning optimization to short-term decisions in the operation. The number of articles addressing renewable energy forecasting and scenario generation taking into account the correlation and complementary aspects has rocketed in the last three years.
The third question: which are the main methodologies used to approach the subject: renewable energy generation scenario and/or forecast considering different sources of complementarity or correlation? There is a set of methods that has been employed to address this issue, from conventional statistics methods to artificial intelligence. The copula approach is gaining attention as a method to model the dependency structure between VREs.
The fourth question: what are the major still unresolved shortcomings? There is a gap in articles comparing the accuracy of the employed methods and/or the computational efforts. With the consideration of the spatiotemporal dependency structure, the number of modeled random variables increases significantly, which is a challenge for the modeling process.
Most articles applied the proposed models to a small system or considered the correlation among a few plants. The performance of these models in large power systems was not evaluated. Another important issue is that the relevance and availability of historical data are crucial to properly addressing this problem.
Questions related to how results based on dependence and complementarity from measurement-based to model-based data differ have received little attention. It is possible that some results of wind–solar PV, hydro–solar PV, hydro–wind, and hydro–wind–solar PV complementarity and correlation in models arise from intrinsic model properties, such as parametrization schemes or spatial and temporal resolutions.
Given the rapid development of this theme and the number of articles that have been published in recent years, literature reviews pose an essential instrument to help researchers in this field. However, on the other hand, the selection process or recent publications can exclude interesting and promising works. The future extension of this work is an update in the literature review and also a specific review focusing on the copulas methodology, which is a promising approach in this field.
Funding
This work was supported by the Brazilian Coordination for the Improvement of Higher Level Personnel (CAPES) under Grant [number 001]; the Brazilian National Council for Scientific and Technological Development (CNPq) under Grants [numbers 307403/2019-0, 422470/2021-0 and 307084/2022-1]; the Carlos Chagas Filho Research Support Foundation of the State of Rio de Janeiro (FAPERJ) under grant numbers 202.673/2018, 211.086/2019 and 201.243/2022, and the ANEEL R&D Program under grant number PD-10381-0322/2022.
Data Availability Statement
Not applicable.
Conflicts of Interest
The authors declare no conflict of interest.
Abbreviations
| AI | Artificial Intelligence |
| ANN | Artificial Neural Network |
| ARMA | Autoregressive Moving Average |
| CDF | Cumulative Distribution Functions |
| CESN | Chain Structure Echo State Network |
| C-GARCH | Component Generalized Autoregressive Conditional Heteroscedaticity |
| CHP | Combined Heat and Power |
| ESG | Environmental, Social and Governance |
| GA | Genetic Algorithm |
| GAN | Generative Adversarial Network |
| IEA | International Energy Agency |
| LHS | Latin Hypercube Sampling |
| LOLP | Loss of Load Probability |
| MCMC | Markov Chain and Monte Carlo |
| MCP | Multiple Countries Publications |
| MILP | Multistage Stochastic Mixed Integer Linear Programming |
| NWP | Numerical Weather Predictions |
| OPF | Optimal Power Flow |
| PAR(p) | Periodic Autoregressive |
| Probability Density Function | |
| PG-Gan | Progressive Growing Generative Adversarial Network |
| P-OPF | Probabilistic Optimal Power Flow |
| PV | Photovoltaic |
| RMSE | Root Mean Square Error |
| RNN | Recurrent Neural Network |
| SCP | Single Country Publication |
| SLR | Systematic Literature Review |
| VAR | Vector Autoregressive |
| VAR-BEKK | Vector Autoregressive Baba, Eagle, Kraft and Kroner |
| VAR-DCC | Vector Autoregressive Dynamic Conditional Correlation |
| VARIMA | Vector Autoregressive Integrated Moving Average |
| VRE | Variable Renewable Energy |
| WGAN | Wasserstein Generative Adversarial Network |
References
- Yang, Q.; Du, Q.; Razzaq, A.; Shang, Y. How volatility in green financing, clean energy, and green economic practices derive sustainable performance through ESG indicators? A sectoral study of G7 countries. Resour. Policy 2022, 75, 102526. [Google Scholar] [CrossRef]
- International Energy Agency (IEA). Renewable Energy Market Update—Outlook for 2021 and 2022; IEA: Paris, France, 2021. [Google Scholar]
- Jacobson, M.Z.; Delucchi, M.A. Providing all global energy with wind, water, and solar power, Part I: Technologies, energy resources, quantities and areas of infrastructure, and materials. Energy Policy 2011, 39, 1154–1169. [Google Scholar] [CrossRef]
- Delucchi, M.A.; Jacobson, M.Z. Providing all global energy with wind, water, and solar power, Part II: Reliability, system and transmission costs, and policies. Energy Policy 2011, 39, 1170–1190. [Google Scholar] [CrossRef]
- Brouwer, A.S.; van den Broek, M.; Seebregts, A.; Faaij, A. Impacts of large-scale Intermittent Renewable Energy Sources on electricity systems, and how these can be modeled. Renew. Sustain. Energy Rev. 2014, 33, 443–466. [Google Scholar] [CrossRef]
- de Queiroz, A.R. Stochastic hydro-thermal scheduling optimization: An overview. Renew. Sustain. Energy Rev. 2016, 62, 382–395. [Google Scholar] [CrossRef]
- Souza, R.C.; Marcato, A.L.M.; Dias, B.H.; Oliveira, F.L.C. Optimal operation of hydrothermal systems with Hydrological Scenario Generation through Bootstrap and Periodic Autoregressive Models. Eur. J. Oper. Res. 2012, 222, 606–615. [Google Scholar] [CrossRef]
- Oliveira, F.L.C.; Souza, R.C.; Marcato, A.L.M. A time series model for building scenarios trees applied to stochastic optimisation. Int. J. Electr. Power Energy Syst. 2015, 67, 315–323. [Google Scholar] [CrossRef]
- Domínguez, R.; Carrión, M.; Oggioni, G. Planning and operating a renewable-dominated European power system under uncertainty. Appl. Energy 2020, 258, 113989. [Google Scholar] [CrossRef]
- Farghal, S.; Abdel Aziz, M. Generation expansion planning including the renewable energy sources. IEEE Trans. Power Syst. 1988, 3, 816–822. [Google Scholar] [CrossRef]
- Viviescas, C.; Lima, L.; Diuana, F.A.; Vasquez, E.; Ludovique, C.; Silva, G.N.; Huback, V.; Magalar, L.; Szklo, A.; Lucena, A.F.; et al. Contribution of Variable Renewable Energy to increase energy security in Latin America: Complementarity and climate change impacts on wind and solar resources. Renew. Sustain. Energy Rev. 2019, 113, 109232. [Google Scholar] [CrossRef]
- Lyrio de Oliveira, L.; de Oliveira Ribeiro, C.; Qadrdan, M. Analysis of electricity supply and demand intra-annual dynamics in Brazil: A multi-period and multi-regional generation expansion planning model. Int. J. Electr. Power Energy Syst. 2022, 137, 107886. [Google Scholar] [CrossRef]
- Ferreira, P.G.C.; Oliveira, F.L.C.; Souza, R.C. The stochastic effects on the Brazilian Electrical Sector. Energy Econ. 2015, 49, 328–335. [Google Scholar] [CrossRef]
- Varaiya, P.P.; Wu, F.F.; Bialek, J.W. Smart Operation of Smart Grid: Risk-Limiting Dispatch. Proc. IEEE 2011, 99, 40–57. [Google Scholar] [CrossRef]
- Eftekharnejad, S.; Vittal, V.; Heydt, G.T.; Keel, B.; Loehr, J. Impact of increased penetration of photovoltaic generation on power systems. IEEE Trans. Power Syst. 2013, 28, 893–901. [Google Scholar] [CrossRef]
- Atwa, Y.M.; El-Saadany, E.F.; Salama, M.M.A.; Seethapathy, R. Optimal Renewable Resources Mix for Distribution System Energy Loss Minimization. IEEE Trans. Power Syst. 2010, 25, 360–370. [Google Scholar] [CrossRef]
- Xu, X.; Yan, Z.; Shahidehpour, M.; Wang, H.; Chen, S. Power system voltage stability evaluation considering renewable energy with correlated variabilities. IEEE Trans. Power Syst. 2017, 33, 3236–3245. [Google Scholar] [CrossRef]
- Deng, X.; Lv, T. Power system planning with increasing variable renewable energy: A review of optimization models. J. Clean. Prod. 2020, 246, 118962. [Google Scholar] [CrossRef]
- Papaefthymiou, G.; Schavemaker, P.; van der Sluis, L.; Kling, W.; Kurowicka, D.; Cooke, R. Integration of stochastic generation in power systems. Int. J. Electr. Power Energy Syst. 2006, 28, 655–667. [Google Scholar] [CrossRef]
- Tsai, S.B.; Xue, Y.; Zhang, J.; Chen, Q.; Liu, Y.; Zhou, J.; Dong, W. Models for forecasting growth trends in renewable energy. Renew. Sustain. Energy Rev. 2017, 77, 1169–1178. [Google Scholar] [CrossRef]
- Wang, H.; Lei, Z.; Zhang, X.; Zhou, B.; Peng, J. A review of deep learning for renewable energy forecasting. Energy Convers. Manag. 2019, 198, 111799. [Google Scholar] [CrossRef]
- Sweeney, C.; Bessa, R.J.; Browell, J.; Pinson, P. The future of forecasting for renewable energy. Wiley Interdiscip. Rev. Energy Environ. 2020, 9, e365. [Google Scholar] [CrossRef]
- Ahmed, A.; Khalid, M. A review on the selected applications of forecasting models in renewable power systems. Renew. Sustain. Energy Rev. 2019, 100, 9–21. [Google Scholar] [CrossRef]
- Kahn, E. Reliability of Wind Power from Dispersed Sites: A Preliminary Assessment; Lawrence Berkeley National Laboratory: Berkeley, CA, USA, 1978. [Google Scholar]
- Caramanis, M.C.; Tabors, R.D.; Nochur, K.S.; Schweppe, F.C. The Introduction of Non-Dispatchable Technologies a Decision Variables in Long-Term Generation Expansion Models. IEEE Trans. Power Appar. Syst. 1982, PAS-101, 2658–2667. [Google Scholar] [CrossRef]
- Caramanis, M.C. Analysis of Non-Dispatchable Options in the Generation Expansion Plan. IEEE Trans. Power Appar. Syst. 1983, PAS-102, 2098–2103. [Google Scholar] [CrossRef]
- Bloom, J.A. Probabilistic Production Costing with Dependent Generating Sources. IEEE Trans. Power Appar. Syst. 1985, PAS-104, 2064–2071. [Google Scholar] [CrossRef]
- Bélanger, C.; Gagnon, L. Adding wind energy to hydropower. Energy Policy 2002, 30, 1279–1284. [Google Scholar] [CrossRef]
- Jaramillo, O.; Borja, M.; Huacuz, J. Using hydropower to complement wind energy: A hybrid system to provide firm power. Renew. Energy 2004, 29, 1887–1909. [Google Scholar] [CrossRef]
- Denault, M.; Dupuis, D.; Couture-Cardinal, S. Complementarity of hydro and wind power: Improving the risk profile of energy inflows. Energy Policy 2009, 37, 5376–5384. [Google Scholar] [CrossRef]
- Mazzeo, D.; Matera, N.; De Luca, P.; Baglivo, C.; Congedo, P.M.; Oliveti, G. A literature review and statistical analysis of photovoltaic-wind hybrid renewable system research by considering the most relevant 550 articles: An upgradable matrix literature database. J. Clean. Prod. 2021, 295, 126070. [Google Scholar] [CrossRef]
- Xiao, Y.; Watson, M. Guidance on Conducting a Systematic Literature Review. J. Plan. Educ. Res. 2019, 39, 93–112. [Google Scholar] [CrossRef]
- Thomé, A.M.T.; Scavarda, L.F.; Scavarda, A.J. Conducting systematic literature review in operations management. Prod. Plan. Control 2016, 27, 408–420. [Google Scholar] [CrossRef]
- Maçaira, P.M.; Tavares Thomé, A.M.; Cyrino Oliveira, F.L.; Carvalho Ferrer, A.L. Time series analysis with explanatory variables: A systematic literature review. Environ. Model. Softw. 2018, 107, 199–209. [Google Scholar] [CrossRef]
- Cooper, H.M. Organizing knowledge syntheses: A taxonomy of literature reviews. Knowl. Soc. 1988, 1, 104. [Google Scholar] [CrossRef]
- Torraco, R.J. Writing Integrative Literature Reviews: Guidelines and Examples. Hum. Resour. Dev. Rev. 2005, 4, 356–367. [Google Scholar] [CrossRef]
- Neuendorf, K.A. The Content Analysis Guidebook; Sage: Thousand Oaks, CA, USA, 2017. [Google Scholar]
- Denyer, D.; Tranfield, D. Producing a systematic review. In The Sage Handbook of Organizational Research Methods; Buchanan, D.A., Bryman, A., Eds.; Sage: Thousand Oaks, CA, USA, 2009; pp. 671–689. [Google Scholar]
- Cooper, H. Research Synthesis and Meta-Analysis: A Step-by-Step Approach; Sage: Thousand Oaks, CA, USA, 2015; Volume 2. [Google Scholar]
- Aria, M.; Cuccurullo, C. bibliometrix: An R-tool for comprehensive science mapping analysis. J. Inf. 2017, 11, 959–975. [Google Scholar] [CrossRef]
- Watchorn, C.W. Load Growth Characteristics as Related to Generating Capacity Additions. IEEE Trans. Power Appar. Syst. 1963, 82, 110–116. [Google Scholar] [CrossRef]
- Liu, L.; Xu, J. Multi-objective generation scheduling towards grid-connected hydro–solar–wind power system based the coordination of economy, management, society, environment: A case study from China. Int. J. Electr. Power Energy Syst. 2022, 142, 108210. [Google Scholar] [CrossRef]
- Noyons, E.; Moed, H.; Luwel, M. Combining mapping and citation analysis for evaluative bibliometric purposes: A bibliometric study. J. Am. Soc. Inf. Sci. 1999, 50, 115–131. [Google Scholar] [CrossRef]
- Noyons, E.; Moed, H.; Van Raan, A. Integrating research performance analysis and science mapping. Scientometrics 1999, 46, 591–604. [Google Scholar] [CrossRef]
- Mellit, A.; Pavan, A.M. A 24-h forecast of solar irradiance using artificial neural network: Application for performance prediction of a grid-connected PV plant at Trieste, Italy. Sol. Energy 2010, 84, 807–821. [Google Scholar] [CrossRef]
- Das, U.K.; Tey, K.S.; Seyedmahmoudian, M.; Mekhilef, S.; Idris, M.Y.I.; Van Deventer, W.; Horan, B.; Stojcevski, A. Forecasting of photovoltaic power generation and model optimization: A review. Renew. Sustain. Energy Rev. 2018, 81, 912–928. [Google Scholar] [CrossRef]
- Jurasz, J.; Canales, F.; Kies, A.; Guezgouz, M.; Beluco, A. A review on the complementarity of renewable energy sources: Concept, metrics, application and future research directions. Sol. Energy 2020, 195, 703–724. [Google Scholar] [CrossRef]
- Kendall, M.G. A New Measure of Rank Correlation. Biometrika 1938, 30, 81–93. [Google Scholar] [CrossRef]
- Godard, W.W. Electrical utility load forecasting [includes discussion]. Trans. Am. Inst. Electr. Eng. Part III Power Appar. Syst. 1955, 74, 1428–1440. [Google Scholar] [CrossRef]
- Bennett, R.R. Planning for power a look at tomorrow’s station sizes. IEEE Spectr. 1968, 5, 67–72. [Google Scholar] [CrossRef]
- Stanton, K.; Gupta, P. Long range forecasting of electrical demand by probability methods. Proc. Proc. Am. Power Conf. 1969, 31, 964–969. [Google Scholar]
- Peschon, J.; Henault, P.H. Long-term power system expansion planning by dynamic programming and production cost simulation. In Proceedings of the 1970 IEEE Symposium on Adaptive Processes (9th) Decision and Control, Austin, TX, USA, 7–9 December 1970; p. 12. [Google Scholar]
- Henault, P.H.; Eastvedt, R.B.; Peschon, J.; Hajdu, L.P. Power System Long-Term Planning in the Presence of Uncertainty. IEEE Trans. Power Appar. Syst. 1970, PAS-89, 156–164. [Google Scholar] [CrossRef]
- Chang, W.Y. A literature review of wind forecasting methods. J. Power Energy Eng. 2014, 2, 161. [Google Scholar] [CrossRef]
- Wang, X.; Guo, P.; Huang, X. A Review of Wind Power Forecasting Models. Energy Procedia 2011, 12, 770–778. [Google Scholar] [CrossRef]
- Dongmei, Z.; Yuchen, Z.; Xu, Z. Research on wind power forecasting in wind farms. In Proceedings of the 2011 IEEE Power Engineering and Automation Conference, Wuhan, China, 8–9 September 2011; Volume 1, pp. 175–178. [Google Scholar] [CrossRef]
- Zhao, X.; Wang, S.; Li, T. Review of Evaluation Criteria and Main Methods of Wind Power Forecasting. Energy Procedia 2011, 12, 761–769. [Google Scholar] [CrossRef]
- Talari, S.; Shafie-Khah, M.; Osório, G.J.; Aghaei, J.; Catalão, J.P. Stochastic modelling of renewable energy sources from operators’ point-of-view: A survey. Renew. Sustain. Energy Rev. 2018, 81, 1953–1965. [Google Scholar] [CrossRef]
- Dolara, A.; Leva, S.; Manzolini, G. Comparison of different physical models for PV power output prediction. Sol. Energy 2015, 119, 83–99. [Google Scholar] [CrossRef]
- Mayer, M.J.; Gróf, G. Extensive comparison of physical models for photovoltaic power forecasting. Appl. Energy 2021, 283, 116239. [Google Scholar] [CrossRef]
- Markovics, D.; Mayer, M.J. Comparison of machine learning methods for photovoltaic power forecasting based on numerical weather prediction. Renew. Sustain. Energy Rev. 2022, 161, 112364. [Google Scholar] [CrossRef]
- Nelsen, R.B. An Introduction to Copulas; Springer Science & Business Media: Berlin, Germany, 2007. [Google Scholar]
- Louie, H. Evaluation of bivariate Archimedean and elliptical copulas to model wind power dependency structures. Wind Energy 2014, 17, 225–240. [Google Scholar] [CrossRef]
- Baboli, P.T.; Brand, M.; Lehnhoff, S. Stochastic Correlation Modelling of Renewable Energy Sources for Provision of Ancillary Services using Multi-dimensional Copula Functions. In Proceedings of the 2021 11th Smart Grid Conference (SGC), Tabriz, Iran, 7–9 December 2021; pp. 1–6. [Google Scholar] [CrossRef]
- Papaefthymiou, G.; Kurowicka, D. Using Copulas for Modeling Stochastic Dependence in Power System Uncertainty Analysis. IEEE Trans. Power Syst. 2009, 24, 40–49. [Google Scholar] [CrossRef]
- Zhang, N.; Kang, C.; Xu, Q.; Jiang, C.; Chen, Z.; Liu, J. Modelling and simulating the spatio-temporal correlations of clustered wind power using copula. J. Electr. Eng. Technol. 2013, 8, 1615–1625. [Google Scholar] [CrossRef]
- Salehi Borujeni, M.; Akbari Foroud, A.; Dideban, A. Wind speed scenario generation based on dependency structure analysis. J. Wind Eng. Ind. Aerodyn. 2018, 172, 453–465. [Google Scholar] [CrossRef]
- Deng, J.; Li, H.; Hu, J.; Liu, Z. A new wind speed scenario generation method based on spatiotemporal dependency structure. Renew. Energy 2021, 163, 1951–1962. [Google Scholar] [CrossRef]
- Zhao, M.; Wang, Y.; Wang, X.; Chang, J.; Zhou, Y.; Liu, T. Modeling and Simulation of Large-Scale Wind Power Base Output Considering the Clustering Characteristics and Correlation of Wind Farms. Front. Energy Res. 2022, 10, 810082. [Google Scholar] [CrossRef]
- Ávila R., L.; Mine, M.R.; Kaviski, E.; Detzel, D.H.; Fill, H.D.; Bessa, M.R.; Pereira, G.A. Complementarity modeling of monthly streamflow and wind speed regimes based on a copula-entropy approach: A Brazilian case study. Appl. Energy 2020, 259, 114127. [Google Scholar] [CrossRef]
- Ávila, L.; Mine, M.R.; Kaviski, E.; Detzel, D.H. Evaluation of hydro-wind complementarity in the medium-term planning of electrical power systems by joint simulation of periodic streamflow and wind speed time series: A Brazilian case study. Renew. Energy 2021, 167, 685–699. [Google Scholar] [CrossRef]
- Zhang, Y.; Cheng, C.; Cao, R.; Li, G.; Shen, J.; Wu, X. Multivariate probabilistic forecasting and its performance’s impacts on long-term dispatch of hydro-wind hybrid systems. Appl. Energy 2021, 283, 116243. [Google Scholar] [CrossRef]
- Park, H.; Baldick, R. Optimal capacity planning of generation system integrating uncertain solar and wind energy with seasonal variability. Electr. Power Syst. Res. 2020, 180, 106072. [Google Scholar] [CrossRef]
- Valizadeh Haghi, H.; Tavakoli Bina, M.; Golkar, M.; Moghaddas-Tafreshi, S. Using Copulas for analysis of large datasets in renewable distributed generation: PV and wind power integration in Iran. Renew. Energy 2010, 35, 1991–2000. [Google Scholar] [CrossRef]
- Xu, L.; Wang, Z.; Liu, Y. The spatial and temporal variation features of wind-sun complementarity in China. Energy Convers. Manag. 2017, 154, 138–148. [Google Scholar] [CrossRef]
- Zhou, H.; Wu, H.; Ye, C.; Xiao, S.; Zhang, J.; He, X.; Wang, B. Integration Capability Evaluation of Wind and Photovoltaic Generation in Power Systems Based on Temporal and Spatial Correlations. Energies 2019, 12, 171. [Google Scholar] [CrossRef]
- Allahvirdizadeh, Y.; Galvani, S.; Shayanfar, H.; Parsa Moghaddam, M. Risk-averse scheduling of an energy hub in the presence of correlated uncertain variables considering time of use and real-time pricing-based demand response programs. Energy Sci. Eng. 2022, 10, 1343–1372. [Google Scholar] [CrossRef]
- Fu, X.; Guo, Q.; Sun, H.; Pan, Z.; Xiong, W.; Wang, L. Typical scenario set generation algorithm for an integrated energy system based on the Wasserstein distance metric. Energy 2017, 135, 153–170. [Google Scholar] [CrossRef]
- Bin, L.; Shahzad, M.; Bing, Q.; Ahsan, M.; Shoukat, M.U.; Khan, H.M.; Fahal, N.A. The probabilistic load flow analysis by considering uncertainty with correlated loads and photovoltaic generation using Copula theory. AIMS Energy 2018, 6, 414–435. [Google Scholar] [CrossRef]
- Camal, S.; Teng, F.; Michiorri, A.; Kariniotakis, G.; Badesa, L. Scenario generation of aggregated Wind, Photovoltaics and small Hydro production for power systems applications. Appl. Energy 2019, 242, 1396–1406. [Google Scholar] [CrossRef]
- Morales, J.; Mínguez, R.; Conejo, A. A methodology to generate statistically dependent wind speed scenarios. Appl. Energy 2010, 87, 843–855. [Google Scholar] [CrossRef]
- Aien, M.; Fotuhi-Firuzabad, M.; Rashidinejad, M. Probabilistic Optimal Power Flow in Correlated Hybrid Wind–Photovoltaic Power Systems. IEEE Trans. Smart Grid 2014, 5, 130–138. [Google Scholar] [CrossRef]
- Aien, M.; Rashidinejad, M.; Firuz-Abad, M.F. Probabilistic optimal power flow in correlated hybrid wind-PV power systems: A review and a new approach. Renew. Sustain. Energy Rev. 2015, 41, 1437–1446. [Google Scholar] [CrossRef]
- Monforti, F.; Huld, T.; Bódis, K.; Vitali, L.; D’Isidoro, M.; Lacal-Arántegui, R. Assessing complementarity of wind and solar resources for energy production in Italy. A Monte Carlo approach. Renew. Energy 2014, 63, 576–586. [Google Scholar] [CrossRef]
- Ekström, J.; Koivisto, M.; Mellin, I.; Millar, R.J.; Lehtonen, M. A Statistical Model for Hourly Large-Scale Wind and Photovoltaic Generation in New Locations. IEEE Trans. Sustain. Energy 2017, 8, 1383–1393. [Google Scholar] [CrossRef]
- Lucheroni, C.; Boland, J.; Ragno, C. Scenario generation and probabilistic forecasting analysis of spatio-temporal wind speed series with multivariate autoregressive volatility models. Appl. Energy 2019, 239, 1226–1241. [Google Scholar] [CrossRef]
- Qin, Z.; Li, W.; Xiong, X. Incorporating multiple correlations among wind speeds, photovoltaic powers and bus loads in composite system reliability evaluation. Appl. Energy 2013, 110, 285–294. [Google Scholar] [CrossRef]
- Talbot, P.W.; Rabiti, C.; Alfonsi, A.; Krome, C.; Kunz, M.R.; Epiney, A.; Wang, C.; Mandelli, D. Correlated synthetic time series generation for energy system simulations using Fourier and ARMA signal processing. Int. J. Energy Res. 2020, 44, 8144–8155. [Google Scholar] [CrossRef]
- Gao, Y.; Billinton, R. Adequacy assessment of generating systems containing wind power considering wind speed correlation. IET Renew. Power Gener. 2009, 3, 217–226. [Google Scholar]
- Goodfellow, I.; Pouget-Abadie, J.; Mirza, M.; Xu, B.; Warde-Farley, D.; Ozair, S.; Courville, A.; Bengio, Y. Generative adversarial nets. arXiv 2014, arXiv:1406.2661. [Google Scholar]
- Zhang, Y.; Ai, Q.; Xiao, F.; Hao, R.; Lu, T. Typical wind power scenario generation for multiple wind farms using conditional improved Wasserstein generative adversarial network. Int. J. Electr. Power Energy Syst. 2020, 114, 105388. [Google Scholar] [CrossRef]
- Yuan, R.; Wang, B.; Mao, Z.; Watada, J. Multi-objective wind power scenario forecasting based on PG-GAN. Energy 2021, 226, 120379. [Google Scholar] [CrossRef]
- Li, Q.; Wu, Z.; Zhang, H. Spatio-temporal modeling with enhanced flexibility and robustness of solar irradiance prediction: A chain-structure echo state network approach. J. Clean. Prod. 2020, 261, 121151. [Google Scholar] [CrossRef]
- Pang, S.; Zheng, Z.; Luo, F.; Xiao, X.; Xu, L. Hybrid Forecasting Methodology for Wind Power-Photovoltaic-Concentrating Solar Power Generation Clustered Renewable Energy Systems. Sustainability 2021, 13, 6681. [Google Scholar] [CrossRef]
- Pinheiro Neto, D.; Domingues, E.G.; Coimbra, A.P.; de Almeida, A.T.; Alves, A.J.; Calixto, W.P. Portfolio optimization of renewable energy assets: Hydro, wind, and photovoltaic energy in the regulated market in Brazil. Energy Econ. 2017, 64, 238–250. [Google Scholar] [CrossRef]
- Tascikaraoglu, A.; Sanandaji, B.M.; Poolla, K.; Varaiya, P. Exploiting sparsity of interconnections in spatio-temporal wind speed forecasting using Wavelet Transform. Appl. Energy 2016, 165, 735–747. [Google Scholar] [CrossRef]
- Pérez Ciria, T.; Puspitarini, H.; Chiogna, G.; François, B.; Borga, M. Multi-temporal scale analysis of complementarity between hydro and solar power along an alpine transect. Sci. Total Environ. 2020, 741, 140179. [Google Scholar] [CrossRef]
- Densing, M.; Wan, Y. Low-dimensional scenario generation method of solar and wind availability for representative days in energy modeling. Appl. Energy 2022, 306, 118075. [Google Scholar] [CrossRef]
- Pinson, P.; Madsen, H.; Nielsen, H.A.; Papaefthymiou, G.; Klöckl, B. From probabilistic forecasts to statistical scenarios of short-term wind power production. Wind Energy 2009, 12, 51–62. [Google Scholar] [CrossRef]
Disclaimer/Publisher’s Note: The statements, opinions and data contained in all publications are solely those of the individual author(s) and contributor(s) and not of MDPI and/or the editor(s). MDPI and/or the editor(s) disclaim responsibility for any injury to people or property resulting from any ideas, methods, instructions or products referred to in the content. |
© 2023 by the authors. Licensee MDPI, Basel, Switzerland. This article is an open access article distributed under the terms and conditions of the Creative Commons Attribution (CC BY) license (https://creativecommons.org/licenses/by/4.0/).