Abstract
The aim of the present study was to investigate structural modifications and physicochemical properties of bacterial nanocellulose (BNC) pellicles produced statically in a beetroot peel medium as a mixture of C-sources (8% sucrose, 2% glucose, and 0.86% fructose). Characteristics of these BNC samples were compared to those produced using a chemically defined and modified Hestrin–Schramm medium with 3% (w/v) glucose, fructose, and sucrose as sole carbon sources. Compared with the beetroot peel medium, where 11.57 g/L BNC (wet weight) was obtained, glucose gave the highest BNC yield (13.07 g/L), sucrose 10.55 g/L, and fructose 7.9 g/L. FT-IR spectra showed almost identical chemical profiles assigned to cellulose I. XRD analysis revealed that the BNC produced in beetroot peel medium had a larger crystallite size than other BNC samples. The crystallinity index of beetroot peel BNC was higher than that of Hestrin–Schramm BNC. The water-holding capacity, water release rate, and iodine sorption value from the beetroot peel medium were greater than those of other BNCs. Furthermore, as there is a necessity today to find cheaper carbon sources to obtain valuable products at a lower cost, beetroot peels represent an interesting alternative to producing BNC as a new functional material for industrial applications.
1. Introduction
Cellulose is the most common renewable natural biopolymer on earth, representing approximately 1012 tons of the total annual biomass production [1]. It is a linear homopolymer of d-glucopyranose residues (C6H11O5) linked together by β-(1→4) glycosidic bonds. Each glucose monomer of cellulose consists of three hydroxyl groups, positioned at C6 for the primary hydroxyl groups and at C2 and C3 for the secondary hydroxyl groups that can form intra- and intermolecular hydrogen bonds [2].
Kombucha tea is a traditional non-alcoholic fermented beverage originating in the Orient, and its inception is shrouded in mystery [3]. The fermentation occurs by providing a symbiotic culture of bacteria and yeasts (SCOBY), a nanocellulose biofilm containing the bacteria and yeasts, as a starter culture [4]. The relationship between acetic acid bacteria and yeast during kombucha fermentation is known as symbiotic mutualism [5,6]. The microorganisms produce a thick nanocellulosic biofilm on the liquid–air interface during the fermentation. In contrast, most biofilms studied to date are formed either on liquid–solid or air–solid interfaces [7]. The kombucha yeast family has been reported to include members of the Zygosaccharomyces and Brettanomyces genera [8].
Nanocellulose can be obtained from various sources, including plant biomass, bacteria, fungi, algae, and marine animals (tunicates) [9]. In 1886, Brown reported a type of cellulose produced by bacteria, commonly known as microbial cellulose (MC), bacterial cellulose (BC), or bacterial nanocellulose (BNC) [10]. BNC is a semi-crystalline extracellular polysaccharide with a highly ordered structure due to its chemical constitution and spatial conformation. It represents the purest form of nanocellulose with remarkable physical and chemical properties suitable for various industrial applications [11]. Its fibers have a diameter of 20–100 nm with unique morphological, structural, physical, biological, chemical, and mechanical features. BNC has a high surface area per mass unit, a highly hydrophilic nature, and a high water-holding capacity. This reticulate three-dimensional network structure with a high degree of polymerization, high purity and crystallinity, good biocompatibility, and high mechanical durability is used intensively in many scientific fields [12]. Polyfunctionality can be reinforced by incorporating different materials in the nanocellulose matrix, which could lead to new applications. BNC is an excellent biomaterial with many applications in tissue engineering, regenerative medicines, wound dressing, cosmetics, drug delivery, bioprinting, biosensing, electronics, environmental fields, textiles, and the food industry [13,14,15,16,17,18,19].
Several bacteria belonging to the genera Achromobacter, Agrobacterium, Azotobacter, Rhizobium, Pseudomonas, and Sarcina can secrete nanocellulose with the same chemical structure and much higher crystallinity index and chemical purity than plant nanocellulose [20,21]. Among them, the most prominent and well-known BNC-producer is Komagataeibacter xylinus, which belongs to the group of acetic acid bacteria (AAB). The species was known as Acetobacter xylinum for many years but was later classified as Gluconacetobacter xylinus and, due to further taxonomic changes, finally reclassified as K. xylinus [22]. In addition to an oxygen supply, these bacteria need carbon sources from raw materials such as fruit, vegetable, or lignocellulosic wastes and other nutrients such as hydrogen, nitrogen, minerals, and vitamins for growth and metabolism [23]. They have flexible metabolism and can assimilate various sugars [24] and alcohols [25]. In most cases, glucose, fructose, sucrose, glycerol, and mannitol were the most suitable carbon sources for BNC production [26,27].
The peels of fruits and vegetables are rich in reducing and non-reducing sugars, proteins, crude fiber, vitamins, and ascorbic acid that can form an ideal nutrient medium for the growth of bacteria. In addition, they could be a low- or no-cost carbon source as a substrate for the BNC-producing bacteria growth. The utilization of the waste produced by the food industry would thus benefit the agroindustry since the waste or by-products would be up-converted into a value-added product. Thus, the waste from one industry can serve as a raw material for the other, resulting in a completely environmentally friendly approach to food processing [28].
Beetroot (Beta vulgaris L.) is a biennial plant that belongs to the Amaranthaceae family with high sugar content (8.7%), mainly sucrose, and small amounts of glucose and fructose [29,30]. In addition, it contains high amounts of biologically active substances, including betalains, carotenoids, phenols, B-vitamins, C-vitamin, fibers, and inorganic nitrate. The whole plant has different medicinal uses, including as an antioxidant, antimicrobial, anti-inflammatory, diuretic, and protector of cardiovascular health [31]. Beetroot peels are waste residue from beetroot juice production, and to the authors’ knowledge, they have not been investigated for BNC production.
The objective of this work was to produce low-cost environmentally friendly BNC utilizing beetroot peels as a sole cheap carbon source. Our investigations used agroindustrial waste residue, namely beetroot peels, as a whole complex medium and chemically defined and modified Hestrin–Schramm [32] media with glucose, fructose, and sucrose as carbon sources for comparison. Kombucha culture was fermented under static conditions for BNC synthesis. The BNC microfibrils synthesized in different media were characterized by scanning electron micrography (SEM), Fourier transform infrared spectroscopy (FT-IR), and X-ray diffraction (XRD). The various physicochemical properties investigated include water-holding capacity, water release rate, and iodine sorption value. This study could help determine if the BNC obtained in the new media and conditions is appropriate for commercial applications.
2. Materials and Methods
2.1. Materials and Reagents
Beetroot was harvested in the northern part of Croatia (latitude/longitude: 46°15′00″ N/16°36′36″ E) in autumn 2021 and was purchased from a local market in Zagreb, Croatia. The beetroot was washed thoroughly with tap water to remove all sand and dirt from the sample and then rinsed twice. After stems and leaves were separated, beetroots were carefully peeled; the peels obtained were dried for 24 h in an air drier at 50 °C. After air drying, the sample was cut into small pieces for further analysis.
Standards of d-glucose, d-fructose, and sucrose were purchased from Fluka (Taufkirchen, Germany). Methanol, ethanol (96%), glacial acetic acid (85%), and acetonitrile were supplied by Sigma Aldrich (St. Louis, MO, USA). All chemicals used for experimental procedures were of analytical grade.
2.2. Production of BNC Pellicle and Culture Conditions
Kombucha starter culture, known as “tea fungus”, or SCOBY, was obtained from a household source. The 3% (m/v) pellicle disc was suspended and maintained in green tea (0.5% w/v) and 80 g/L sucrose as a starter medium. The inoculated medium was covered with sterile gauze and fixed with rubber bands. The starter fermentation process was statically carried out in a thermostat at 28 ± 1 °C for seven days under static conditions. At the end of the cultivation period, the new pellicle covered the entire surface of the liquid area. It was used as a starter culture (inoculum) for the subsequent fermentation media. The starter culture was stored in the refrigerator at 0 °C in sterile plastic bottles as a nanocellulosic layer floating on its liquid phase surface.
Before use, the BNC pellicle was washed carefully with sterile Milli-Q water to remove surface impurities. After that, 3% (w/v) of a synthesized nanocellulosic pellicle and 10% (v/v) of starter medium were added to the sterilized (autoclave, 121 °C/20 min) and cooled (room temperature) fermentation media. The media pH was adjusted to 5.8 using sterile glacial acetic acid. Afterward, the flasks and jars were covered with sterile gauze fixed in place with a rubber band. Samples were cultured at 28 ± 1 °C in a thermostat for 14 days under static conditions.
2.3. Media and Fermentation Conditions
2.3.1. Preparation of Complex Media (Beetroot Peels)
To prepare a plant-based broth medium, 200 g of beetroot (BTR) peels were suspended in 500 mL of water and ground with a blender, model MMBM401W (Bosch, Gerlingen, Germany). Thus, 480 mL of the homogeneous mixture was prepared, and this procedure was repeated three more times. The four unique beetroot homogenate mixtures were combined and then mixed. The combined homogenate was passed through muslin cloth to remove the coarse particles. Then, the cloudy filtrate was filtered through filter paper using a water pump, separating the clear solution from the remaining solids. A clear solution was used as a microbiological broth medium, divided into equal portions, and sterilized in a steam autoclave for 20 min at 121 °C (Table 1).

Table 1.
BNC production media and sample coding according to the procedure.
2.3.2. Preparation of Chemically Defined Media
Standard Hestrin–Schramm (HS) medium was used as the primary medium: glucose, 2% w/v; yeast extract, 0.5% w/v; peptone, 0.5% w/v; Na2HPO4, 0.27% w/v; and citric acid, 0.115% (w/v). The medium pH was adjusted to 5.8 using 0.1 M NaOH or HCl.
The BNC production in the culture media prepared with different carbon sources was obtained by replacement of 2% glucose in standard HS media with 3% (w/v) of sucrose, glucose, and fructose (Table 1). Media were sterilized and inoculated with 3% (w/v) antecedent BNC pellicle and 10% (v/v) pre-cultured media. The 300 mL Erlenmeyer flasks containing 100 mL of media and the 200, 350, and 700 mL jars containing 50, 200, and 500 mL of media were covered with sterile gauze to ensure aerobic conditions. Fermentation was conducted at 28 °C for 14 days under static and aseptic conditions. The floating pellicles were removed every 48 h of fermentation to determine the BNC mass (g). BNC produced (g/L) in the medium with an adequate carbon source concentration was selected for further characterization. The experiments were performed in triplicate.
2.4. Analytical Methods
2.4.1. Determination of Macrocomponent Composition
The dry matter was determined according to the AOAC 930.15 method [33] by drying the sample until constant mass. The crude protein content was determined according to the AOAC 976.05 method [34], by the Kjeldahl protocol (6.25 was used as a conversion factor). The crude fat content was determined according to the AOAC 920.39 method [35], using the Soxhlet apparatus, and the crude mineral content was determined according to the AOAC 942.05 method [36].
2.4.2. Analysis of Sugar and Acid Concentrations
The concentrations of sugars (glucose, fructose, and sucrose) and acids (acetic acid and gluconic acid) were determined by HPLC (Shimadzu, Japan) using a Supelcogel C610H column (300 mm × 7.8 mm; Supelco Analytical, Bellefonte, PA, USA) and matching guard column (Supelcogel H Guard Column, 50 mm × 4.6 mm). Analytes were eluted isocratically with 0.1% phosphoric acid at a flow rate of 0.5 mL min−1 and 55 °C. Sugars were detected and quantified by a refractive index detector (Shimadzu RID-10). Organic acids were analyzed using a UV/Vis detector (Shimadzu SPD-M10Avp Diode Array Detector, Shimadzu, Kyoto, Japan).
2.4.3. pH and Total Acidity Analysis
The pH of the samples was measured daily using a calibrated pH meter (Hanna Industrial HI 98103). According to Kazimierczak et al. [37], the acidity was determined by titrating the fermented broth with 0.1 M NaOH until the pH reached 8.0. The total acidity was expressed as a percentage (v/v) of acetic acid by using the following Equation (1):
where V is mL of NaOH, M is the molarity of NaOH, and Vsample is the volume (mL) of the sample.
% Acidity = (V × M × 6/Vsample)) × 100
2.5. Dry Weight Content
BNC pellicles obtained after 14 days of stationary cultivation were weighed on analytical balance in a wet state and then dried to constant weight at 80 °C/12 h in air-dried oven. Subsequently, dry BNC pellicles were reweighed on an analytical balance, and dry weight was calculated from the following Equation (2):
2.6. Thickness of BNC Pellicle
The thickness of each BNC pellicle (75 × 75 mm) obtained from different C-sources was measured at five different positions using a Waterproof Digital Outside Micrometer (Insize Co., Ltd., Suzhou New District, China). The uniformity was determined as the standard deviation (SD) of the five measurements, and the results were expressed as mean ± SD.
2.7. Effect of Surface Area and Depth of Culture Medium on BNC Production
When investigating the surface area, vessels of different sizes were used to achieve different surface areas. Beetroot broth with a different sucrose concentration was prepared in jars and flasks with the following dimensions:
- (a)
- 300 mL Erlenmeyer flask (diameter, d = 8.7 cm; height, h = 15.6 cm; surface area, a = 59.4 cm2);
- (b)
- 370 mL jar (diameter, d = 10 cm; height, h = 6.5 cm; surface area, a = 33.2 cm2);
- (c)
- 720 mL jar (diameter, d = 9 cm; height, h = 12 cm; surface area, a = 77.1 cm2);
- (d)
- 1000 mL jar (diameter, d = 10 cm; height, h = 18 cm; surface area, a = 113.1 cm2).
HS media with different carbon sources (glucose, fructose, and sucrose) were prepared only in 300 mL Erlenmeyer flasks, and beetroot media were prepared in Erlenmeyer flasks and jars.
2.8. Purification of BNC Pellicle
The BNC pellicles with different shapes were withdrawn from the culture media using coarse filter paper and treated with 0.1 M NaOH (water bath) at 80 °C for 60 min. This procedure was repeated twice to remove attached cells and impurities embedded in the BNC matrix [38]. Then, the treated BNC pellicles were immersed in distilled water to remove components of the culture media and other residues and left until the pH of the water became neutral. Finally, the purified BNC pellicles were dried at 105 °C to constant weight. Concentration was determined as mass (g) of culture media’s BNC/volume (L).
2.9. Calculations
The efficiency of BNC production was evaluated after 14 days of cultivation. BNC yield (%) and BNC productivity (g/L/h) were calculated according to Equations (3) and (4):
where P is the amount of BNC produced (g), P0 is the initial pellicle mass (inoculum) of BNC (g), V is the media volume (L), and t is the reaction time (h).
2.10. Microstructural Characterization
2.10.1. Scanning Electron Microscopy (SEM)
Morphological analysis on the BNC surface was performed using SEM. Wet BNC pellicle samples were cut into thin slices, frozen at −70 °C, vacuum freeze-dried on Petri dishes in the form of a thin film, and cut into square slices (1 × 1 cm). A scanning electron microscope (SEM, Vega III Easyprobe, Tescan, Brno, Czechia) operating at 5 kV accelerating voltage was used to obtain micrographs of the BNC network and distribution of acetic acid bacteria and yeasts. Before the examination, samples were sputter-coated with gold and palladium, and after that, a microscope was used to examine the samples (magnification: 5000×). The ImageJ software (v. 1.46r) was used for image analysis. The processed images were converted to greyscale, 8-bit images and then analyzed as white color (255) and black color (0).
2.10.2. Fourier Transform Infrared Spectroscopy (FT-IR)
FT-IR was used to identify functional groups of BNC. FT-IR spectra of freeze-dried BNC samples were recorded using ALPHA-Transmittance FT-IR Spectrometer (Bruker, Karlsruhe, Germany). Spectra were measured between 4000 and 400 cm−1 with a spectral resolution of 1 cm−1, averaging 64 scans. The energy-dispersive spectroscopy (EDS) detector (XFlash 4010-M, Bruker, Karlsruhe, Germany) enabled a semi-quantitative elemental analysis of the samples.
2.10.3. X-ray Diffractometry Analysis (XRD)
The degree of crystallinity of produced BNC was analyzed and calculated from the diffracted intensity data obtained after X-ray diffractometry analysis using XRD 6000 (Shimadzu). Scans were performed over the 5°–40° 2θ range using steps of 0.02° in width. The Z-discriminant function for determining BNC’s crystalline structure (monoclinic and triclinic) was used according to the Wada et al. method [39]. The Z-value indicates whether cellulose is Iα or Iβ, and the function that discriminates between Iα and Iβ is given by Equation (5):
where d1 is the d-spacing of the peak (100) and d2 is the spacing of the peak (110). Z ˃ 0 indicates Iα, while Z ˂ 0 indicates the Iβ dominant allomorph of cellulose.
Z = 1693d1 − 902d2 − 594
The crystallite sizes (CrS) at d1, d2, and d3 were determined using Scherrer’s Equation (6) [40]:
where k is the dimensionless Scherrer’s constant = 0.9, λ is the X-ray incident wavelength, β is the full width at half maximum (FWHM) in radians, and (θ) is the Bragg diffraction angle at the corresponding lattice plane in radians.
The crystallinity index (CrI) was determined by the peak height method, developed by Segal et al. in 1959 [41], calculated through the following Equation (7):
where (I200) is the peak intensity at the 200 (2θ = 22.52°) plane and Iam is the minimum intensity at the valley between the 200 and 110 peaks (2θ = 18°).
The d-spacings between the crystal planes were determined and calculated using Bragg’s low Equation (8):
where (n) is the order of the peak plane, λ is the wavelength of the X-rays, d is the spacing between the crystal planes in the atomic lattice, and θ is the Bragg angle between the incident ray and the scattering planes [42].
2.11. Water-Holding Capacity (WHC) and Water Release Rate (WRR)
The samples’ water-holding capacity (WHC) was measured using the Schrecker and Gostomski method [43]. Three BC samples for each batch were cut into pieces with masses in the range of 0.3 to 0.4 g using tweezers. The samples were shaken twice quickly and then weighed. These samples were dried at room temperature for 48 h, and their weights were measured at different time intervals. Then, BC samples were dried at 60 °C for 12 h to obliterate water completely. Finally, they were quickly transferred to the balance for weighing the samples again. WHC was calculated by the following Equation (9):
where mw is the mass of water removed during drying (g) and BNCdw is the dry weight of BNC (g).
For the water release rate (WRR), the wet weight of BNC samples was measured, and then the samples stored at room temperature were continuously weighed until a constant dried weight was achieved. The weights of BNC samples at different time intervals were plotted against time [44].
2.12. Iodine Sorption Value (ISV)
According to Nelson et al. [41], iodine adsorption was determined by calculating the iodine sorption value (ISV). Briefly, 0.3 g cellulose fibers was added to 1.2 mL KI3 solution (5 g I2, 40 g KI, 50 mL H2O). After 3 min of stirring, 100 mL Na2SO4 (200 g/L) was added and stirred for four hours; every hour, samples (10 mL) were withdrawn and filtered. The iodine concentrations of the samples and the reference were determined by titration with Na thiosulfate (0.02 N Na2S2O3). The ISV is the amount of iodine adsorbed by a one-gram cellulose substrate and was calculated as (10):
where a is the volume (mL) of the Na2S2O3 solution (c = 0.01 mol/L) for blank titration, b is the volume (mL) of the Na2S2O3 solution (c = 0.01 M) for the titration of the sample solution, and ma is the weight of the absolute dry fiber sample (g). The constant c for cellulose = 1.33, and f is the aliquot factor for the Na2S2O3 solution determined by KMnO4 (0.02 mol/L).
A ratio of ISV per gram BNC to 412 (mg I2 absorbed per g of methylcellulose) determines the amorphous fraction of nanocellulose [45]. The crystallinity index (CrIISV) was calculated using the following Equation (11):
2.13. Statistical Analysis
The data were statistically analyzed by means of ANOVA tests and multiple range tests using Origin 2022 Software. The difference was considered significantly different at p ≤ 0.05.
3. Results and Discussion
3.1. Proximate Analysis of Complex Growth Medium (Beetroot Peels)
Microorganisms depend on favorable conditions for their growth, such as optimal pH, temperature, and adequate nutrients. Regarding the latter, the components of some vegetables can provide the necessary microbial nutrition upon their use in culture media. Vegetable stems and peels are often discarded or used in compost; however, these parts have a high nutritional value since vegetables have a considerable amount of starch and proteins, and their use could considerably reduce the cost of producing culture media [46].
This study aimed to present a possibility for the valorization of beetroot peels through their macronutrient composition and utilization for BNC production and characterization. Various commercial organic and conventional beetroot juices are reported to contain (per 100 g) total sugar, vitamin C, and flavonoids within a range of 1.73–8.58 g, 10.75–20.36 mg, and 2.02–2.36 mg, respectively [47]. The proximate composition of beetroot peels is presented in Table 2.
Table 2.
Proximate chemical composition of beetroot peels (g/100 g).
The beetroot peel contents of crude protein, ash, total fat, and crude fiber were 1.84% (w/w), 1.09% (w/w), 0.16% (w/w), and 2.35% (w/w), respectively. Among soluble sugars, sucrose was the dominant carbon source, represented in the peel as 4.65% (w/w). The high sucrose content is characteristic of beetroot since it is a root vegetable where energy is stored in the form of sucrose [48]. Glucose and especially fructose contents were significantly lower than the sucrose content, 1.59% (w/w) and 0.48% (w/w) in peels, respectively. The proximate composition of beetroot peels and the pomace is not well covered yet in the available literature, so it is impossible to make credible comparisons.
3.2. pH Values and Organic Acid Release
Each microorganism has an optimal pH range for its growth and BNC synthesis. The pH control of the culture medium was highly critical for high BNC productivity. Figure 1a shows the changes in pH for the fermentation media with different carbon sources as substrates during fermentation. The pH values of the fermentation media decrease during the process due to organic acid formation. As can be seen from Figure 1a, the decrease in pH values in two media (HS-Glc and HS-Suc) followed the reverse exponential law, with the most rapid decay at the beginning of fermentation (to the fourth day). The initial pH of all investigated media was 5.8, dropping to pH 3.6, 5.1, and 3.8 in glucose, fructose, and sucrose media, respectively, after four days of fermentation. In media with fructose as a sole carbon source (HS-Fru) and beetroot (BTR) media, a decrease in the pH values was less rapid. After the 4th day in the HS-Fru medium, the pH value increased to 5.4 on the 10th day. After the eighth day, the decrease in the other three media became much slower, turning into pH stagnation until harvest. When BNC was produced using fructose (HS-Fru), the acidic compounds in the growth medium were utilized through the Krebs cycle to generate energy and promote cell growth [49], so the pH increased after incubation (Figure 1a). It is considered that the optimal pH values range from 4.5 to 7.5, with the highest efficiency being around 6.5, while below the 3.5 value, BNC synthesis is inhibited [50]. However, Puspawati and Arihantana [51] proved that isolates from lactic acid bacteria from kombucha were resistant to a pH as low as 2.0. The acidity dropped when the previously fermented tea broth was added to inoculate the kombucha fermentation, preventing mold formation and protecting against undesirable microorganisms. However, the industrial production of BNC pellicles for biomedical applications (Biofill and Gengiflex) was conducted at low pH between 4.0 and 4.5 as this does avoid contamination of the medium during BNC culturing [52]. In BTR, medium acidity (% v/v) increased linearly with time from 3.1% to 9.64% at the end of fermentation (Figure 1b). Carbon metabolism resulted in the accumulation of acetic and gluconic acids and decreased pH value. However, there was no simple relation between the pH value of metabolites in the process and the content of acids. Previously, it has been reported that the rapid decrease in pH during fermentation does not enhance BNC production but is mainly due to increased organic acid content as the primary metabolite [53]. The content of the analyzed organic acids during the 14 days of kombucha fermentation was variable in time. Acetic and gluconic acids are the primary organic acids produced by acetic acid bacteria in kombucha (Figure 1b). The concentration of acetic acid during the fermentation process in the BTR medium increased due to glucose utilization by AAB. Despite the constant but slow rise from 0.21 g/100 mL, at the end of the process (the 14th day), the final acetic acid concentration was relatively low, 0.66 g/100 mL. Gluconic acid was the other major organic acid found in the metabolism of kombucha, but it was generated in higher concentrations than acetic acid. The increased gluconic acid concentration results in a decreased pH of the medium, reducing the intracellular pH value.
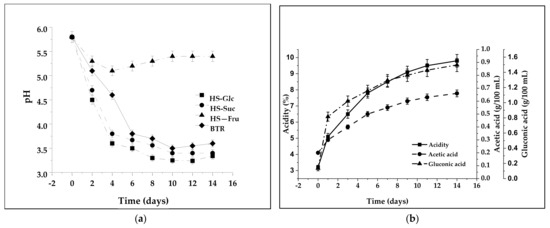
Figure 1.
Values of pH and acidity during kombucha fermentation: (a) changes in pH as a function of the carbon source; (b) changes in acidity and acetic acid and gluconic acid concentrations during kombucha fermentation in beetroot (BTR) media.
Consequently, reduced intracellular pH can change the activity and metabolic pathways responsible for BNC synthesis efficiency [54]. Therefore, the higher the initial glucose concentration, the higher the gluconic acid production, and its excess results in a significant reduction in BNC productivity as the medium pH becomes extremely acidic [55]. The initial concentration of gluconic acid in the BTR medium was lower than that of acetic acid, 0.12 g/100 mL, and on the first day of fermentation, the concentration rapidly rose to 0.87 g/100 mL. The final concentration was 1.49 g/100 mL (Figure 1b).
Such disparity in obtained results can be mainly associated with a microbiological variety of domestic kombucha starter cultures and the fermentation conditions. Therefore, maintaining the pH of the medium for the maximum yield of BNC is essential.
3.3. Fermentative Production of BNC
Usual factors affecting BNC production include growth medium, environmental conditions, and formation of by-products. Secretion of polysaccharides (BNC) is usually most noticeable when producing bacteria are supplied with abundant carbon and minimal nitrogen sources [56]. Initial sugar concentration and many different factors ought to affect the concentration of each metabolite produced in kombucha and the product’s chemical composition. The final sugar concentrations in each fermentation process can vary, indicating that various factors can regulate the effects, so the metabolism pathway is not usually equal [24]. The effect of various carbon sources from the chemically defined (HS) medium, i.e., monosaccharides (3% w/v glucose and 3% w/v fructose) and disaccharide (3% w/v sucrose), on the dry weight and yield of BNC produced was investigated. The same effect was investigated on a complex (BTR) medium, with 8% w/v sucrose as the primary carbon source and 2.5% w/v glucose and 0.86% w/v fructose represented in smaller quantities. Since different bacteria have diverse enzyme systems and metabolic differences, they can utilize various carbon sources for growth and BNC production at different levels of efficiency. The enhanced BNC production could depend on the effective utilization of carbon sources.
Three sugars were used here, glucose, fructose, and sucrose, and all of them produce moderate to high BNC yields in all media used. However, although structurally very similar, glucose and fructose gave surprisingly different BNC yields (Figure 2a,b). Glucose consistently produced high yields, whereas fructose often gave much lower yields of BNC (Figure 2a). As BNC production is proportional to cell growth, it may be that fructose cannot be utilized for cell growth as efficiently as glucose [57]. Unlike the other two monosaccharides, sucrose has been found to provide high yields among the carbon sources in HS and BTR media (Figure 2a,b).
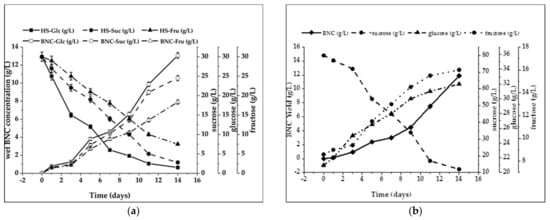
Figure 2.
Dynamics of BNC synthesis: (a) modified HS media; (b) BTR media.
Glucose was transported through the cell membrane and incorporated into the BNC biosynthetic pathway. However, one part of the glucose was converted into gluconic acid, which decreased the pH of the culture (Figure 1b), and another was incorporated into the BNC biosynthesis [58]. The current study showed that glucose was almost entirely metabolized in the fourteen days (95%) of the cultivation (Figure 1a) during intensive BNC biosynthesis. Such results are consistent with the results of Keshk and Sameshima [59], who reported that glucose was consumed rapidly in the early stage of cultivation and almost entirely (97%) after seven days of incubation. In our study, only 20% of glucose was metabolized at the time when the initial layer of BNC (1 mm) could be observed (second day). In contrast, fructose switched the pathway from the pentose cycle to the Krebs cycle, producing BNC without forming gluconic acid [60]. This statement could explain the increased efficiency in BNC production when fructose was used as the sole carbon source (Figure 2a). Sucrose is one of the most commonly added sugars in kombucha production [61]. Many sucrose media produced low levels of BNC after four days but high levels after seven days, indicating that there was an increased lag period for BNC production. However, an increased lag period was also observed here, where increased BNC production was obtained after three days of cultivation in both media (Figure 2a,b). Sucrose is the disaccharide of two hexose sugars, glucose and fructose. We hypothesize that BNC synthesis using sucrose requires an additional metabolic step to catalyze the hydrolysis of sucrose into glucose and fructose to achieve BNC production. However, despite the observed lag period, a high BNC level was observed after an exponential production rate (10.55 g/L) (Figure 2a). After 14 days of fermentation in a nutrient media with a single carbon source, such as modified HS media with 3% of glucose, fructose, or sucrose, BNC yields were 13.07 ± 0.69 g/L, 7.9 ± 0.42 g/L, and 10.55 ± 0.85 g/L, respectively (Figure 2a). In BTR media with 8% (w/v) sucrose, 2.5% (w/v) glucose, and 0.86% (w/v) fructose, BNC yield was slightly lower, 9.08 ± 0.41 g/L (Figure 2b).
As stated before, during incubation, sucrose added into kombucha as a carbon source is first hydrolyzed into glucose and fructose by invertase from the yeast. The fructose is then utilized as a substrate to produce ethanol and carbon dioxide via glycolysis by the yeast [8]. Bacteria metabolize fructose and ethanol to acetic acid [15,62]. Glucose generated will be further metabolized by acetic acid bacteria to produce gluconic acid via the pentose phosphate pathway [63,64]. In the BTR medium studied, sucrose content decreased from 80.09 g/L most rapidly and reached the lowest value of 12.1 g/L on the 14th day. Goh et al. [52] investigated the effect of sucrose concentration when fermenting kombucha on the yield of BNC produced. When the kombucha fermentation was conducted under static conditions, with sucrose concentrations between 50 and 250 g/L, the highest yield of 6.69% was found for the systems containing 90 g/L sucrose. However, Malbaša et al. [65] argue that 70 g/L of sucrose is the optimum concentration. When a substantial amount of sugar is used, more metabolic products are produced, leading to product inhibition and, therefore, a hindrance to cellulose synthesis. The concentration of carbon in combination with various sources influences the formation of ethanol and lactic, acetic, gluconic, and glucuronic acids in the metabolites. That also influences the yield of cellulose when using different carbon sources in the culture used. Malbaša et al. [65] and Goh et al. [52] claim that the starter culture depends on the carbon source supply.
Interestingly, the BTR medium initially contained 2.5% (w/v) glucose, a slightly higher amount than in the standard HS medium. The content of the reducing sugars increased during fermentation. The most significant amounts of glucose and fructose were produced on each fermentation day. Afterward, results revealed that the fructose content during fermentation is lower than glucose content, suggesting that fructose was preferred as the carbon source by yeast cells. Studies by Sievers et al. [66] and Neffe-Skocinska et al. [61] also indicate that after 23 h fermentation of kombucha tea at 20–22 °C, 88% of fructose and only 40% of glucose were metabolized into ethanol. It seems that the type of metabolic activity of yeasts determines the conversions of these sugars during fermentation [67]. Yeast cells and AAB use substrates for fermentation in different and complementary ways. AAB uses glucose to produce gluconic acid and ethanol to produce acetic acid [8,67]. The precise mechanism of biochemical changes during the fermentation of sugared media with the symbiotic system of yeast–AAB is complex, so the order and detailed image of these changes are not fully understood. However, a range of studies on the chemical composition of kombucha was performed [5].
The highest BNC yield (13.07 ± 0.08 g/L) was obtained by using glucose as a sole carbon source (Table 3). It was found that glucose as the sole carbon source gave a very high consumption rate (90.67 ± 1.88%), almost wholly depleted during cultivation (Figure 2a). However, 10.55 ± 0.05 g/L BNC was produced in media with sucrose as the sole carbon source, with a consumption rate of 95.02 ± 3.01%, which is the best result obtained. Only 7.9 ± 0.21 g/L of BNC was obtained in a medium with fructose as a sole carbon source, with a 75.03 ± 2.12% consumption rate. In terms of metabolic yields, glucose gave the highest metabolic yield of BNC at 36.31 ± 0.31 g/mol C, which was approximately 1.82-fold and 1.05-fold of that of the fructose and sucrose medium, respectively (Table 3). Zhong et al. [68] investigated the production of BNC on glycerol, glucose, and fructose as sole carbon sources. They found that glucose also gave a higher consumption rate (90.67 ± 3.3%) than fructose (54.70 ± 2.3%) and sucrose (48.49 ± 3.5%). It gave metabolic yields that were approximately 1.66-fold and 1.87-fold of those of fructose and sucrose, respectively.
Table 3.
BNC productivity in fermentations with different carbon sources.
As shown in Figure 2b, the BNC production in the BTR medium was lower than that using sucrose as a sole carbon source. After three days of fermentation, the consumption rate of sucrose from a mixed carbon source was 85.04 ± 2.56%, with a BNC yield of 11.89 ± 0.18 g/L and a metabolic yield of BNC at 13.83 ± 0.29 g/mol C (Table 3). The lower result can be explained by the fact that glucose and fructose were not consumed during cultivation. Malbaša et al. [65] have shown that lower BNC yields are obtained at concentrations of sucrose higher than 90 g/L.
Figure 3 illustrates the effect of the carbon source on the thickness of the synthesized BNC. The first, eye-visible thin layer of synthesized pellicle was observed from the second day of cultivation. The layer’s height of the BNC constantly increased up to the end of cultivation (Figure 3). The thickness of the BTR BNC pellicle increased linearly until the seventh day (16 mm), after which a slight stagnation in the increase in thickness was observed, which continued until the end of cultivation (22 mm). The highest rate of synthesis and the greatest BNC pellicle thickness were achieved in the HS-Glc medium, where the thickness at the end of cultivation was 25 mm. BNC synthesized in HS-Fru had the most negligible pellicle thickness at the end of cultivation (15 mm), with a slight stagnation in the increase on the 11th day of cultivation. The synthesis of BNC in the HS-Suc substrate was the slowest for the first three days, with a pellicle thickness of only 2 mm, after which it grew linearly and reached a value of 20 mm at the end of the process. BNCs with different thicknesses have distinct application potential. The control of this parameter can be important for choosing their application, and it is achieved simply by choosing the carbon sources.
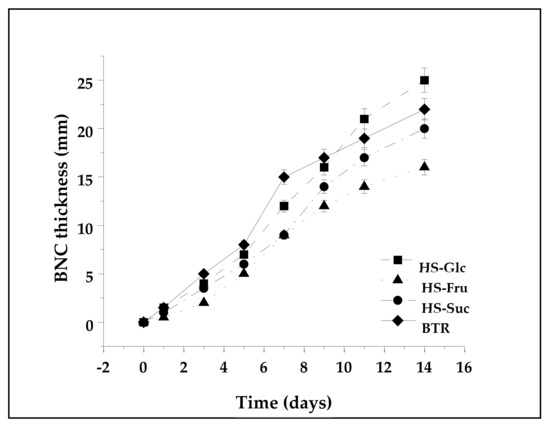
Figure 3.
The kinetic pattern of BNC pellicle synthesis in media with different C-sources.
There is no direct relationship between the weight (wet or dry) and the thickness of BNCs. In our work, the thickness of BNC obtained from pure glucose was lower than that obtained from complex BTR carbon sources, but BNC from a complex medium had a greater dry weight than that from the HS-Glc medium (Figure 4). This was probably related to the distinct structure of BNCs produced in different carbon media.
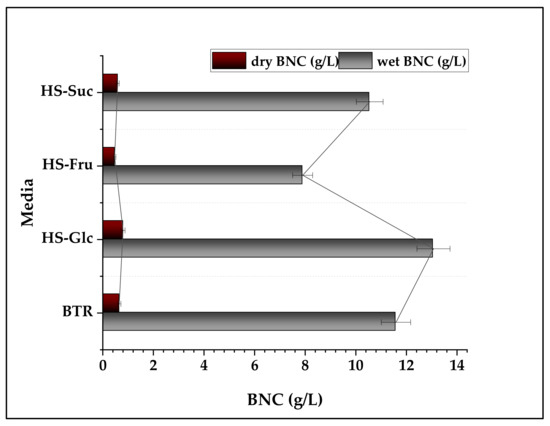
Figure 4.
Effect of different carbon sources on BNC moisture content.
3.4. Effect of Surface Area and Depth of Culture Medium on BNC Production
Considering BNC production, it is essential to emphasize that media composition, pH value, and temperature are not the only factors influencing the overall pellicle yield. Factors such as the shape of a vessel or bioreactor, surface area, and medium volume for static cultures are also essential. When grown in static culture conditions, the BNC forms a thick pellicle at the air–liquid interface as the aerobic bacteria produce nanocellulose only in the vicinity of the media surface [69]. When the BNC pellicle floats on the surface, it grows outwards until the solution’s surface is entirely covered. Followed by this, it grows layer by layer. Because of that, the upper layer is always the newest one [52]. Optimal aeration or air contact of the culture medium determined by the surface area/volume depth ratio (a/h) is also an essential factor affecting BNC synthesis in static culture cultivation. Therefore, it seems that the greater the surface area of the media for the BNC to spray across, the greater the amount of BNC that should be produced. A range of different-sized jars and flasks were used to achieve varying surface areas. When a small volume of the media was used (100 mL), the depth in the jar was shallow, and the BNC was only produced as a skinny layer and was limited in its yield. Greater volumes of 200 mL to 800 mL allowed a relationship between surface area and BNC yield (Table 4). Provided enough media was used to allow sufficient depth, the highest BNC was obtained from the largest jars and flasks with the largest surface area.
Table 4.
Influence of surface area and culture medium depth ratio on the BNC yield after 14 days of cultivation in HS-Glc medium.
In order to confirm the previous observation that there was no increase in BNC yield cultured in larger volumes of media, a variety of media volumes were tested (Table 4). Results clearly showed that the 1000 mL volume glass jar (800 mL media), with a surface area of 113.1 cm2 and a/h ratio of 9.82, produced the highest yield of BNC (12.09 g/L). The 600 mL and 100 mL round jar and flask followed this, with surface areas of 77.1 and 59.4 cm2, giving BNC yields of 10.09 and 5.11 g/L, respectively. The 370 mL rectangular jar with 200 mL medium and a surface area of 33.2 cm2 yielded only 8.92 g/L BNC. Thus, the results show that surface area played a more significant role in the BNC formation than the culture medium’s volume. Obtained results from the Erlenmeyer flask (300 mL volume, 100 mL media volume) showed that the form of the vessel with a tapered wall, such as that of an Erlenmeyer conical flask, does not influence BNC pellicle layer formation, as proposed by Masaoka et al. [70].
The effect of the depth of the nutritive medium on BNC production was examined by synthesizing the household tea fungus in jars and flasks with different volumes and depths (Table 4). When the depth of the fermenting medium was not significantly different (e.g., 4.5 cm and 6.5 cm), the production of BNC depended mainly on the volume of the medium. At a depth of 6.5 cm (200 mL volume), the culture medium produced almost 2 times more BNC (8.92 g/L) than at a depth of 4.5 cm (100 mL volume), 5.11 g/L of BNC. However, at a depth of 12 cm, the BNC yield was slightly higher (10.09 g/L). The obtained results agree with those of Goh et al. [52] and Okiyama et al. [71], who found that a deep column container generated a small amount of bacterial cellulose. The amount of trapped carbon dioxide could explain these observations in the pellicle. The deeper the culture medium, the more carbon dioxide accumulates in the pellicle. The pellicle is less aerobic, so the cell growth and pellicle formation are inhibited because acetic acid bacteria are obligate aerobes. Therefore, the culture medium’s surface area/depth ratio is vital in BNC formation.
3.5. BNC Morphology (SEM)
The macroscopic appearance of the BNC from cultures based on the beetroot and HS media was similar, visible as gelatinous pellicles formed on the surface of the liquid phase of the culture medium. BNC produced in the static cultivation method seems to be a hydrogel sheet with a three-dimensional (3D) reticulated network structure, which could be observed under an electron microscope [72].
To date, kombucha fermentation primarily relies on the autochthonous microbiota embedded within the biofilm. New layers are generated during each fermentation of the in-house microbiota from the production environment or equipment. AAB populations were particularly active in the floating biofilm, as the highest population increase was observed for this group. The morphological structures of produced BNC biofilms were analyzed using scanning electron microscopy (SEM) (Figure 5 and Figure 6). The micrographs in Figure 5a,b reveal spherical-shaped yeast cells and rod-shaped Gram-negative bacteria cells. Bundles of nanocellulose microfibrils extending directly from the cell surface were observed, forming a three-dimensional pellicle at the air–liquid interface (Figure 5b).
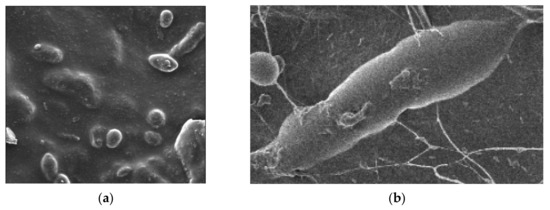
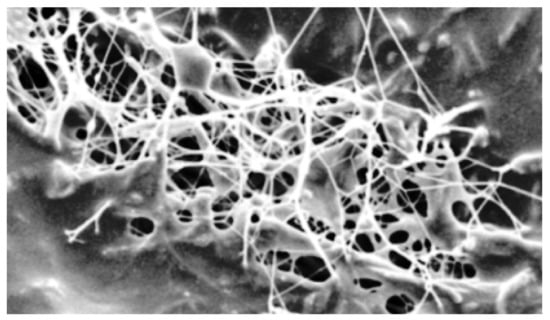
Figure 6.
SEM image of BNC sample produced in BTR medium (10k magnification).
Regardless of the medium used to produce BNC, the structures of BNC films are formed by cellulose fibrils intertwining into a 3D structure. The BNC film produced using a standard HS medium shows a disoriented multilayered porous structure of intertwined fibrils (not shown). The scanning electron microscopy (SEM) micrograph of the BNC synthesized on the BTR media is shown in Figure 6. The sample exhibited a three-dimensional reticulated structure consisting of ultrafine cellulose fibrils. BNC produced in the BTR medium is characterized by a circular-pore structure formed by ribbon fibril networks. The surface morphology shows that BNC showed a relatively less dense and more porous structure, resulting in the very high WHC value BTR (119 ± 1 g/g).
3.6. FT-IR Spectra
Fourier transform infrared (FT-IR) spectra of BNC samples were obtained to detect any peak shift attributed to BNC produced in different media. All spectra showed the characteristic bands of the cellulose I crystal structure. Figure 7 shows a spectrum between 400 and 4000 cm−1 containing several distinct regions. These regions contain peaks of individual chemical vibrational modes typical of IR spectra recorded from nanocellulose of bacterial origin and relevant to the measurement of the crystallinity of BNC (Table 5). The stretching vibrations of the hydroxyl groups of alcohol appear as broad absorption bands in the range from 3600 to 3200 cm−1. In the IR spectra of all four compounds (Figure 7), an absorption band at 3350 cm−1 is visible, which is attributed to the hydroxyl group. The intensity of this absorption band is strong and broad, which may indicate the presence of associated hydroxyl groups in the compounds of the studied samples [73].
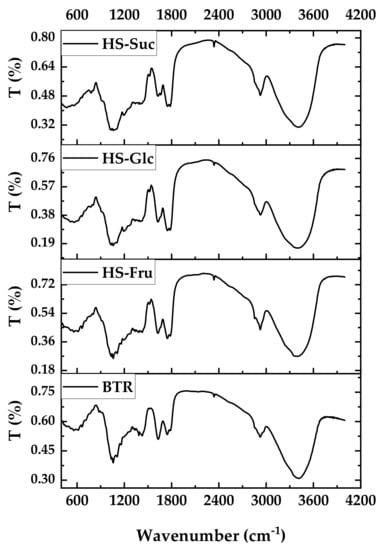
Figure 7.
FT-IR spectra of BNC produced in BTR and HS media.
Table 5.
Values of beetroot BNC FT-IR spectra wavenumber attributed to the chemical activities.
Alkanes (saturated compounds) show absorption bands between 2800 and 3000 cm−1, as this range is characteristic of the stretching frequencies of the C–H bond [74]. Bands of weak intensity around 2936 cm−1 are found in all four fractions, which are attributed to the stretching frequency of the C–H bond.
Another relatively weak peak is located at 1627 cm−1, corresponding to the bending vibration of water molecules (H-O-H) absorbed in the biopolymer structure. The most complex region of BNC FT-IR spectra is the fingerprint region, which ranges from 1430 cm−1 to about 850 cm−1. It contains signals from the numerous sp3 single-bond vibrational modes. The signal at 1380 cm−1 is attributed to symmetric CH2 stretching and out-of-plane vibration of CH2 groups [74]. FT-IR spectra show four intense signals in the fingerprint region (1160–1040 cm−1), which correspond to C-O-C antisymmetric bridge stretching of β-1,4-glycosidic bonds, C-C and C-O stretching vibrations, and C-O-H bending of carbohydrates. The absorption bands in the 1100 to 1030 cm−1 part of the spectrum correspond to the stretching frequency of the C–O single bond [75]. In three fractions, a medium-strength absorption band at 1042 cm−1 can be assigned to the ether bond present in the carbohydrates. The assigned absorption band of very weak intensity at 669 cm−1 in the spectra of all samples confirms the presence of a β-1,4-glycosidic bond [76].
3.7. XRD Analysis
Cellulose is a semi-crystalline material that has both crystalline and amorphous regions. High crystallinity is one of the essential properties of BNC in various industries. Figure 8 shows the X-ray diffractograms of the BNC prepared on the standard HS and BTR media. They show the appearance of three prominent peaks, d1, d2, and d3, or the presence of both Iα and Iβ crystal nanocellulose. The peak d1 appeared at 2θ = 14.59 and was assigned to the level (100) of Iα or the level (1.10) of Iβ. Peak d2 is detected at 2θ = 16.86 and assigned to the (010) level of Iα or (110) level of Iβ. The d3 at 2θ = 22.55 could be a contribution of the (110) plane of Iα or the (200) plane of cellulose Iβ. Figure 8a,b show that the XRD profiles of the sample are similar to those of the native cellulose prepared by Castro et al. [77]. The strong uniplanarity is due to the preferential alignment of the nanocellulose bands parallel to the pellicle surface during drying [78]. The variation in relative peak intensity between profiles may also be related to slight differences in the alignment of the chains in the samples.
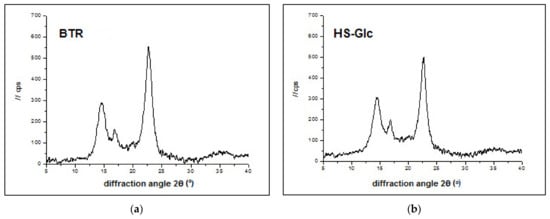
Figure 8.
X-ray diffraction spectra of BNC produced in different culture media: (a) beetroot and (b) modified HS medium with glucose as the sole carbon source.
Calculated interplanar crystal distances (d-spacings) and crystallite sizes are listed in Table 6. The d1 spacings of the beetroot samples are lower than those of the HS BNC. In addition, the crystallite sizes are also smaller than those of the HS-Glc BNC samples. Differences in d-spacings are associated with differences in the cross-sectional dimensions of cellulose crystallites [79].
Table 6.
Parameters obtained from the XRD analysis of the BNC studied.
The rigidity of nanocellulose fibers increases and their flexibility decreases as the ratio of crystalline to amorphous regions increases [80]. Crystallinity increases with increasing crystallite sizes as the crystallite surface area corresponding to amorphous regions is reduced [81]. The BNC prepared on the beetroot medium exhibited higher CrI (89%) than that of the standard HS medium (81%) (Table 6). In this study, the Z-discriminant function [39] was used to determine the type of crystalline structure (monoclinic or triclinic) of cellulose in natural fibers. As seen in Table 6, the Z values for BNCs obtained indicate that the nanocellulose in these fibers was of the dominant Iα type.
The data in Table 6 were used to propose a cross-sectional geometry of the microfibrils synthesized by the microorganisms. The results for the beetroot samples are shown in Figure 9. In this arrangement, the crystallites are ribbon-shaped, have a cross-section of approximately 13 nm × 6.6 nm, and contain between 180 and 200 chains. HS BNC samples exhibited a larger crystallite size, 20 nm × 6.7 nm. The differences in these parameters between samples may be related to differences in the composition of the culture medium, which may affect the arrangement of the chains within the crystallite [77]. In our study, such substances may have been present in the agroindustrial waste, namely beetroot peels, which contain various carbohydrates such as sucrose, glucose, and fructose [38].
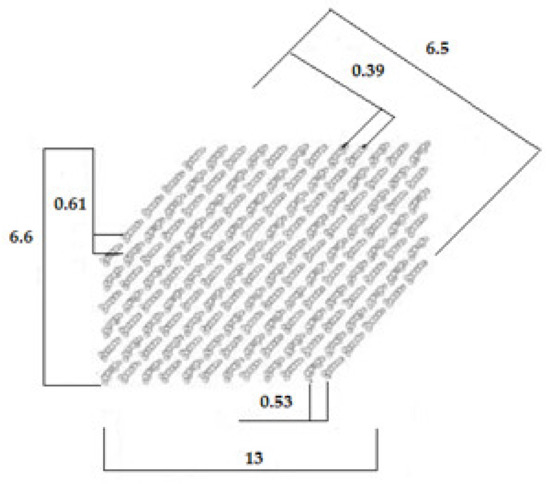
Figure 9.
Suggested cross-section of the BTR BNC crystallites. The dimensions, given in nm, were calculated from the width of the X-ray diffraction peaks using Scherrer’s equation (Table 6).
In addition, many reports explained the influence of the culturing parameters, such as the bacterial strain, temperature, incubation time, and state or medium constituents, on the properties of the produced BNC [82,83]. By studying BTR medium as a non-conventional media in BNC production, we found that the chemical composition of the produced BNC was not greatly affected.
3.8. Water-Holding Capacity (WHC), Water Release Rate (WRR), and Iodine Sorption Value (ISV)
BNC has many intrinsic characteristics that make it an ideal scaffold for injured tissue protection through wound dressing and regeneration, especially for burned tissues, and as temporary tissue substitutes. It can retain moisture, absorb exudates from the injured tissue, and accelerate granulation, enabling an easy and painless dressing change without damaging the newly formed skin. This is crucial because the penetration of active substances into the wound is facilitated by a moist environment [84,85].
Okiyama et al. [71] showed that BNC consisted of nanocellulose fibrils (0.9%), bound water (0.3%), and free water (98.8%). Gelin et al. [86] reported that the bulk-like water is confined in “lakes” rather than forming a continuous phase throughout the matrix. Water desorption isotherms suggest that these “lakes” decrease in size with increasing oxygen concentration used during the biosynthesis process of the gels. Less porous materials can retain liquid longer in the nanocellulose matrix. The compact structure bonds water molecules more efficiently due to the stronger hydrogen bonding interactions; tight fiber arrangement results in a smaller amount of free water according to Ul-Islam et al. [44].
The water-holding capacity (WHC) and water release rate (WRR) are the most important physical characteristics of BNC pellicles regarding the biomedical application of BNC as a wound dressing material [1]. The variations between the WHCs are related to each BNC’s porosity and surface area. The greater the surface area and the pore size, the more significant the amount of water that penetrated and was trapped in the BNC matrix [40]. Figure 5 shows the WHC and WRR of the BNC produced in different media. The WHC of HS-Suc is the highest (140.1 ± 4 g/g) of all BNC samples, followed by BTR (119 ± 1 g/g) and HS-Glc (105.2 ± 3 g/g). The lowest WHC was obtained with HS-Fru (86.9 ± 1 g/g) (Figure 10a). The quantity of water molecules penetrating the nanocellulose matrix and diffusing into amorphous regions depends mainly on the strength of the physical adsorption and the size and number of pores in BNC pellicles [54].
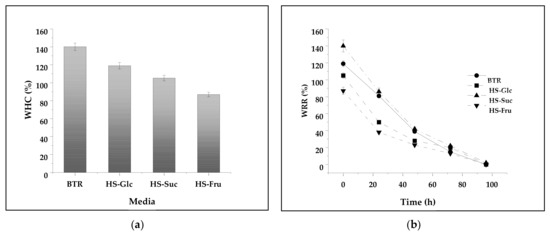
Figure 10.
Changes in specific water content (g) in BNC (g) produced in different media: (a) water-holding capacity (WHC); (b) water release rate (WRR) of the BNC pellicles.
As known, the adsorption properties of BNC fibers are closely related to the portion of amorphous regions in the fibers. The iodine sorption test is generally considered an empirical measure of cellulose accessibility. It was initially proposed as a method to determine the degree of mercerization. Later, the application was extended to determine cellulose fiber’s crystallinity [87].
The iodine sorption value (ISV) represents the amount of iodine adsorbed from one gram of nanocellulose substrate. The iodine binds only to less-ordered amorphous regions of BNC. Therefore, the amount of adsorbed iodine diminished with increasing crystallinity. Figure 11 represents ISV values (mg/g) and calculated crystallinity index (CrIISV) of BNCs produced in media with different carbon sources. ISV values show that the smallest amount of iodine has been bound to BTR BNC (52.12 ± 2.61 mg/g) and the highest amount of iodine has been bound to HS-Fru BNC (149.9 ± 7.5 mg/g) and HS-Suc BNC (124.0 ± 6.2 mg/g). HS-Glc BNC binds 30% more iodine than BTR BNC, 78.21 ± 3.91 mg/g.
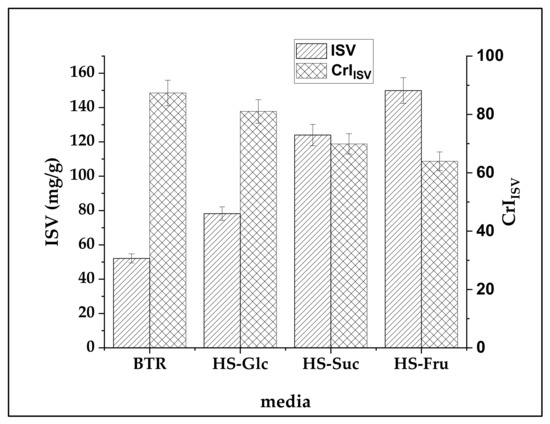
Figure 11.
Iodine sorption value (ISV) of BNC and crystallinity index (CrIISV) calculated from ISV.
Since iodine anions adsorb only amorphous regions of nanocellulose fiber, the ISV is inversely proportional to the crystalline regions, expressed by the crystallinity index, CrIISV. Hence, the smallest amount of iodine should be bound by fibers with the highest portion of crystalline regions [88].
Due to the introduction of aldehyde groups and subsequent crosslinking, the degree of crystallinity of the viscose fibers increased during the oxidation, as indicated by a lowering of ISV. The crystallinity index of the BNC samples, calculated on the basis of the ISV (Equation (4)), increased from 63.6–69.9% for the HS-Fru and HS-Suc BNC to 81.02–87.35% for the HS-Glc and BTR BNC samples (Figure 11). It could be supposed that a higher increase in crystallinity involves the reorganization of the less-ordered amorphous fraction of the oxidized samples due to the crosslinking effect.
4. Conclusions
This study deals with BNC production with a local kombucha starter symbiotic culture using an already available substrate, vegetable-processing waste (beetroot peels), yielding a value-added product. Using such media for BNC production will reduce the cost of production, making it available in large quantities for application in different industries. The need for bacterial cellulose in large quantities, especially in the wet state, has increased in biomedicine, where several increasing applications, such as its use as tissue implants or wound scaffolds, are at the forefront. We explored the potentiality of the beetroot peel as a carbon source compared to commercial and modified HS media with different C-sources (glucose, fructose, and sucrose) for BNC synthesis. After 14 days of static cultivation, the BTR media achieved a high BNC yield but a low substrate conversion ratio. The BTR BNC and HS-Glc BNC pellicles showed almost the exact size of nanofibers under SEM analyses. XRD diffraction revealed a slight variation in crystallinity indexes and crystallite size. However, the FT-IR spectra show an identical chemical profile assigned to cellulose I. Water-holding capacity revealed the incredible versatility of the produced BNCs, and this versatility indicates the feasibility of implementation in diverse applications.
Author Contributions
Conceptualization, S.B. and F.H.; methodology, F.H.; software, F.H.; validation, S.B., S.D. and F.H.; formal analysis, F.H.; investigation, F.H. and A.L.P.; resources, S.B.; data curation, F.H.; writing—original draft preparation, F.H., A.L.P., S.D. and S.B.; writing—review and editing, S.D. and S.B.; visualization, F.H.; supervision, S.B.; project administration, S.B.; funding acquisition, S.B. All authors have read and agreed to the published version of the manuscript.
Funding
This research was funded by the Croatian Science Foundation under the project “Sustainable production of biochemicals from waste lignocellulose containing feedstocks” (Croatian Science Foundation No. 9717).
Informed Consent Statement
Informed consent was obtained from all subjects involved in the study.
Data Availability Statement
Not applicable.
Conflicts of Interest
The authors declare no conflict of interest.
References
- Phuong, H.T.; Thoa, N.K.; Tuyet, P.T.A.; Van, Q.N.; Hai, Y.D. Cellulose Nanomaterials as a Future, Sustainable and Renewable Material. Crystals 2022, 12, 106. [Google Scholar] [CrossRef]
- Avcioglu, N.H. Bacterial cellulose: Recent progress in production and industrial applications. World J. Microbiol. Biotechnol. 2022, 38, 86. [Google Scholar] [CrossRef]
- Teoh, A.L.; Heard, G.; Cox, J. Yeast Ecology of Kombucha Fermentation. Int. J. Food Microbiol. 2004, 95, 119–126. [Google Scholar] [CrossRef]
- Jarrell, J.; Cal, T.; Bennett, J.W. The Kombucha consortia of yeasts and bacteria. Mycologist 2000, 14, 166–170. [Google Scholar] [CrossRef]
- Kallel, L.; Desseaux, V.; Hamdi, M.; Stocker, P.; Ajandouz, E.H. Insights into the Fermentation Biochemistry of Kombucha Teas and Potential Impacts of Kombucha Drinking on Starch Digestion. Food Res. Int. 2012, 49, 226–232. [Google Scholar] [CrossRef]
- Ayed, L.; Abid, S.B.; Hamdi, M. Development of a beverage from red grape juice fermented with the kombucha consortium. Ann. Microbiol. 2017, 67, 111–121. [Google Scholar] [CrossRef]
- Nikolaev, Y.A.; Plakunov, V.K. Biofilm—“City of Microbes” or an analogue of multicellular organisms. Microbiology 2007, 76, 125–138. [Google Scholar] [CrossRef]
- Jayabalan, R.; Malbaša, R.V.; Lončar, E.S.; Vitas, J.S.; Sathishkumar, M. A review on Kombucha tea-microbiology, composition, fermentation, beneficial effects, toxic-ity, and tea fungus. Compr. Rev. Food Sci. Food Saf. 2014, 13, 538–550. [Google Scholar] [CrossRef] [PubMed]
- Soemphol, W.; Hongsachart, P.; Tanamool, V. Production and characterization of bacterial cellulose produced from agricultural by-product by Gluconacetobacter strains. Mater. Today Proc. 2018, 5, 11159–11168. [Google Scholar] [CrossRef]
- Urbina, L.; Corcuera, M.A.; Gabilondo, N.; Eceiza, A.; Retegi, A. A review of bacterial cellulose: Sustainable production from agricultural waste and applications in various fields. Cellulose 2021, 28, 8229–8253. [Google Scholar] [CrossRef]
- Ul-Islam, M.; Ullah, M.W.; Khan, S.; Shah, N.; Park, J.K. Strategies for cost-effective and enhanced production of bacterial cellulose. Int. J. Biol. Macromol. 2017, 102, 1166–1173. [Google Scholar] [CrossRef] [PubMed]
- Jozala, A.F.; De Lencastre-Novaes, L.C.; Lopes, A.M.; De Carvalho Santos-Ebinuma, V.; Mazzola, P.G.; Pessoa, A., Jr.; Grotto, D.; Gerenutti, M.; Chaud, M.V. Bacterial nanocellulose production and application: A 10-year overview. Appl. Microbiol. Biotechnol. 2016, 100, 2063–2072. [Google Scholar] [CrossRef]
- Moniri, M.; Boroumand Moghaddam, A.; Azizi, S.; Rahim, R.A.; Bin Ariff, A.; Zuhainis Saad, W.; Navaderi, M.; Mohamad, R. Production and Status of Bacterial Cellulose in Biomedical Engineering. Nanomaterials 2017, 7, 257. [Google Scholar] [CrossRef]
- Ullah, H.; Wahid, F.; Santos, H.A.; Khan, T. Advances in biomedical and pharmaceutical applications of functional bacterial cellulose-based nanocomposites. Carbohydr. Polym. 2016, 150, 330–352. [Google Scholar] [CrossRef] [PubMed]
- Azeredo, H.M.C.; Barud, H.; Farinas, C.S.; Vasconcellos, V.M.; Claro, A.M. Bacterial Cellulose as a Raw Material for Food and Food Packaging Applications. Front. Sustain. Food Syst. 2019, 3, 7. [Google Scholar] [CrossRef]
- Fernandez Santos, J.; Gala Morena, A.; Valenzuela, S.V.; Pastor, F.I.J.; Diaz, P.; Martinez, J. Microbial cellulose from Komagataeibacter intermedius strain isolated from commercial wine vinegar. J. Polym. Environ. 2019, 27, 956–967. [Google Scholar] [CrossRef]
- Ul-Islam, M.; Khan, S.; Ullah, M.W.; Park, J.K. Bacterial cellulose composites: Synthetic strategies and multiple applications in bio-medical and electro-conductive fields. Biotechnol. J. 2015, 10, 1847–1861. [Google Scholar] [CrossRef]
- Kaminski, K.; Jarosz, M.; Grudzien, J.; Pawlik, J.; Zastawnik, F.; Pandyra, P.; Kołodziejczyk, A.M. Hydrogel bacterial cellulose: A path to improved materials for new eco-friendly textiles. Cellulose 2020, 27, 5353–5365. [Google Scholar] [CrossRef]
- Alves, A.A.; Silva, W.E.; Belian, M.F.; Lins, L.S.G.; Galembeck, A. Bacterial Cellulose Membranes for Environmental Water Remediation and Industrial Wastewater Treatment. Int. J. Environ. Sci. Technol. 2020, 17, 3997–4008. [Google Scholar] [CrossRef]
- Kumbhar, J.V.; Rajwade, J.M.; Paknikar, K.M. Fruit peels support higher yield and superior quality bacterial cellulose production. Appl. Microbiol. Biotechnol. 2015, 99, 6677–6691. [Google Scholar] [CrossRef]
- Premjet, S.; Premjet, D.; Ohtani, Y. The effect of ingredients of sugar cane molasses on bacterial cellulose production by Acetobacter xylinum ATCC 10245. Sen’i Gakkaishi 2007, 63, 193–199. [Google Scholar] [CrossRef]
- Sperotto, G.; Stasiak, L.G.; Godoi, J.P.; Gabiatti, N.C.; De Souza, S.S. A review of culture media for bacterial cellulose production: Complex, chemically defined and minimal media modulations. Cellulose 2021, 28, 2649–2673. [Google Scholar] [CrossRef]
- Hussain, Z.; Sajjad, W.; Khan, T.; Wahid, F. Production of bacterial cellulose from industrial wastes: A review. Cellulose 2019, 26, 2895–2911. [Google Scholar] [CrossRef]
- Chen, C.; Liu, B.Y. Changes in major components of tea fungus metabolites during prolonged fermentation. J. Appl. Microbiol. 2000, 89, 834–839. [Google Scholar] [CrossRef]
- Lu, Z.; Zhang, Y.; Chi, Y.; Xu, N.; Yao, W.; Sun, B. Effects of alcohols on bacterial cellulose production by Acetobacter xylinum 186. World J. Microbiol. Biotechnol. 2011, 27, 2281–2285. [Google Scholar] [CrossRef]
- Jedrzejczak-Krzepkowska, M.; Kubiak, K.; Ludwicka, K.; Bielecki, S. Bacterial NanoCellulose Synthesis, Recent Findings. In Bacterial Nanocellulose: From Biotechnology to Bio-Economy; Gama, M., Dourado, F., Bielecki, S., Eds.; Elsevier: New York, NY, USA, 2016; pp. 19–46. [Google Scholar] [CrossRef]
- Herceg, F. Biosynthesis of bacterial cellulose assisted by symbiosis of osmophilic yeasts and acetic acid bacteria. Bachelor’s Thesis, Faculty of Food Technology and Biotechnology, University of Zagreb, Zagreb, Croatia, 14 July 2017. [Google Scholar]
- Zubaidah, E.; Dewantari, F.J.; Novitasari, F.R.; Srianta, I.; Blanc, P.J. Potential of snake fruit (Salacca zalacca (Gaerth.) Voss) for the development of a beverage through fermentation with the Kombucha consortium. Biocatal. Agric. Biotechnol. 2018, 13, 198–203. [Google Scholar] [CrossRef]
- Šeremet, D.; Durgo, K.; Jokić, S.; Huđek, A.; Vojvodić-Cebin, A.; Mandura, A.; Jurasović, J.; Komes, D. Valorization of Banana and Red Beetroot Peels: Determination of Basic Macrocomponent Composition, Application of Novel Extraction Methodology and Assessment of Biological Activity In Vitro. Sustainability 2020, 12, 4539. [Google Scholar] [CrossRef]
- Zin, M.M.; Alsobh, A.; Nath, A.; Csighy, A.; Bánvölgyi, S. Concentrations of Beetroot (Beta vulgaris L.) Peel and Flesh Extracts by Reverse Osmosis Membrane. Appl. Sci. 2022, 12, 6360. [Google Scholar] [CrossRef]
- Ceclu, L.; Nistor, O.-V. Red Beetroot: Composition and Health Effects—A Review. J. Nutr. Med. Diet. Care 2020, 6, 43. [Google Scholar] [CrossRef]
- Hestrin, S.; Schramm, M. Synthesis of cellulose by Acetobacter xylinum. II. Preparation of freeze-dried cells capable of polymerizing glucose to cellulose. Biochem. J. 1954, 58, 345–352. [Google Scholar] [CrossRef]
- Padmore, J.M. Animal feed—AOAC official method 930.15—Moisture in animal feed. In Official Methods of Analysis, 15th ed.; Helrich, K., Ed.; AOAC International: Arlington, VA, USA, 1990; Volume 1, pp. 69–70. [Google Scholar]
- Padmore, J.M. Animal feed—AOAC official method 976.05—Protein (crude) in animal feed, automated Kjeldahl method. In Official Methods of Analysis, 15th ed.; Helrich, K., Ed.; AOAC International: Arlington, VA, USA, 1990; Volume 1, p. 72. [Google Scholar]
- Padmore, J.M. Animal feed—AOAC official method 920.39—Fat (crude) or ether extract in animal feed. In Official Methods of Analysis, 15th ed.; Helrich, K., Ed.; AOAC International: Arlington, VA, USA, 1990; Volume 1, p. 79. [Google Scholar]
- Padmore, J.M. Animal feed—AOAC official method 942.05—Ash of animal feed. In Official Methods of Analysis, 15th ed.; Helrich, K., Ed.; AOAC International: Arlington, VA, USA, 1990; Volume 1, p. 70. [Google Scholar]
- Kazimierczak, R.; Hallmann, E.; Lipowski, J.; Drela, N.; Kowalik, A.; Püssa, T.; Matt, D.; Luik, A.; Gozdowski, D.; Rembiałkowska, E. Beetroot (Beta vulgaris L.) and naturally fermented beetroot juices from organic and conventional production: Metabolomics, antioxidant levels and anticancer activity. J. Sci. Food Agric. 2014, 94, 2618–2629. [Google Scholar] [CrossRef] [PubMed]
- Betlej, I.; Rybak, K.; Nowacka, M.; Antczak, A.; Borysiak, S.; Krochmal-Marczak, B.; Lipska, K.; Boruszewski, P. Structural Properties of Bacterial Cellulose Film Obtained on a Substrate Containing Sweet Potato Waste. Crystals 2022, 12, 1191. [Google Scholar] [CrossRef]
- Wada, M.; Kondo, T.; Okano, T. Thermally induced crystal transformation from cellulose Iα to Iβ. Polym. J. 2003, 35, 155–159. [Google Scholar] [CrossRef]
- Cheng, K.C.; Catchmark, J.M.; Demirci, A. Effect of different additives on bacterial cellulose production by Acetobacter xylinum and analysis of material property. Cellulose 2009, 16, 1033–1045. [Google Scholar] [CrossRef]
- Segal, L.; Creely, J.; Martin, A.; Conrad, C. An empirical method for estimating the degree of crystallinity of native cellulose using the X-ray diffractometer. Textile Res. J. 1959, 29, 786–794. [Google Scholar] [CrossRef]
- Moosavi-Nasab, M.; Yousefi, M. Biotechnological Production of Cellulose by Gluconacetobacter Xylinus from Agricultural Waste. Iran. J. Biotechnol. 2011, 9, 94–101. [Google Scholar]
- Schrecker, S.T.; Gostomski, P.A. Determining the water holding capacity of microbial cellulose. Biotechnol. Lett. 2005, 27, 1435–1438. [Google Scholar] [CrossRef]
- Ul-Islam, M.; Khan, T.; Park, J.K. Water holding and release properties of bacterial cellulose obtained by in situ and ex situ modification. Carbohydr. Polym. 2012, 88, 596–603. [Google Scholar] [CrossRef]
- Nelson, M.L.; Rousselle, M.A.; Cangemi, S.J.; Trouard, P. The Iodine Sorption Test. Factors Affecting Reproducibility and a Semimicro Adaptation. Textile Res. J. 1970, 40, 872–880. [Google Scholar] [CrossRef]
- Jadhav, P.; Sonne, M.; Kadam, A.; Patil, S.; Dahigaonkar, K.; Oberoi, J.K. Formulation of cost effective alternative bacterial culture media using fruit and vegetables waste. Int. J. Curr. Res. Rev. 2018, 10, 6–15. [Google Scholar] [CrossRef]
- Mirmiran, P.; Houshialsadat, Z.; Gaeini, Z.; Bahadoran, Z.; Azizi, F. Functional properties of beetroot (Beta vulgaris) in management of cardio-metabolic diseases. Nutr. Metabol. 2020, 17, 3. [Google Scholar] [CrossRef] [PubMed]
- Vasconcelos, N.F.; Feitosa, J.P.A.; da Gama, F.M.P.; Morais, J.P.S.; Andrade, F.K.; de Souza, M.D.S.M.; de Freitas Rosa, M. Bacterial cellulose nanocrystals produced under different hydrolysis conditions: Properties and morphological features. Carbohydr. Polym. 2017, 155, 425–431. [Google Scholar] [CrossRef]
- Jung, H.-I.; Jeong, J.-H.; Lee, O.-M.; Park, G.-T.; Kim, K.-K.; Park, H.-C.; Lee, S.-M.; Kim, Y.-G.; Son, H.-J. Influence of glycerol on production and structural–physical properties of cellulose from Acetobacter sp. V6 cultured in shake flasks. Bioresour. Technol. 2010, 101, 3602–3608. [Google Scholar] [CrossRef] [PubMed]
- Son, H.J.; Kim, H.G.; Kim, K.K.; Kim, H.S.; Kim, Y.G.; Lee, S.J. Increased production of bacterial cellulose by Acetobacter sp. V6 in synthetic media under shaking culture conditions. Bioresour. Technol. 2003, 86, 215–219. [Google Scholar] [CrossRef] [PubMed]
- Puspawati, N.N.; Arihantana, N.M.I.H. Viability of lactic acid bacteria isolated from kombucha tea against low ph and bile salt. Sci. J. Food Technol. 2016, 3, 18–25. [Google Scholar]
- Goh, W.N.; Rosma, A.; Kaur, B.; Fazilah, A.; Karim, A.A.; Bhat, R. Microstructureand physical properties of microbial cellulose produced during fermentation of black tea broth (Kombucha). II. Int. Food Res 2012, 19, 153–158. [Google Scholar]
- Blanc, P.J. Characterization of the tea fungus metabolites. Biotechnol. Lett. 1996, 18, 139–142. [Google Scholar] [CrossRef]
- Fijałkowski, K.; Zywicka, A.; Drozd, R.; Kordas, M.; Rakoczy, R. Effect of Gluconacetobacter xylinus cultivation conditions on the selected properties of bacterial cellulose. Pol. J. Chem. Technol. 2016, 18, 116–122. [Google Scholar] [CrossRef]
- Gullo, M.; La China, S.; Falcone, P.M.; Giudici, P. Biotechnological Production of Cellulose by Acetic Acid Bacteria: Current State and Perspectives. Appl. Microbiol. Biotechnol. 2018, 102, 6885–6898. [Google Scholar] [CrossRef]
- Chawla, P.R.; Bajaj, I.B.; Survase, S.A.; Singhal, R.S. Microbial cellulose: Fermentative production and applications (Review). Food Technol. Biotechnol. 2009, 47, 107–124. [Google Scholar]
- Ross, P.; Mayer, R.; Benziman, M. Cellulose biosynthesis and function in bacteria. Microbiol. Rev. 1991, 55, 35–58. [Google Scholar] [CrossRef]
- Oikawa, T.; Nakai, J.; Tsukagawa, Y.; Soda, K. Anovel type ofd-mannitol dehydrogenase from Acetobacterxylinum: Occurrence, purification and basic properties. Biosci. Biotechnol. Biochem. 1997, 61, 1778–1782. [Google Scholar] [CrossRef] [PubMed]
- Keshk, S.M.A.S.; Sameshima, K. Evaluation of different carbon sources for bacterial cellulose production. Afr. J. Biotechnol. 2005, 4, 478–482. [Google Scholar] [CrossRef]
- Tabaii, M.J.; Emtiazi, G. Comparison of bacterial cellulose production among different strains and fermented media. Appl. Food Biotechnol. 2016, 3, 35–41. [Google Scholar] [CrossRef]
- Neffe-Skocińska, K.; Sinek, B.; Ścibisz, I.; Kołożyn-Krajewska, D. Acid contents and the effect of fermentation condition of Kombucha tea beverages on physico-chemical, microbiological and sensory properties. CYTA J. Food 2017, 15, 601–607. [Google Scholar] [CrossRef]
- Cvetković, D.; Markov, S.; Djurić, M.; Savić, D.; Velićanski, A. Specific interfacial area as a key variable in scaling-up Kombucha fermentation. J. Food Eng. 2008, 85, 387–392. [Google Scholar] [CrossRef]
- Sreeramulu, G.; Zhu, Y.; Knol, W. Kombucha fermentation and its antimicrobial activity. J. Agric. Food Chem. 2000, 48, 2589–2594. [Google Scholar] [CrossRef]
- Marsh, A.J.; Sullivan, O.O.; Hill, C.; Ross, R.P.; Cotter, P.D. Sequence-based analysis of the bacterial and fungal compositions of multiple Kombucha (tea fungus) samples. Food Microbiol. 2014, 38, 171–178. [Google Scholar] [CrossRef]
- Malbaša, R.V.; Lončar, E.S.; Djurić, M. Comparison of the products of kombucha fermentation on sucrose and molasses. Food Chem. 2008, 106, 1039–1045. [Google Scholar] [CrossRef]
- Sievers, M.; Lanini, C.; Weber, A.; Schuler-Schmid, U.; Teuber, M. Microbiology and fermentation balance in a kombucha beverage obtained from a tea fungus fermentation. Syst. Appl. Microbiol. 1995, 18, 590–594. [Google Scholar] [CrossRef]
- Mo, H.; Zhu, Y.; Chen, Z. Microbial fermented tea–a potential source of natural food preservatives. Trends Food Sci. Technol. 2008, 19, 124–130. [Google Scholar] [CrossRef]
- Zhong, C. Industrial-Scale production and applications of bacterial cellulose. Front. Bioeng. Biotechnol. 2020, 8, 605374. [Google Scholar] [CrossRef] [PubMed]
- Ruka, D.R.; Simon, G.P.; Dean, K.M. Altering the growth conditions of Gluconacetobacter xylinus to maximize the yield of bacterial cellulose. Carbohydr. Polym. 2012, 89, 613–622. [Google Scholar] [CrossRef]
- Masaoka, S.; Ohe, T.; Sakota, N. Production of cellulose from glucose by Acetobacter xylinum. J. Ferment. Bioeng. 1993, 75, 18–22. [Google Scholar] [CrossRef]
- Okiyama, A.; Motoki, M.; Yamanaka, S.M. Bacterial cellulose III. Development of a new form of cellulose. Food Hydrocoll. 1993, 6, 493–501. [Google Scholar] [CrossRef]
- Tsouko, E.; Kourmentza, C.; Ladakis, D. Bacterial cellulose production from industrial waste and by-product streams. Int. J. Mol. Sci. 2015, 16, 14832–14849. [Google Scholar] [CrossRef] [PubMed]
- Cichosz, S.; Masek, A. IR Study on Cellulose with the Varied Moisture Contents: Insight into the Supramolecular Structure. Materials 2020, 13, 4573. [Google Scholar] [CrossRef]
- Hospodarova, V.; Singovszka, E.; Stevulova, N. Characterization of Cellulosic Fibers by FTIR Spectroscopy for Their Further Implementation to Building Materials. Am. J. Anal. Chem. 2018, 9, 303–310. [Google Scholar] [CrossRef]
- Abol-Fotouh, D.; Hassan, M.A.; Shokry, H.; Roig, R.; Azab, M.S.; Kashyout, A.B. Bacterial nanocellulose from agro-industrial wastes: Low-cost and enhanced production by Komagataeibacter saccharivorans MD1. Sci. Rep. 2020, 10, 3491. [Google Scholar] [CrossRef]
- Wang, S.S.; Han, Y.H.; Chen, J.L.; Zhang, D.C.; Shi, X.X.; Ye, Y.X.; Chen, D.L.; Li, M. Insights into Bacterial Cellulose Biosynthesis from Different Carbon Sources and the Associated Biochemical Transformation Pathways in Komagataeibacter sp. W1. Polymers 2018, 10, 963. [Google Scholar] [CrossRef]
- Castro, C.; Zuluaga, R.; Álvarez, C.; Putaux, J.L.; Caro, G.; Rojas, O.J.; Mondragon, I.; Gañán, P. Bacterial Cellulose Produced by a New Acid-Resistant Strain of Gluconacetobacter Genus. Carbohydr. Polym. 2012, 89, 1033–1037. [Google Scholar] [CrossRef] [PubMed]
- Elazzouzi-Hafraoui, S.; Nishiyama, Y.; Putaux, J.-L.; Heux, L.; Dubreuil, F.; Rochas, C. The shape and size distribution of crystalline nanoparticles prepared by acid hydrolysis of native cellulose. Biomacromolecules 2008, 9, 57–65. [Google Scholar] [CrossRef] [PubMed]
- Bootten, T.J.; Harris, P.J.; Melton, L.D.; Newman, R.H. WAXS and 13C NMR Study of Glucoacetobacter Xylinus Cellulose in Composites with Tamarind Xyloglucan. Carbohydr. Res. 2008, 343, 221–229. [Google Scholar] [CrossRef] [PubMed]
- Poletto, M.; Ornaghi, H.L.; Zattera, A.J. Native cellulose: Structure, characterization and thermal properties. Materials 2014, 7, 6105–6119. [Google Scholar] [CrossRef] [PubMed]
- Kim, J.; Cai, Z.; Lee, H.S.; Choi, G.S.; Lee, D.H.; Jo, C. Preparation and Characterization of a Bacterial Cellulose/Chitosan Composite for Potential Biomedical Application. J. Polym. Res. 2011, 18, 739–744. [Google Scholar] [CrossRef]
- Atykyan, N.; Revin, V.; Shutova, V. Raman and FT-IR Spectroscopy investigation the cellulose structural differences from bacteria Gluconacetobacter sucrofermentans during the different regimes of cultivation on a molasses media. AMB Express 2020, 10, 1–11. [Google Scholar] [CrossRef]
- Costa, A.F.S.; Almeida, F.C.G.; Vinhas, G.M.; Sarubbo, L.A. Production of bacterial cellulose by Gluconacetobacter hansenii using corn steep liquor as nutrient sources. Front. Microbiol. 2017, 8, 2027. [Google Scholar] [CrossRef]
- Portela, R.; Leal, C.R.; Almeida, P.L.; Sobral, R.G. Bacterial Cellulose: A Versatile Biopolymer for Wound Dressing Applications. Microb. Biotechnol. 2019, 12, 586–610. [Google Scholar] [CrossRef] [PubMed]
- Gorgieva, S.; Trček, J. Bacterial Cellulose: Production, Modification and Perspectives in Biomedical Applications. Nanomaterials 2019, 9, 1352. [Google Scholar] [CrossRef]
- Gelin, K.; Bodin, A.; Gatenholm, P.; Mihranyan, A.; Edwards, K.; Strømme, M. Characterization of Water in Bacterial Cellulose Using Dielectric Spectroscopy and Electron Microscopy. Polymer 2007, 48, 7623–7631. [Google Scholar] [CrossRef]
- Schwertassek, K. 30 Jahre Strukturstudien an Cellulosefasern mittels der Jodsorption. Ruckblick und Ausblick. Faserforsch. Text. 1961, 12, 369. [Google Scholar]
- Nikolić, T.; Hajnrih, T.; Kramar, A.; Petronijević, Z.; Koštić, M. Influence of periodate oxidation on sorption properties of viscose yarn. Cellul. Chem. Technol. 2018, 52, 459–467. [Google Scholar]
Publisher’s Note: MDPI stays neutral with regard to jurisdictional claims in published maps and institutional affiliations. |
© 2022 by the authors. Licensee MDPI, Basel, Switzerland. This article is an open access article distributed under the terms and conditions of the Creative Commons Attribution (CC BY) license (https://creativecommons.org/licenses/by/4.0/).