Abstract
The production of melt emulsions is mainly influenced by the crystallization step, as every single droplet needs to crystallize to obtain a stable product with a long shelf life. However, the crystallization of dispersed droplets requires high subcooling, resulting in a time, energy and cost intensive production processes. Contact-mediated nucleation (CMN) may be used to intensify the nucleation process, enabling crystallization at higher temperatures. It describes the successful inoculation of a subcooled liquid droplet by a crystalline particle. Surfactants are added to emulsions/suspensions for their stabilization against coalescence or aggregation. They cover the interface, lower the specific interfacial energy and form micelles in the continuous phase. It may be assumed that micelles and high concentrations of surfactant monomers in the continuous phase delay or even hinder CMN as the two reaction partners cannot get in touch. Experiments were carried out in a microfluidic chip, allowing for the controlled contact between a single subcooled liquid droplet and a single crystallized droplet. We were able to demonstrate the impact of the surfactant concentration on the CMN. Following an increase in the aqueous micelle concentrations, the time needed to inoculate the liquid droplet increased or CMN was prevented entirely.
1. Introduction
Emulsions are dispersions in which two mutually insoluble liquid substances are present. The dispersed droplet phase for oil-in-water emulsions is represented by oil and the continuous phase by water. According to Bancroft’s rule [1], the type of emulsion is determined by the solubility of surface-active substances (e.g., emulsifiers). The phase in which the emulsifier is more soluble forms the continuous phase.
A thermodynamic description of emulsions is provided by Sharma et al. [2]. The stability of emulsions is influenced by different physical effects, such as Ostwald ripening, flocculation, aggregation, sedimentation (creaming), phase inversion and coalescence. The time scales in which these effects influence the stability of emulsions may vary profoundly [3].
One potential method of stabilizing emulsions for a longer time is the addition of emulsifiers. Emulsifiers are excipients with a characteristic molecular structure. According to the chemical structure of the surfactant, they accumulate at the interface of the two phases and decrease the specific interfacial energy [4].
Emulsifiers are amphiphilic molecules with a hydrophilic (head group) and a hydrophobic part (tail). The head is polar, while the tail usually consists of long, nonpolar hydrocarbon chains. The emulsifiers at the oil-water interface arrange themselves according to their affinity to the solvent, i.e., the head groups are on the aqueous side, whereas the tails reach into the oil phase [5]. The hydrophilic part of an emulsifier can be charged and classified as ionic (anionic, cationic), zwitterionic or nonionic [4].
The phase distribution of the emulsifier in thermodynamic equilibrium occurs at the equivalence of temperature, pressure and chemical potentials of the surfactant in both phases, at the interface and in the micelles [6]. A quantitative description of thermodynamic equilibrium between the oil and the water phase is possible using the Nernst partition coefficient [7]. Accordingly, the distribution coefficient at phase equilibrium can be calculated using the concentrations of the component of these two phases.
1.1. Contact-Mediated Nucleation
Contact-mediated nucleation (CMN) describes a mechanism of crystallization, triggered by means of contact between a liquid, subcooled droplet and an already crystallized droplet (= particle).
McClements et al. [8] found that the fraction of solidified droplets increased during the experimental time when an equivalent initial distribution of solidified particles and liquid droplets was provided for a quiescent subcooled n-hexadecane-water emulsion with emulsifier Tween®20 (diffusional motion only). This occurred despite the fact that subcooling should have prevented spontaneous nucleation. Measurements by nuclear magnetic resonance (NMR) showed that no crystallization occurred after 175 h within an emulsion with only liquid n-hexadecane droplets. McClements et al. [9] found that the higher the available surfactant concentration in the emulsion, the higher the final solids fraction of the droplets. Additionally, Dickinson et al. [10] determined an increase in the solid content relative to an increase in the emulsifier concentration in the continuous phase for the same material system. They estimated that one in 107 collisions between crystallized and liquid droplets resulted in CMN. Hindle et al. [11] found a steady increase in the fraction of solidified droplets of a subcooled n-hexadecane-water emulsion with emulsifier Tween®20. The increase occurred after crystallized n-hexadecane droplets were added. Complete crystallization of the dispersed phase occurred during the 15 days after the addition of crystallized droplets. They concluded that, according to their results, micelles could not mediate nucleation and any increases in the solid fraction were due to the contact between a liquid droplet and a solid particle. They also state that micelles may affect CMN.
Regarding experiments performed in the field of coalescence, Dudek et al. [12] determined longer coalescence times with increasing surfactant concentrations. This is contrary to the results described above, because increasing micellular numbers should improve the coalescence process as more dispersed phase can be transported from one droplet to another. Additionally, with increasing aqueous surfactant concentrations, higher energy barriers must be overcome to achieve direct contact between the two collision partners [13]. The latter is discussed in further detail later in this paper.
In order to enhance the contact between crystallized particles and liquid droplets, achieving a relative motion between each particle and droplet is advantageous. According to Vanapalli et al. [14], the relative motion between droplets and particles can be classified into orthokinetic (externally imposed velocity fields) or perikinetic (Brownian motion). In this work, the relative motion is governed by the orthokinetic mechanism due to the microfluidic setup and droplet sizes used.
In analogy to the coalescence theory, three external flow factors can influence CMN: contact time, contact force and collision frequency [15]. The contact time and contact force depend on further flow phenomena, such as the flattening of the film radius, film drainage and film rupture [16]. The surfactant may play an important role for CMN because it influences the specific interfacial energy and forms micelles in the continuous phase which may inhibit the contact of colliding partners.
1.2. Microfluidics
Microfluidic systems have become an important tool in emulsion research [17]. The application of microfluidics offers many advantages, for example, laminar flow conditions, high surface-to-volume ratios, small fluid volumes, the possibility of droplet manipulation, easy access for microscopical analysis, and excellent control over mass and heat transport. Microfluidics in crystallization research appears as a supporting platform for fundamental research into crystallization processes and crystal formation [18,19]. Hence, new possibilities have been made available to investigate processes within relevant time scales [20,21], for example, the investigation of CMN. Single droplet experiments are also used to investigate coalescence and to correlate specific interfacial energy to droplet stability [22,23,24,25].
1.3. Theoretical Description of Contact-Mediated Nucleation—An Approach
Similarities can be found between the modelling of coalescence processes and CMN [15]. So far, there are no established, specific theoretical descriptions of CMN in the literature. The process of coalescence takes places between liquid droplets or between gaseous bubbles. No phase change takes place upon coalescence. There is an asymmetry in the aggregate state in CMN, since one of the two contact partners is already crystallized and the other is a liquid, subcooled droplet. This results in the following general assumption of contact-mediated nucleation: the interface of the liquid droplet can take several states, from mobile to rigid, depending on the interfacial surfactant concentration, whereas the interface of the crystallized particle is only rigid.
According to [26], the interstitial film needs to fall below a critical thickness for coalescence to take place. Below that specific thickness, the Van der Waals attraction between two droplets approaching each other is stronger than any possible repulsive forces. Different mechanisms are detailed in the following passage, which could counteract the film thinning in the material system of an n-hexadecane–water emulsion used, stabilized with Tween®20.
The Derjaguin-Landau-Verwey-Overbeek (DLVO) theory [27,28] is a theoretical description of the stability of colloidal systems, such as emulsions, that account for attractive and repulsive forces. Regarding stability factors [29] larger than 1, repulsion dominates the interaction of two suspended particles. Electrostatic repulsion between colloids requires equally charged surfaces. Therefore, an increased charge of equal polarity between colloids could counteract film thinning. Dimitrova et al. [30] measured the forces between ferrofluidic suspension droplets in an aqueous solution stabilized with Tween®20. When the concentration of the emulsifier increased, the electrostatic repulsion also increased. The authors only found agreement with the DLVO theory for low concentrations of the emulsifier. The repulsive force measured at higher surfactant concentrations showed higher values at shorter distances than the predicted values calculated via the DLVO theory. In order to explain this discrepancy, the authors suspected a steric component of the repulsive force. This was thought to be caused by the presence of Tween®20 micelles between the droplets.
The influence of micelles in the continuous phase on the contact between colloids could be explained by the oscillating structural and depletion forces (OSF) [31]. These forces occur in the interstitial film when the film thickness decreases in the presence of small, dissolved entities in the film liquid, for example, micelles.
Taking OSF into account, Basheva et al. [13] derived a nonlinear relationship between the diameter of spherical micelles, the volume fraction of these micelles, the distance of the two colliding droplets and the interaction energy between the two droplets. This approach is used to estimate emulsion stability as a function of the number of micelles present in the solution. We calculated the interaction energy analogously with the literature presented regarding the occurrence of OSF (Figure 1). The corresponding material system parameters are listed in Table 1. was estimated by the sum of the oscillatory component () and the Van der Waals interaction (). A full description of the equations can be found in [13].
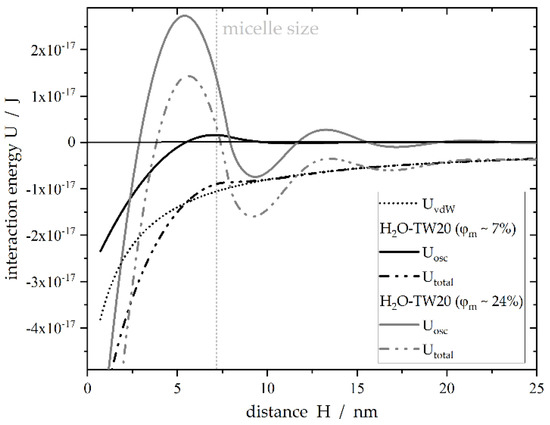
Figure 1.
Simulated interaction energy of two spherical droplets with the distance according to Trokhymchuk et al. [32] and Basheva et al. [13]. It is assumed that the film between the droplets contains hard, spherical micelles. Parameters used for calculation are summarized in Table 1. The volume fraction of the micelles in the continuous phase for a given aqueous surfactant concentration was approximated with a linear expression according to data obtained by Basheva et al. [13]: .

Table 1.
Parameters used for calculation of the total interaction energy .
Figure 1 indicates the possible influence of micelles in the aqueous phase because they are able to hinder or delay CMN by increasing the repulsive forces. As indicated, a particular volume density of micelles is necessary to achieve stability factors larger than 1.
We used a microfluidic setup for our studies to investigate the efficiency of CMN depending on the specific interfacial energy and micellular concentration in the continuous phase. We suggest increasing induction times and decreasing wetting by increasing aqueous micellular concentrations. Moreover, we assume that a link can be made between the coalescence theory and CMN to characterize the latter regarding its crystallization efficiency.
2. Materials and Methods
2.1. Materials Used
Microfluidic experiments were performed with n-hexadecane (C16H34, Hexadecane ReagentPlus®, Sigma-Aldrich, Schnelldorf, Germany, purity: 99%) as the dispersed phase and ultrapure water (OmniTap®, stakpure GmbH, Niederahr, Germany; electrical conductivity 0.057 µS cm−1) as the continuous phase. The surfactant used in this study was Polyoxyethylen(20)-sorbitan-monolaurat (Tween®20, Merck KGaA, Darmstadt, Germany) in different concentrations.
2.2. Microfluidic Measurement Setup
A microfluidic system based on the type of continuous-flow emulsion-based droplet microfluidics was applied [34]. The multiple phase flow appeared as the so-called Taylor flow [35]. A characteristic sequence of liquid droplets was formed, separated by slugs of the continuous phase. These slugs were sections of the aqueous phase [36]. The droplets had an average droplet volume of around 25 nL and mean equivalent diameters of approximately 525 µm. The droplet volume was calculated according to [37].
The microfluidic chip acted as the central element of the setup (Figure 2). It consisted of a transparent polycarbonate plate (thickness 2 mm) into which several microchannels have been milled. The channels were 300 µm wide and 200 µm deep. Additionally, a channel for a temperature sensor was milled into the side of the chip. The channels received their characteristic rectangular cross-sectional area by bonding a thin 250 µm polycarbonate foil on top. In order to guarantee that wetting of n-hexadecane did not occur on the channel walls, the latter were hydrophilized according to [38]. The microfluidic chip was fixed on a water-tempered aluminum cooling block with two independently controlled temperature zones. The temperature of the microfluidic chip was measured with a temperature sensor (Pt 100, ES Electronic Sensor GmbH, Heilbronn, Germany) close to the location of the contact experiment. Crystallization processes were tracked with a high-speed camera (sCMOS pco.edge 5.5®, Excelitas PCO GmbH, Kelheim, Germany) connected to a stereo microscope (SZ61, OLYMPUS EUROPA® Se & Co. KG, Hamburg, Germany) with an integrated polarization filter. Two silicon wafers were installed directly beyond the microfluidic chip to support the polarization filter in highlighting crystalline structures. Volume flow rates of the continuous and dispersed phases were adjusted by a low-pressure injection pump system (Nemesys, CETONI GmbH, Korbußen, Germany). This syringe pump system was connected to the computer via a BASE120 base module.
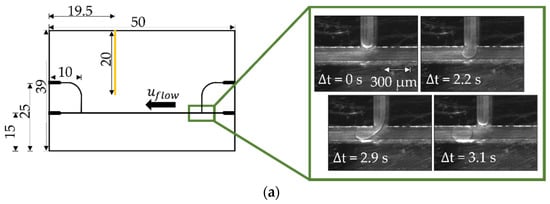
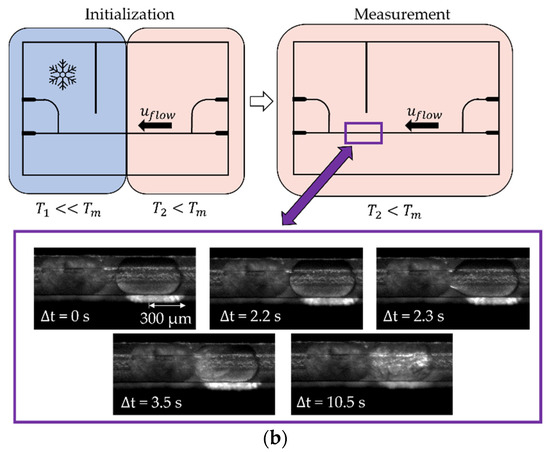
Figure 2.
(a) Schematic view of the microfluidic chip with rectangular channels and sectional temperature regulation with scale (mm). The temperature sensor was inserted sideways into the chip through a fitting channel (yellow). The n-hexadecane droplets were formed at the T-junction (green frame) at a temperature above the melting point of n-hexadecane . The produced droplets flowed along the channel in the direction indicated (. (b) Half of the chip was cooled (blue area) to a subcooling of around K for spontaneous nucleation (initialization). The other half was kept below the melting point at = 1.1 K (red area); the droplets on this side retained liquid. The whole microfluidic chip was kept at (red area) for the contact-mediated nucleation (CMN) measurement. The purple frame exemplarily displays a time-resolved CMN.
The microfluidic T-junction allowed for the formation of reproducible droplet sizes (Figure 2). At the beginning of the droplet formation process, the dispersed phase began to fill the channel cross-section almost completely, and when a critical proportion between droplet size and channel cross-sectional area was reached, droplets of the dispersed phase were formed.
The aim of the experiments was to investigate the CMN as a function of surfactant concentration. The temperature profile of the microfluidic chip during one collision followed a predefined protocol, as shown in Figure 3.
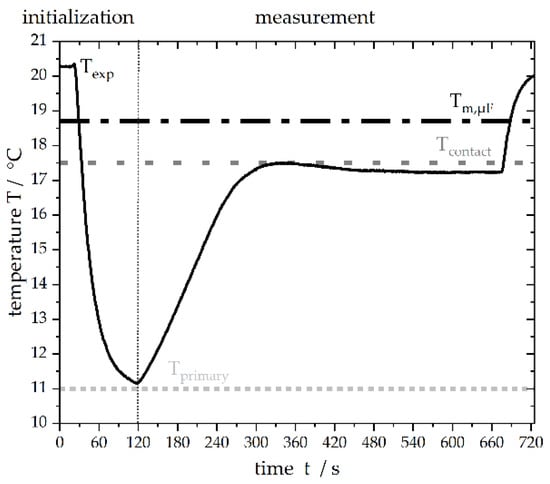
Figure 3.
Temperature profile of the microfluidic chip over time measured by the incorporated temperature sensor. After initiating spontaneous, primary nucleation at a subcooling of , the temperature was set to a subcooling of 1.1 K for the observation of CMN. The melting point of n-hexadecane was defined as 18.6 °C.
In order to initialize the experiment, droplets were formed at the T-junction and, as soon as both plates were covered with droplets, one side of the chip was cooled to around = 11 °C ( = 7.6 K) to enforce spontaneous droplet crystallization. To avoid spontaneous crystallization during the experiments, both plates were thermostated at = 17.5 °C ( = 1.1 K), which is below the melting point of n-hexadecane, and, as a result, the frozen particles did not thaw. Following this, the continuous phase was initiated, and the liquid droplet moved towards the solid particle. Volume flow rates ranging from 15 to 400 µL h−1 were applied. The solid particle was fixed on the channel walls as a result of crystallization. Due to the rectangular cross-sectional area of the channel and the round particle, the aqueous phase was still able to flow around the solid particle. This experimental design allowed for the controlled contact of two collision partners. A detailed experimental protocol is shown in Figure 4.
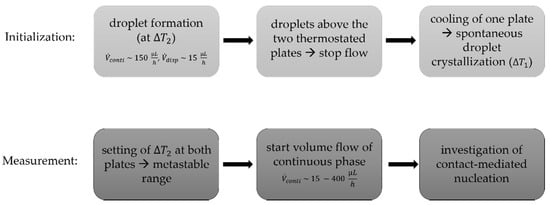
Figure 4.
Experimental protocol for microfluidic experiments designed to investigate CMN.
A high-speed camera allowed time-resolved detection of the contact progress (for example, relative velocity of the droplet and the particle and wetting evolution) and of the nucleation events. All collisions were tracked with the camera at a frame rate of 100 frames per second. The relative velocity was determined by the distance travelled by the subcooled liquid droplet within a specific timeframe, while the solid particle had a fixed position (compare Figure 2).
2.3. Melting Point Measurements
In order to quantify the possible impact of the microfluidic system on the melting point of n-hexadecane, the presence of water or emulsifier was determined in the microchannel to = 18.6 ± 0.2 °C. A broad range of melting points can be found in the literature, varying between 16.7 and 20.0 °C [39,40,41,42,43,44]. Our results are in good agreement with the available literature and, therefore, no impact of the setup or the presence of the water phase and surfactant was identified. In the following, was used to calculate subcooling.
2.4. Specific Interfacial Energy Measurements
Droplet formation within the microfluidic device was possible with and without the usage of an additional surfactant. Therefore, it was not possible to estimate the specific interfacial energy and, consequently, the droplet surface coverage achieved by the emulsifier directly during the microfluidic experiment. However, surface coverage may play an important role for CMN as interfacial energy is known to greatly influence coalescence [45].
Measurements of the specific interfacial energy were obtained via the pendant drop method (OCA 25, DataPhysics Instruments GmbH, Filderstadt, Germany) to quantify the time needed by the surfactants to cover the liquid-liquid interface completely. A syringe with an outer diameter of 0.91 mm was used for the generation of the droplet, and the temperature was set to 20 ± 0.2 °C. Measurements without surfactant resulted in specific interfacial energies of 48.6 ± 0.5 mN·m−1, which is in good agreement with the specific interfacial energies described in the literature ([46]: 43.16 mN·m−1, [47]: 47.0 mN·m−1). Time-resolved specific interfacial energies were considered to characterize the adsorption process of the surfactant to the liquid-liquid interface and to outline any dependencies of the surfactant concentration in the aqueous or oil phase (Table 2 and Table 3, Figure 4).
Table 2.
Specific interfacial energies approximately 4 h after interface formation for different surfactant concentrations dissolved in the continuous phase ().
Table 3.
Specific interfacial energies about 4 h after interface formation for different surfactant concentrations added at the beginning to the dispersed phase ().
As Figure 5 and Table 2 and Table 3 indicate, the phase in which the surfactant is dissolved at the beginning of the experiment plays a major role. The convolution of the surfactant distribution between the aqueous and oil phases will be discussed in Section 3. The measurements were obtained in a time frame of approximately 4 h (data not shown), without reaching a constant specific interfacial energy. The microfluidic experiments were performed within around 0.2 h. For < 0.2 h, the final distribution of the surfactant between the continuous phase, dispersed phase and liquid-liquid interface was not reached according to the specific interfacial energy measurements. It should also be mentioned that the specific interfacial energy tension reduced from around 48 mN·m−1 to values between approximately 1 and 4 N m−1 within the first seconds after droplet formation. This suggests that most surfactants adsorbed to the interface shortly after droplet formation and any further changes were only due to the ad- and desorption of a smaller number of molecules.
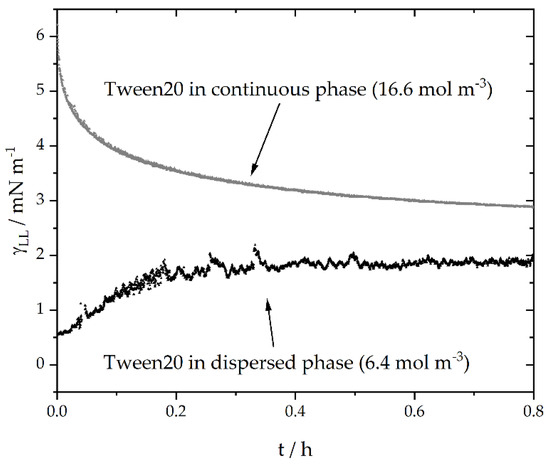
Figure 5.
Two exemplary time-resolved specific interfacial energy () measurements with surfactant supported in either the aqueous, continuous ( = 16.6 mol·m−3) or dispersed oil phase ( 6.4 mol·m−3).
The increasing specific interfacial energy for systems in which the emulsifier was previously dissolved in the dispersed phase, shows the convective transport of the emulsifier from the interface to the surrounding continuous phase. As soon as thermodynamic equilibrium would be reached, the specific interfacial energies should be the same, without any differences regarding initial surfactant concentration gradients between the aqueous and oil phase, providing there is enough surfactant to completely cover the interface.
When transferring these findings to an idealistic model, we assumed different, instationary surfactant distributions between the dispersed and continuous phase, depending on the initial surfactant concentration (Figure 6). We assumed that the depicted surfactant distribution represented the situation during our microfluidic experiments.
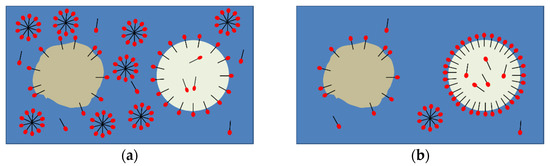
Figure 6.
(a) Schematic system description when the surfactant was initially dissolved in the continuous phase (water). The subcooled droplet is presented in a light color, the solid particle is shown as a brown sphere. (b) Schematic system description when the surfactant was initially dissolved in the dispersed phase (n-hexadecane). Both systems had not yet reached the thermodynamic equilibrium.
Within the experimental time range, a higher emulsifier concentration at the interface can be assumed for systems where the surfactant is dissolved in the oil phase at = 0 due to lower specific interfacial energies (Figure 5 and Figure 6b). In addition, the concentration of the surfactant affects the specific interfacial energy and, thus, the emulsifier concentration at the interface across relevant time scales. Decreasing specific interfacial energies with increasing surfactant concentration (even above the critical micellular concentration: CMC) are also described in the literature [12,48]. During the microfluidic experiments, we assumed that, when the surfactant was initially supported in the water phase, more micelles were present in the aqueous phase compared to the number of micelles when the surfactant was initially dissolved in the oil phase.
2.5. Wetting
Different types of wetting between the liquid droplet and the solid particle were observed (Figure 7). The efficiency of CMN can be obtained by taking the wetting angle φ of the two collision partners into account.
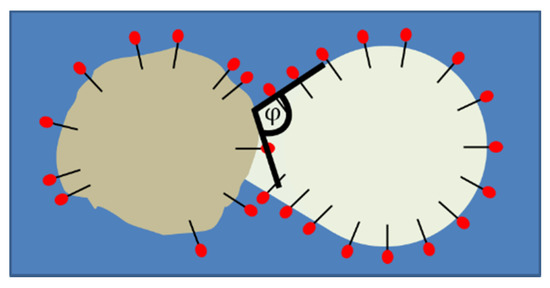
Figure 7.
Definition of the wetting angle φ between a liquid, subcooled droplet and a solid particle. Both contact partners are stabilized with surfactant.
In this work, four different forms of contact are identified by their corresponding wetting angle and their efficiency in initiating nucleation. A brief overview is provided in Table 4.
Table 4.
Classification of CMN based on the wetting angle φ. The differentiation is made based on whether nucleation occurs or not. Additionally, a schematic abstraction and the experimental observation are shown. In the abstraction, solid structures are light brown (left particle), and liquid droplets (right) are visualized in white. For the experimental illustration, solid structures are either light white, in cases where crystallization had just taken place, or dark gray. The liquid droplet volume is represented by the transparent parts. We assumed that solid–liquid interfaces are partially composed of surfactant. In the case of φ = 0°, hug, the red circle highlights the part of the liquid droplet that has already crossed the solid particle and appears directly behind the latter. The first two rows illustrate that contact occurred when the surfactant was supported in the continuous phase; the last two rows show wetting angles for the initial surfactant support in the dispersed phase.
Crystallization did not occur when the wetting angle was 180°, and we assume that no wetting occurred either. When the surfactant was dissolved in the aqueous phase, crystallization was visible with increasing relative velocities and a decreasing aqueous surfactant concentration, but not immediately after the first contact. The liquid droplet even surrounded the solid particle at certain points (Table 4, φ = 0°, hug, red circle).
3. Results
3.1. Surfactant Distribution between the Water and Oil Phase and the Liquid-Liquid Interface
The CMN may be influenced by the surface coverage of the droplet and particle with emulsifier. The influence of the specific interfacial energy on coalescence has already been discussed in the literature (e.g., [45]). In addition, the appearance of micelles may play an important role for the successful inoculation of the subcooled droplet. Due to the above-mentioned reasons, it is of great importance to estimate the surfactant distribution between the aqueous continuous and the dispersed oil phase.
In order to determine whether a diffusion process of surfactant from the water to the oil phase occurs, that is driven by concentration gradients due to different chemical potentials, NMR measurements were performed using a 400 MHz spectrometer (Avance Neo, Bruker BioSpin GmbH). Samples were prepared with surfactant concentrations up to 180 mol·m−3. N-hexadecane was added at two different mass ratios to the continuous phase: [50:50] and [80:20] (water:n-hexadecane). After the addition of n-hexadecane, the samples were mixed with a stirring fish at 700 rpm for 2 min. Droplets between 10 and 500 µm were produced. The samples were left untouched for one week. During this time, a phase separation occurred, and three different phases became visible. Large n-hexadecane droplets were found at the top. The intermediate phase consisted of smaller n-hexadecane droplets and the bottom phase was aqueous. The aqueous phase was carefully separated with a syringe to determine the surfactant distribution after one week. This sample was analyzed by 1H NMR spectroscopy (Figure 8).
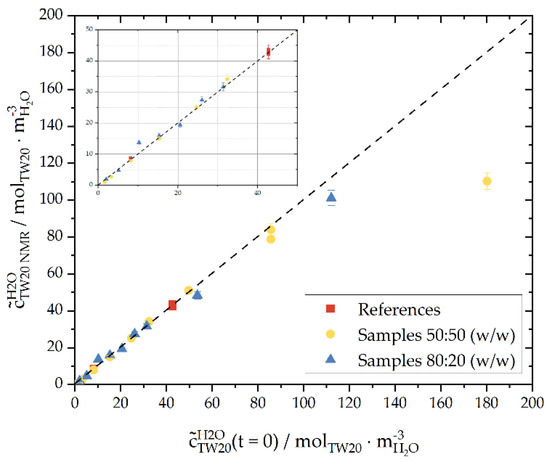
Figure 8.
The concentration of Tween®20 in the water phase determined via NMR spectra as a function of the concentration of the weighed-in components of samples with a 50:50 or 80:20 mass ratio of the continuous phase to the dispersed phase (n-hexadecane). In addition, reference samples of Tween®20 in ultrapure water with defined concentrations are displayed (red). The samples were measured at 20 °C. Inset: Zoom-in to concentrations up to = 50 mol·m−3. The relative measurement error of the spectrometer was 2%.
The measured samples are in good agreement with the calibration curve up to a concentration of = 90 mol·m−3. Therefore, up to the specified concentration, no measurable number of surfactants dissolved in the n-hexadecane phase. This supports our hypothesis that surfactant diffusion due to concentration gradients and, thus, chemical potential differences between the continuous and dispersed phase did not play a major role within our experimental time frame ( < 50 mol·m−3). Moreover, we did not notice an influence of the volume ratios of water and oil on the distribution of the surfactant. The concentration of surfactant at the interface was too small to be measurable with NMR. Pendant drop measurements must be considered to obtain information about the interfacial surfactant concentration (Figure 5, Table 2 and Table 3).
The measured surfactant concentrations, for initial concentrations higher than = 90 mol·m−3, differ from the reference calibration line. This may indicate that the molecular solubility limit of Tween®20 in the continuous phase had been exceeded. The information on the solubility of Tween®20 in water in the literature spans a certain range although a concrete solubility limit could not be found. Data sheets [49,50] mention the solubility limit at emulsifier concentrations of and . These correspond to the following values: mol·m−3 and mol·m−3, respectively, with . These values are much lower than the emulsifier concentrations investigated and used in the present series of experiments. Pollard et al. [51] found Tween®20 to be ‘extremely soluble’ in water and other solvents. In their experiments, Tween®20 was completely solvable in water up to 671 at 20 °C ( 546 mol·m−3), and the authors did not investigate further additions of emulsifier. The maximum solubility was not reached at this concentration. No phase separation of Tween®20 in water, that was measurable by eye, could be identified in any of our experiments. Nonetheless, a nonvisible phase separation could have taken place. Another possible explanation may be the diffusion of surfactant from the aqueous to the oil phase. With an increasing aqueous surfactant concentration, the difference of the chemical potential between Tween®20 in water and n-hexadecane increased, leading to a faster rate of surfactant diffusion into the oil phase.
Long-term experiments were performed over a period of 43 days to support the findings of the slow equilibrium adjustment of the surfactant between the continuous and the dispersed phase (Figure 9) and to estimate the distribution coefficient of Tween®20 between water and n-hexadecane. is defined as
where represents the molar concentration of Tween®20 in the n-hexadecane phase and represents the molar concentration in the water phase.
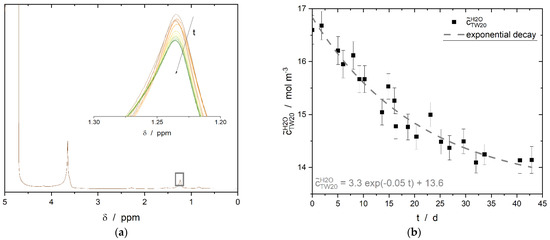
Figure 9.
(a) 1H spectra of the aqueous phase, where the surfactant Tween®20 was dissolved at the beginning of the experiment. The water peak appears at about 4.8 ppm; all other visible peaks are related to Tween®20. Inset: time-resolved evolution of the CH2 peak of Tween®20. (b) Time-resolved measurements of Tween®20 concentration in the continuous phase over a period of 43 days, determined by NMR spectroscopy. The volume ratio of water and n-hexadecane was 50:50 and the interface had an area of 13.2 mm2. Additionally, the fitted exponential decay curve is visible as a dashed line.
A 300 MHz spectrometer (nanobay, Bruker BioSpin GmbH) was used to determine the distribution coefficient. The measured sample consisted of two separated phases, namely of pure n-hexadecane, and water with an initial total surfactant concentration of 16.6 mol·m−3. The phase volumes were both 300 µL. The sample was positioned in the sensitive measuring range so that only the water phase was measured. The CH2 peak was used for evaluation to avoid overlapping and the influence of the water peak on the peak of the ethoxylate group of the emulsifier at 3.7 ppm. Modelling of the experimental data with an exponential decay of the first order (Figure 9b) led to an equilibrium concentration of = 13.6 mol·m−3. The value of for the extrapolated equilibrium state was calculated as = 3.0 mol·m−3 by mass balance calculations of the two-phase system observed. The distribution coefficient (Equation (1)) was found to be 0.22 for an initial aqueous surfactant concentration of = 16.6 mol·m−3, similar volumes of water and n-hexadecane, and an interfacial area of approximately 13.2 mm2.
3.2. Effect of Tween®20 Distribution on Contact-Mediated Nucleation
As has been mentioned previously, the contact time and contact force required for nucleation may be influenced by the surfactant concentrations present in the water and oil phases and at the separating interface. This may be due to potentially prolonged film drainage times or the rearrangement of the surfactant at the interface when the two collision partners approach one another. Regarding industrial processes, wetting effects should be minimized to exclude partial coalescence and achieve comparable droplet/particle size distributions before and after the crystallization step. Partial coalescence describes when two particles are connected by a small bridge, but they do not form a single, spherical particle.
Within the experimental microfluidic time frame of around 10 min, the specific interfacial energy depended on the distribution of the surfactant between the continuous and dispersed phase (Figure 5). Different concentrations of Tween®20 in the dispersed and continuous phase were used for the collision experiments to outline the effect of the specific interfacial energy and the influence of micelles on the CMN. The number of micelles or single molecules per unit volume in the continuous phase and the specific interfacial energy may influence the contact force needed for crystallization. Here, we used the relative velocity between the subcooled droplet and the crystalline particle as an indirect indicator of contact force because the latter cannot be measured directly. This velocity difference will be transformed into a contact force per contact area and thus into, for example, a contact pressure. The contact time is not limited in the microfluidic chip because the continuous phase constantly pushes the liquid droplet towards the solid particle. The induction time needed for crystallization is presented in Section 3.4.
The distribution of the surfactant cannot be determined within the microfluidic setup itself. An empirical approach was used to estimate the distribution. A diffusion-controlled model was applied for the adsorption of Tween®20 at the water–n-hexadecane interface. According to [52], this assumption is valid because the droplets had an average size larger than 10 µm. Tween®20 was assumed to be a highly surface-active molecule. Our calculations showed that a complete coverage of the interface was reached after at least 6 min for = mol·m−3 and s for = 42.8 mol·m−3. The maximum surface loading was reached within less than 1 s ( for all initial surfactant concentrations higher than the CMC. For the calculations according to [53], a maximal surface loading of (calculated according to [54], assuming a surfactant monolayer at the liquid-liquid interface and a surface pressure equal to zero; 100% of interface covered with surfactant) and a diffusion coefficient of the single surfactant molecules in water of m2·s−1 (own measurements via NMR diffusion measurements [400 MHz spectrometer, Avance Neo, Bruker BioSpin GmbH]) was used. Assuming a fully loaded interface before starting the collision experiments, the continuous surfactant concentration still represents more than 99% of the initial bulk concentration of TW20 (. Ad- and desorption processes from the interface into the n-hexadecane droplet phase can also be neglected within the experimental time range, as is shown in Figure 8.
When Tween®20 was initially dissolved in n-hexadecane, measurements of the specific interfacial energy suggested fast adsorption to the interface followed by a desorption to the continuous phase. The diffusion coefficient of Tween®20 in n-hexadecane was measured as m2·s−1 for surfactant concentrations between 0.2 and 360 mol·m−3, which is comparable to . We therefore assume that only single molecules are present in the n-hexadecane droplet and no inverse micelles are formed. Calculations of the maximum time needed for complete interfacial coverage, according to [53], revealed that a complete coverage can be assumed in periods significantly shorter than 10 min. We, furthermore, assume that no or only a few micelles are formed within the continuous phase until contact crystallization occurs when Tween®20 was initially dissolved in the oil phase. This hypothesis will be verified later, because micelles and single molecules in the continuous phase hinder contact crystallization tremendously. Nucleation occurred for all experiments where the surfactant was initially dissolved in the dispersed phase.
The wetting angle (Figure 10a,b) and crystallization probability (Figure 10c) depended on the surfactant’s concentration and the distribution of the surfactant throughout the system. The crystallization probability represents the ratio between the crystallized droplets and the total number of droplets.
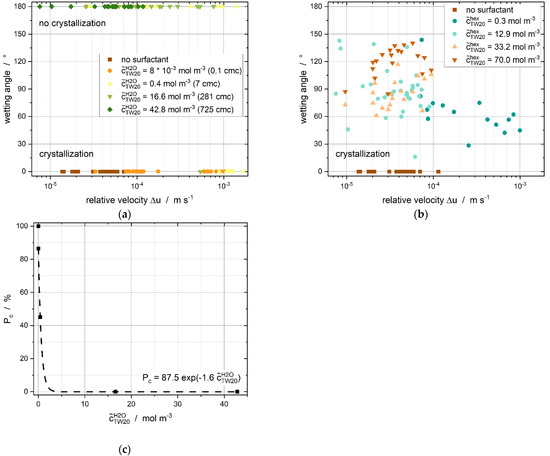
Figure 10.
(a) Wetting angle as a function of the relative velocity (difference of velocities between droplets and particles) for different surfactant concentrations. Tween®20 was added to the continuous phase. (b) Wetting angle as a function of relative velocities for different surfactant concentrations as Tween®20 was dissolved in the dispersed phase. All experiments led to crystallization, but differences in the contact form were found according to the surfactant concentration. (c) Crystallization probability as Tween®20 was added to the continuous phase for relative velocities ranging from up to m s−1.
There was no initial nucleation visible by eye at first contact for any experiments in which the surfactant was added to the continuous phase alone at the beginning of the experiment. Higher relative velocities and, thus, higher shear rates and higher contact forces were necessary (e.g., Figure 10a, to trigger nucleation. The liquid droplet often surrounded the particle before nucleation occurred. We assume that the new liquid–liquid droplet surface can be refilled faster with an increasing surfactant concentration in the continuous phase. This, consequently, prevents the direct contact of crystalline structures with subcooled liquids and, therefore, hinders crystallization. Less free surfactant is available at a lower surfactant concentration and the new interface cannot be completely covered quickly enough. Consequently, crystallization occurs.
Only the two lower surfactant concentrations ( = and mol·m−3) led to nucleation within the experimental observation period of around 60 s. The crystallization probability (Figure 10c) decays exponentially as a function of the initial aqueous surfactant concentration. We, thus, assume that micelles in the continuous phase hinder nucleation, as the highest crystallization probability was reached at = mol·m−3, which is below the CMC of Tween®20 in water ( = 0.059 mol·m−3 [55]). Experiments without the surfactant were performed to prove this hypothesis. Crystallization occurred in all the experiments without the emulsifier. This confirms our assumption that micelles and increasing monomer concentrations in the continuous phase can weaken or even prevent CMN.
When the surfactant was initially added to the dispersed phase alone, all contacts resulted in nucleation, independent of the surfactant concentration and relative velocity. A differentiation can be made according to the presented wetting angles (Figure 10b).
The surfactant’s equilibrium distribution between the two phases was investigated to determine the dominant factor in CMN. The phase composition is provided by , which was acquired from the long-term spectroscopic measurements (Figure 9). If the influence of the micelles is dominant, no crystallization should take place, whereas if the emulsifier in the dispersed phase and at the interface has a stronger influence, crystallization should take place in all collisions (Figure 11).
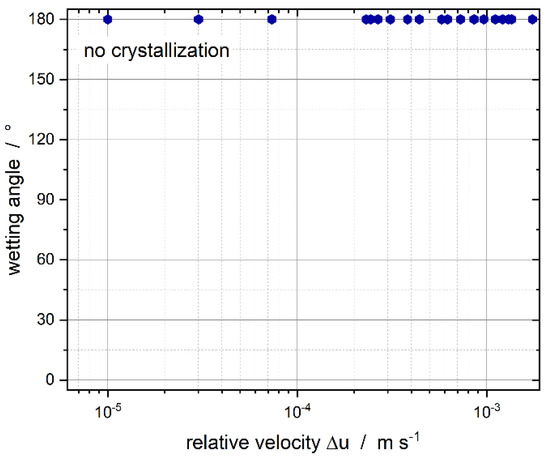
Figure 11.
Wetting angle as a function of the relative droplet velocity for the equilibrium surfactant distribution between the continuous and dispersed phase, determined from long-term spectroscopy measurements (compare Figure 9).
Successful nucleation was not observed for relative velocities up to m s−1. This is a clear indication of the prevention of CMN by the presence of micelles in the continuous phase. Bera et al. [56] did not identify the occurrence of coalescence when the surfactant concentration was above the CMC, which is in good agreement with our results as we did not detect any CMN when the surfactant concentration was above in the continuous phase.
3.3. Formation of Liquid Bridges before Contact-Mediated Nucleation
A formation of liquid bridges between the liquid droplet and the solid particle was detected during some experiments, when the surfactant was initially dissolved in the oil phase. Regarding the desirable separation of the two reaction partners after the collision in industrial processes, small or no liquid bridges are required. Otherwise, the shelf life of the product would be reduced, or the product properties may change due to partial coalescence. Separation after collision could not be achieved for the experiment setup used due to the limitations presented by the experimental execution.
The size of the liquid bridge, which was formed between droplet and particle, changed as a function of the surfactant concentration in the dispersed phase (Figure 12).
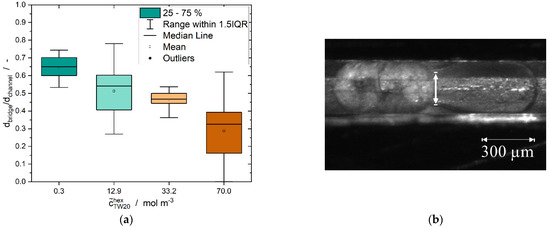
Figure 12.
(a) Dimensionless diameter of the liquid bridge between the solid particle and the liquid droplet shortly after formation for all relative velocities tested. The emulsifier was dissolved in the dispersed phase at different concentrations at the beginning of the experiment. (b) Determination of the diameter of the liquid bridge formed during CMN between a solid and liquid n-hexadecane droplet in a microfluidic channel. The images used for the determination of the diameter of the bridge were taken directly after contact of the droplets, with the maximum error between the moment of contact and the picture shot being = 0.01 s.
A very clear decrease in the mean size of the liquid bridge is visible. A significant difference between the population means and the population variances (Levene’s test) was observed at a level of 0.05 by means of an analysis of variance of the experimental data. Nonetheless, the Tukey’s post hoc test showed no significant difference between the two data sets of 12.9 and 33.2 mol·m−3 at a level of 0.05.
A decrease in the diameter of the liquid bridge with an increasing emulsifier concentration is also described by Nowak et al. [57] for two coalescing droplets. Since the addition of surfactant causes decreasing specific interfacial energies, smaller driving forces are needed for coalescence and, hence, for CMN in the experiments presented here. The specific interfacial energy has a gradient on the droplet surface during the CMN due to the movement of surfactants at the interface. Consequently, Marangoni flow [58] develops. This allows for a homogeneous surfactant distribution at the interface. Thus, there are two effects promoting small liquid bridges at higher surfactant concentrations. Firstly, since there is more emulsifier in the dispersed phase, diffusion-limited transport to the interface is faster. Secondly, the gradient on the surface is greater because more emulsifier is present at the interface and, thus, the Marangoni flow is stronger. Higher surfactant concentrations also allow for a faster refilling of the interface when there is a concentration gradient between the continuous and dispersed phase, resulting in the desorption of surfactant molecules from the interface to the continuous phase. Chesters [16] hypothesizes that coalescence is favored for low viscosities of the dispersed phase. This may also promote the formation of larger liquid bridges at smaller surfactant concentrations and, thus, lower dispersed phase viscosities. Regarding industrial processes, smaller liquid bridges or even no bridges are favorable to avoid partial coalescence, coalescence or agglomeration so as to maintain the product quality.
3.4. Induction Time
Stirred vessels are used with wide shear rate distributions for industrial melt emulsion production and storage. Melt emulsification is a top-down approach that can produce suspensions with µm-sized particles, while overcoming the disadvantages of the energy- and time-consuming wet-milling process [59,60]. The contact time is inversely proportional to the shear rate [16], therefore, it is important to know the required induction time to trigger crystallization. Once is obtained, it can be used to optimize process flows. For the collision experiments, was determined as a function of the surfactant concentration in either the continuous or dispersed phase (Figure 13). Furthermore, is defined as the time between the first visible contact and the detection of the first crystal.
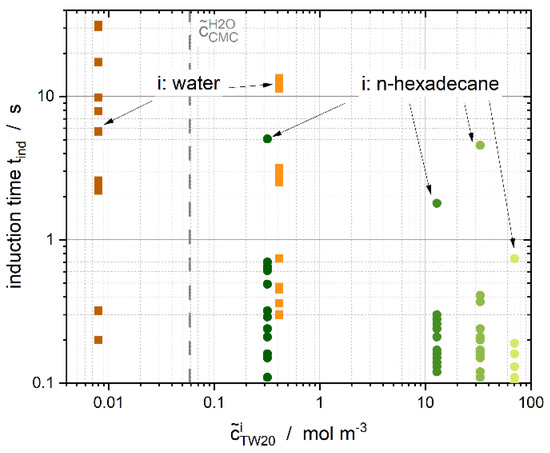
Figure 13.
Induction time , defined as the delay between nucleation and the first visible contact between the droplet and particle, as a function of surfactant concentration in either dispersed or continuous phase for relative velocities ranging from up to m s−1.
When the experimental aqueous concentration of the surfactant was found to be above the CMC micelles were detected in the continuous phase with a volume fraction >0.1% (Figure 13, i: water) and the induction time was up to ten times higher than without or with very few micelles and aqueous single molecules (Figure 13, i: n-hexadecane). Without any surfactant, the induction time ranged from 0.1 to 0.4 s (data not shown), which highlights the crystallization-impeding effect of the aqueous emulsifier micelles or single molecules. A wide range of induction times measured is apparent. Aqueous surfactant concentrations of 16.6 mol·m−3 ( ~2.8%) and 42.8 mol·m−3 ( ~7.1%) are not shown because crystallization did not occur within 60 s.
According to [61,62,63], we calculated the theoretical coalescence times for two n-hexadecane droplets with a radius in water without any surfactant. The theoretical coalescence times ranged from 0.3 s to 1.1 s at room temperature . Adding surfactant to the system increased the theoretical coalescence times by up to 43 s (). Taboada et al. [25] measured coalescence times ranging from 10 s up to more than 30 min for different emulsifiers in single droplet experiments with water as the continuous phase. Regarding nonionic surfactants, Leister et al. [64] obtained coalescence times between 5 and around 100 s. The measurements from Taboada et al. [25] and Leister et al. [64] are within the same range as our calculated theoretical coalescence times. We expect induction times to be within the mentioned range, providing that the surfactant is dissolved in water, which is in good agreement with our experimental data (Figure 13). Moreover, the theoretical coalescence time without any surfactant and the determined experimental induction time are in the same range. Dudek et al. [12] described increasing mean coalescence times and the increasing distributional width of the coalescence times with increasing surfactant concentrations. We, therefore, assume that mechanisms that prevent coalescence also hinder crystallization, for example, an increasing surfactant concentration in the continuous phase.
When Tween®20 was dissolved in the dispersed phase during our experiments, induction times were comparable to the theoretical coalescence times without any surfactant. This highlights the influence of surfactant within the continuous phase. With increasing surfactant concentration in the oil phase (and, thus, decreasing specific interfacial energies), slightly shorter induction times were measured, and the span of the induction times decreased.
4. Discussion
The results presented show that higher relative velocities and, thus, higher contact forces are needed to ensure crystallization if the surfactant concentration in the continuous aqueous phase increases. Regarding aqueous surfactant concentrations of Tween®20 higher than = 23 mol·m−3 (aqueous micellular volume fraction ~3.8%), an oscillatory, repulsive force by micelles is considered likely, which is shown by calculations according to [13], where OSF are considered (Figure 1). Connecting this repulsive force with the Van der Waals forces, an aqueous surfactant concentration higher than around 90 mol·m−3 ( ~15%) would show an energy barrier that must be overcome by contact force. Crystallization should take place for all aqueous surfactant concentrations presented here because the stability factor is smaller than 1 and attractive forces should dominate. This hypothesis cannot be verified by the experimental results. From all the continuous surfactant concentrations tested above the CMC, only shows CMN at relative velocities higher than m s−1. Oscillatory forces are not expected at this surfactant concentration in the aqueous phase, and crystallization should take place even for low contact forces (=low relative velocities).
Consequently, in addition to the volume fraction of micelles, their stability also plays a major role. Christov et al. [65] concluded from atomic force microscopy measurements that Tween®20 micelles are significantly more unstable when exposed to hydrodynamic shear than, for example, micelles from Brij 35. The micelles dissolve into single molecules even in cases where only a small force is applied, therefore, a considerably larger number of single molecules are displaced from the gap between the droplet and the particle, which results in a greater time requirement for nucleation.
The single aqueous surfactant molecules can also occupy newly formed interfaces. The droplet spread around the particle and increased its interface for relative velocities higher than m s−1 and > mol·m−3. This effect was only observed when Tween®20 was dissolved in the continuous, aqueous phase and became more dominant with increasing relative velocities. Depending on the freely available, single molecule concentration, this newly formed interface is unlikely to be occupied fast enough and, thus, nucleation took place. Higher relative velocities then triggered crystallization. One possible reason is the increasing contact force relative to increasing relative velocities. Moreover, emulsifier could be detached from the droplet/particle surfaces due to the increased shear forces, resulting in an unoccupied interface.
Furthermore, pH and conductivity measurements (data not shown) revealed an electrical loading for the surfactants’ head groups. Although nonionic emulsifiers were used by Dudek et al. [12] amongst others, a negative surface charge occurred in their experiments due to the deprotonated hydroxide groups of the emulsifiers’ head groups. They attribute their observation of longer mean coalescence times to a stronger rejection of the head groups at an increased emulsifier concentration. An increase in the negative charge of oil-in-water emulsions with an increasing Tween®20 concentration has also been reported by Hsu et al. [66]. The electrostatic repulsion could explain the smaller bridge diameters (Figure 12), increased surfactant concentration in the oil phase and longer induction times (Figure 13) with an increasing continuous surfactant concentration because a higher number of surfactant molecules leads to increasing repulsion. Accordingly, the specific interfacial energy plays less of a role compared to the micelles. This hypothesis is further supported by the fact that the induction times for the experiments with surfactant dissolved in the dispersed phase are very similar to those determined without any surfactant.
It is well-known that, for biological systems, nonpolar substances attract each other in water due to hydrophobic interactions, although the mechanism behind this is not yet fully understood (e.g., [67]). In the literature, attraction was evidenced within distances ranging from 100 to 6500 Å [68,69] and even up to around 3.5 mm for rough (super)hydrophobic surfaces [70]. Nonetheless, any hydrophobic interactions between n-hexadecane particles and droplets are attenuated by the micelles to a greater degree in the continuous phase than by emulsifiers at the interface. The micelles seem to shield the two reaction partners from each other. When no micelles or only very few single molecules are present in the continuous phase, the hydrophobic interactions can be detected by the liquid bridge formation.
Krawczyk et al. [71] state that the rupture of the liquid film between two colliding partners is greatly affected by the phase in which the surfactant is dissolved. This is due to different surfactant transportation mechanisms to the interface. Surfactants dissolved in the continuous phase can delay film rupture, because the surfactant must travel from the film perimeter into the film center, where the lowest interfacial surfactant concentration occurs. This additional flux can influence the film rupture. Emulsifiers that are dissolved in the oil phase are required to travel shorter distances and are, therefore, more efficient in equalizing local specific interfacial energy gradients (as long as the film radius << the droplet radius). The authors describe similar behavior of systems with surfactant in the dispersed phase and systems without any surfactant. This can also be seen in our measured induction times, which are similar for systems without emulsifier and with surfactants dissolved in the dispersed oil phase. Comparable behavior may be explained by Bancroft’s rule [1], which describes a stable emulsion as a system in which the emulsifier is preferentially dissolved in the continuous phase.
Another possible reason for limited nucleation could be the absence of a monolayer at the liquid–liquid interface and the presence of a multilayer or even micelles that attach to the interface (e.g., [72]). This additional shield could prevent or decrease the inoculation efficiency of the CMN.
5. Conclusions
Considering all our experimental results, we found that the variation of the locus of the initial dissolution and the concentration of the emulsifier had a significant influence on the contact form observed and on the efficiency of the CMN. Importantly, the aqueous surfactant concentration and the relative velocity between the droplet and the particle significantly impacted the CMN in the microfluidic system.
We were able to show that increasing surfactant concentration in the dispersed oil phase can trigger nucleation. In applying these results to industrial melt emulsion production, the processes after collision and crystallization must be considered as pivotal for influencing the particle size distribution and, thus, product properties. The higher the contact area is, the higher the probability that partial coalescence occurs, and, in the case of temperature fluctuations during, for example, transportation, coalescence may occur. Therefore, based on the observations of this study, dissolution of the water-soluble emulsifier in the hydrophobic dispersed phase prior to the experiment can be useful to trigger CMN. Partial coalescence could also be decreased with high micellular concentrations in the continuous phase, but, at the same time, CMN also becomes hindered.
Further experiments will test the newly stated hypothesis that the coalescence theory can be transferred to CMN. The emulsifier, for example, will be varied, and ionic emulsifiers will be used to investigate a possible ionic repulsion of the head groups. Furthermore, a differential pressure sensor will be connected to the microfluidic setup to calculate the contact force needed for crystallization and to determine the dependency of the contact force on the relative velocity and surfactant concentration. Moreover, experiments that take place in a new microfluidic device containing a larger liquid reservoir, where droplets and particle can freely collide without the geometric restrictions of a single channel, are planned. Similar experimental setups are described in the literature for coalescence-time experiments [56,73].
Author Contributions
Conceptualization, G.K., M.K.; methodology, G.K.; software, G.K., A.R., G.G.; validation, G.K., A.R., G.G., M.K.; formal analysis, G.K., A.R.; investigation, G.K., A.R.; data curation, G.K., G.G., M.K.; writing—original draft preparation, G.K.; writing—review and editing, G.G., M.K.; visualization, G.K., A.R.; supervision, M.K. All authors have read and agreed to the published version of the manuscript.
Funding
This research received no external funding.
Institutional Review Board Statement
Not applicable.
Informed Consent Statement
Not applicable.
Data Availability Statement
The data and methods used in the research are presented in sufficient detail in the document for other researchers to replicate the work.
Acknowledgments
We acknowledge support from the KIT-Publication Fund of the Karlsruhe Institute of Technology. We thank the Deutsche Forschungsgesellschaft for the substantial financial contribution in the form of NMR instrumentation and access to the instrumental facility Pro2NMR. Special thanks to Nico Leister and Jasmin Reiner from the Institute of Process Engineering in Life Sciences, Chair I: Food Process Engineering, who permitted the surface tension measurements and engaged in helpful discussions. Additionally, this work would not have been possible without the support of the workshop employees at the Institute of Thermal Process Engineering, especially Max Renaud. Anisa Schütze, who is a student, also performed valuable experiments for this article.
Conflicts of Interest
The authors declare no conflict of interest.
References
- Bancroft, W.D. The Theory of Emulsification, V. J. Phys. Chem. 1913, 17, 501–519. [Google Scholar] [CrossRef]
- Sharma, M.K.; Shah, D.O. Introduction to Macro- and Microemulsions. In Proceedings of the ACS Symposium Series; American Chemical Society (ACS): Washington, DC, USA, 1985; Volume 28, pp. 1–18. [Google Scholar]
- Tadros, T.F. Emulsion Formation, Stability, and Rheology. In Emulsion Formation and Stability; Tadros, T.F., Ed.; Wiley-VCH Verlag GmbH & Co. KGaA: Weinheim, Germany, 2013; pp. 1–75. [Google Scholar]
- Rosen, M.J.; Kunjappu, J.T. Surfactants and Interfacial Phenomena; John Wiley & Sons: Hoboken, NJ, USA, 2012; pp. 1–38. [Google Scholar]
- Lauth, G.J.; Kowalczyk, J. Einführung in die Physik und Chemie der Grenzflächen und Kolloide; Springer Spektrum: Heidelberg/Berlin, Germany, 2016; pp. 53–89. [Google Scholar]
- Callen, H.B. Thermodynamics And An Introduction To Thermostatics; John Wiley & Sons: New York, NY, USA, 1985; pp. 35–58. [Google Scholar]
- Nernst, W. Ueber die Berechnung chemischer Gleichgewichte aus thermischen Messungen. Nachr. Ges. Wiss. Göttingen Math. Phys. Kl. 1906, 1906, 1–40. [Google Scholar]
- McClements, J.D.; Dickinson, E.; Povey, M. Crystallization in hydrocarbon-in-water emulsions containing a mixture of solid and liquid droplets. Chem. Phys. Lett. 1990, 172, 449–452. [Google Scholar] [CrossRef]
- McClements, D.J.; Dungan, S.R. Effect of Colloidal Interactions on the Rate of Interdroplet Heterogeneous Nucleation in Oil-in-Water Emulsions. J. Colloid Interface Sci. 1997, 186, 17–28. [Google Scholar] [CrossRef] [PubMed]
- Dickinson, E.; Kruizenga, F.-J.; Povey, M.J.; van der Molen, M. Crystallization in oil-in-water emulsions containing liquid and solid droplets. Colloids Surf. A Physicochem. Eng. Asp. 1993, 81, 273–279. [Google Scholar] [CrossRef]
- Hindle, S.A.; Povey, M.J.W.; Smith, K. Kinetics of Crystallization in n-Hexadecane and Cocoa Butter Oil-in-Water Emulsions Accounting for Droplet Collision-Mediated Nucleation. J. Colloid Interface Sci. 2000, 232, 370–380. [Google Scholar] [CrossRef]
- Dudek, M.; Fernandes, D.; Helno Herø, E.; Øye, G. Microfluidic method for determining drop-drop coalescence and contact times in flow. Colloids Surf. A Physicochem. Eng. Asp. 2019, 586, 124265. [Google Scholar] [CrossRef]
- Basheva, E.S.; Kralchevsky, P.A.; Danov, K.D.; Ananthapadmanabhan, K.P.; Lips, A. The colloid structural forces as a tool for particle characterization and control of dispersion stability. Phys. Chem. Chem. Phys. 2007, 9, 5183–5198. [Google Scholar] [CrossRef] [PubMed]
- Vanapalli, S.A.; Coupland, J.N. Orthokinetic Stability of Food Emulsions. In Food Emulsions; Friberg, S., Ed.; CRC Press: Boca Raton, FL, USA, 2003; pp. 327–352. [Google Scholar]
- Kaysan, G.; Schork, N.; Herberger, S.; Guthausen, G.; Kind, M. Contact-mediated nucleation in melt emulsions investigated by Rheo-NMR. Magn. Reson. Chem. 2021. [Google Scholar] [CrossRef]
- Chesters, A. The modelling of coalescence processes in fluid-liquid dispersions: A review of current understanding. Chem. Eng. Res. Des. 1991, 69, 259–270. [Google Scholar]
- Bremond, N.; Bibette, J. Exploring emulsion science with microfluidics. Soft Matter 2012, 8, 10549–10559. [Google Scholar] [CrossRef]
- Puigmartí-Luis, J. Microfluidic platforms: A mainstream technology for the preparation of crystals. Chem. Soc. Rev. 2013, 43, 2253–2271. [Google Scholar] [CrossRef] [PubMed]
- Whitesides, G.M. The origins and the future of microfluidics. Nature 2006, 442, 368–373. [Google Scholar] [CrossRef] [PubMed]
- Muijlwijk, K.; Berton-Carabin, C.; Schroën, K. Cross-flow microfluidic emulsification from a food perspective. Trends Food Sci. Technol. 2016, 49, 51–63. [Google Scholar] [CrossRef]
- Schroën, K.; Bliznyuk, O.; Muijlwijk, K.; Sahin, S.; Berton-Carabin, C.C. Microfluidic emulsification devices: From micrometer insights to large-scale food emulsion production. Curr. Opin. Food Sci. 2015, 3, 33–40. [Google Scholar] [CrossRef]
- Won, J.Y.; Krägel, J.; Makievski, A.V.; Javadi, A.; Gochev, G.; Loglio, G.; Pandolfini, P.; Leser, M.E.; Gehin-Delval, C.; Miller, R. Drop and bubble micro manipulator (DBMM)—A unique tool for mimicking processes in foams and emulsions. Colloids Surf. A Physicochem. Eng. Asp. 2013, 441, 807–814. [Google Scholar] [CrossRef]
- Dickinson, E.; Murray, B.S.; Stainsby, G. Coalescence stability of emulsion-sized droplets at a planar oil–water interface and the relationship to protein film surface rheology. J. Chem. Soc. Faraday Trans. 1 Phys. Chem. Condens. Phases 1988, 84, 871–883. [Google Scholar] [CrossRef]
- Neumann, S.M.; van der Schaaf, U.S.; Karbstein, H.P. Investigations on the relationship between interfacial and single droplet experiments to describe instability mechanisms in double emulsions. Colloids Surf. A Physicochem. Eng. Asp. 2018, 553, 464–471. [Google Scholar] [CrossRef]
- Taboada, M.; Leister, N.; Karbstein, H.P.; Gaukel, V. Influence of the Emulsifier System on Breakup and Coalescence of Oil Droplets during Atomization of Oil-In-Water Emulsions. ChemEngineering 2020, 4, 47. [Google Scholar] [CrossRef]
- Shinnar, R.; Church, J.M. Statistical Theories of Turbulence in Predicting Particle Size in Agitated Dispersions. Ind. Eng. Chem. 1960, 52, 253–256. [Google Scholar] [CrossRef]
- Verwey, E.J.W. Theory of the stability of lyophobic colloids. J. Phys. Colloid Chem. 1947, 51, 631–636. [Google Scholar] [CrossRef]
- Derjaguin, B.; Landau, L. Theory of the stability of strongly charged lyophobic sols and of the adhesion of strongly charged particles in solutions of electrolytes. Prog. Surf. Sci. 1993, 43, 30–59. [Google Scholar] [CrossRef]
- Fuchs, N. Über die Stabilität und Aufladung der Aerosole. Eur. Phys. J. A 1934, 89, 736–743. [Google Scholar] [CrossRef]
- Dimitrova, T.D.; Leal-Calderon, F. Forces between Emulsion Droplets Stabilized with Tween 20 and Proteins. Langmuir 1999, 15, 8813–8821. [Google Scholar] [CrossRef]
- Israelachvili, J.N. Intermolecular and Surface Forces, 3rd ed.; Academic Press: Burlington, MA, USA, 2011; pp. 191–499. [Google Scholar]
- Trokhymchuk, A.; Henderson, D.; Nikolov, A.; Wasan, D.T. A Simple Calculation of Structural and Depletion Forces for Fluids/Suspensions Confined in a Film. Langmuir 2001, 17, 4940–4947. [Google Scholar] [CrossRef]
- Hanwell, M.D.; Curtis, D.E.; Lonie, D.C.; Vandermeersch, T.; Zurek, E.; Hutchison, G.R. Avogadro: An advanced semantic chemical editor, visualization, and analysis platform. J. Cheminform. 2012, 4, 17. [Google Scholar] [CrossRef] [PubMed]
- Chou, W.-L.; Lee, P.-Y.; Yang, C.-L.; Huang, W.-Y.; Lin, Y.-S. Recent Advances in Applications of Droplet Microfluidics. Micromachines 2015, 6, 1249–1271. [Google Scholar] [CrossRef]
- Angeli, P.; Gavriilidis, A. Hydrodynamics of Taylor flow in small channels: A Review. Proc. Inst. Mech. Eng. Part C: J. Mech. Eng. Sci. 2008, 222, 737–751. [Google Scholar] [CrossRef]
- Baroud, C.N.; Gallaire, F.; Dangla, R. Dynamics of microfluidic droplets. Lab Chip 2010, 10, 2032–2045. [Google Scholar] [CrossRef]
- Musterd, M.; van Steijn, V.; Kleijn, C.R.; Kreutzer, M.T. Calculating the volume of elongated bubbles and droplets in microchannels from a top view image. RSC Adv. 2015, 5, 16042–16049. [Google Scholar] [CrossRef]
- Selzer, D.; Spiegel, B.; Kind, M. A Generic Polycarbonate Based Microfluidic Tool to Study Crystal Nucleation in Microdroplets. J. Cryst. Process. Technol. 2018, 8, 1–17. [Google Scholar] [CrossRef]
- McClements, D.; Dungan, S.; German, J.; Simoneau, C.; Kinsella, J. Droplet Size and Emulsifier Type Affect Crystallization and Melting of Hydrocarbon-in-Water Emulsions. J. Food Sci. 1993, 58, 1148–1151. [Google Scholar] [CrossRef]
- Vélez, C.; Khayet, M.; Ortiz de Zárate, J.M. Temperature-dependent thermal properties of solid/liquid phase change even-numbered n-alkanes: N-Hexadecane, n-octadecane and n-eicosane. Appl. Energy 2015, 143, 383–394. [Google Scholar] [CrossRef]
- Zou, G.L.; Tan, Z.C.; Lan, X.Z.; Sun, L.X.; Zhang, T. Preparation and characterization of microencapsulated hexadecane used for thermal energy storage. Chin. Chem. Lett. 2004, 15, 729–732. [Google Scholar]
- González, J.A.; Zawadzki, M.; Domanska, U. Thermodynamics of mixtures containing polycyclic aromatic hydrocarbons. J. Mol. Liq. 2008, 143, 134–140. [Google Scholar] [CrossRef]
- Zhang, P.; Ma, Z.; Wang, R. An overview of phase change material slurries: MPCS and CHS. Renew. Sustain. Energy Rev. 2010, 14, 598–614. [Google Scholar] [CrossRef]
- Spiegel, B.; Käfer, A.; Kind, M. Crystallization Behavior and Nucleation Kinetics of Organic Melt Droplets in a Microfluidic Device. Cryst. Growth Des. 2018, 18, 3307–3316. [Google Scholar] [CrossRef]
- Schroën, K.; de Ruiter, J.; Berton-Carabin, C. The Importance of Interfacial Tension in Emulsification: Connecting Scaling Relations Used in Large Scale Preparation with Microfluidic Measurement Methods. ChemEngineering 2020, 4, 63. [Google Scholar] [CrossRef]
- Hashimoto, M.; Garstecki, P.; Stone, H.A.; Whitesides, G.M. Interfacial instabilities in a microfluidic Hele-Shaw cell. Soft Matter 2008, 4, 1403–1413. [Google Scholar] [CrossRef] [PubMed]
- van der Graaf, S.; Schroën, C.G.P.H.; van der Sman, R.G.M.; Boom, R.M. Influence of dynamic interfacial tension on droplet formation during membrane emulsification. J. Colloid Interface Sci. 2004, 277, 456–463. [Google Scholar] [CrossRef]
- Miller, R.; Aksenenko, E.; Fainerman, V. Dynamic interfacial tension of surfactant solutions. Adv. Colloid Interface Sci. 2017, 247, 115–129. [Google Scholar] [CrossRef]
- Tween®20; Safety Data Sheet for Tween® 20 (Polysorbat) 817072 [Online]; MERCK: Darmstadt, Germany, 5 December 2020; Available online: https://www.merckmillipore.com/DE/de/product/msds/MDA_CHEM-817072 (accessed on 31 May 2021).
- Tween®20; Product Information on Polyoxyethylenesorbitan Monolaurate (Tween20) [Online]; Sigma Aldrich: St. Louis, MO, USA, 29 July 2021; Available online: https://www.sigmaaldrich.com/content/dam/sigma-aldrich/docs/Sigma/Product_Information_Sheet/1/p6585pis.pdf (accessed on 24 November 2021).
- Pollard, J.M.; Shi, A.J.; Göklen, K.E. Solubility and Partitioning Behavior of Surfactants and Additives Used in Bioprocesses. J. Chem. Eng. Data 2006, 51, 230–236. [Google Scholar] [CrossRef]
- Jin, F.; Balasubramaniam, R.; Stebe, K.J. Surfactant Adsorption to Spherical Particles: The Intrinsic Length Scale Governing the Shift from Diffusion to Kinetic-Controlled Mass Transfer. J. Adhes. 2004, 80, 773–796. [Google Scholar] [CrossRef]
- Staszak, M. A Linear Diffusion Model of Adsorption Kinetics at Fluid/Fluid Interfaces. J. Surfactants Deterg. 2016, 19, 297–314. [Google Scholar] [CrossRef] [PubMed]
- Chanamai, R.; McClements, D. Isothermal titration calorimetry measurement of enthalpy changes in monodisperse oil-in-water emulsions undergoing depletion flocculation. Colloids Surf. A Physicochem. Eng. Asp. 2001, 181, 261–269. [Google Scholar] [CrossRef]
- Helenius, A.; McCaslin, D.R.; Fries, E.; Tanford, C. Properties of detergents. In Biomembranes Part G: Bioenergetics: Biogenesis of Mitochondria, Organization, and Transport; Kaplan, N.P., Colowick, N.P., Fleischer, S., Sies, H., Eds.; Elsevier: Amsterdam, The Netherlands, 1979; pp. 734–749. [Google Scholar]
- Bera, B.; Khazal, R.; Schroën, K. Coalescence dynamics in oil-in-water emulsions at elevated temperatures. Sci. Rep. 2021, 11, 1–10. [Google Scholar] [CrossRef]
- Nowak, E.; Kovalchuk, N.; Che, Z.; Simmons, M. Effect of surfactant concentration and viscosity of outer phase during the coalescence of a surfactant-laden drop with a surfactant-free drop. Colloids Surf. A Physicochem. Eng. Asp. 2016, 505, 124–131. [Google Scholar] [CrossRef]
- Scriven, L.E.; Sterling, C.V. The Marangoni Effects. Nature 1960, 187, 186–188. [Google Scholar] [CrossRef]
- Schuchmann, H.P.; Danner, T. Emulgieren: Mehr als nur Zerkleinern. Chemie Ingenieur Technik 2004, 76, 364–375. [Google Scholar] [CrossRef]
- Köhler, K.; Hensel, A.; Kraut, M.; Schuchmann, H.P. Melt emulsification—Is there a chance to produce particles without additives? Particuology 2011, 9, 506–509. [Google Scholar] [CrossRef]
- Chen, J.-D.; Hahn, P.S.; Slattery, J.C. Coalescence time for a small drop or bubble at a fluid-fluid interface. AIChE J. 1984, 30, 622–630. [Google Scholar] [CrossRef]
- Mackay, G.D.M.; Mason, S.G. The gravity approach and coalescence of fluid drops at liquid interfaces. Can. J. Chem. Eng. 1963, 41, 203–212. [Google Scholar] [CrossRef]
- Hodgson, T.; Woods, D. The effect of surfactants on the coalescence of a drop at an interface. II. J. Colloid Interface Sci. 1969, 30, 429–446. [Google Scholar] [CrossRef]
- Leister, N.; Karbstein, H.P. Influence of Hydrophilic Surfactants on the W1–W2 Coalescence in Double Emulsion Systems Investigated by Single Droplet Experiments. Colloids Interfaces 2021, 5, 21. [Google Scholar] [CrossRef]
- Christov, N.C.; Danov, K.D.; Zeng, Y.; Kralchevsky, P.A.; von Klitzing, R. Oscillatory Structural Forces Due to Nonionic Surfactant Micelles: Data by Colloidal-Probe AFM vs. Theory. Langmuir 2010, 26, 915–923. [Google Scholar] [CrossRef] [PubMed]
- Hsu, J.-P.; Nacu, A. Behavior of soybean oil-in-water emulsion stabilized by nonionic surfactant. J. Colloid Interface Sci. 2003, 259, 374–381. [Google Scholar] [CrossRef]
- Hammer, M.U.; Anderson, T.H.; Chaimovich, A.; Shell, M.S.; Israelachvili, J. The search for the hydrophobic force law. Faraday Discuss. 2010, 146, 299–308. [Google Scholar] [CrossRef] [PubMed]
- Meyer, E.E.; Rosenberg, K.J.; Israelachvili, J. Recent progress in understanding hydrophobic interactions. Proc. Natl. Acad. Sci. USA 2006, 103, 15739–15746. [Google Scholar] [CrossRef]
- Zhang, X.; Zhu, Y.; Granick, S. Softened hydrophobic Attraction between Macroscopic Surfaces in Relative Motion. J. Am. Chem. Soc. 2001, 123, 6736–6737. [Google Scholar] [CrossRef]
- Singh, S.; Houston, J.; van Swol, F.; Brinker, C.J. Superhydrophobicity: Drying transition of confined water. Nature 2006, 442, 526. [Google Scholar] [CrossRef]
- Krawczyk, M.A.; Wasan, D.T.; Shetty, C. Chemical demulsification of petroleum emulsions using oil-soluble demulsifiers. Ind. Eng. Chem. Res. 1991, 30, 367–375. [Google Scholar] [CrossRef]
- Opawale, F.O.; Burgess, D.J. Influence of Interfacial Properties of Lipophilic Surfactants on Water-in-Oil Emulsion Stability. J. Colloid Interface Sci. 1998, 197, 142–150. [Google Scholar] [CrossRef] [PubMed]
- Muijlwijk, K.; Colijn, I.; Harsono, H.; Krebs, T.; Berton-Carabin, C.; Schroën, K. Coalescence of protein-stabilised emulsions studied with microfluidics. Food Hydrocoll. 2017, 70, 96–104. [Google Scholar] [CrossRef]


Publisher’s Note: MDPI stays neutral with regard to jurisdictional claims in published maps and institutional affiliations. |
© 2021 by the authors. Licensee MDPI, Basel, Switzerland. This article is an open access article distributed under the terms and conditions of the Creative Commons Attribution (CC BY) license (https://creativecommons.org/licenses/by/4.0/).