Article

Simulation of Cold Atmospheric Plasma Generated by Floating-Electrode Dielectric Barrier Pulsed Discharge Used for the Cancer Cell Necrosis

1
Department of Physics, College of Sciences, Princess Nourah Bint Abdulrahman University, Riyadh 11671, Saudi Arabia
2
Research Unit of Ionized Backgrounds and Reagents Studies (UEMIR), Preparatory Institute for Engineering Studies of Monastir (IPEIM), University of Monastir, Kairouan Street, Monastir 5019, Tunisia
*
Author to whom correspondence should be addressed.
Coatings 2021, 11(11), 1405; https://doi.org/10.3390/coatings11111405
Submission received: 20 October 2021 / Revised: 9 November 2021 / Accepted: 17 November 2021 / Published: 19 November 2021
(This article belongs to the Special Issue Plasma Surface Engineering II)

Abstract

:
A numerical simulation of a pulsed floating electrode dielectric barrier discharge (FE-DBD) at atmospheric pressure, used for melanoma cancer cell therapy, is performed using a plasma model in COMSOL Multiphysics software. Distributions of electron density, space charge, and electric field are presented at different instants of the pulsed argon discharge. Significant results related to the characteristics of the plasma device used, the inter-electrodes distance, and the power supply are obtained to improve the efficiency of FE-DBD apparatus for melanoma cancer cell treatment. The FE-DBD presents a higher sensitivity to short pulse durations, related to the accumulated charge over the dielectric barrier around the powered electrode. At higher applied voltage, more energy is injected into the discharge channel and an increase in electron density and electric consumed power is noted. Anticancer activity provided by the FE-DBD plasma is improved using a small interelectrode distance with a high electron emission coefficient and a high dielectric constant with a small dielectric thickness, allowing higher electron density, generating reactive species responsible for the apoptosis of tumor cells.

1. Introduction

In the past decades, cold plasma discharge generated at atmospheric pressure has received an increasing amount of attention due to the outstanding quality it offers and the vast range of applications in the medical field, such as bio-sterilization, skin regeneration, wound healing, teeth bleaching, blood coagulation, and engineering of biomaterial and tissues [1,2,3,4]. Recently, it was shown that this plasma-activated medium could be a potential anti-tumor drug for the treatment of cancer cells, and this treatment could be a promising approach to chemotherapy [5,6,7].
Most biomedical devices using cold plasma discharge implement dielectric barrier discharge (DBD) to provide a higher intensity and more adaptable and controlled discharge [8,9,10,11]. Accordingly, plasma is generated between a powered voltage electrode and a grounded one, separated by an insulating dielectric layer. DBD plasma could be ignited by an alternating or pulsed voltage with magnitudes in kilovolts and frequencies in kilohertz to ensure capacitive coupling.
The floating electrode dielectric barrier discharge (FE-DBD) presents a novel approach specially developed for biomedical applications, with a high practical potential for cancer cell treatment [12]. In this configuration, FE-DBD devices do not contain a grounded electrode, which is replaced by affected living tissue or organ and, technically, a sustained discharge is activated between a covered dielectric driven electrode and a specimen surface applied with a floating (free) potential. To ignite plasma, the distance between the working electrode and the surface being treated is approximately 3 mm, depending upon the form, polarity, and the applied voltage signal period.
The first interest in this type of discharge is to be able to place the smooth surfaces and biological living tissues to be treated in direct contact with the plasma volume while maintaining an important electric field and a continuous flow of charged particles, which makes a significant contribution during biomedical treatment and removes bacteria colonizing these surfaces [13]. The second interest is related to the dissipated energy, which results in a high chemical reactivity [14].
In the medical treatment of living tissue with FE-DBD plasma, three dispositions of electrodes devices were provided to accommodate the treatment of different sizes and configurations of samples that are clinically used and experimentally tested [15]. Experimentally, the floating electrodes, coupling with dielectric barrier discharge introduced into gas plasma sources development, have improved their performances.
This approach for novel cancer therapy is healthy and safe for animal and human tissue treatment, preventing any visible or microscopic tissue injury [16,17]. The ability of FE-DBD plasma to treat various types of cancer effectively by selectively killing cancer cells without deterioration of surrounding tissues was tested [18,19] and the dose plasma that caused minimal immediate toxicity was experimentally identified [20].
Subsequently, a comparative study of two plasma sources (floating-electrode dielectric barrier discharge and atmospheric pressure argon plasma jet) on cancer cell therapy performed by Bekeschus [21] illustrated that the plasma technique has genuine potential for practical cancer therapy, and the total number of tumor cells injected under the skin of mice decreased significantly after 24 h following treatment. Recently, Adil et al. [22] illustrated that breast cancer, which frequently develops drug resistance during chemotherapy, can be effectively treated by FE-DBD plasma in vivo and in vitro models.
Despite the high level of interest, there are surprisingly few numerical reports dealing with FE-DBD discharge and analyzing the effect of various study parameters on this discharge behavior. Consequently, numerical studies of DBD discharge ignited by the pulsed voltage at atmospheric pressure were carried out to provide more details on the mechanism of discharge behavior and breakdown.
Simulations of nanosecond pulsed dielectric barriers discharge in atmospheric pressure air were presented by Bak et al. [23] where a reversal was predicted in gap potential due to the accumulated charge, even when there was no reversal in applied potential. Furthermore, the electrical characteristics of the atmospheric pulsed dielectric barrier discharges in different working gases and at varying frequencies was discussed based on a 1-D fluid model [24,25]. Subsequently, a fluid dynamic model of floating electrode was performed by Joo [26] and compared with three other boundary conditions: grounded, dielectric, and surface charge density to simulate a plasma processing system. More recently, the interaction of atmospheric He plasma jets, generated at kHz µs-pulsed voltage, with metallic targets was investigated by Viegas [27] through simulations and experiments, focused on the differences between floating and grounded targets. In addition, a numerical evaluation of the efficiency of a FE-DBD plasma intended for microbial inactivation was illustrated by Arserim [28], who described distribution of reactive species within the plasma system.
In this study, a two-dimensional (2D) simulation of the FE-DBD operated with argon gas for melanoma cancer cells therapy is developed using COMSOL Multiphysics 5.4 software to investigate the structure and the dynamics of the discharge. The simulated discharge is generated at atmospheric pressure and at room temperature between the surface treated and a powered electrode charged with high pulsed voltage (magnitudes in kilovolts and frequencies in kilohertz) and enveloped by a quartz dielectric barrier to significantly decrease the ignition voltage of nonthermal arc discharges.
The results are studied in terms of density of electrons, space charge distribution, and evolution of the electric field in the interelectrode space for plasma argon, chosen because of its broad use in biomedical applications and its role for killing bacteria [29]. The influence of various operating parameters, such as the pulse frequency, the magnitude of the high voltage, the secondary emission coefficient, the interelectrode distance, and the dielectric barrier capacity on the discharge behavior are discussed and analyzed to have a better understanding of the mechanism involved.

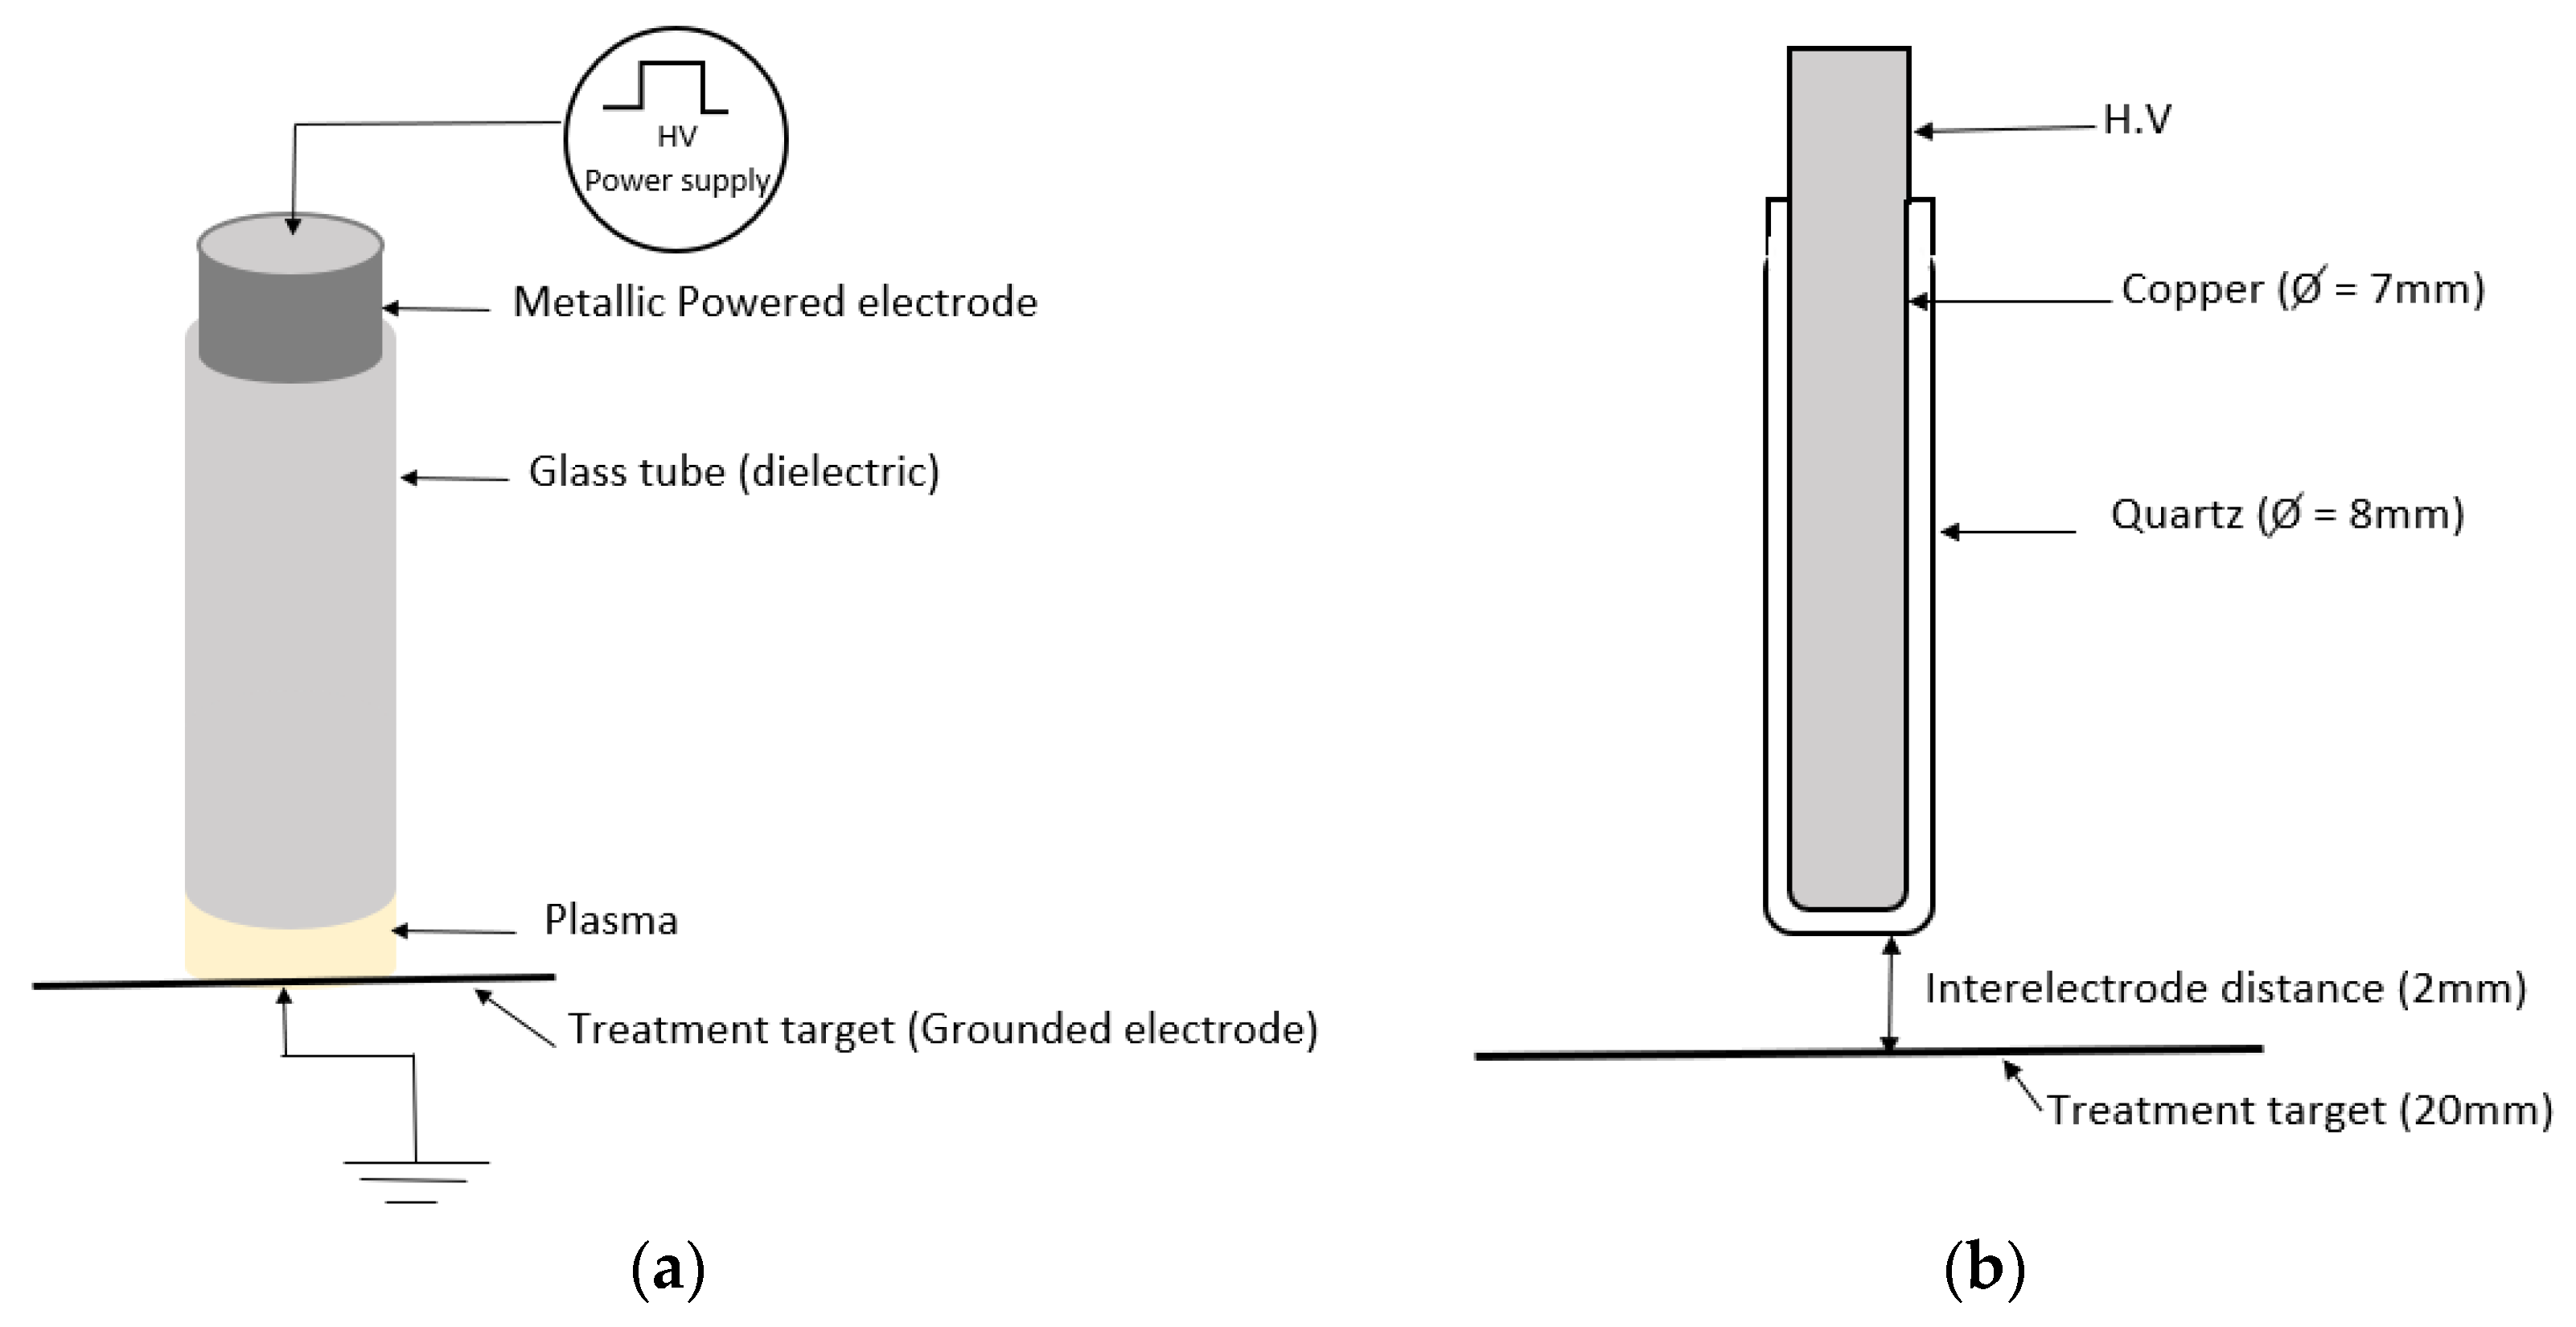
2. Configuration of Argon FE-DBD Plasma Generator

The device generating a FE-DBD argon plasma employed in this paper is presented in Figure 1. This configuration has been used other experimental research [30,31].
The present device is composed of a cylindrical copper rod (7 mm diameter) isolated in a quartz tube with an outer diameter of 8 mm and an inner diameter of 7 mm, to limit the risk of occurrence of an electric arc. This powered electrode is connecting to a high DC power supply capable of sending short and repeated voltage pulses, and the second electrode is connected to the ground of the latter. This leaves a gap of 2 mm where the argon carrier gas is injected. The voltage generator delivers high voltage pulses varying from 5 kV to 10 kV with a variable frequency and pulse duration (respectively, from 1 Hz to 10 kHz and from 250 ns to 1.75 μs). The repetitive monopolar rectangular voltage pulses operate with rise and fall times of approximately 80 ns [32].

3. Simulation Model

3.1. Elementary Process and Basic Equations

A two-dimensional, cylindrical symmetric coordinate system for modelling the pulsed FE-DBD in argon at atmospheric pressure is presented in this article using a self-consistent fluid approach in COMSOL Multiphysics 5.4 [33].
The simplest set of equations are the fluid equations with various constitutive relationships for the drift velocities, diffusion coefficients, ionization coefficient, and attachment coefficient, associated with Poisson’s equation for solving the electric field. The details for this model can be found elsewhere [34].
The 2D time-dependent continuity equation for analyzing the dynamic distribution of electrons, ions, and neutral particles defined by
t ( N * ) + · Γ * = S *
where N is the particle number density having a particle flux density Γ with subscript * specify e, i, and np, for electrons, ions, and neutral particles, respectively; S is the particle source term.
Using the drift-diffusion equation approximation, the particle flux density can be determined by:
Γ e = ( μ e E ) N e ( D e N e )
Γ i = ( μ i E ) N i ( D i N i )
where E is the electric field, D is the diffusion coefficient, and μ is the mobility.
Only the diffusion component must be considered in the flux for treating the neutral particles:
Γ n p = ( D n p N n p )
The rate of change of the electron energy density is described by
t ( N ε ) + · Γ ε + E · Γ e = S e n
Γ ε = ( μ ε E ) N ε ( D ε N ε )
where N ε is the electron energy density, S e n is the energy loss or gain due to inelastic collisions, and μ ε and D ε are, respectively, the electron energy mobility and the electron energy diffusivity.
According to the Einstein formula, the electron mobility, the electron diffusivity, the electron energy mobility, and electron energy diffusivity satisfy the relationships:
D e = μ e T e ,   μ ε = ( 5 / 3 ) μ e   and   D ε = μ ε T e
where T e is the electron temperature and the relation between the mean electron energy ε a v g and the electron temperature T e is:
T e = ( 2 / 3 ) ε a v g
These equations are coupled with Poisson’s equation for the calculation of the electric field. The Poisson equation and the electric field are given as follows:
· ( ε 0 ε r E ) = e ( N e N p )
E = V
where ε0 is the relative permeability of air, εr is the dielectric constant, V is the electric potential, and e is the electric charge.
The plasma chemistry used in the simulation study is given in Table 1. The rate coefficient of reactions 1–5 and the electron transport properties were calculated by the Boltzmann equation for free electrons in two-term approximations. The species in the reactions are indicated as the argon ground state (Ar), argon metastable state (Ars), argon ion (Ar+), exited argon dimer (Ar2), and argon dimer ion (Ar2+).
In addition to volumetric reactions, the following surface reactions, shown in Table 2, are implemented in the model.

3.2. Initial and Boundary Conditions

Initially, the atmospheric DBD plasma generated between two electrodes is considered. A dielectric thin film with a specific dielectric constant of 3.8 and a thickness of 0.5 mm is conformally deposited on the anode. The background gas is argon at ambient temperature (p = 760 Torr, T = 300 K, and gas density N = 2.45 × 10¹⁹·cm−3). The interelectrode distance is fixed at 2 mm and the electrode has a circular section with a radius of 3 mm.
A DC generator provides a high pulsed voltage to the powered electrode with rectangular signal of an amplitude of 10 KV, a pulse width adjusted to 1 μs, falling or rising time approximately 80 ns, and a repetition rate of 10 kHz, to apply a sufficient uniform discharge in the gap. This type of discharge enables a safe and healthy plasma treatment of the living tissue characterized by dirty, wet, and irregular surfaces.
Three initial Gaussian plasma spots in both radial and axial directions along the cylindrical anode are introduced:
N e ( r , z ) t = 0 = N 0 e x p [ ( r σ r ) 2 ( z z 0 σ z ) 2 ]  
where N0 = 1020 m−3, z0 = 1.8 mm, and σr = σz = 0, 1 mm for three radial positions r = 0; 0.5, and 1 mm.
The boundary conditions are shown for illustration:
Positive ions fluxes are fixed at zero and electron fluxes are evaluated according to the Newman boundary condition at the anode.
All positively and negatively charged fluxes are estimated using the Neumann boundary condition.
Each of the radially derivative densities are fixed at zero at the open boundaries.
The electron emission current from the cathode is proportional to the incoming positive ions current:
Γ e = γ Γ i
The secondary electron emission by positive ions coefficient γ is equal to 0.02, whereas the secondary emissions by neutral particles and photons fluxes are neglected.
Gradient density of neutral particles ∇Nnp = 0 and gradient density of positive ions ∇Ni = 0 are set to zero at the surface of the dielectric.
Furthermore, charge accumulation on the insulating surface, which is adjacent to the gap, can be calculated through the equation:
d σ d t = n · J i + n · J e
where σ is the surface charge densities accumulated on the dielectric barrier attached to the powered electrode, and nJi and nJe represent the normal component of the total ion and electron current densities, respectively, at the surfaces of the dielectric barrier.

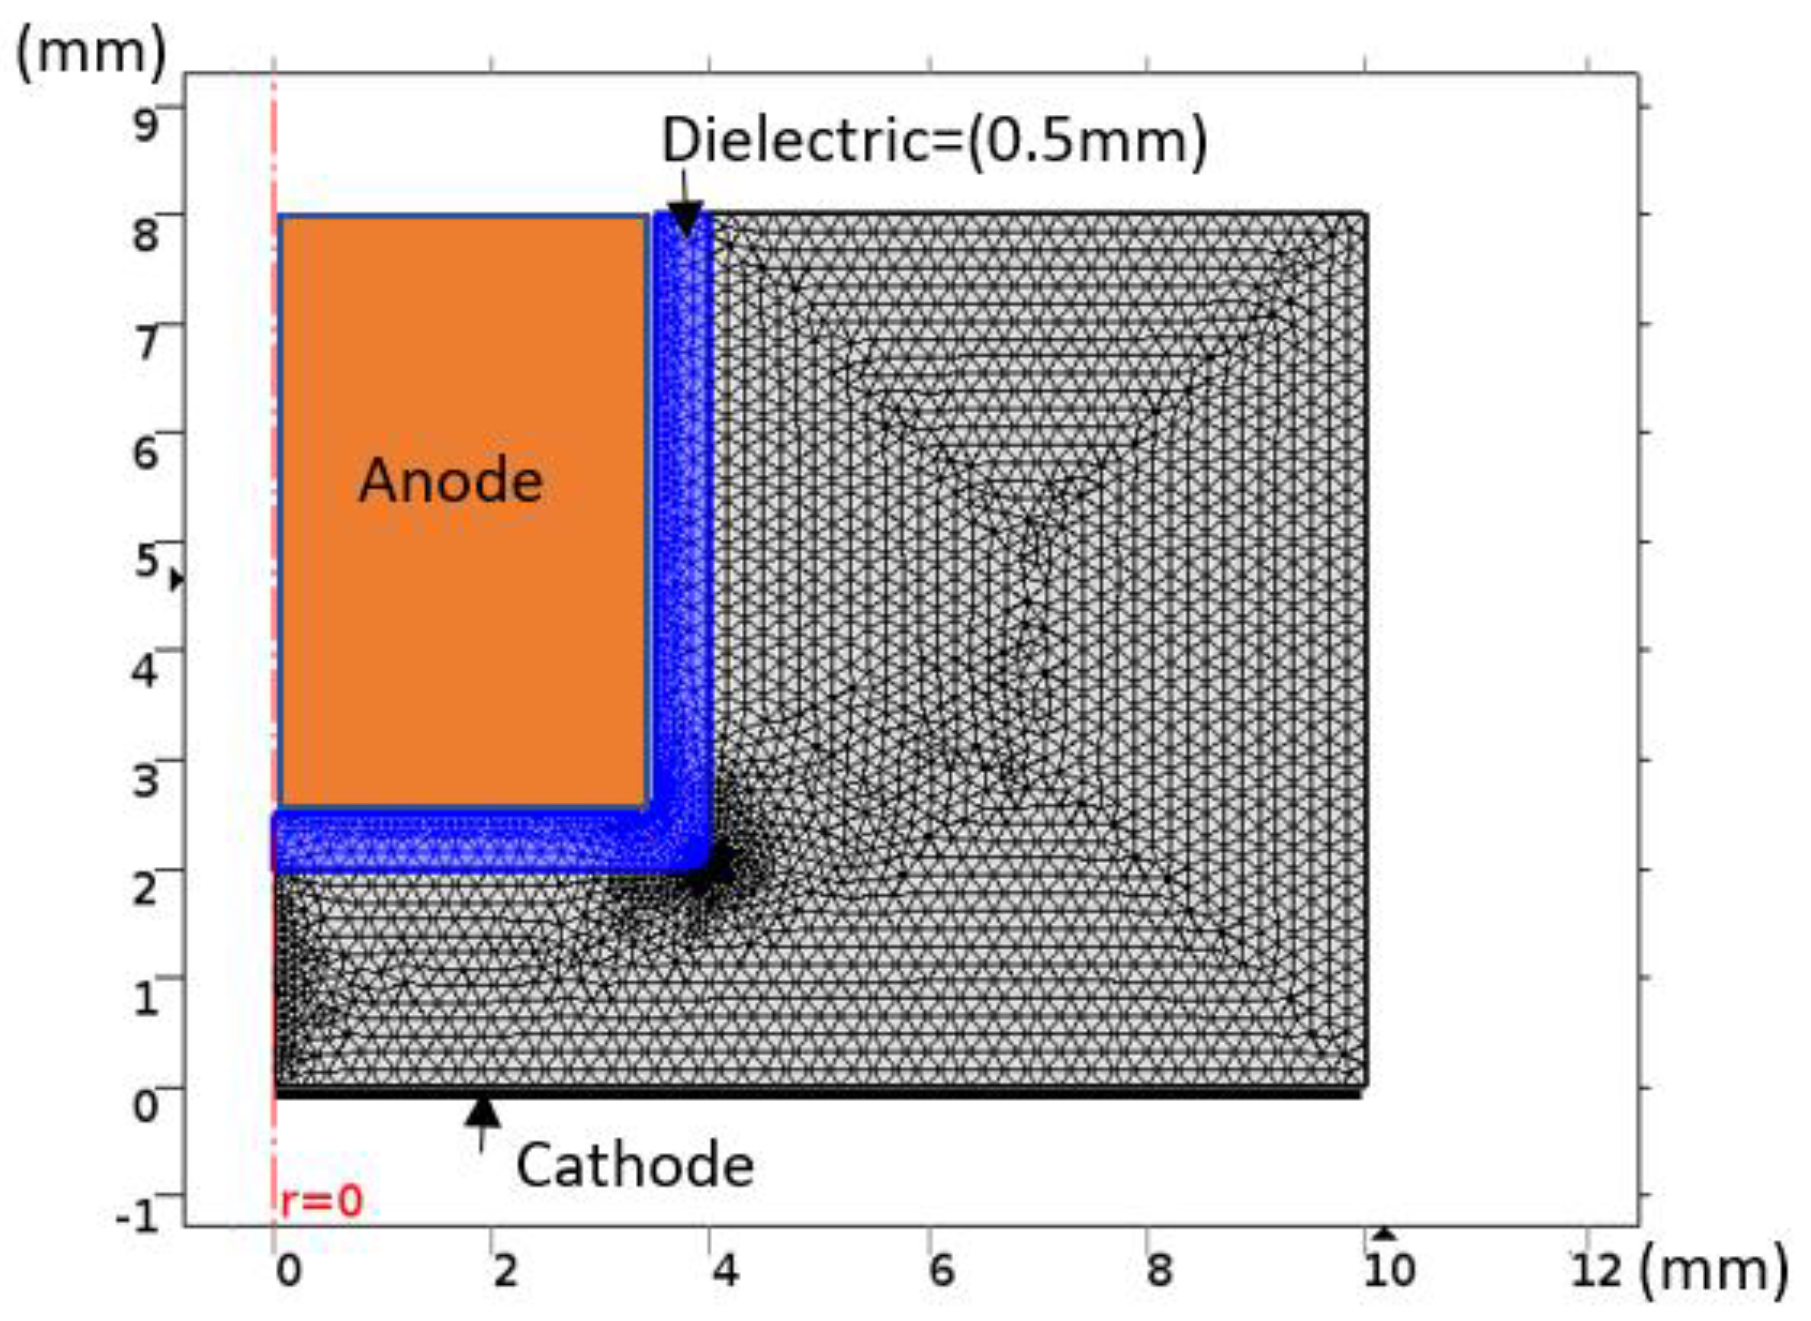
3.3. Computational Method

The numerical results obtained in this paper were calculated using the plasma module in COMSOL Multiphysics software 5.4. Differential equations were solved using the finite element method [35].
To simulate the evolution of discharge, a cylindrical domain of 10 mm radius and a height of 8 mm was selected. The computational domain is shown in Figure 2. The total number of grid cells is Nz × Nr = 1865 × 365 by taking special steps of 1 μm in the vicinity of the anode and the plane anode. Through the interelectrode space (discharge volume) variable steps are included in the radial direction, which vary from 2.5 μm to 200 μm, and a fixed step of 9 μm in the axial direction is used to reach a stable and accurate solution. The integration time step is fixed at 2.5 × 10⁻¹³ s, which is required to improve the convergence and the stability of the numerical model.

4. Results and Discussion

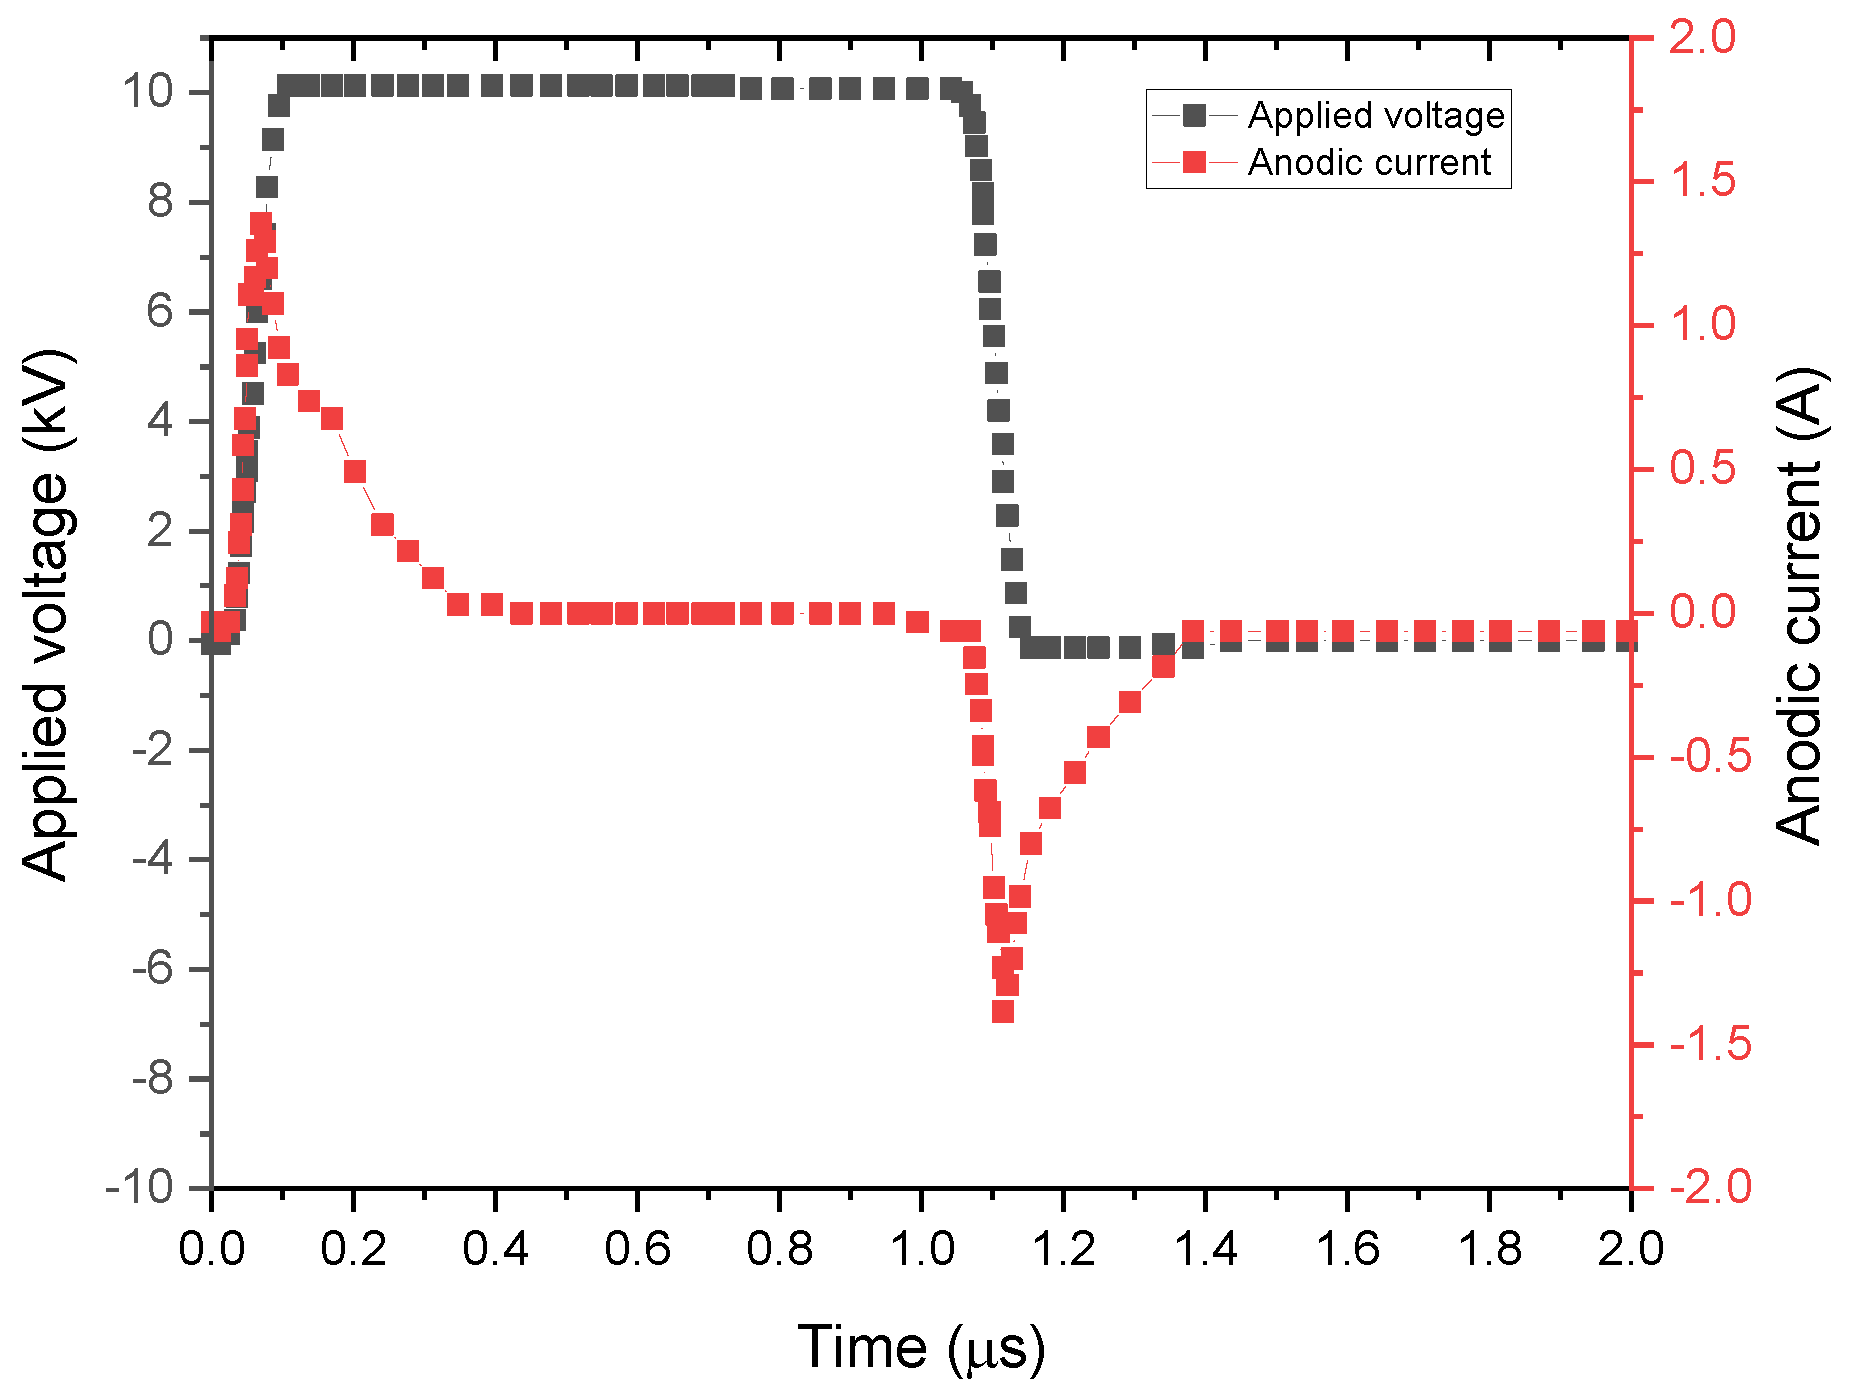
4.1. Electric Discharge Characteristics (Current-Voltage Waveform)

The instantaneous applied voltage pulse correlated with the current pulses in rise and fall times of the applied voltage, displayed in Figure 3, shows the standard behavior of a capacitive discharge signal [36,37].
The discharge current shows a first positive peak after the beginning of a high voltage pulse (at t = 50 ns), which corresponds to a first discharge in the reactor. A second current peak of negative polarity is observed at the end of the pulse, which indicates that a second discharge occurs in the reactor due to the accumulation of charged species on the dielectric during the first discharge. Furthermore, the high-frequency induction current generated in gas plasma can be divided into two components. The first one corresponds to the displacement current, produced by circuit capacitance during the rising or the falling of the supplied voltage, and the second one is the discharge current resulting from plasma generation.

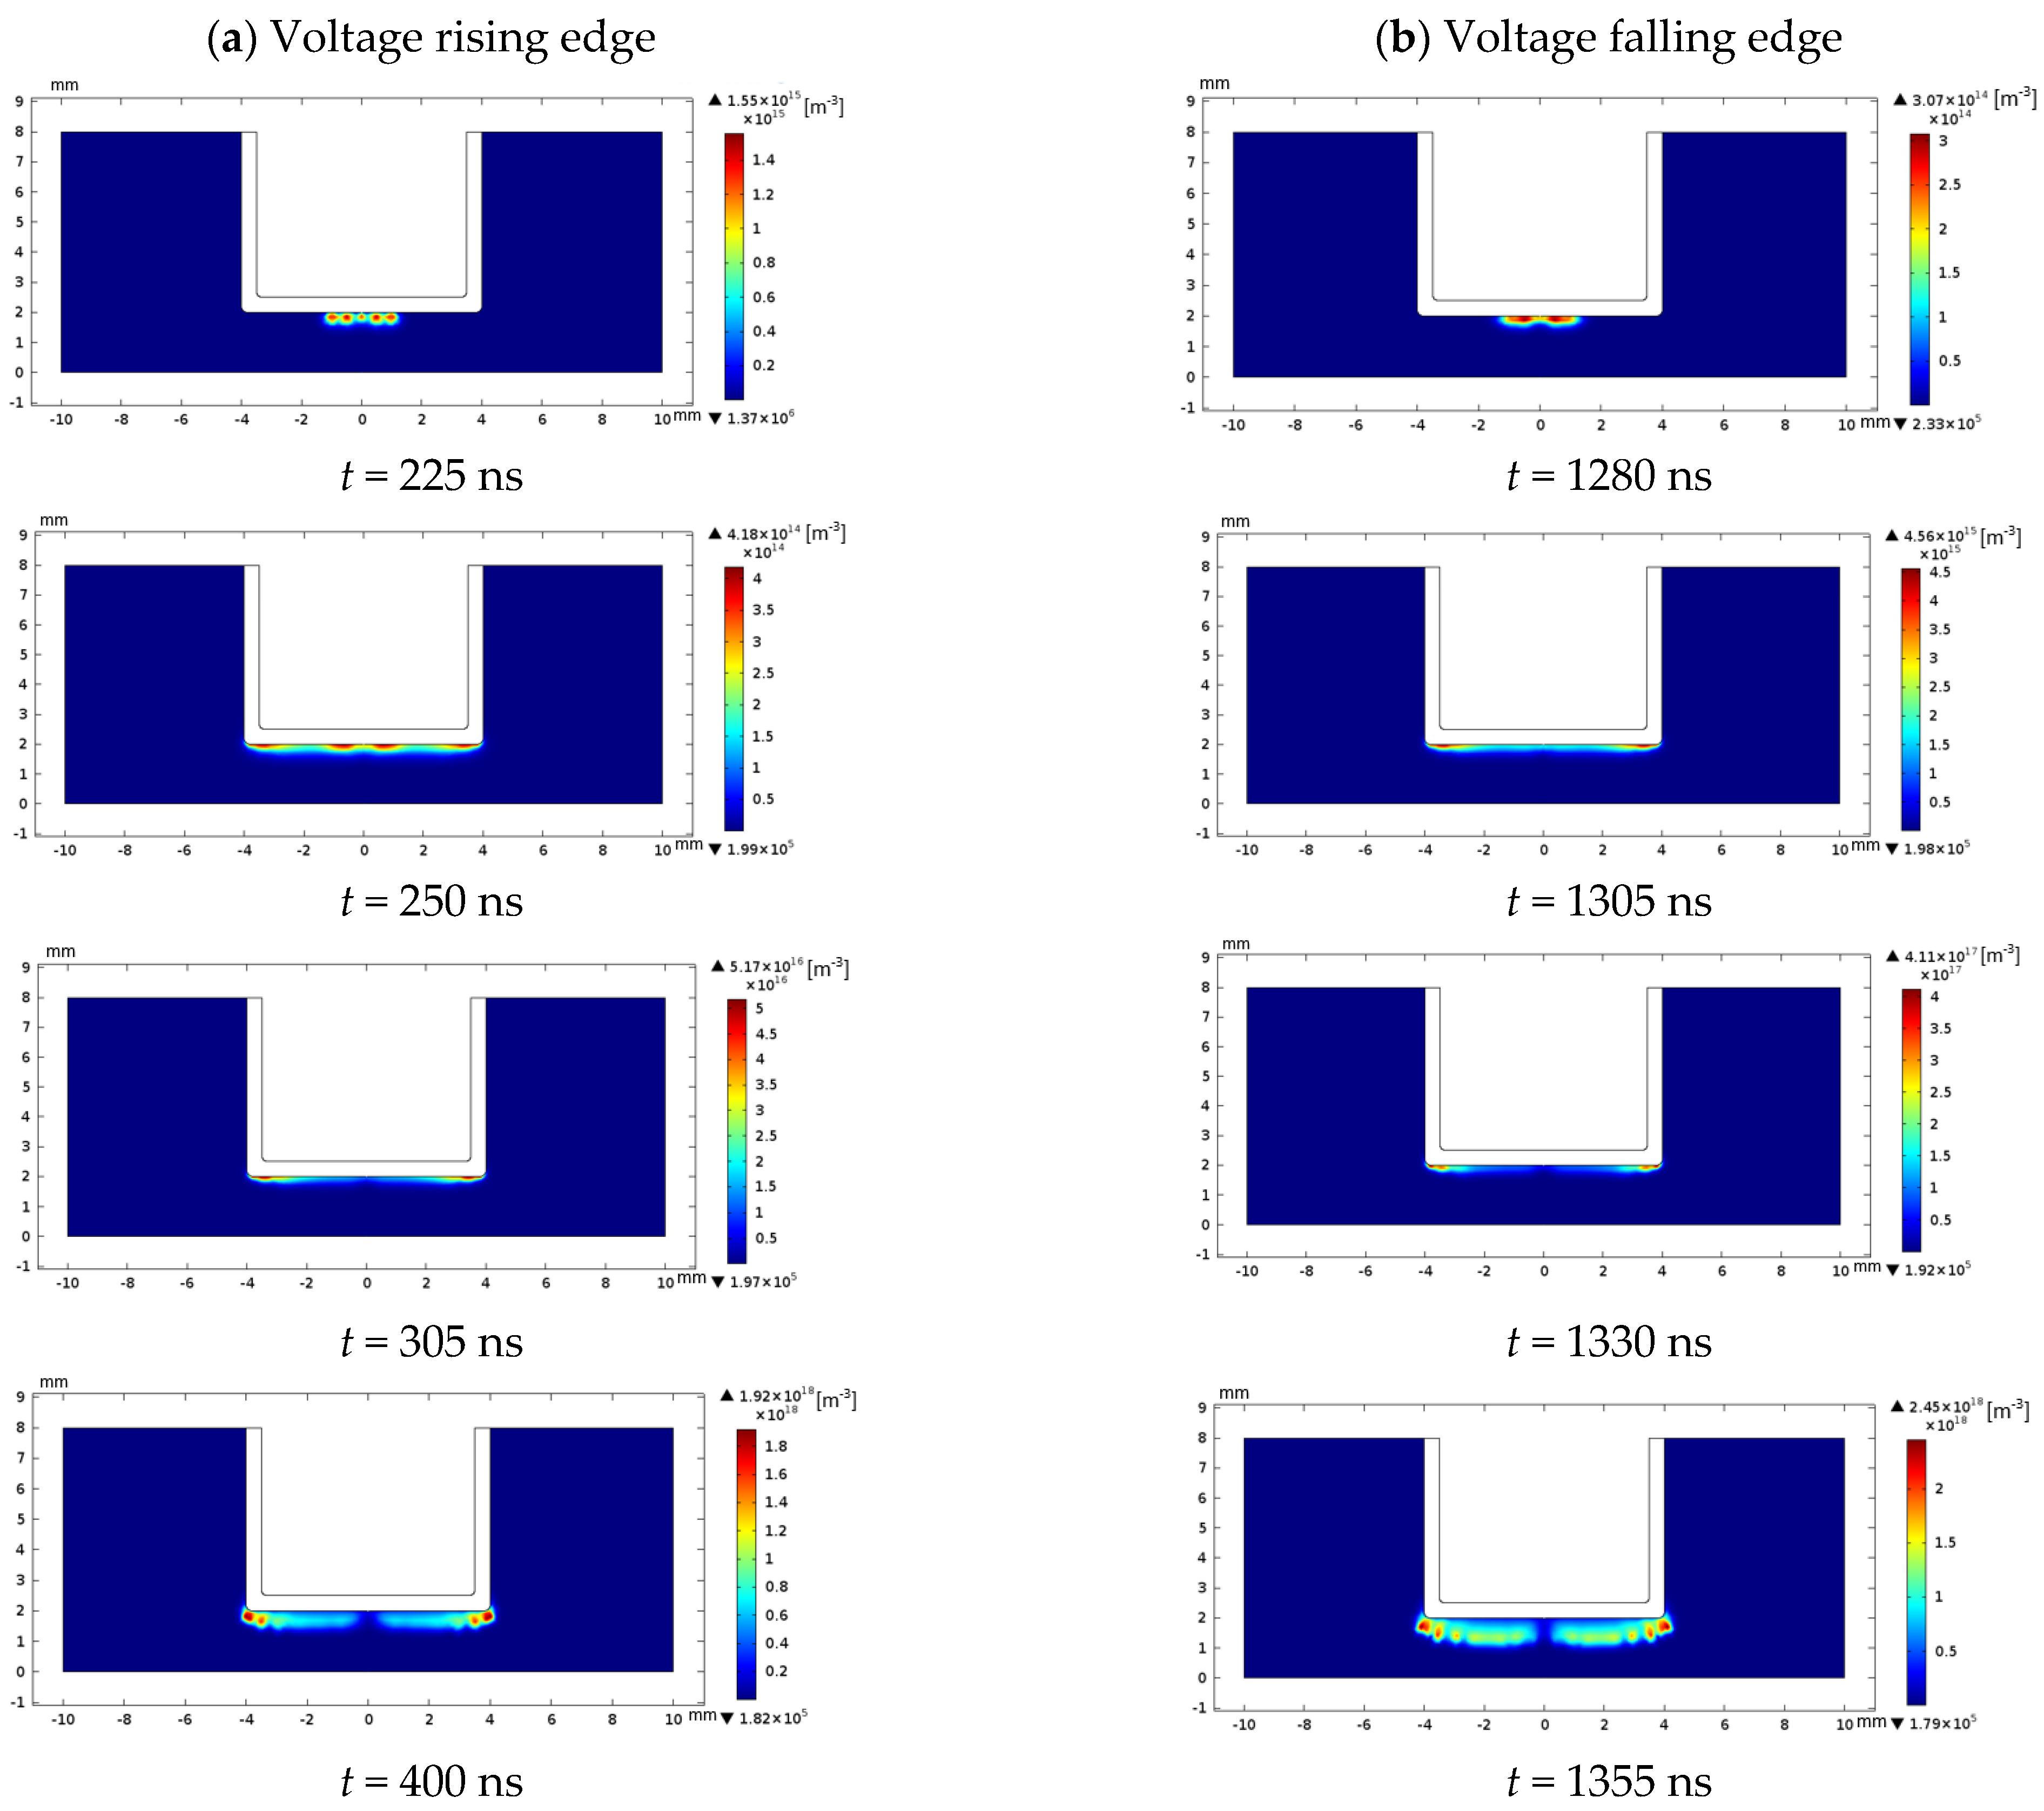
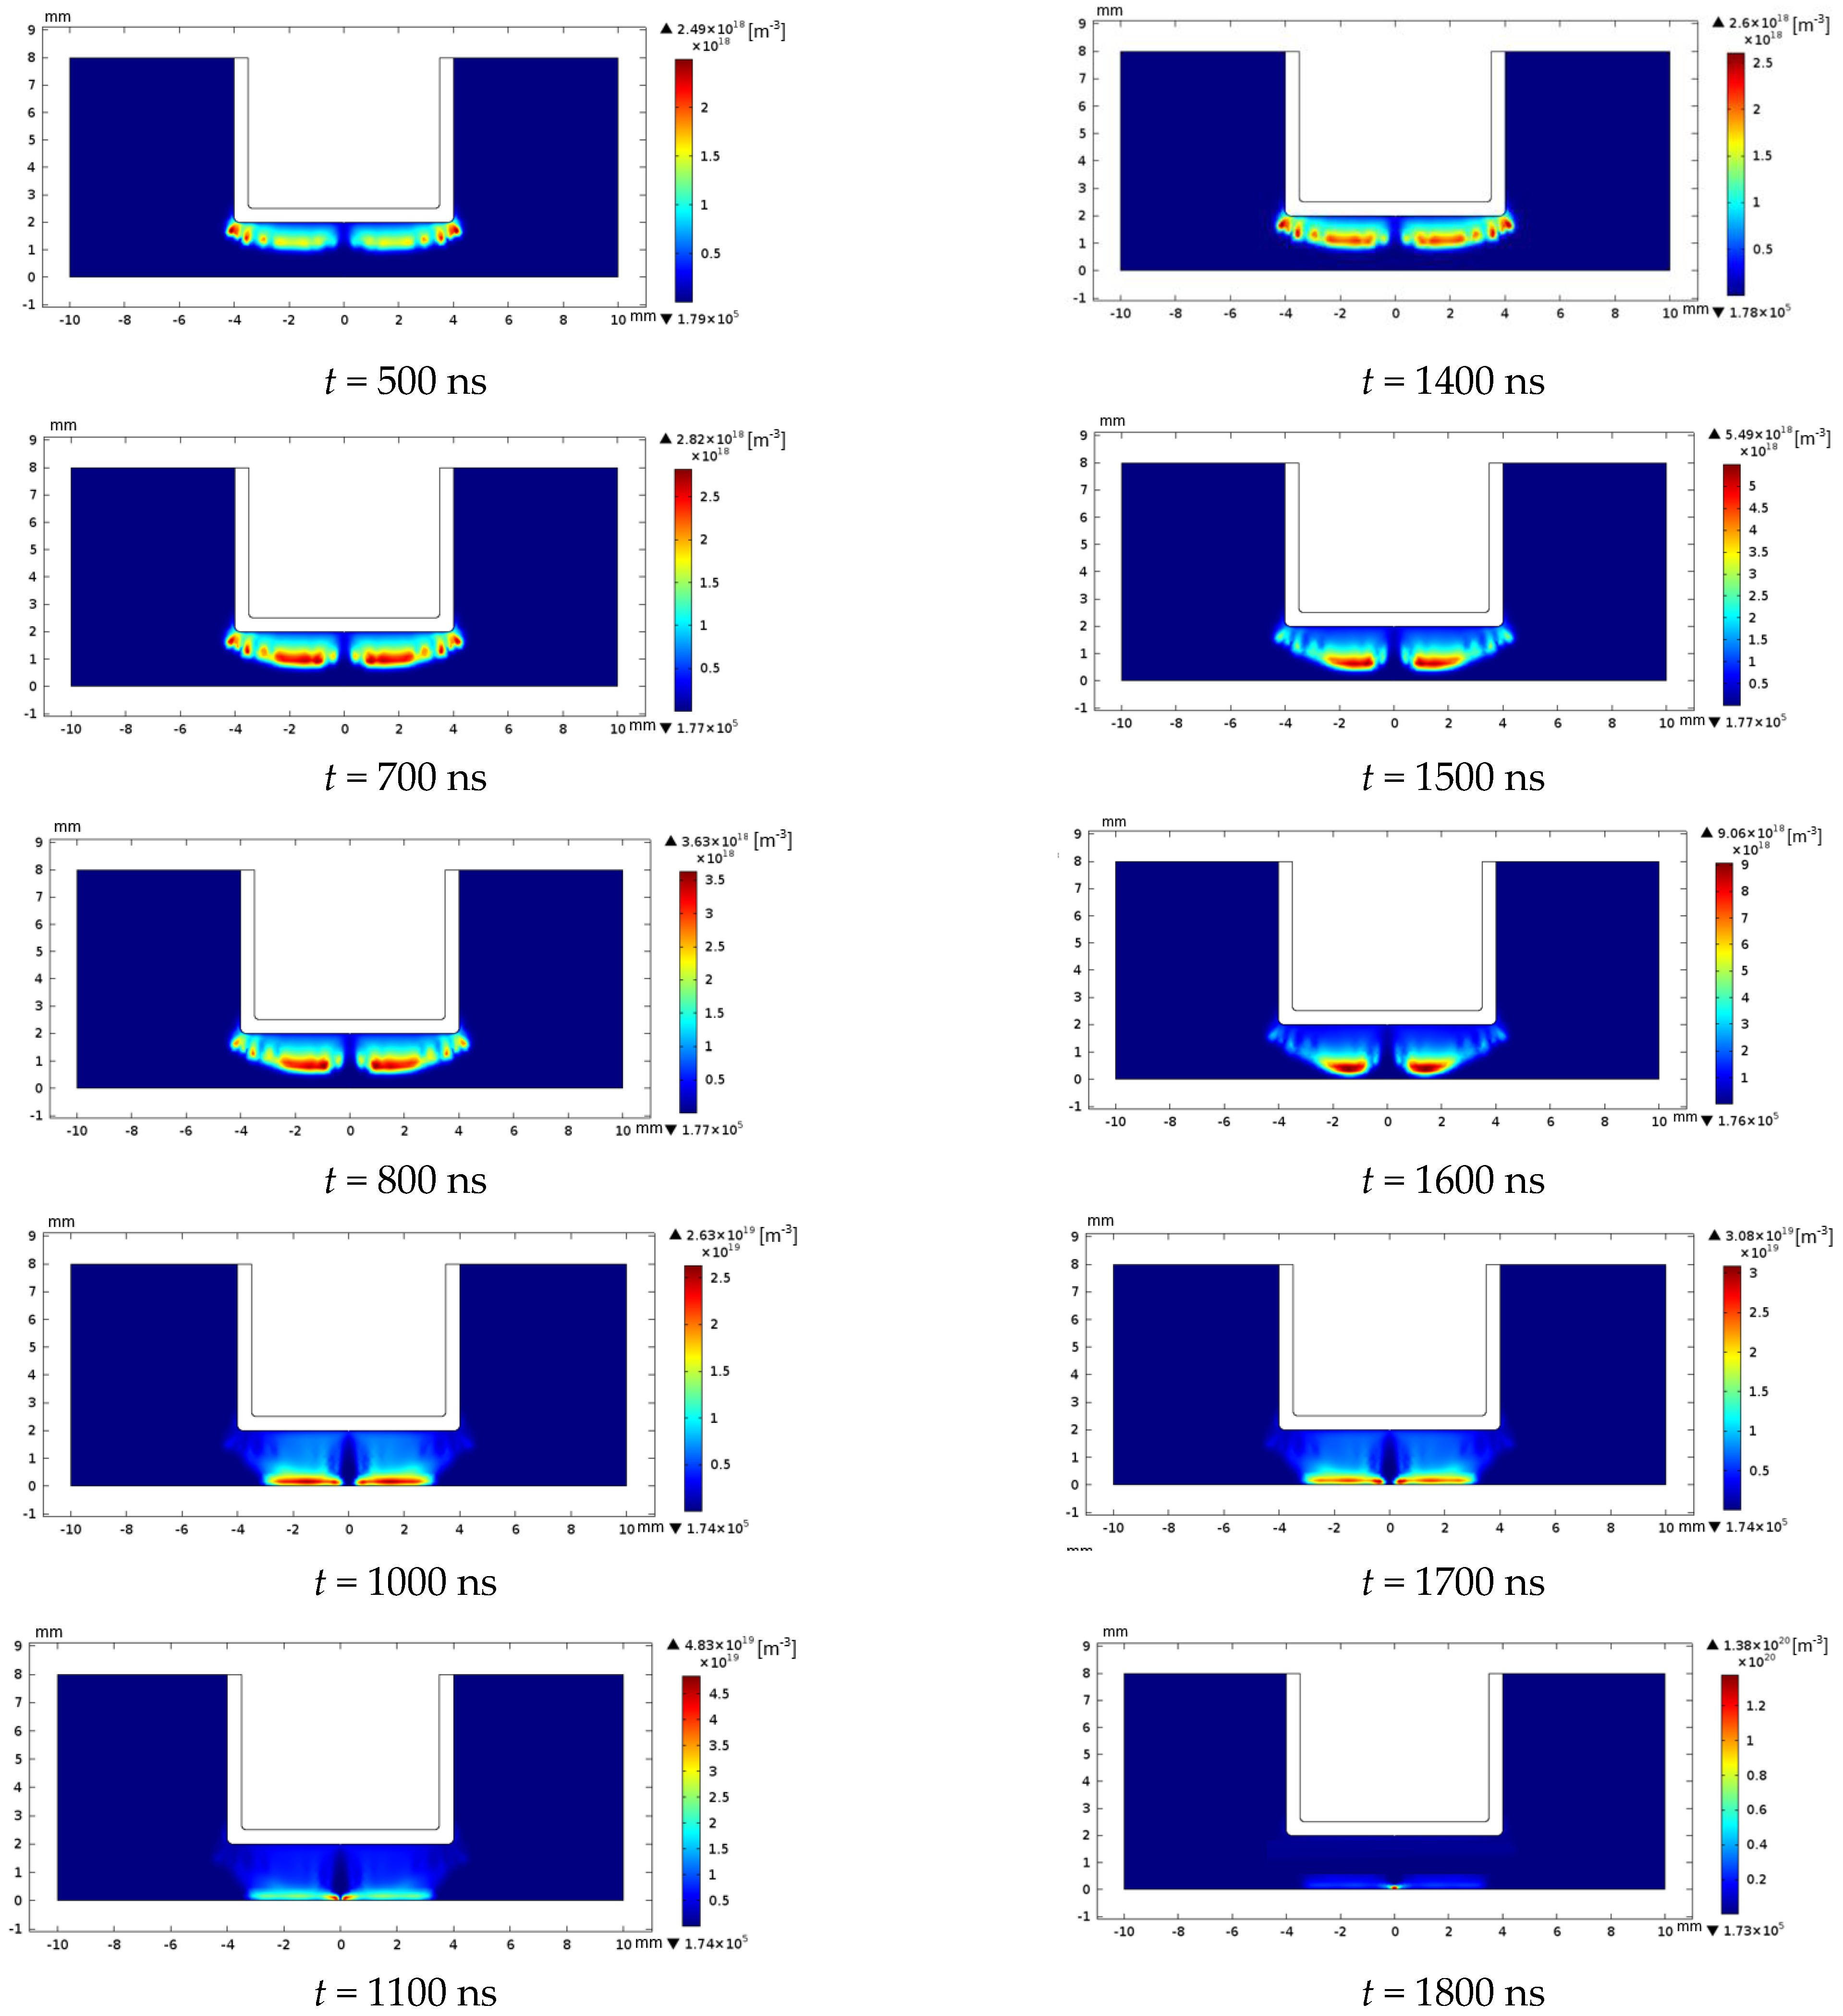
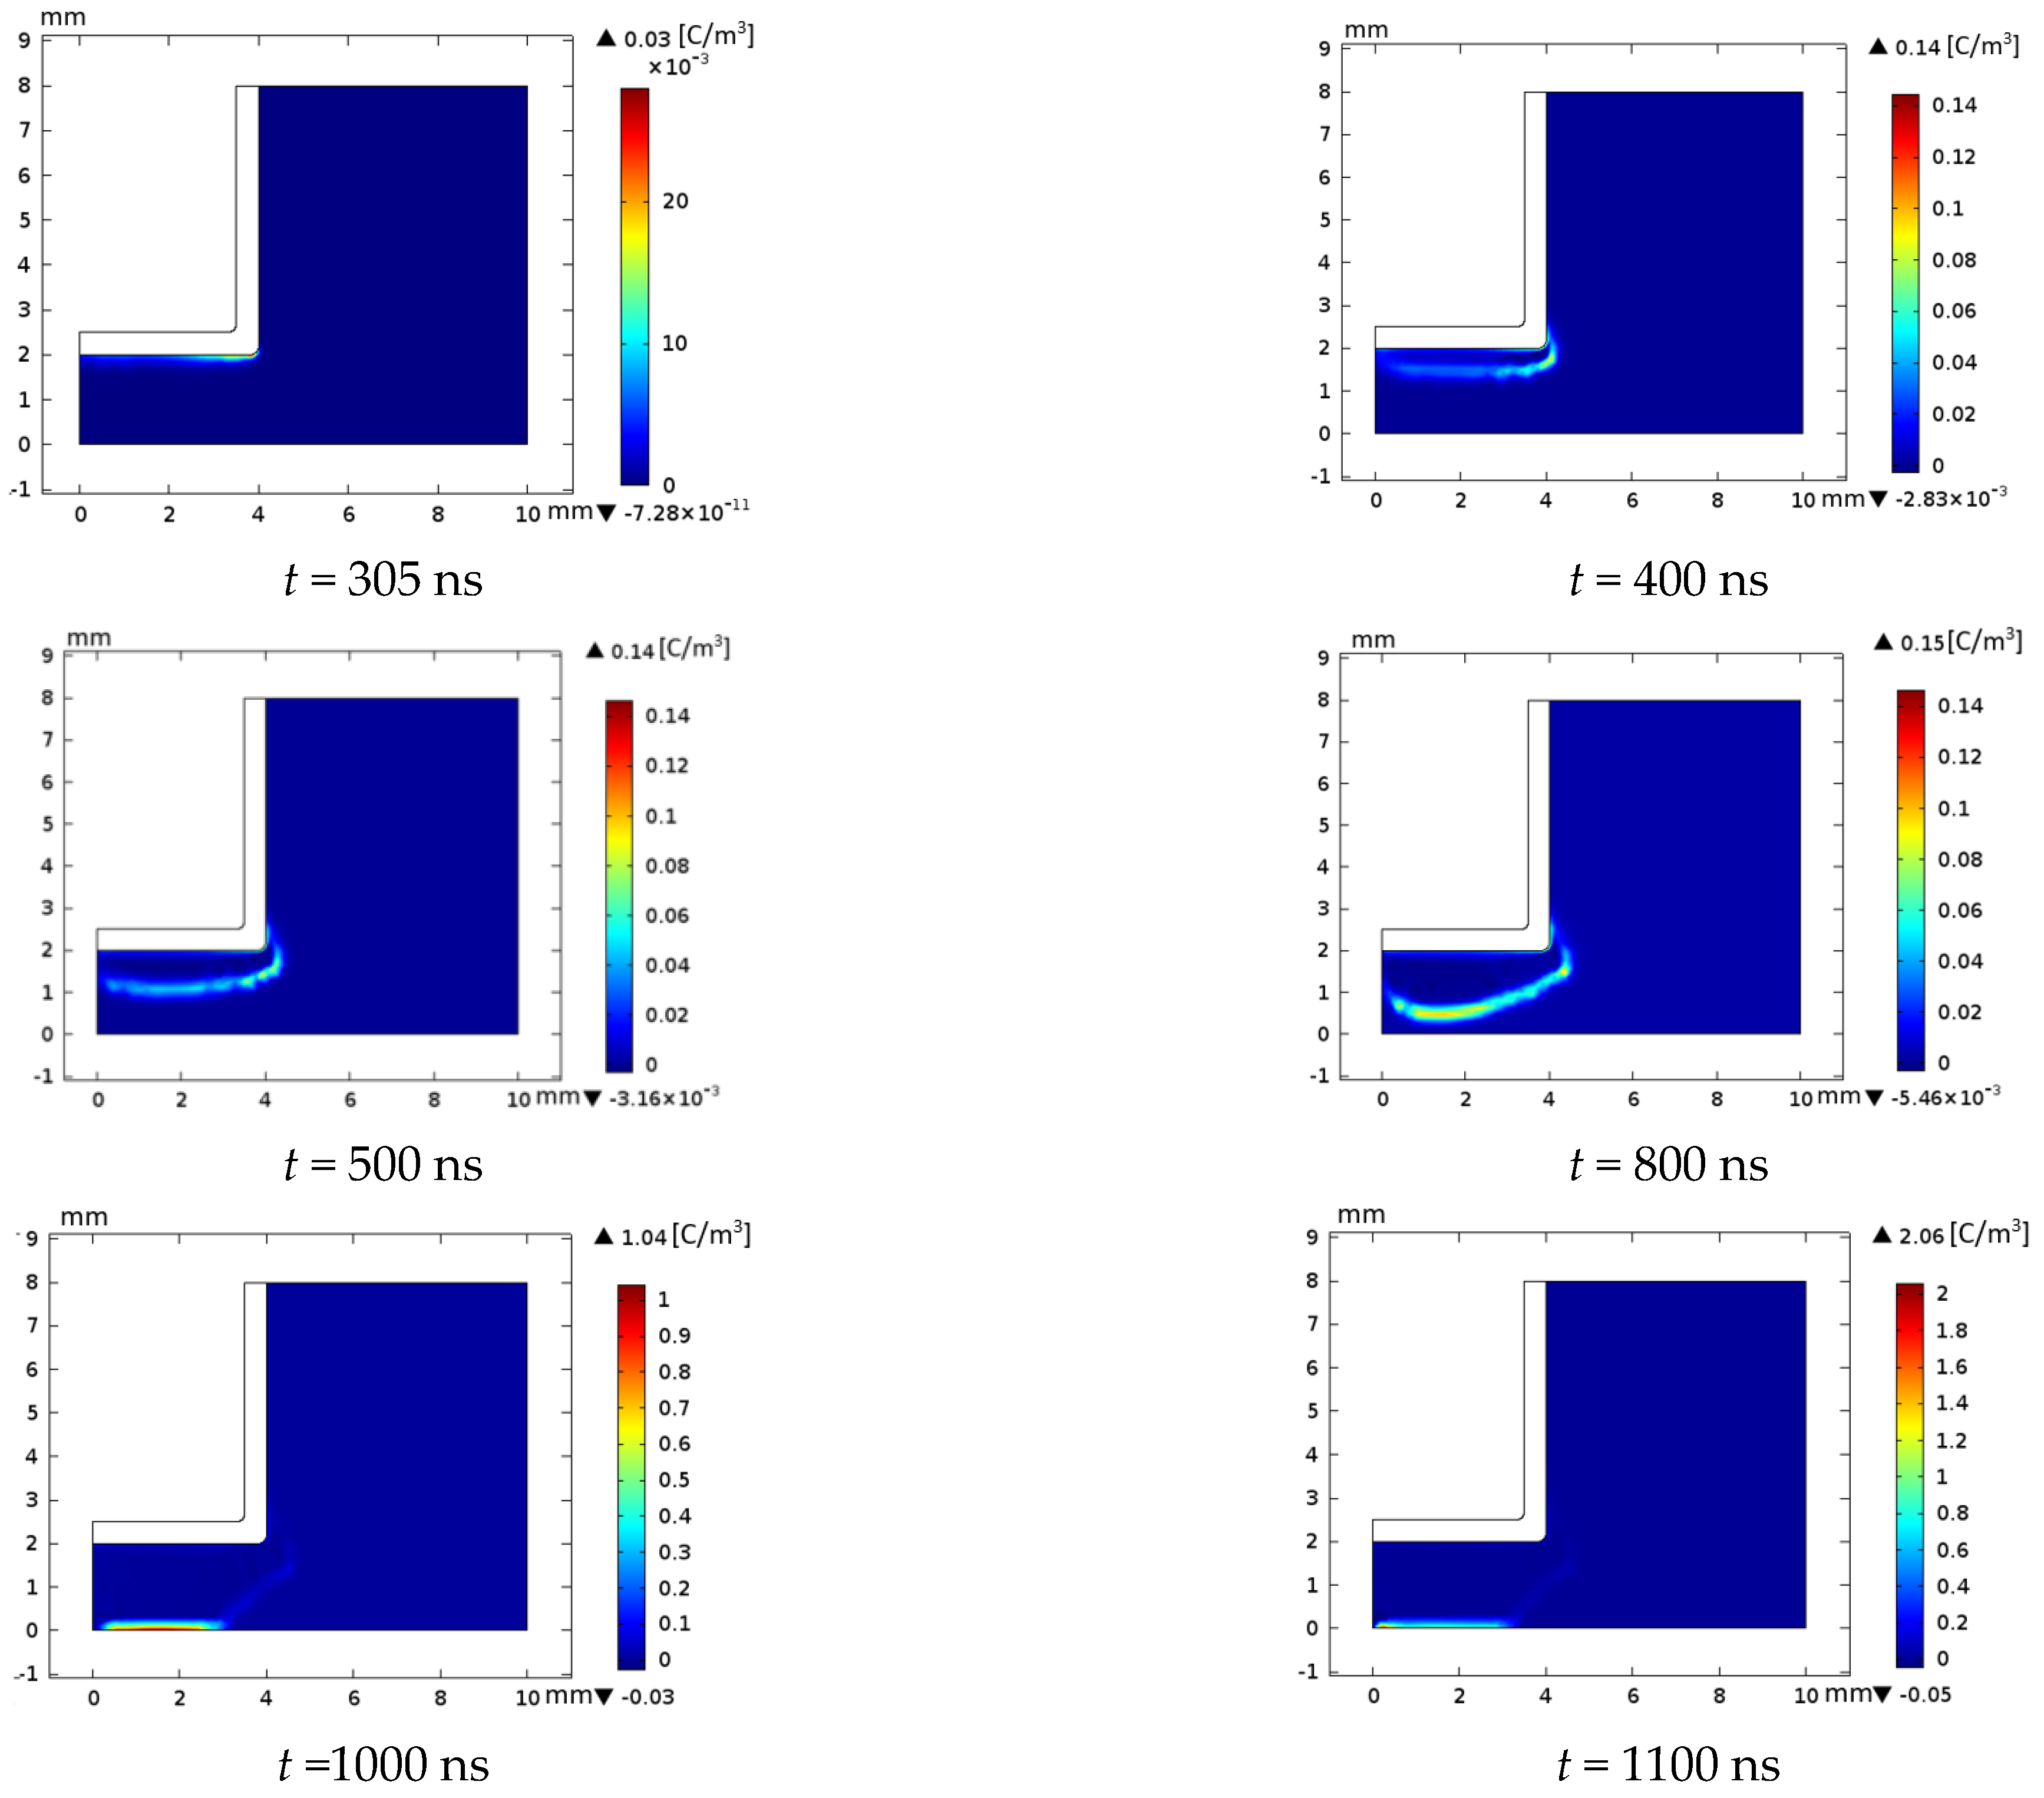
4.2. Dynamic of the Discharge Formation

The electron density is among the main parameters in plasma study because it controls the physics and chemistry processes of the discharge. Figure 4 shows the distribution of electron density for different instants of pulse discharge during the rising and falling edges of the pulsed applied voltage.
At first, the initial electron density follows the Gaussian distribution model (t = 225 ns), then it is reproduced by ionization effect and therefore accumulates throughout the dielectric anode surface (t = 250 ns). This inhomogeneous charging causes a radial field to reach a peak value. Simultaneously, the number of positive ions dominate in the gap and a secondary electron emission provided by the cathode increases the electron density again, and an exponential growth of the electrons and ions densities extends over several nanoseconds. The nonlinear ionization potential wave comprises a plasma channel growing from the dielectric to the cathode (t = 500 ns). When the plasma reaches the cathode (t = 1100 ns), the gradient of the electron density distribution reaches its highest value. A secondary discharge appears at the end of the voltage pulse (falling edge) due to the accumulation of charged species on the dielectric during the first discharge [38].
Figure 5 shows that the plasma is dominated by the nonlinear space-charge effect. This causes a plain region around the density peak of electrons followed by steeper axial gradients than the diffusion dominated undistorted Gauss distribution.
The space charge dominates over all the gap area, leading to a development of a fast cathode directed discharge characterized by a large electron density and a high electric field in its front of ionization. The discharge is distinguished by a high and uniform electron concentration along the axis: the radius of the channel increases in the direction of the cathode and the cathode layer is restricted in the proximity of the cathode [39].

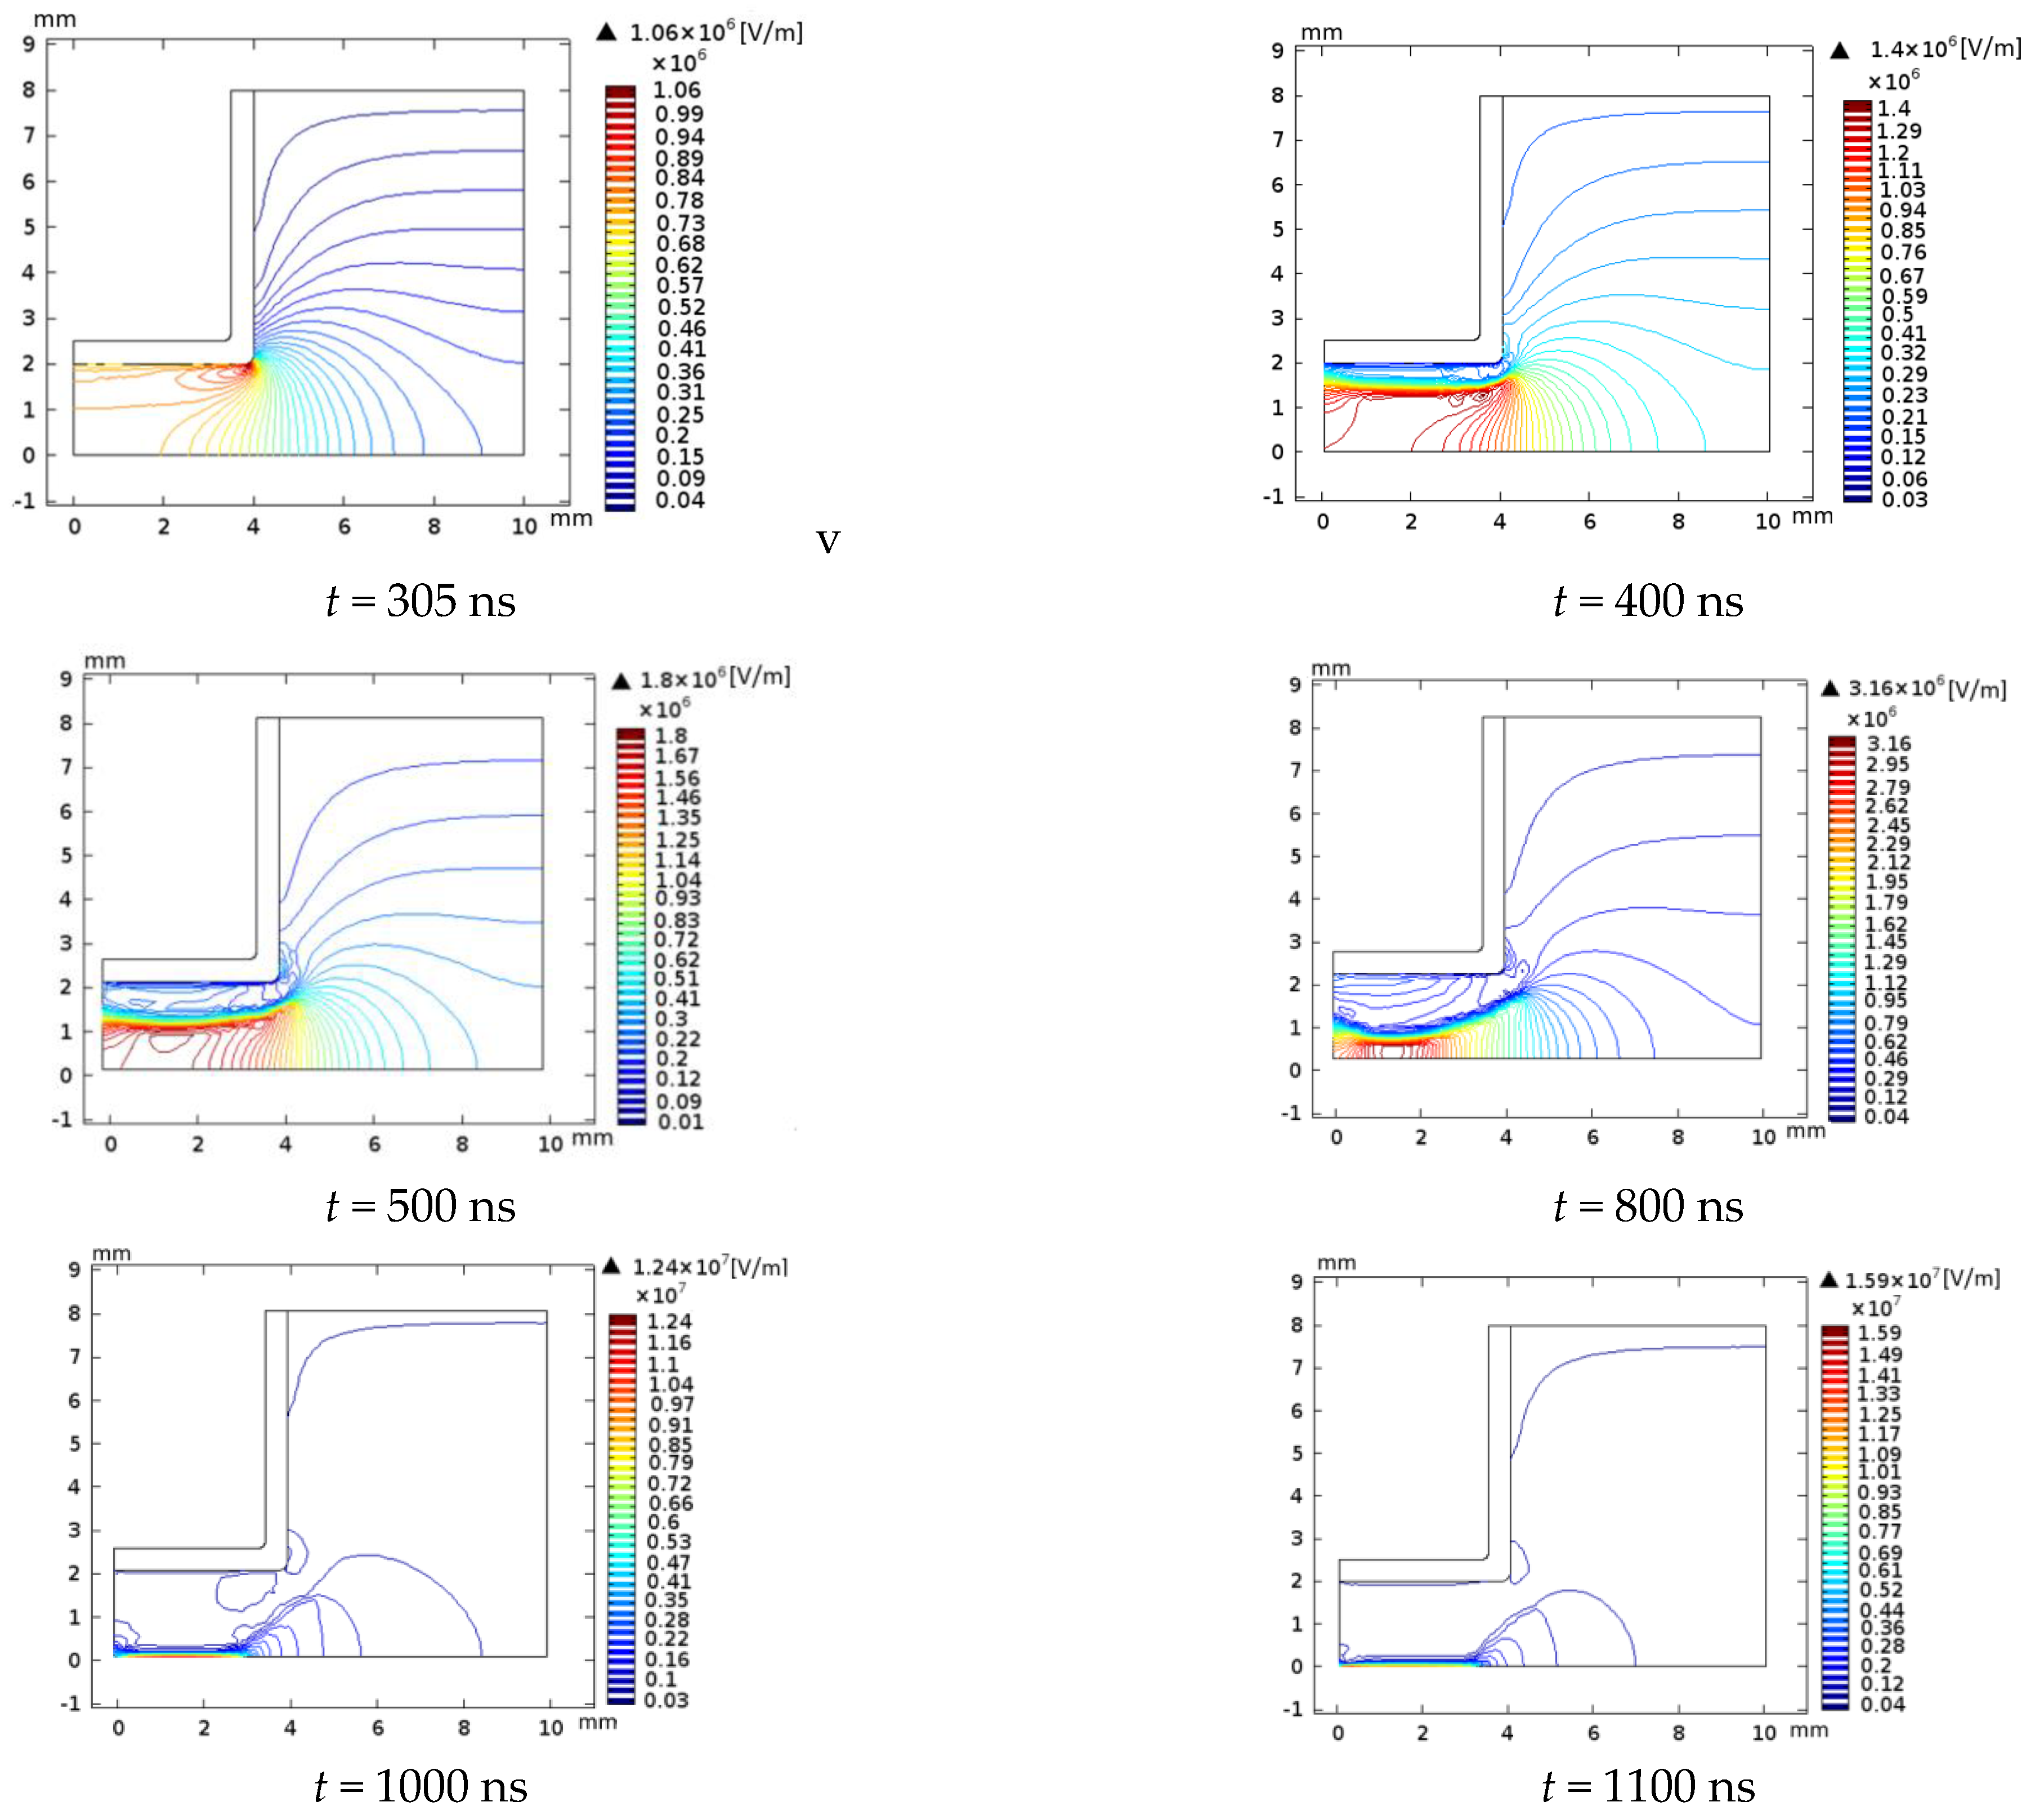
4.3. Electric Field Distribution

The contours of electric field for different instants of pulse discharge are shown in Figure 6. At the beginning, the distortion of the electrical field by space charges is negligible. At t = 400 ns, the field in front of the dielectric is reduced by absorbed electrons on the dielectric from the primary avalanche. A radial field reaching a peak value of approximately 1 kV/mm is created due to the non-uniform charging area.
The heavy and slow positive ions remaining in the gap leads to an intensified field enhancement with a peak value of 1.8 kV/mm at z = 1 mm (t = 500 ns). Because of multiplication of the delayed electrons from secondary processes, the field enhancement due to positive ions increases until the ionization rate overcompensates the electron loss due to drift and discharge is initiated. The nonlinear ionization potential wave forms a plasma channel, which grows from the dielectric to the cathode. The dynamic of the discharge is determined by the current continuity, the displacement current outside the plasma is transformed into the convection current inside [40,41]. The value of the electric field in the bulk is approximately 3–4 kV/mm (t = 800 ns).
When the discharge reaches the cathode, a glow discharge with a voltage drop (cathode fall) is established with constant value of the electric field of approximately 16 kV/mm (t = 1100 ns) in front of the cathode. The field enhancement shows a slow radial expansion.

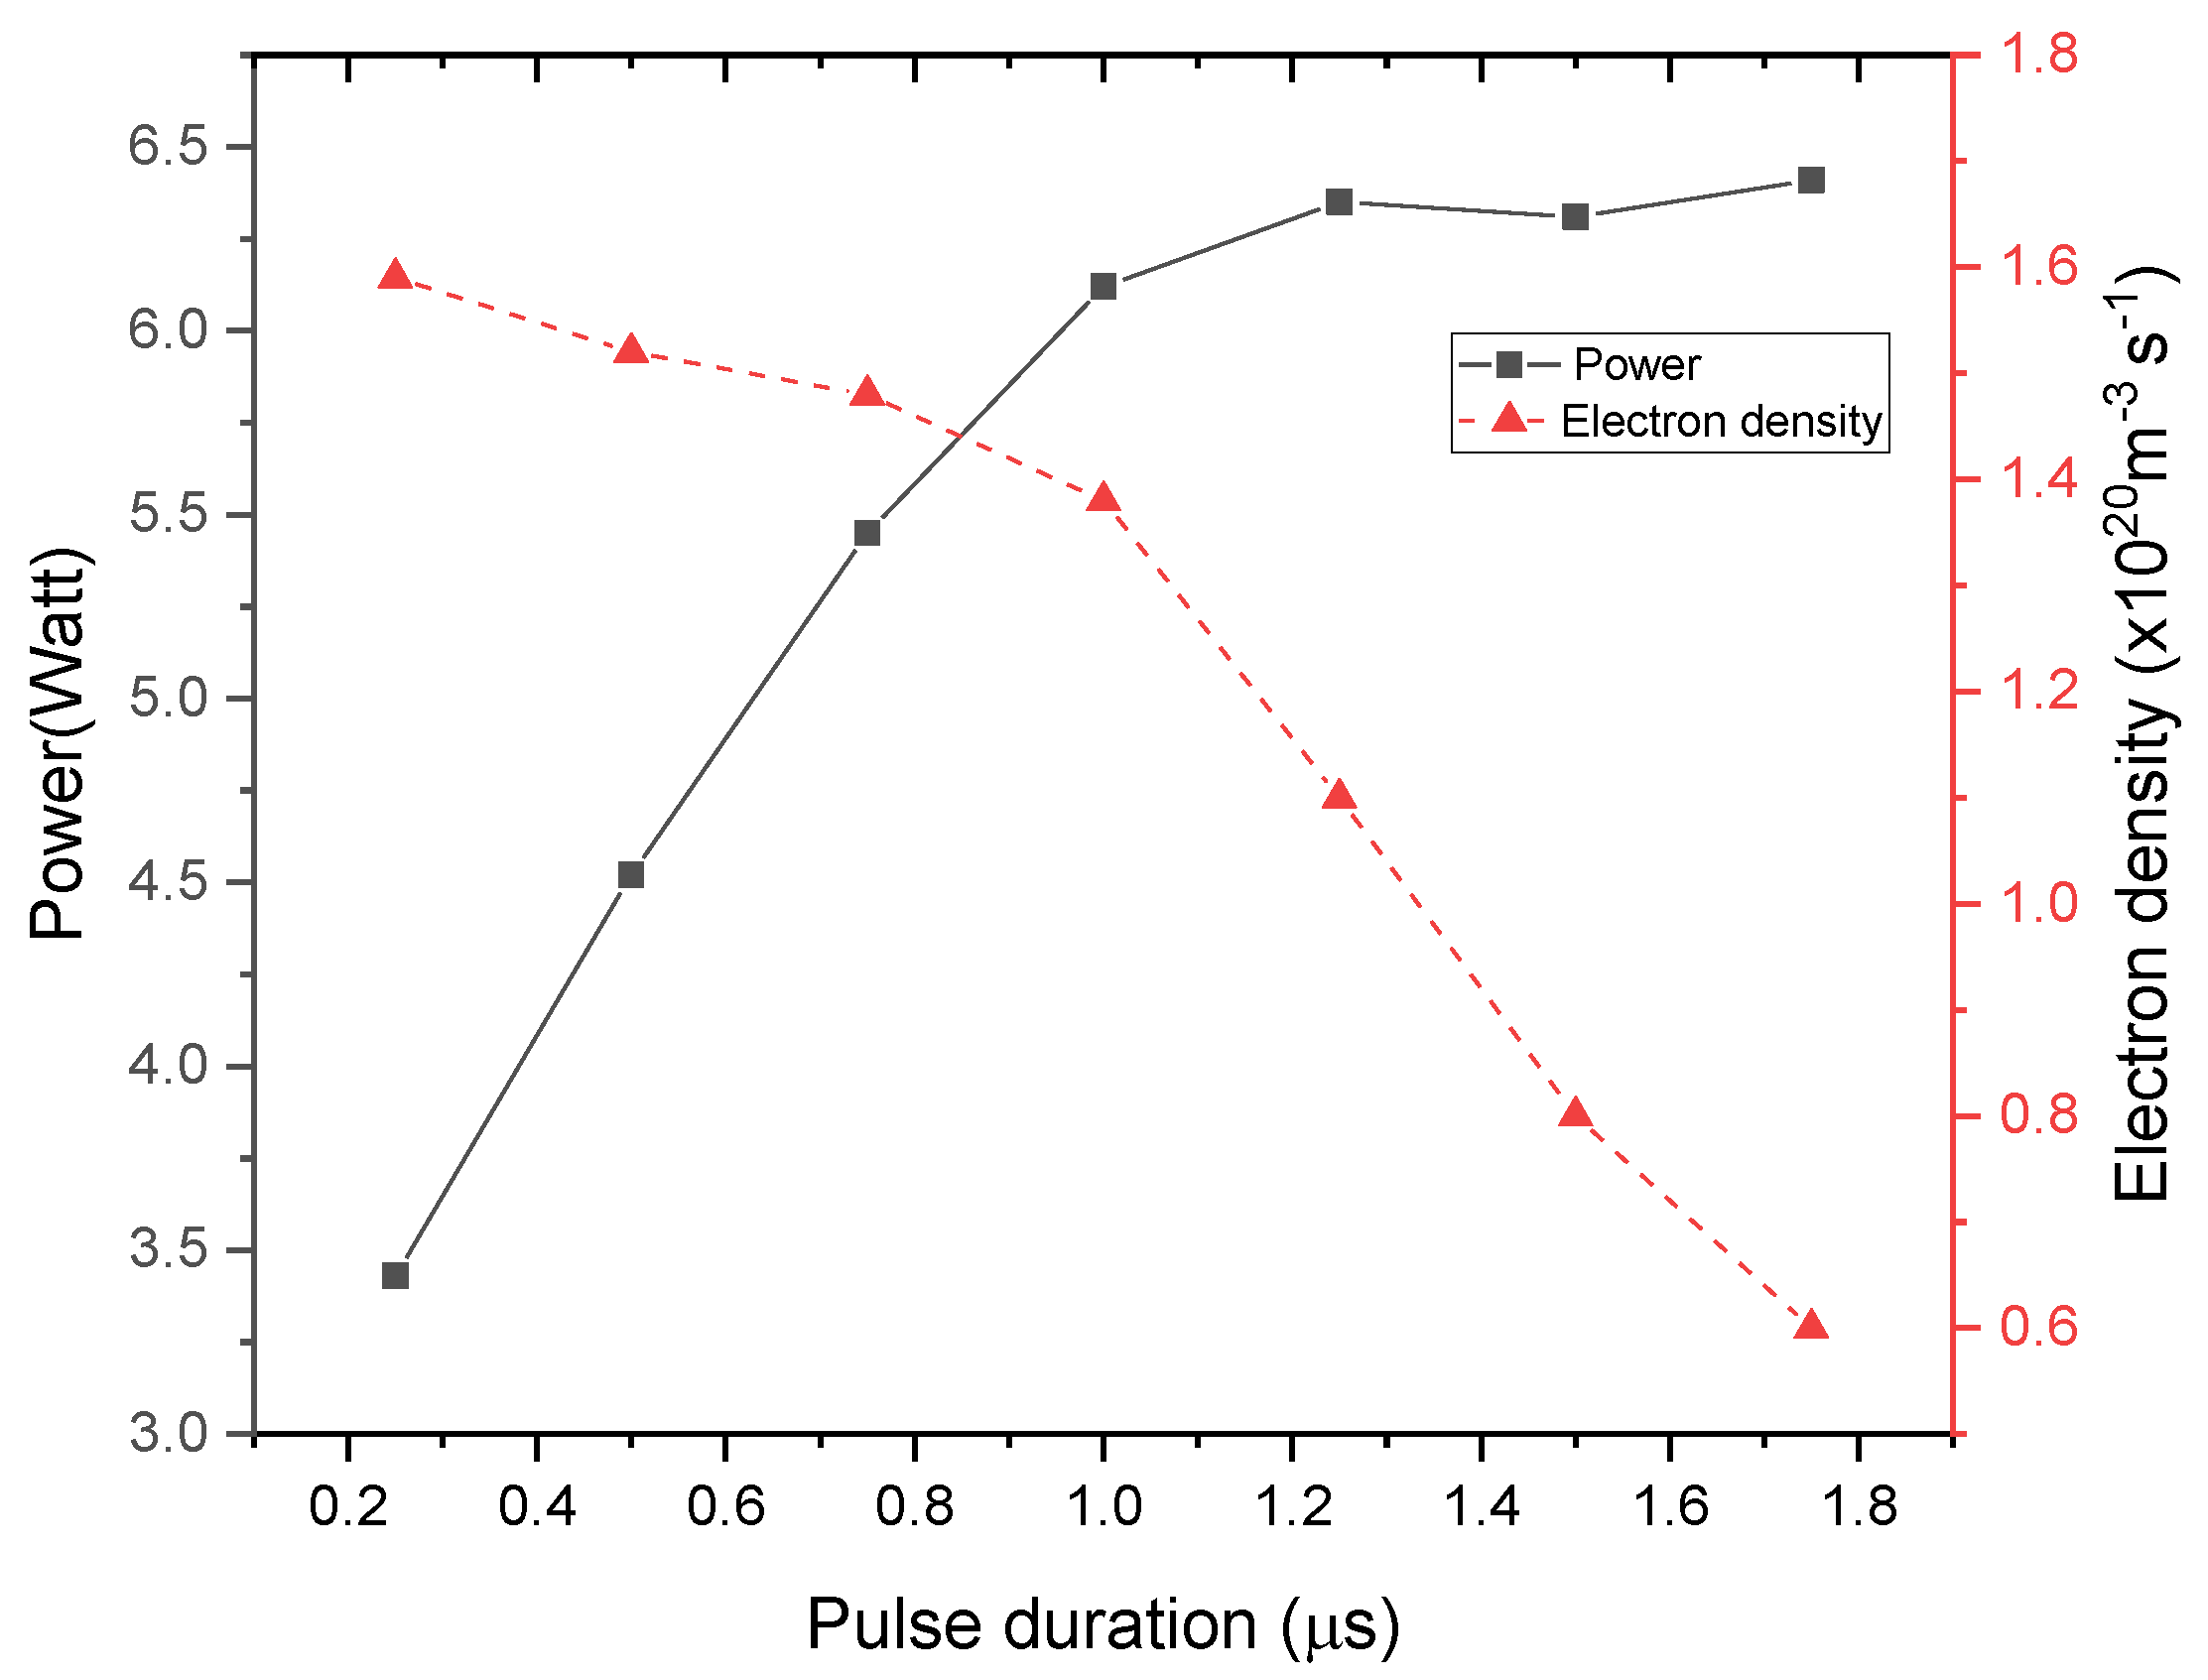
4.4. Effects of Model Parameters

The average electric power consumed during discharge to generate plasma is a characteristic quantity generally used to characterize the plasma device. Its value is obtained by averaging over a period T of the product of instantaneous current and voltage [42]:
P a v g = 1 T 0 T i ( t ) × u ( t )   d t
The averaged electron density Ne and the averaged dissipated power density P a v g are investigated under different operating conditions to have a better understanding of the mechanism involved and to improve the efficiency of the plasma system.
The evolution of the average electric power and the electron density close to the cathode with different pulse durations is presented in Figure 7. This figure shows that this power is very dependent on the duration of the pulse when the latter is less than 1 µs. If the pulse duration is too short, the discharge occurring on the falling edge (approximately 80 ns) of the pulsed voltage interferes with the discharge initiated during the preceding rising edge, which increases the volume recombination in the interelectrode gap while reducing the intensity of the conduction current as well as the power consumed.
The behavior of the average electric power consumed and the electron density close to the cathode as a function of the amplitude of the voltage pulse is presented in Figure 8. The average power increases gradually from 0.8 to 7 W, with the applied voltage with the applied frequency fixed at 10 kHz. As shown in the figure, the electron density increases fairly with increasing voltage. The increase in the electron density with the applied voltage is due to the injection of more energy into the discharge channel at higher applied voltage. The electron density ranges from 5 × 10¹⁹ m−3 to 1.5 × 10²⁰ m−3. This result is in accordance with the previous study [43].
As shown in Figure 9, with the increase in the secondary electron emission coefficient (γ), the electron number density increases, and the power consumed decreases, which means that for large γ more electrons are generated in the gap during the discharge and flows into the cathode sheath, resulting in the increase in electron number density Ne.
Hence, the secondary electron emission coefficient has a clear effect on improving the electrical characteristics of the pulse discharge to reduce power consumed and on a higher peak value of Ne. These results are in accordance with the previous studies, presenting a development of the argon discharges driven by a supplying high-voltage nanosecond pulse [44].
To investigate the dependence of the electrical characteristics of pulse discharges on different gap widths (dg), the powered electrode covered by 0.5 mm quartz dielectric thickness is considered, and the dg from 1 to 3 mm is used. Figure 10 shows the evolution of electron number density Ne and the consumed power as functions of dg. Indeed, with increasing dg, the quasi-neutral plasma area increases, and a peak value of Ne is obtained. In addition, for large dg, the consumed pressure decreases. The value of Ne reaches its maximum at approximately dg of 3 mm, and P keeps decreasing with increasing dg.
Figure 11 shows the electron density and the consumed power versus the dielectric constant εr for discharge to explore its influence on pulse discharges and electron number.
Fixing the gap width at 2 mm and changing the dielectric constant of the dielectric covering the powered electrode from 4 to 8 with a thickness of 0.5 mm show that increasing the capacitance of dielectrics leads to an obvious rise of the electron density created in the first discharge. Therefore, electrons flow increasingly toward the powered electrode and accumulate on the dielectrics.
As a result of simulation, a large dielectric constant requires more generation of charged particles in the gap, and the consumed power increases.
In addition, the effect of dielectric thickness on pulse discharges is analyzed, dg is fixed at 2 mm, and the powered electrode is covered by a quartz dielectric surface. The thickness ds of the dielectric varies from 0.05 to 0.2 cm.
According to Figure 12, when increasing ds, the variation of all characteristic quantities is the same as when decreasing εr, (Figure 11). This resemblance can be explained by the decrease in the capacitance of dielectrics for lower εr or higher ds, and the decrease in the charged-particle density generated in the gap during the discharges. Consequently, the net charged-particle density accumulated on dielectrics decreases, and then the consumed power decreases.

4.5. Discussion

In the current study the FE-DBD plasma is investigated as a cold atmospheric plasma source used for melanoma cancer cell treatment. The FE-DBD plasma treatment initiates a complex cascade of biochemical processes leading to cell death many hours and even days following the treatment. The increase in reactive oxygen species (ROS) and reactive nitrogen species (RNS) is the main trigger that initiates tumor cell death. The specific responses here are apoptosis, growth inhibition, cell cycle arrest, DNA and mitochondrial damage, and even immunogenic cell death [45].
Thus, the anticancer effect generated by the FE-DBD plasma is mediated by reactive species that are produced by the cold atmospheric plasma and can be improved with higher electron density and less consumed power [46].
First, the study results show that the pulse duration has a great impact on plasma during cancer treatment, and the optimal pulse width used for the power supply is approximately 1 µs. Second, a small interelectrode distance, a higher dielectric constant, and a small dielectric thickness are recommended to achieve a higher value of electron density responsible for generating reactive species that initiate the apoptosis of tumor cells. In addition, increasing the secondary electron emission coefficient enhances the electron number density and then anticancer effect with less consumed power.

5. Conclusions

In this paper, numerical investigation of low temperature FE-DBD plasma excited by voltage pulses used for melanoma cancer cell treatment was performed. The distribution of electron density in the FE-BDB discharge consists of a plasma channel growing from the dielectric to the floating electrode during the rising and falling edges of the pulsed applied voltage.
Moreover, the influence of operating conditions on the characteristics of the plasma discharge is discussed and analyzed to prevent unwanted arcing during plasma treatment, improve efficiency of FE-DBD plasma device, and stimulate the antiproliferative effect of plasma on melanoma cancer cells therapy. The results show that the following:
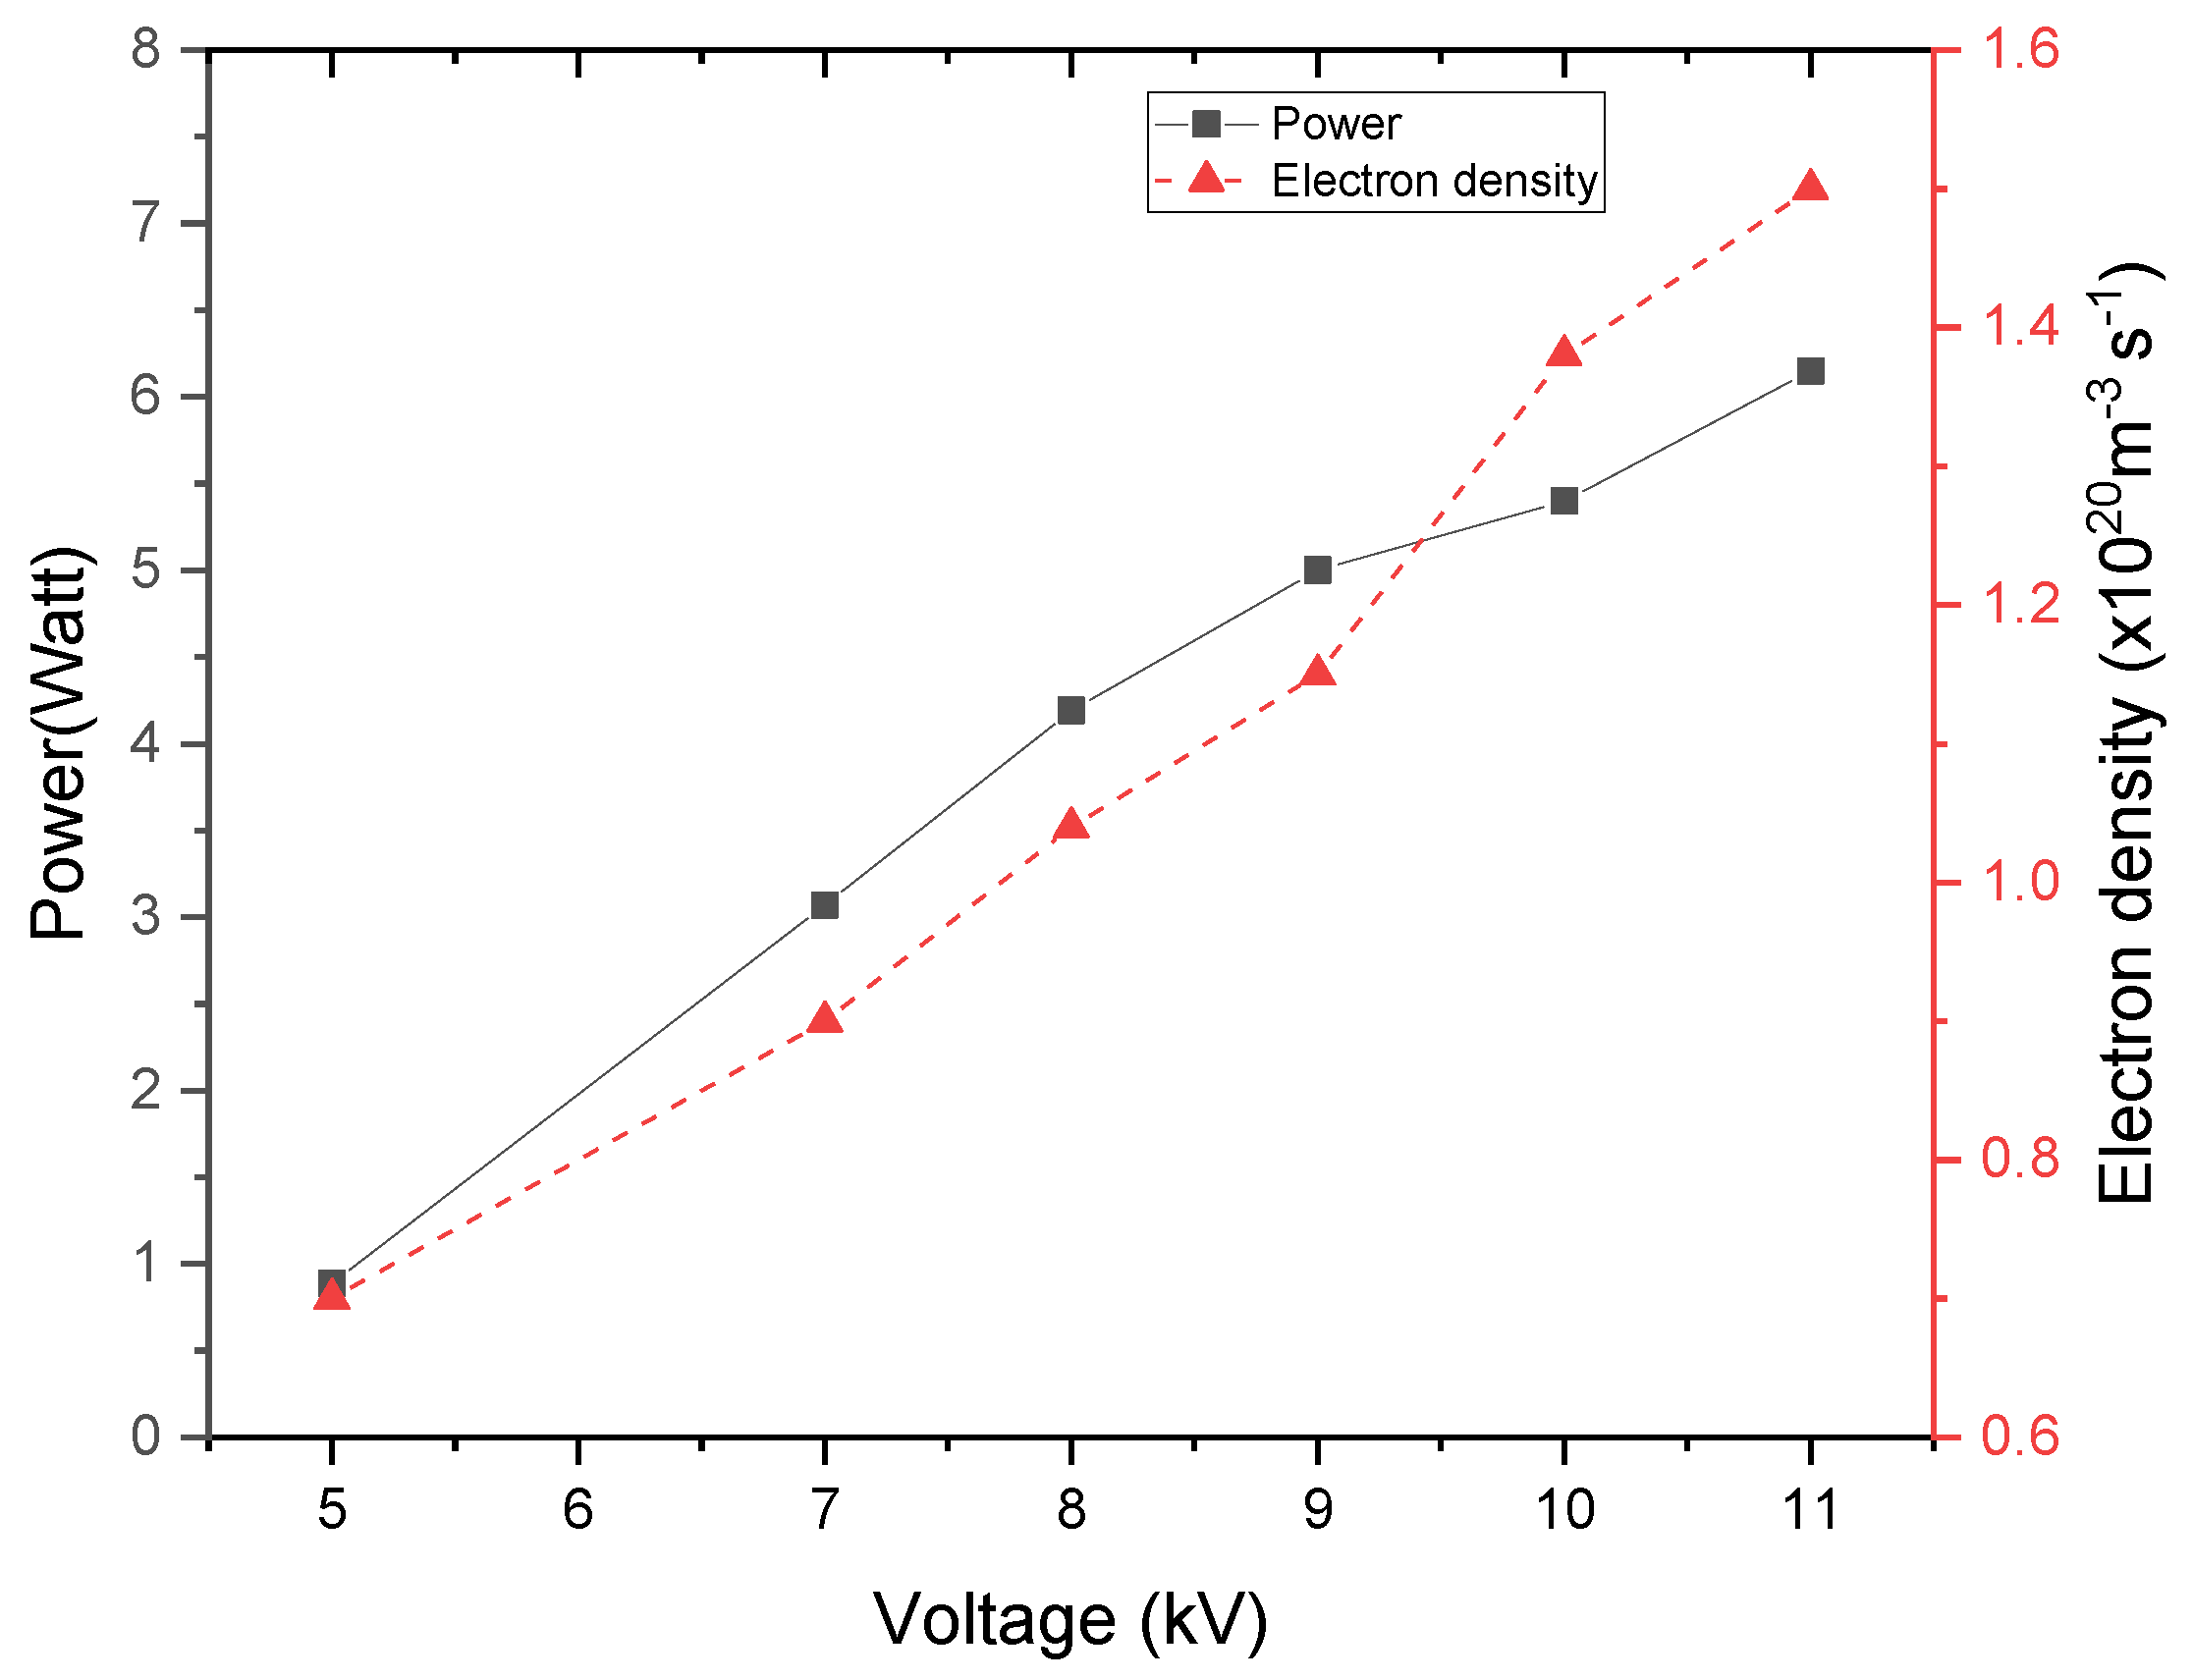
The electrical diagnostics revealed a higher consumed power with higher applied voltage.
The pulse width plays a crucial role in the development of the discharge due to the charge accumulation over the dielectric barrier covering the high voltage rod electrode.
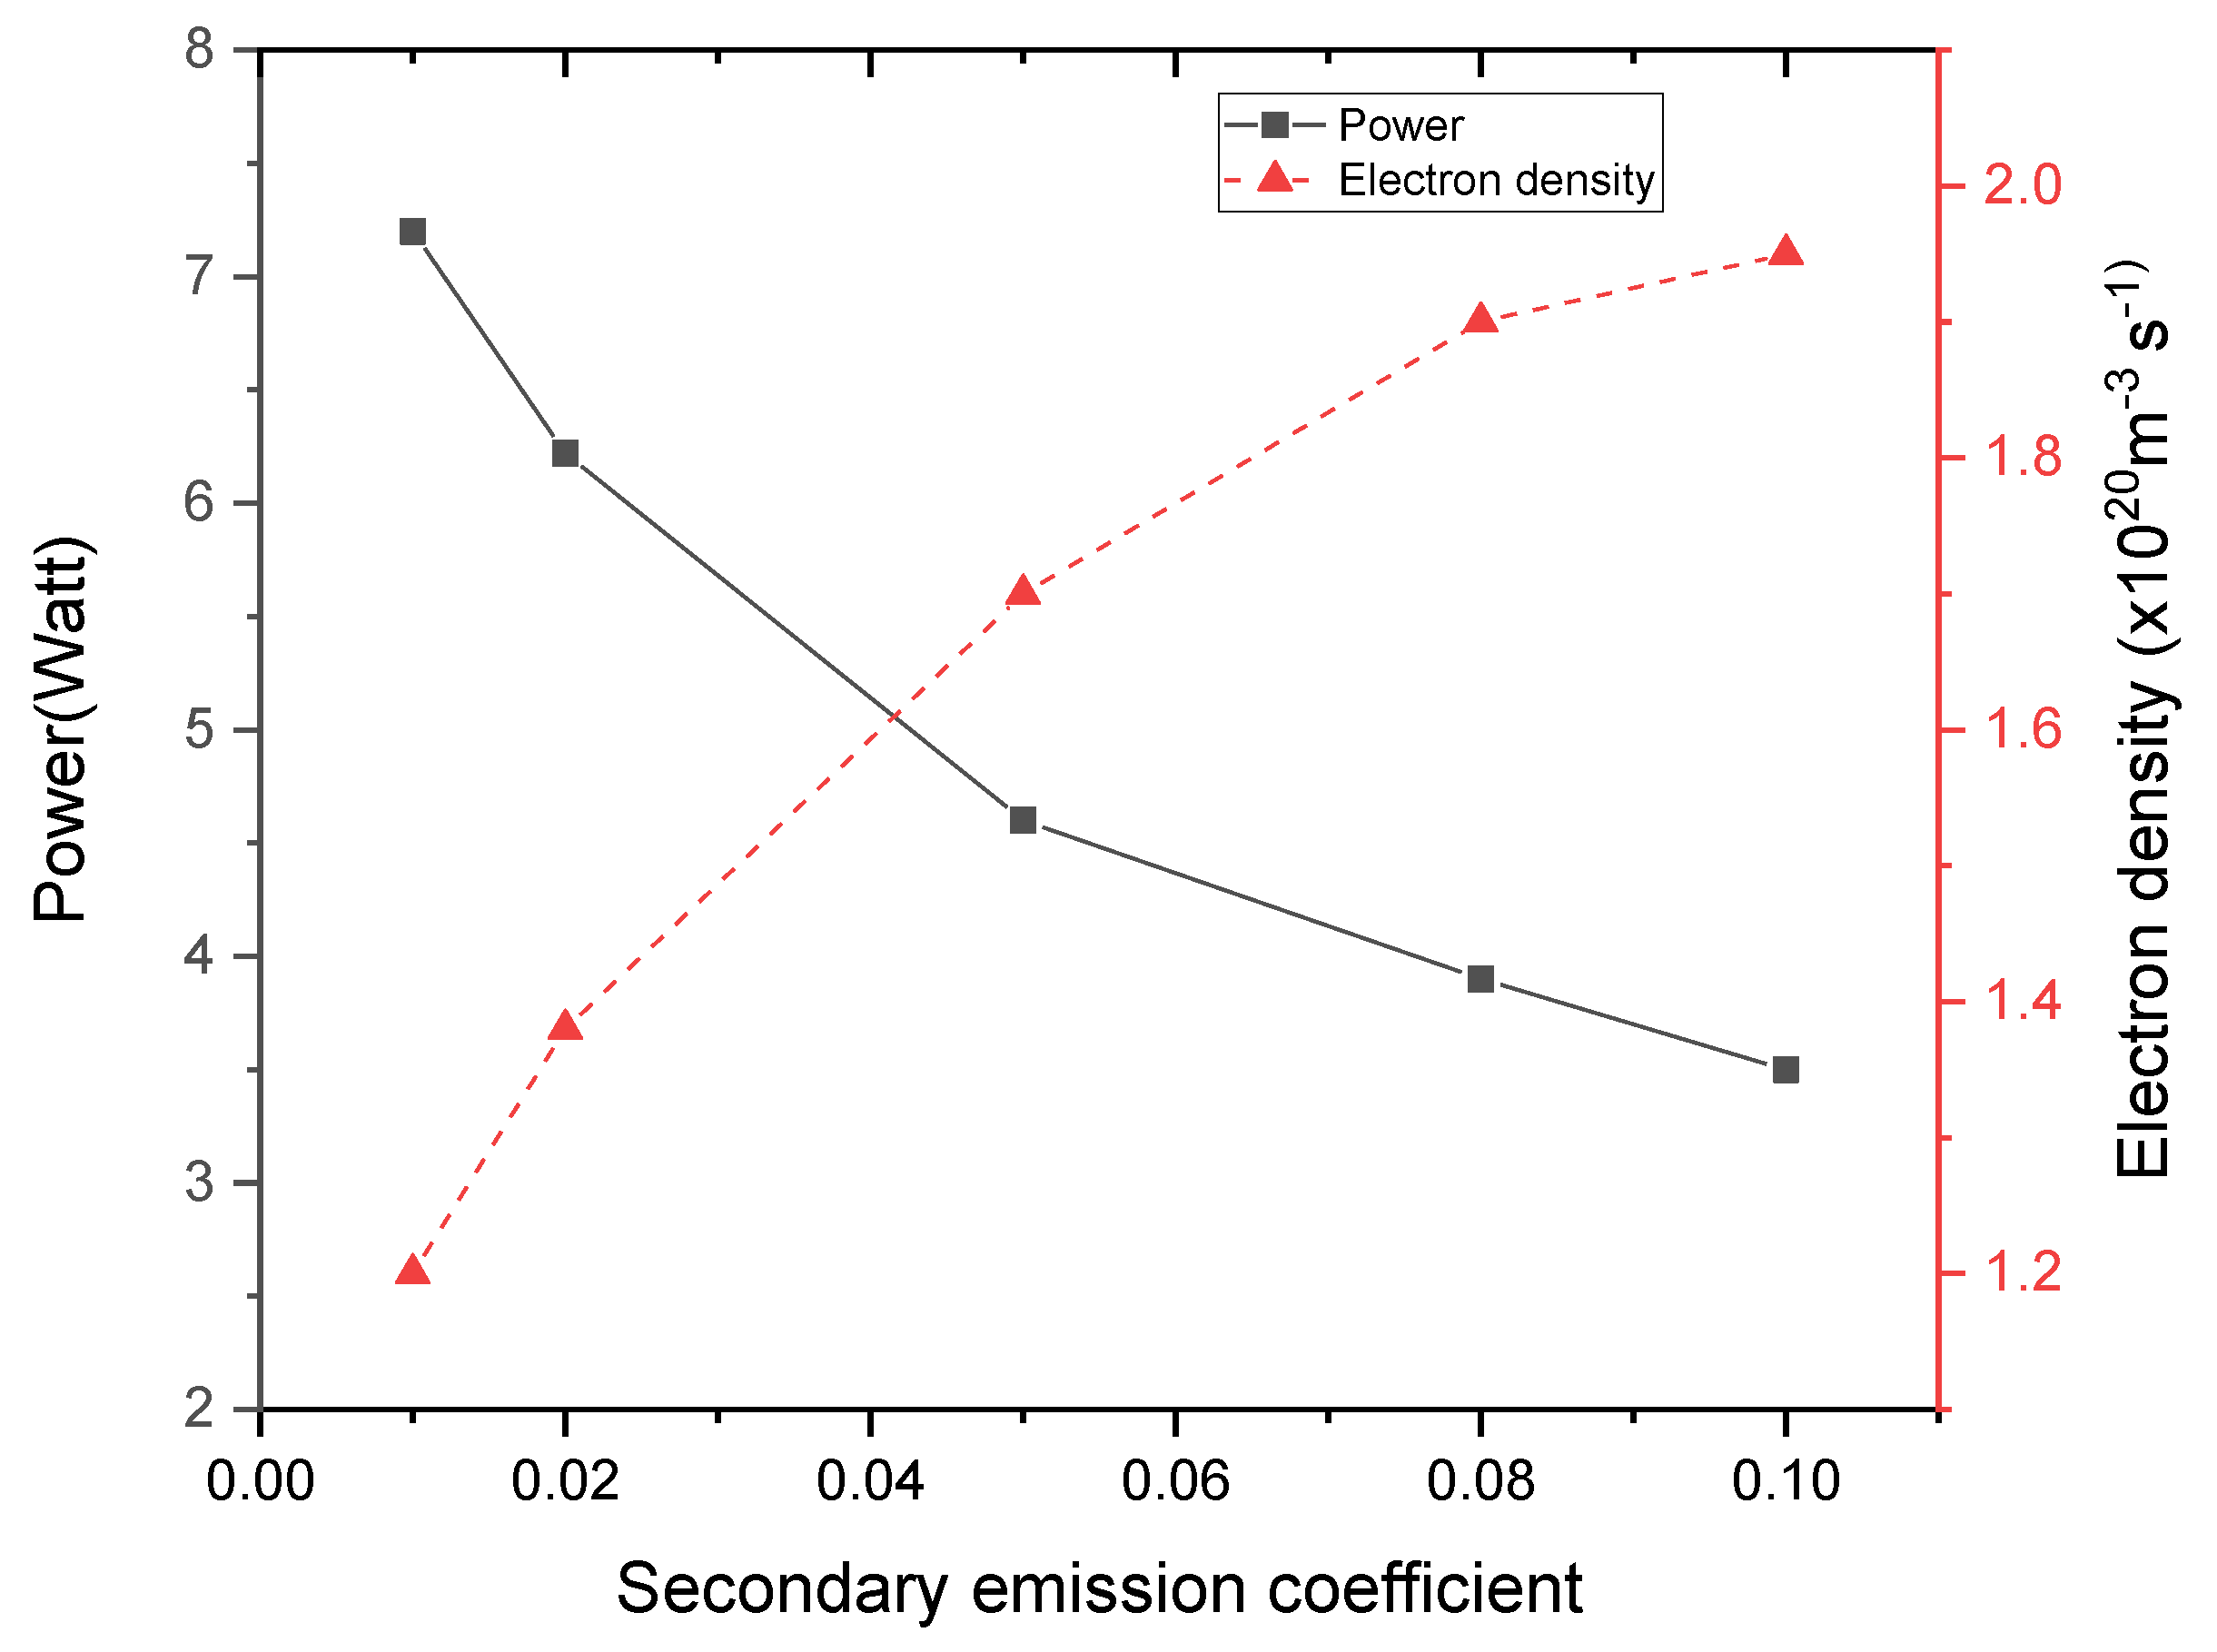
The large electron number density with small-consumed power is obtained through the increasing of the secondary electron emission coefficient.
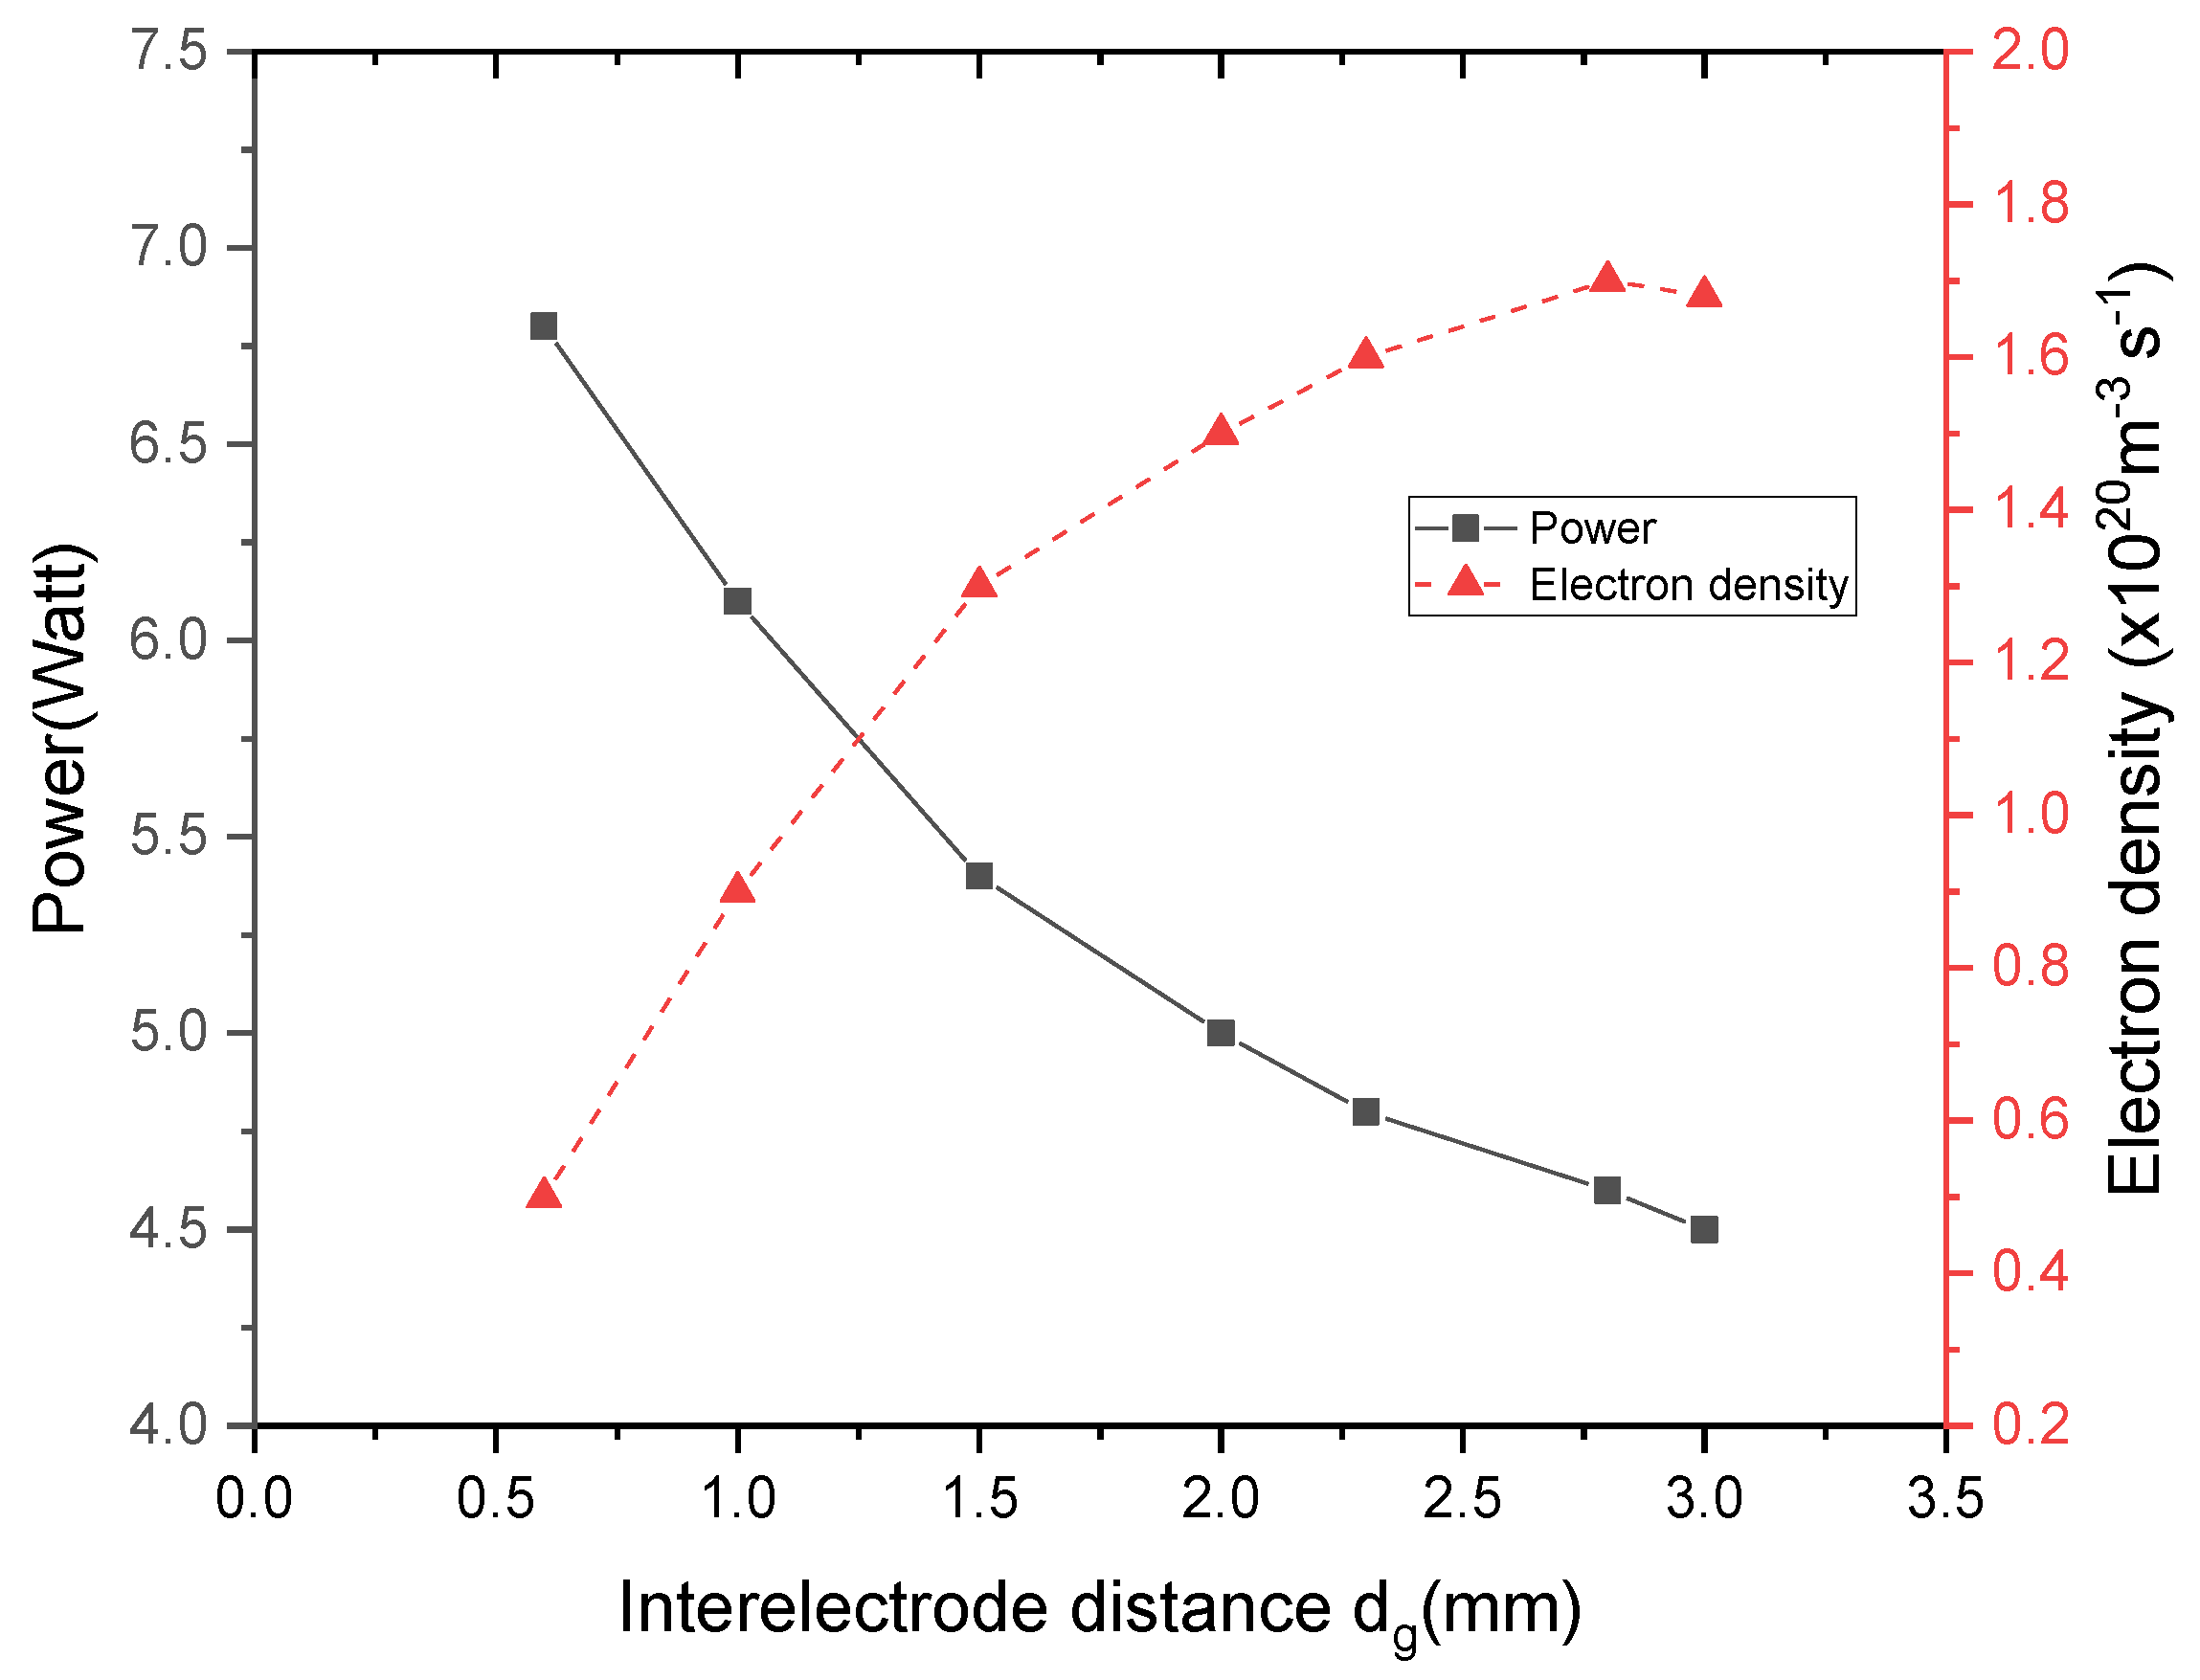
For small interelectrode distance, the breakdown of the gap occurs earlier, thus a wide area of the quasi-neutral plasma bulk is obtained, and a peak value of electron density is achieved.
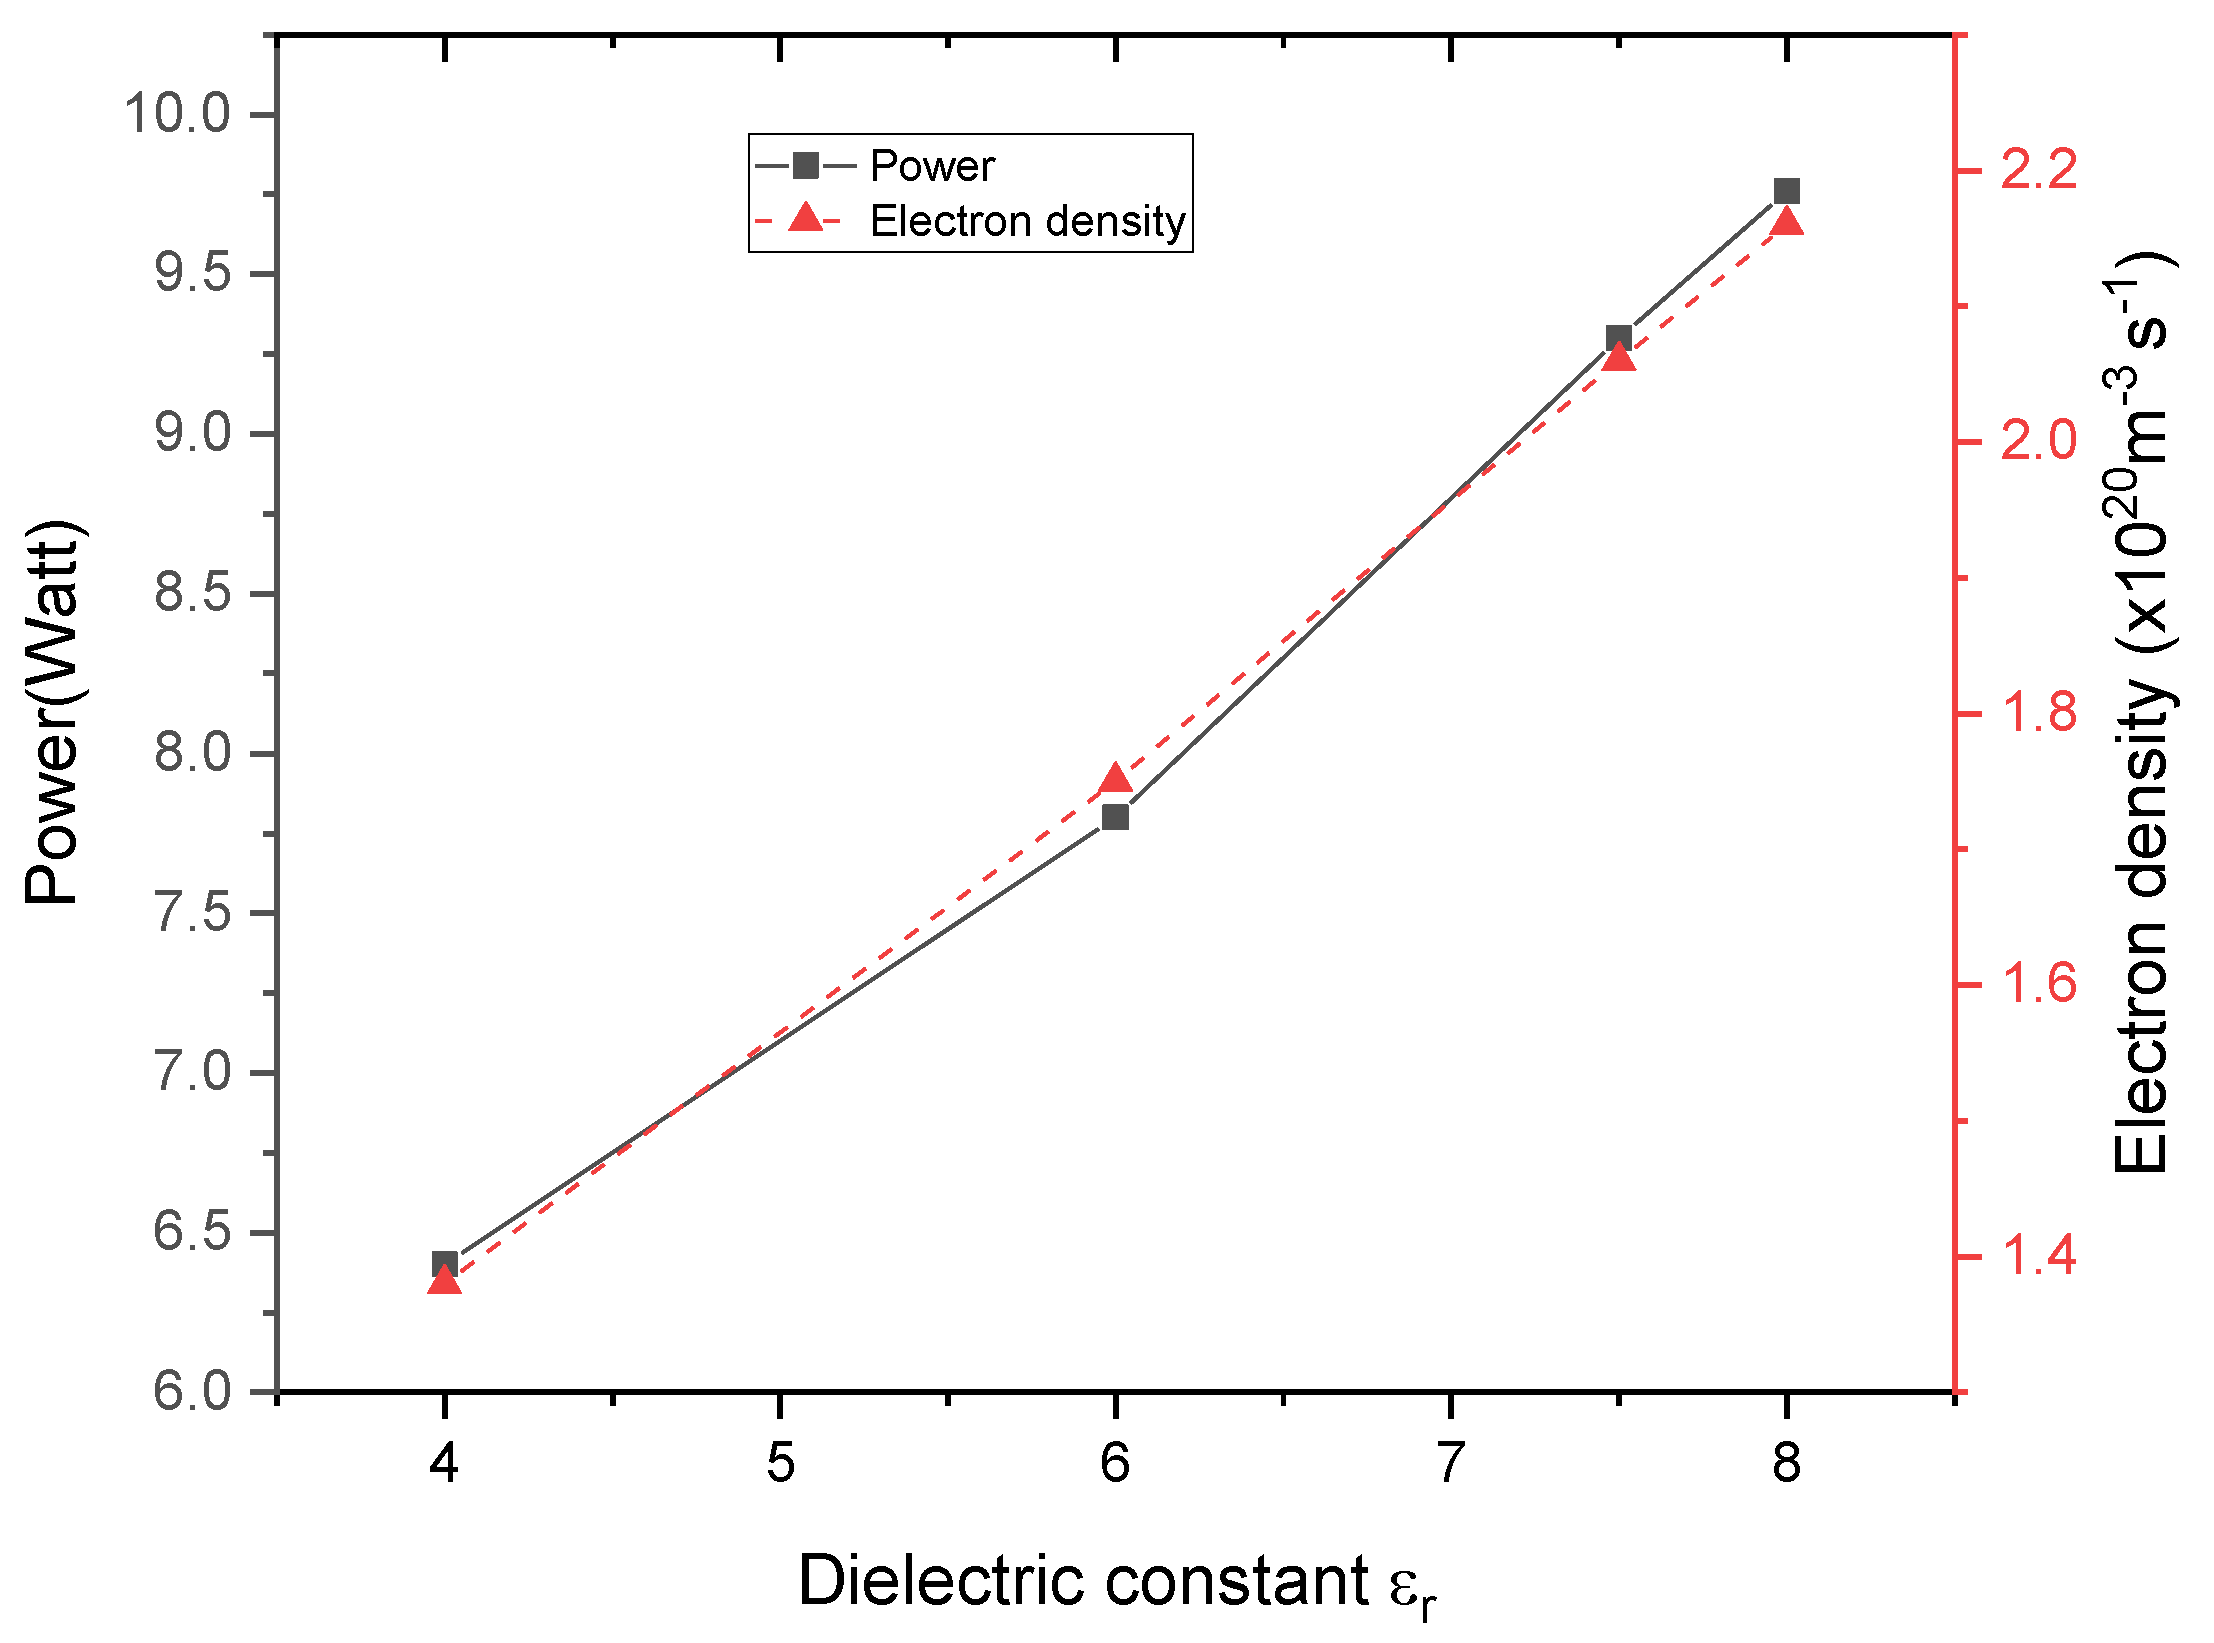
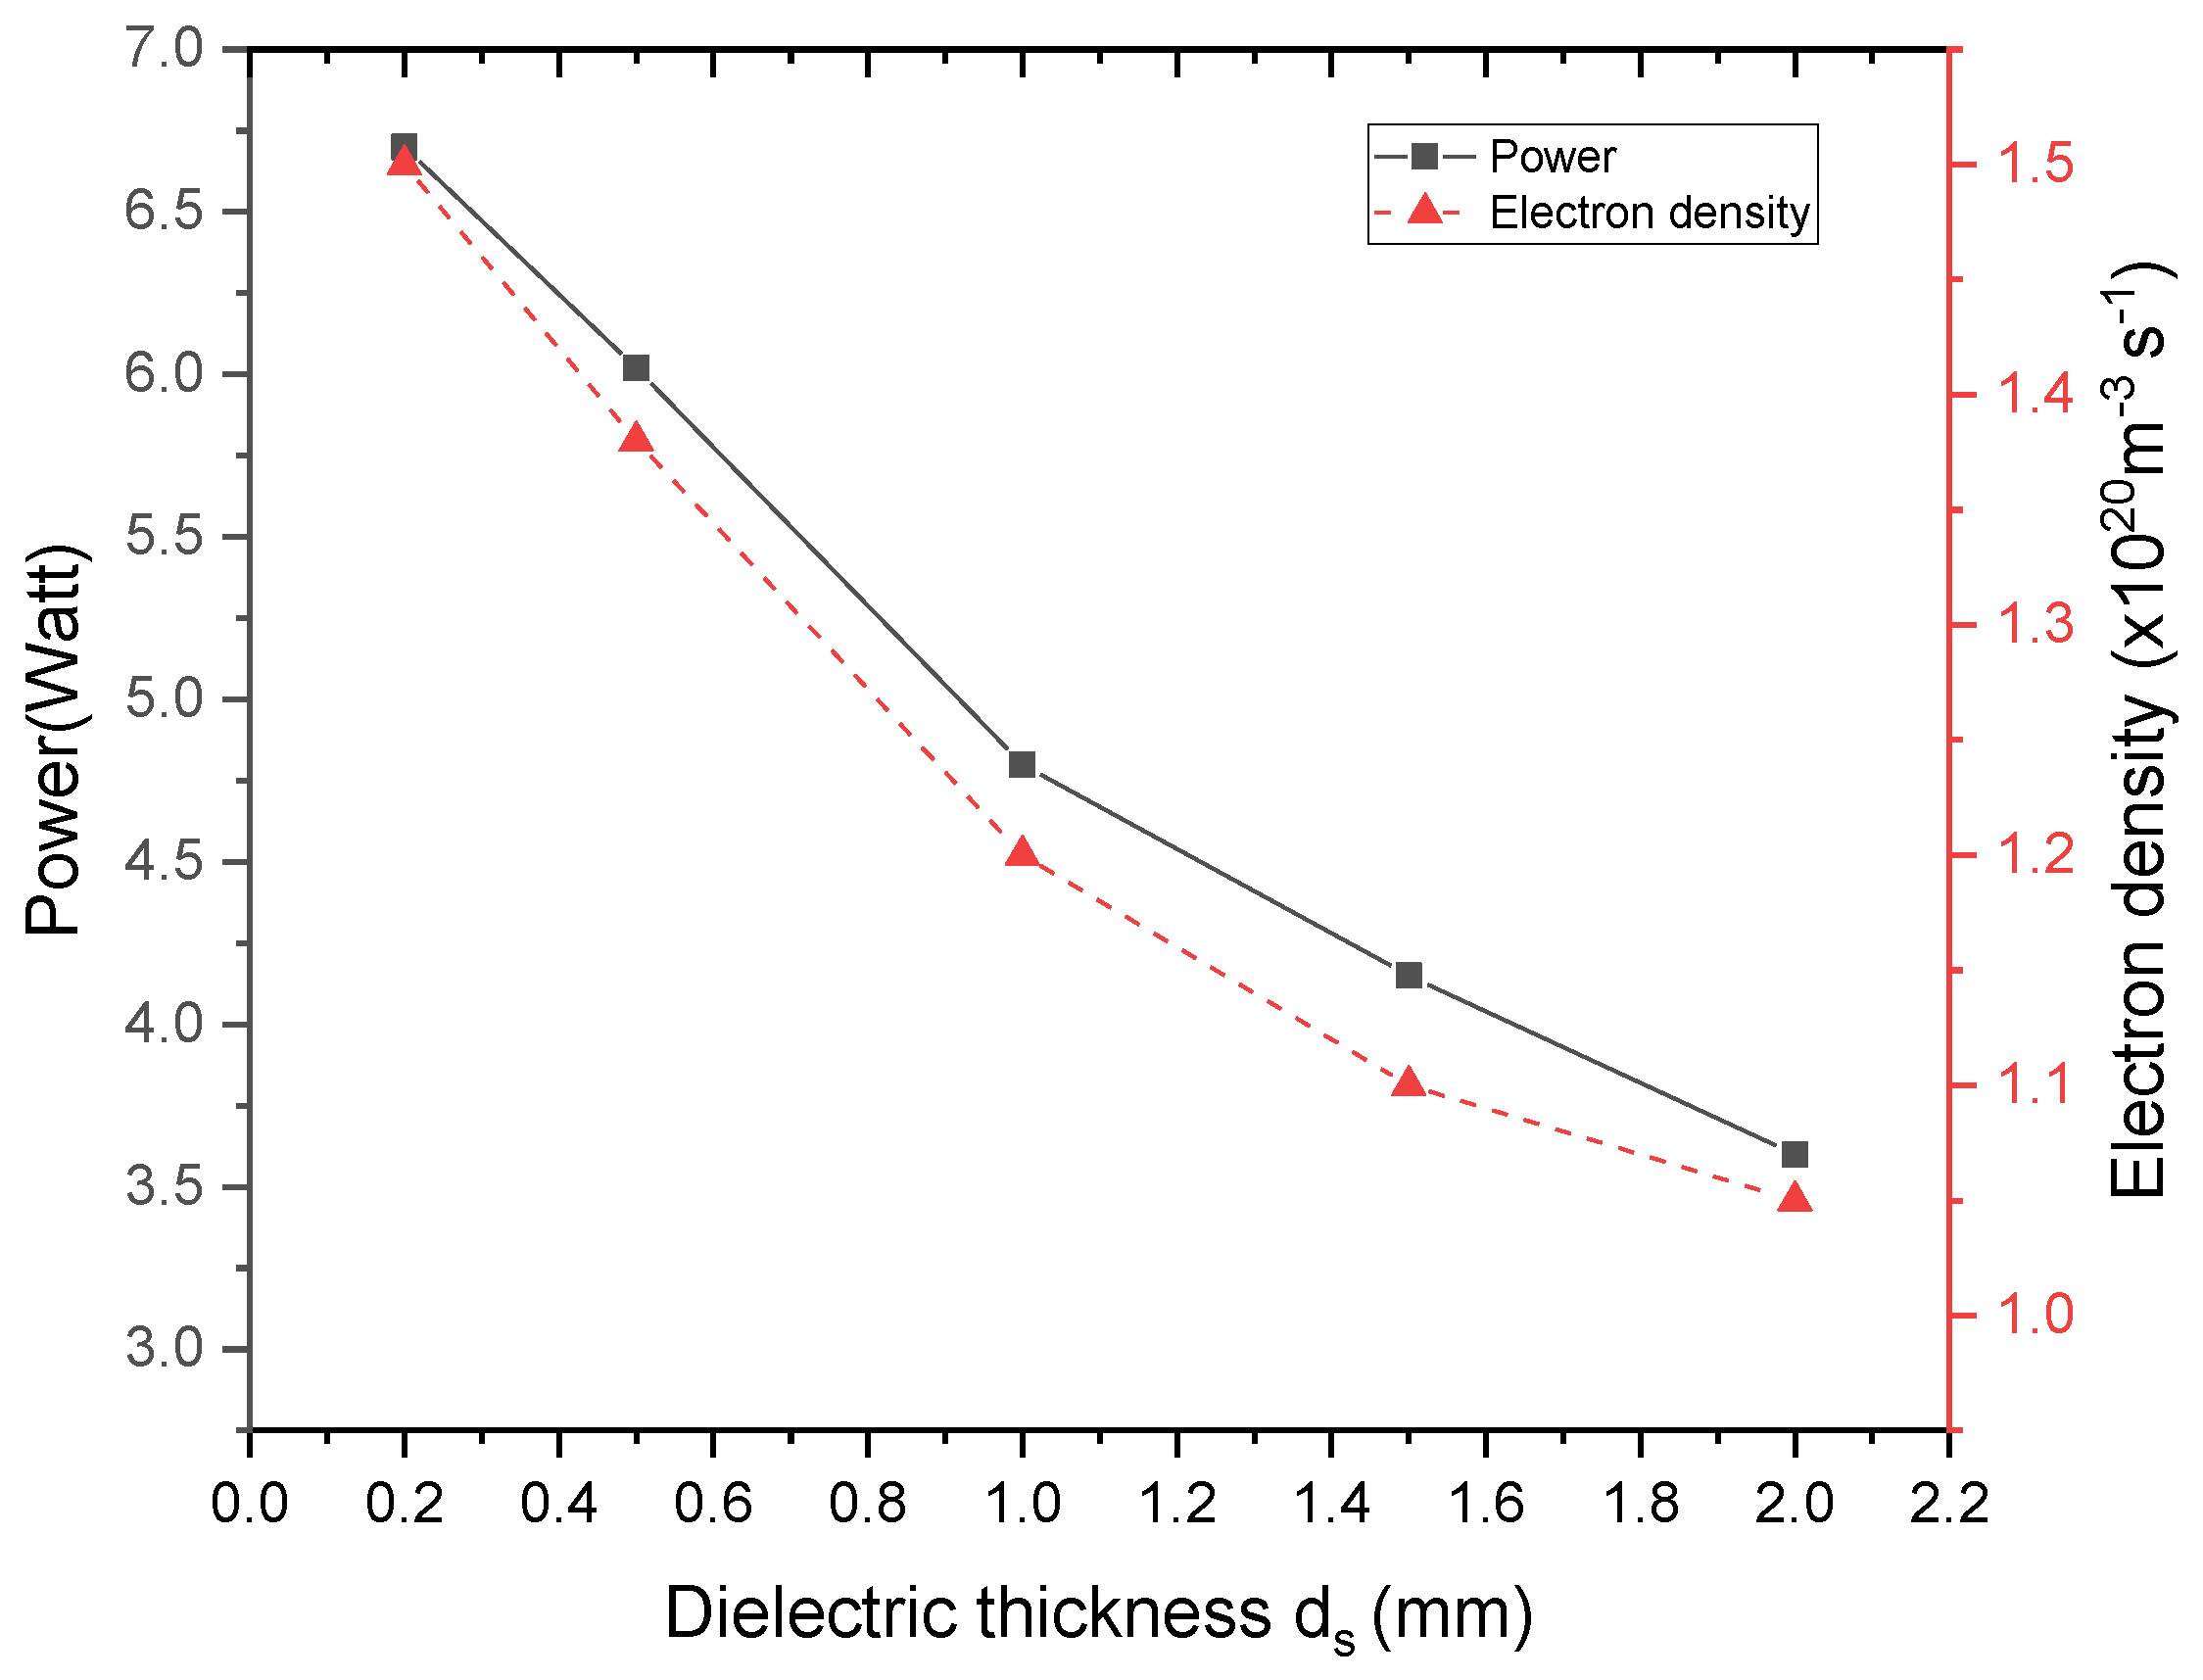
The production of electrons is proportional to the barrier capacity, whereas the influence of the capacity on the dynamics of the discharge is negligible small: when εr decreases or ds increases, or V and Ne decrease, the peak value of electron density nearby the cathode gets smaller.
In conclusion, the optimal pulse duration used for the power supply is approximately 1 µs. In addition, a small interelectrode distance with high electron emission coefficient and a higher dielectric constant with a small dielectric thickness are recommended to achieve a peak value of electron density in order to generate reactive species that are responsible for initiating the apoptosis of tumor cells.

Author Contributions

Conceptualization and methodology K.C. and S.E.; software, validation, formal analysis, investigation, resources, data curation, writing—original draft preparation, and writing—review and editing, S.E.; visualization, supervision, and project administration, K.C. All authors have read and agreed to the published version of the manuscript.

Funding

This research received no external funding.

Institutional Review Board Statement

Not applicable.

Informed Consent Statement

Not applicable.

Data Availability Statement

Data are contained within the article.

Conflicts of Interest

Authors declare that they have no conflict of interest.

References

  1. Aminia, M.; Momeni, M.; Jahandideh, A. Floating Discharge Plasma for Healing of Tendon Injury. High Temp. 2020, 58, 795–799. [Google Scholar] [CrossRef]
  2. Pavelic, B.; Svarc, Z.; Segovic, S.; Bago, I. Cold atmospheric plasma for bleaching endodontically treated tooth: A new clinical approach. Quintessence Int. 2020, 1, 364–371. [Google Scholar] [CrossRef]
  3. Tanaka, H.; Hori, M. Medical applications of non-thermal atmospheric pressure plasma. J. Clin. Biochem. 2017, 60, 29–32. [Google Scholar] [CrossRef] [Green Version]
  4. Friedman, P.C. Cold atmospheric pressure (physical) plasma in dermatology: Where are we today? Int. J. Dermatol. 2020, 59, 1171–1184. [Google Scholar] [CrossRef]
  5. Cheng, X.; Murthy, S.R.K.; Zhuang, T.; Ly, L.; Jones, O.; Basadonna, G.; Keidar, M.; Kanaan, Y.; Canady, J. Canady Helios Cold Plasma Induces Breast Cancer Cell Death by Oxidation of Histone mRNA. Int. J. Mol. Sci. 2021, 22, 9578. [Google Scholar] [CrossRef]
  6. Alimohammadi, M.; Golpour, M.; Sohbatzadeh, F.; Hadavi, S.; Bekeschus, S.; Niaki, H.A.; Valadan, R.; Rafiei, A. Cold Atmospheric Plasma Is a Potent Tool to Improve Chemotherapy in Melanoma In Vitro and In Vivo. Biomolecules 2020, 10, 1011. [Google Scholar] [CrossRef]
  7. Subramanian, P.S.G.; Jain, A.; Shivapuji, A.M.; Sundaresan, N.R.; Dasappa, S.; Rao, L. Plasma-activated water from a dielectric barrier discharge plasma source for the selective treatment of cancer cells. Plasma Process. Polym. 2020, 17, 1900260. [Google Scholar] [CrossRef]
  8. Tian, W.; Kushner, M.J. Atmospheric pressure dielectric barrier discharges interacting with liquid covered tissue. J. Phys. D Appl. Phys. 2014, 47, 165201. [Google Scholar] [CrossRef] [Green Version]
  9. Galmiz, O.; Pavlinak, D.; Zemanek, M.; Brablec, A.; Cernak, M. Study of surface dielectric barrier discharge generated using liquid electrodes in different gases. J. Phys. D Appl. Phys. 2016, 49, 065201. [Google Scholar] [CrossRef]
  10. Song, J.; Tang, J.; Wang, Y.; Wei, L.; Ren, C.; Yu, D. Role of ambient dielectric in propagation of Ar atmospheric pressure nonequilibrium plasma jets. Phys. Plasmas 2015, 22, 050703. [Google Scholar] [CrossRef]
  11. Wang, X.; Yang, Q.; Yao, C.; Zhang, X.; Sun, C. Dielectric Barrier Discharge Characteristics of Multineedle-to-Cylinder Configuration. Energies 2011, 4, 2133–2150. [Google Scholar] [CrossRef] [Green Version]
  12. Fridman, G.; Shereshevsky, A.; Jost, M.M.; Brooks, A.D.; Fridman, A.; Gutsol, A.; Vasilets, V.; Friedman, G. Floating Electrode Dielectric Barrier Discharge Plasma in Air Promoting Apoptotic Behavior in Melanoma Skin Cancer Cell Lines. Plasma Chem. Plasma Process. 2007, 27, 163–176. [Google Scholar] [CrossRef]
  13. Graves, D.B. Low temperature plasma biomedicine: A tutorial review. Phys. Plasma 2014, 21, 080901. [Google Scholar] [CrossRef] [Green Version]
  14. Asimakoulas, L.; Katsafadou, M.; Svarnas, U.P.; Pachis, K.; Kostazos, N.; Gazeli, K.; Mitronikas, E.; Antimisiaris, S.G. Hand-sized dielectric barrier discharge reactor of floating potential electrode for cell model studies. In Proceedings of the ICPIG 32nd Conference, Iasi, Romania, 26–31 July 2015. [Google Scholar]
  15. Fridman, G.; Peddinghaus, M.; Ayan, H.; Fridman, A.; Balasubramanian, M.; Gutsol, A.; Brooks, A.; Friedman, G. Blood Coagulation and Living Tissue Sterilization by Floating-Electrode Dielectric Barrier Discharge in Air. Plasma Chem. Plasma Process. 2006, 26, 425–442. [Google Scholar] [CrossRef]
  16. Judée, F.; Fongia, C.; Ducommun, B.; Yousfi, M.; Lobjois, V.; Merbahi, N. Short and long-time effects of low temperature Plasma Activated Media on 3D multicellular tumor Spheroids. Sci. Rep. 2016, 6, 21421. [Google Scholar] [CrossRef]
  17. Lee, J.H.; Choi, E.H.; Kim, K.M.; Kim, K.N. Effect of non-thermal air atmospheric pressure plasma jet treatment on gingival wound healing. J. Phys. D Appl. Phys. 2016, 49, 075402. [Google Scholar] [CrossRef]
  18. Fridman, G.; Friedman, G.; Gutsol, A.; Shekhter, A.B.; Vasilets, V.N.; Fridman, A. Applied Plasma Medicine. Plasma Process. Polym. 2008, 5, 503–533. [Google Scholar] [CrossRef]
  19. Hu, J.T.; Wang, J.G.; Liu, X.Y.; Liu, D.W.; Lu, X.P.; Shi, J.J.; Ostrikov, K. Effect of a floating electrode on a plasma jet. Phys. Plasmas 2013, 20, 083516. [Google Scholar] [CrossRef] [Green Version]
  20. Zhang, Q.; Zhuang, J.; Woedtke, T.V.; Kolb, J.F.; Weltmann, K.D.; Zhang, J.; Fang, J. Combination of pulsed electric fields and non-thermal plasma jet for more effective bacterial decontamination. In Proceedings of the 2015 IEEE International Conference on Plasma Sciences (ICOPS), Antalya, Turkey, 24–28 May 2015; IEEE: Antalya, Turkey, 2015. [Google Scholar] [CrossRef]
  21. Bekeschus, S.; Lin, A.; Fridman, A.; Wende, K.; Weltmann, K.D.; Miller, V. A Comparison of Floating-Electrode DBD and kINPen Jet: Plasma Parameters to Achieve Similar Growth Reduction in Colon Cancer Cells Under Standardized Conditions. Plasma Chem. Plasma Process. 2018, 38, 1–12. [Google Scholar] [CrossRef]
  22. Adil, B.H.; Al-Shammari, A.M.; Murbat, H.H. Breast cancer treatment using cold atmospheric plasma generated by the FE-DBD scheme. Clin. Plasma Med. 2020, 19, 100103. [Google Scholar] [CrossRef]
  23. Bak, M.S.; Cappelli, M.A. Simulations of nanosecond-pulsed dielectric barrier discharges in atmospheric pressure air. J. Appl. Phys. 2013, 113, 113301. [Google Scholar] [CrossRef]
  24. Komuro, A.; Ono, R.; Oda, T. Effects of pulse voltage rise rate on velocity, diameter and radical production of an atmospheric-pressure streamer discharge. Plasma Sources Sci. Technol. 2013, 22, 045002. [Google Scholar] [CrossRef]
  25. Pan, G.; Tan, Z.; Pan, J.; Wang, X.; Shan, C. A comparative study on the frequency effects of the electrical characteristics of the pulsed dielectric barrier discharge in He/O2 and in Ar/O2 at atmospheric pressure. Phys. Plasma 2016, 23, 043508. [Google Scholar] [CrossRef]
  26. Joo, J. Numerical modelling of floating electrodes in a plasma processing system. Appl. Sci. Converg. Technol. 2015, 24, 102–110. [Google Scholar] [CrossRef] [Green Version]
  27. Viegas, P.; Hofmans, M.; Rooij, O.V.; Obrusnik, A.; Klarenaar, B.L.M.; Bonaventura, Z.; Guaitella, O.; Sobota, A.; Bourdon, A. Interaction of an atmospheric pressure plasma jet with grounded and floating metallic targets: Simulations and experiments. Plasma Sources Sci. Technol. 2020, 29, 095011. [Google Scholar] [CrossRef]
  28. Arserim, E.H.; Salvi, D.; Fridman, G.; Schafner, D.W.; Karwe, M.V. Microbial Inactivation by Non equilibrium Short Pulsed Atmospheric Pressure Dielectric Barrier Discharge (Cold Plasma): Numerical and Experimental Studies. Food Eng. Rev. 2021, 13, 136–147. [Google Scholar] [CrossRef]
  29. Shihab, A.M.; Murbat, H.H.; Hussein, M.U.; Muhamed, S.D. The influence of argon gas flow in the killing of staphylococcus epidermidis bacteria. Iraqi J. Phys. 2018, 16, 134–139. [Google Scholar] [CrossRef]
  30. Cooper, M.; Fridman, G.; Fridman, A.; Joshi, S.G. Biological responses of bacillus stratosphericus to floating electrode- dielectric barrier discharge plasma treatment. J. Appl. Microbiol. 2010, 109, 2039–2048. [Google Scholar] [CrossRef] [PubMed]
  31. Bafoil, M.; Ru, A.; Merbahi, N.; Eichwald, O.; Dunand, C.; Yousfi, M. New insights of low-temperature plasma effects on germination of three genotypes of Arabidopsis thaliana seeds under osmotic and saline stresses. Sci. Rep. 2019, 9, 8649. [Google Scholar] [CrossRef] [Green Version]
  32. Sharma, N.K.; Misra, S.; Varun, D.; Pal, U.N. Experimental and simulation analysis of dielectric barrier discharge based pulsed cold atmospheric pressure plasma jet. Phys. Plasmas 2020, 27, 113502. [Google Scholar] [CrossRef]
  33. COMSOL. Multiphysics V5.4. Plasma Module, User’s Guide; COMSOL AB: Stockholm, Sweden, 2019. [Google Scholar]
  34. Hagelaar, G.J.M.; Pitchford, L.C. Solving the Boltzmann equation to obtain electron transport coefficients and rate coefficients for fluid models. Plasma Sources Sci. Technol. 2005, 14, 722–733. [Google Scholar] [CrossRef]
  35. Dickinson, E.J.F.; Ekstrom, H.; Fontes, E. COMSOL Multiphysics®: Finite element software for electrochemical analysis. A mini review. Electrochem. Commun. 2014, 40, 71–74. [Google Scholar] [CrossRef]
  36. Mohamed, A.A.H.; Aljuhani, M.M.; Almarashi, J.Q.M.; Alhazime, A.A. The effect of a second grounded electrode on the atmospheric pressure argon plasma jet. Plasma Res. Express 2020, 2, 015011. [Google Scholar] [CrossRef]
  37. Guedah, H.; Abahazem, A.; Merbahi, N.; Yousfi, M.; Saber, K.; Ihlal, A. Experimental Investigation of Effects of Electric Operating Parameters on Pulsed Corona Discharges in Humid Air at Atmospheric Pressure. J. Anal. Sci. Methods Instrum. 2018, 8, 49–64. [Google Scholar] [CrossRef] [Green Version]
  38. Judée, F.; Merbahi, N.; Wattieaux, G.; Yousfi, M. Analysis of Ar plasma jets induced by single and double dielectric barrier discharges at atmospheric pressure. J. Appl. Phys. 2016, 120, 114901. [Google Scholar] [CrossRef]
  39. Yurgelenas, Y.V.; Wagner, H.E. A computational model of a barrier discharge in air at atmospheric pressure: The role of residual surface charges in micro discharges formation. J. Phys. D Appl. Phys. 2006, 39, 4031–4043. [Google Scholar] [CrossRef] [Green Version]
  40. Steinle, G.; Neundorf, D.; Hiller, W.; Pietralla, M. Two-dimensional simulation of filaments in barrier discharges. J. Phys. D Appl. Phys. 1999, 32, 1350–1356. [Google Scholar] [CrossRef] [Green Version]
  41. Abahazem, A.; Merbahi, N.; Guedah, H.; Yousfi, M. Electric and Spectroscopic Studies of Pulsed Corona Discharges in Nitrogen at Atmospheric Pressure. J. Anal. Sci. Methods Instrum. 2017, 7, 57–74. [Google Scholar] [CrossRef] [Green Version]
  42. Qian, M.; Ren, C.; Wang, D.; Zhang, J.; Wei, G. Stark broadening measurement of the electron density in an atmospheric pressure argon plasma jet with double-power electrodes. J. Appl. Phys. 2010, 107, 063303. [Google Scholar] [CrossRef]
  43. Xiong, Q.; Nikiforov, A.Y.; Gonzalez, M.A.; Leys, C.; Lu, X.P. Characterization of an atmospheric helium plasma jet by relative and absolute optical emission spectroscopy. Plasma Sources Sci. Technol. 2013, 22, 015011. [Google Scholar] [CrossRef]
  44. Chen, B.; Tan, Z.; Song, X. Effects of the Operating Conditions on the Electrical Characteristics of Pulse Discharges in Atmospheric-Pressure Pure Helium. IEEE Trans. Plasma Sci. 2012, 40, 1103–1109. [Google Scholar] [CrossRef]
  45. Braný, D.; Dvorská, D.; Halašová, E.; Škovierová, H. Cold Atmospheric Plasma: A Powerful Tool for Modern Medicine. Int. J. Mol. Sci. 2020, 21, 2932. [Google Scholar] [CrossRef] [PubMed] [Green Version]
  46. Tanaka, H.; Mizuno, M.; Ishikawa, K.; Kondo, H.; Takeda, K.; Hashizume, H.; Nakamura, K.; Utsumi, F.; Kajiyama, H.; Kano, H.; et al. Plasma with high electron density and plasma-activated medium for cancer treatment. Clin. Plasma Med. 2015, 3, 72–76. [Google Scholar] [CrossRef]
Figure 1. (a) Photograph of the plasma device of floating electrode dielectric barrier discharge (FE-DBD) and (b) schematic sectional representation of the FE-DBD treatment electrode operating with argon.
Coatings 11 01405 g001
Figure 2. Computational domain of simulation.
Coatings 11 01405 g002
Figure 3. Typical waveforms of the applied voltage and the anode current measurement of the FE-DBD argon plasma supplied at a frequency of 10 kHz, pulse duration 1 µs, and an applied voltage of 10 kV.
Coatings 11 01405 g003
Figure 4. Distribution of electron density between the electrodes of the FE-DBD argon plasma for different instants of pulse discharge supplied at an applied voltage of 10 kV, a frequency of 10 kHz, and pulse duration 1 µs: (a) voltage rising edge (t = 225 ns, 250 ns, 305 ns, 400 ns, 500 ns, 700 ns, 800 ns, 1000 ns, and 1100 ns) and (b) voltage falling edge (t = 1280 ns, 1305 ns, 1330 ns, 1355 ns, 1400 ns, 1500 ns, 1600 ns, 1700 ns, and 1800 ns).
Coatings 11 01405 g004aCoatings 11 01405 g004b
Figure 5. Space charge between the electrodes of the FE-DBD argon plasma for different instants of the rising edge of pulse discharge supplied at an applied voltage of 10 kV, a frequency of 10 kHz, and pulse duration 1 µs (t = 305 ns, 400 ns, 500 ns, 800 ns, 1000 ns, and 1100 ns).
Coatings 11 01405 g005
Figure 6. Electric field strength distribution between the electrodes of the FE-DBD argon plasma for different instants of the rising edge of pulse discharge supplied at an applied voltage of 10 kV, a frequency of 10 kHz, and pulse duration 1 µs (t = 305 ns, 400 ns, 500 ns, 800 ns, 1000 ns, and 1100 ns).
Coatings 11 01405 g006
Figure 7. Evolution of electric power consumption and electron number density with different pulse duration. Voltage magnitude of 10 kV, pulse duration of 1 µs with repetition rate of 10 kHz.
Coatings 11 01405 g007
Figure 8. Evolution of the electron density and the electric power consumption with different pulse duration. Voltage magnitude of 10 kV, pulse duration of 1 µs with repetition rate of 10 kHz.
Coatings 11 01405 g008
Figure 9. Evolution of electron number density Ne and consumed power P with different secondary emission coefficients.
Coatings 11 01405 g009
Figure 10. Evolution of electron number density Ne and consumed power P with different interelectrode distance dg.
Coatings 11 01405 g010
Figure 11. Evolution of electron number density Ne and consumed power P with different εr.
Coatings 11 01405 g011
Figure 12. Evolution of electron number density Ne and consumed power P with different dielectric thickness ds.
Coatings 11 01405 g012
Table 1. Reactions induced in the model along with their rate coefficients.
R. NoFormulaRate CoefficientRef
1e + Ar → e + ArBoltzmann equation[32]
2e + Ar → e + ArsBoltzmann equation[32]
3e + Ars → e + ArBoltzmann equation[32]
4e + Ar → 2e + Ar+Boltzmann equation[32]
5e + Ars → 2e + Ar+Boltzmann equation[32]
6Ars + Ars → e + Ar + Ar+5 × 10⁻¹⁰ cm3 s−1[33]
7Ars + Ar → Ar + Ar3 × 10−15 cm3 s−1[33]
8Ar+ + 2Ar → Ar2+ + Ar2.5 × 10−31 cm3 s−1[33]
9e + Ar2+ → 2Ars5.4 × 10−8 Te0.66 cm3 s−1[33]
102e + Ar+ → Ars + e5 × 10−27 Te4.5 cm6 s−1[33]
11Ar2 + Ar → 3Ar10−14 cm3 s−1[33]
12Ars + 2Ar → Ar2 + Ar10−31 cm6 s−1[33]
Table 2. Surface reactions.
R. NoFormulaSticking Coefficient
1Ars ⇒ Ar1
2Ar+ ⇒ Ar1
Publisher’s Note: MDPI stays neutral with regard to jurisdictional claims in published maps and institutional affiliations.

